Carmi, IL Map & Demographics
Carmi Map
Carmi Overview
$28,910
PER CAPITA INCOME
$69,375
AVG FAMILY INCOME
$50,116
AVG HOUSEHOLD INCOME
19.5%
WAGE / INCOME GAP [ % ]
80.5¢/ $1
WAGE / INCOME GAP [ $ ]
0.46
INEQUALITY / GINI INDEX
5,042
TOTAL POPULATION
2,477
MALE POPULATION
2,565
FEMALE POPULATION
96.57
MALES / 100 FEMALES
103.55
FEMALES / 100 MALES
44.7
MEDIAN AGE
3.0
AVG FAMILY SIZE
2.2
AVG HOUSEHOLD SIZE
2,082
LABOR FORCE [ PEOPLE ]
50.7%
PERCENT IN LABOR FORCE
1.9%
UNEMPLOYMENT RATE
Carmi Zip Codes
Carmi Area Codes
Income in Carmi
Income Overview in Carmi
Per Capita Income in Carmi is $28,910, while median incomes of families and households are $69,375 and $50,116 respectively.
| Characteristic | Number | Measure |
| Per Capita Income | 5,042 | $28,910 |
| Median Family Income | 1,159 | $69,375 |
| Mean Family Income | 1,159 | $84,793 |
| Median Household Income | 2,170 | $50,116 |
| Mean Household Income | 2,170 | $64,360 |
| Income Deficit | 1,159 | $0 |
| Wage / Income Gap (%) | 5,042 | 19.54% |
| Wage / Income Gap ($) | 5,042 | 80.46¢ per $1 |
| Gini / Inequality Index | 5,042 | 0.46 |
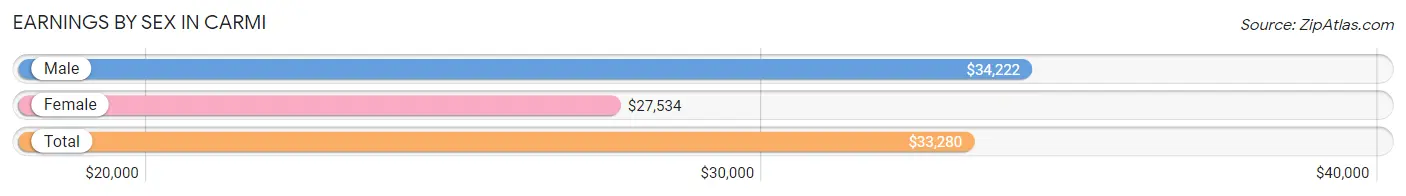
Earnings by Sex in Carmi
Average Earnings in Carmi are $33,280, $34,222 for men and $27,534 for women, a difference of 19.5%.
| Sex | Number | Average Earnings |
| Male | 1,197 (54.2%) | $34,222 |
| Female | 1,011 (45.8%) | $27,534 |
| Total | 2,208 (100.0%) | $33,280 |
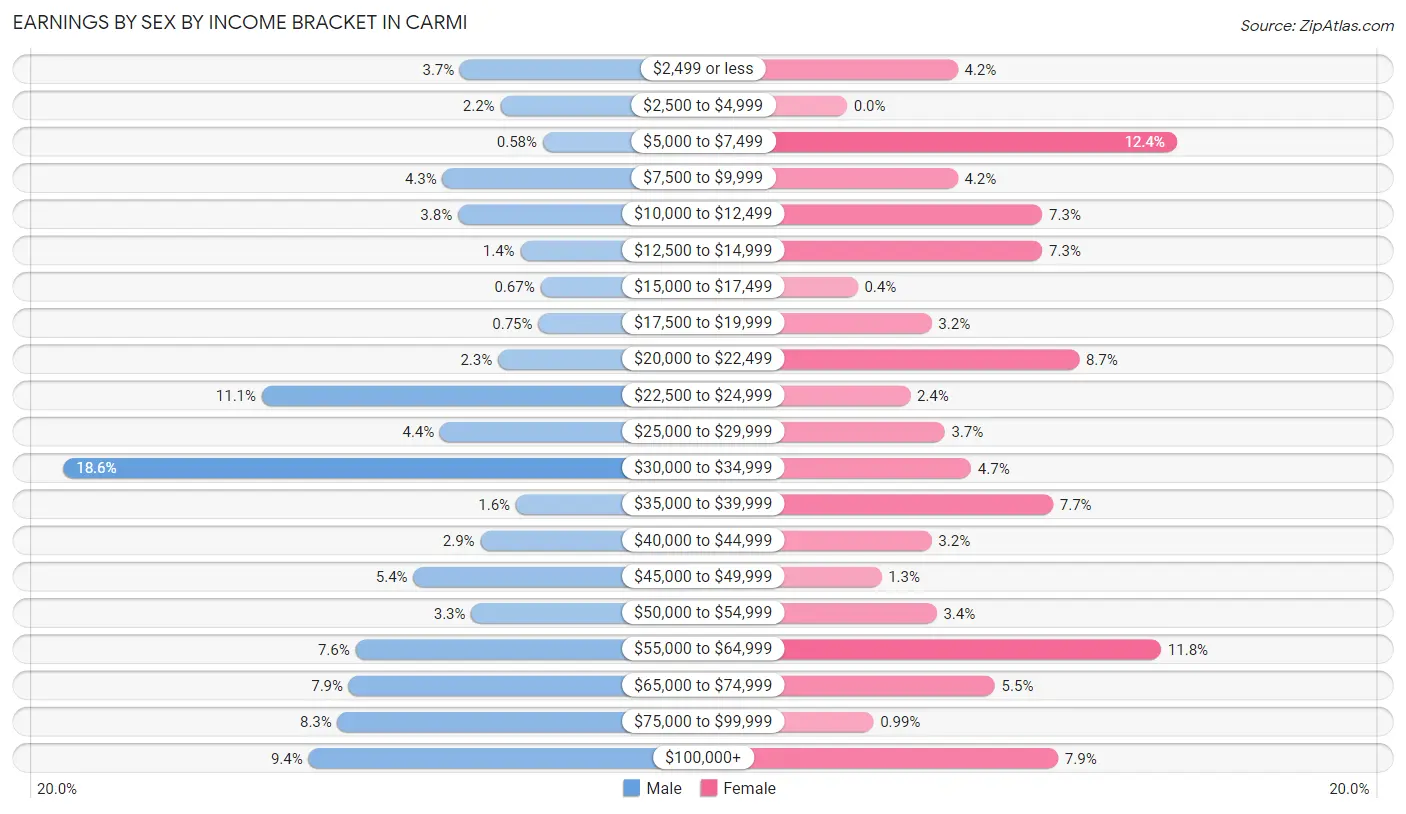
Earnings by Sex by Income Bracket in Carmi
The most common earnings brackets in Carmi are $30,000 to $34,999 for men (222 | 18.5%) and $5,000 to $7,499 for women (125 | 12.4%).
| Income | Male | Female |
| $2,499 or less | 44 (3.7%) | 42 (4.2%) |
| $2,500 to $4,999 | 26 (2.2%) | 0 (0.0%) |
| $5,000 to $7,499 | 7 (0.6%) | 125 (12.4%) |
| $7,500 to $9,999 | 52 (4.3%) | 42 (4.2%) |
| $10,000 to $12,499 | 45 (3.8%) | 74 (7.3%) |
| $12,500 to $14,999 | 17 (1.4%) | 74 (7.3%) |
| $15,000 to $17,499 | 8 (0.7%) | 4 (0.4%) |
| $17,500 to $19,999 | 9 (0.7%) | 32 (3.2%) |
| $20,000 to $22,499 | 27 (2.3%) | 88 (8.7%) |
| $22,500 to $24,999 | 133 (11.1%) | 24 (2.4%) |
| $25,000 to $29,999 | 53 (4.4%) | 37 (3.7%) |
| $30,000 to $34,999 | 222 (18.5%) | 47 (4.6%) |
| $35,000 to $39,999 | 19 (1.6%) | 78 (7.7%) |
| $40,000 to $44,999 | 35 (2.9%) | 32 (3.2%) |
| $45,000 to $49,999 | 65 (5.4%) | 13 (1.3%) |
| $50,000 to $54,999 | 39 (3.3%) | 34 (3.4%) |
| $55,000 to $64,999 | 91 (7.6%) | 119 (11.8%) |
| $65,000 to $74,999 | 94 (7.9%) | 56 (5.5%) |
| $75,000 to $99,999 | 99 (8.3%) | 10 (1.0%) |
| $100,000+ | 112 (9.4%) | 80 (7.9%) |
| Total | 1,197 (100.0%) | 1,011 (100.0%) |
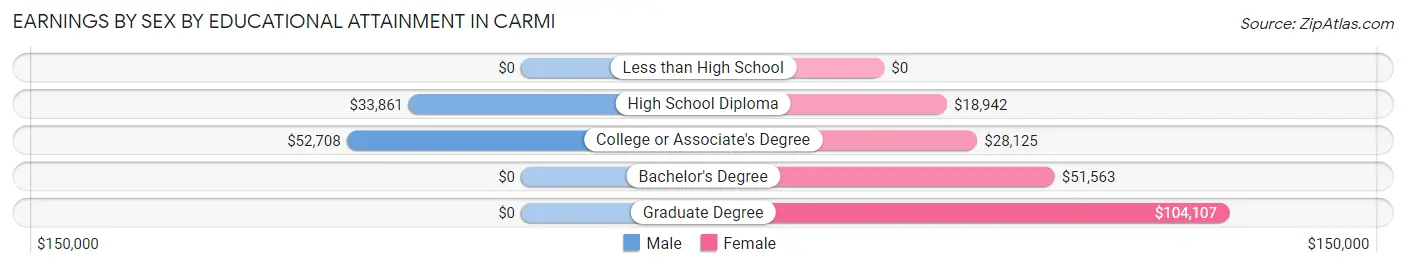
Earnings by Sex by Educational Attainment in Carmi
Average earnings in Carmi are $40,260 for men and $29,358 for women, a difference of 27.1%. Men with an educational attainment of college or associate's degree enjoy the highest average annual earnings of $52,708, while those with high school diploma education earn the least with $33,861. Women with an educational attainment of graduate degree earn the most with the average annual earnings of $104,107, while those with high school diploma education have the smallest earnings of $18,942.
| Educational Attainment | Male Income | Female Income |
| Less than High School | - | - |
| High School Diploma | $33,861 | $18,942 |
| College or Associate's Degree | $52,708 | $28,125 |
| Bachelor's Degree | - | - |
| Graduate Degree | - | - |
| Total | $40,260 | $29,358 |
Family Income in Carmi
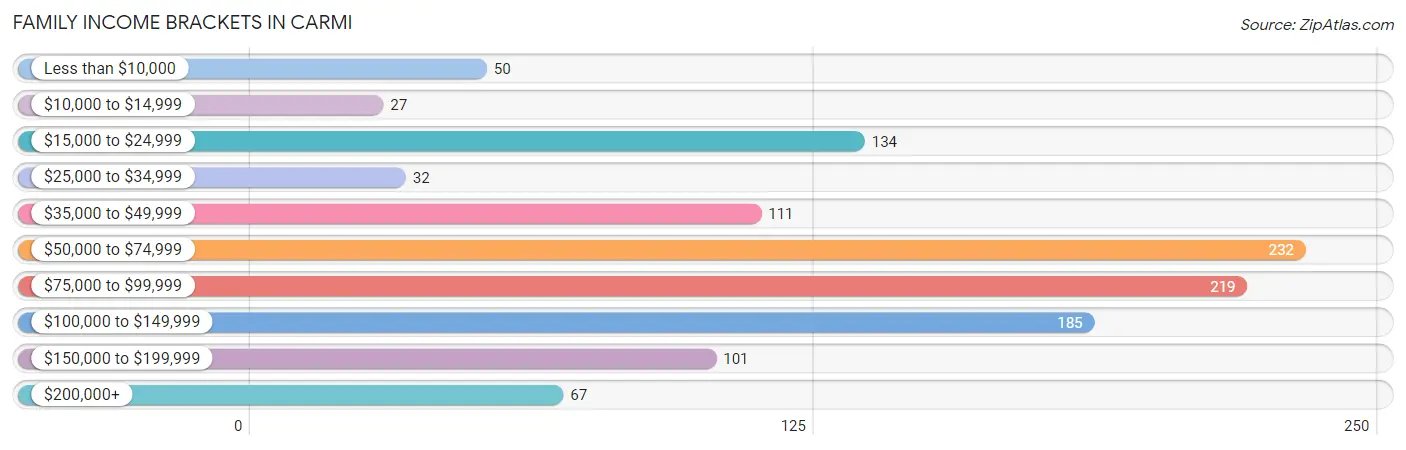
Family Income Brackets in Carmi
According to the Carmi family income data, there are 232 families falling into the $50,000 to $74,999 income range, which is the most common income bracket and makes up 20.0% of all families. Conversely, the $10,000 to $14,999 income bracket is the least frequent group with only 27 families (2.3%) belonging to this category.
| Income Bracket | # Families | % Families |
| Less than $10,000 | 50 | 4.3% |
| $10,000 to $14,999 | 27 | 2.3% |
| $15,000 to $24,999 | 134 | 11.6% |
| $25,000 to $34,999 | 32 | 2.8% |
| $35,000 to $49,999 | 111 | 9.6% |
| $50,000 to $74,999 | 232 | 20.0% |
| $75,000 to $99,999 | 219 | 18.9% |
| $100,000 to $149,999 | 185 | 16.0% |
| $150,000 to $199,999 | 101 | 8.7% |
| $200,000+ | 67 | 5.8% |
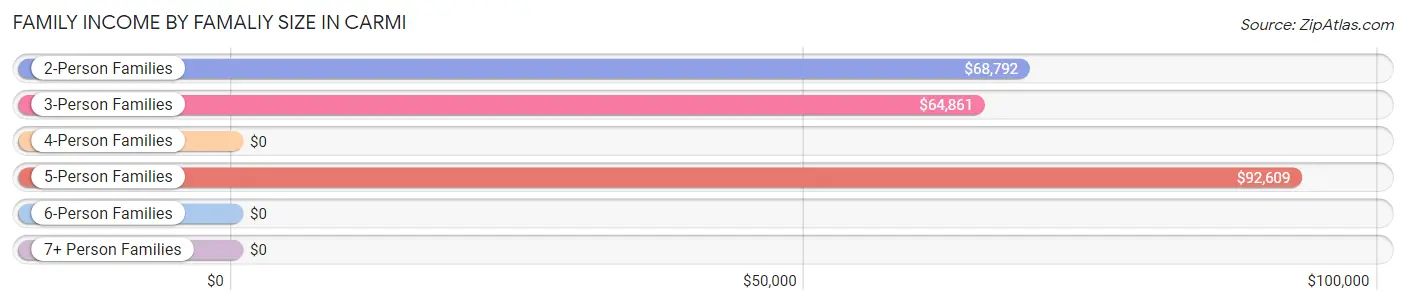
Family Income by Famaliy Size in Carmi
5-person families (60 | 5.2%) account for the highest median family income in Carmi with $92,609 per family, while 2-person families (683 | 58.9%) have the highest median income of $34,396 per family member.
| Income Bracket | # Families | Median Income |
| 2-Person Families | 683 (58.9%) | $68,792 |
| 3-Person Families | 256 (22.1%) | $64,861 |
| 4-Person Families | 92 (7.9%) | $0 |
| 5-Person Families | 60 (5.2%) | $92,609 |
| 6-Person Families | 68 (5.9%) | $0 |
| 7+ Person Families | 0 (0.0%) | $0 |
| Total | 1,159 (100.0%) | $69,375 |
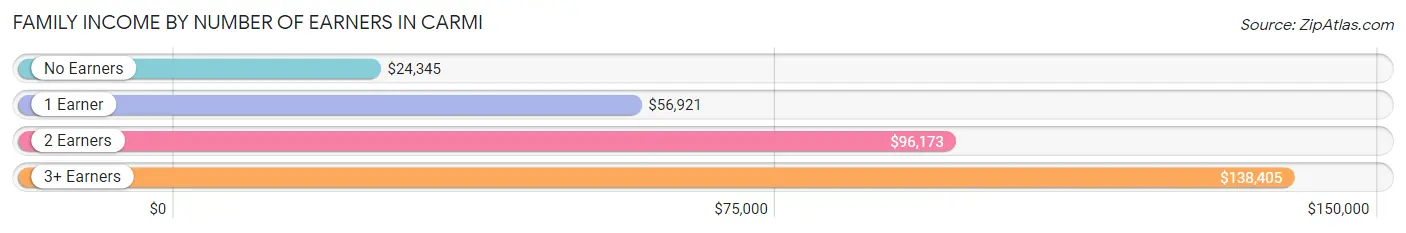
Family Income by Number of Earners in Carmi
The median family income in Carmi is $69,375, with families comprising 3+ earners (67) having the highest median family income of $138,405, while families with no earners (243) have the lowest median family income of $24,345, accounting for 5.8% and 21.0% of families, respectively.
| Number of Earners | # Families | Median Income |
| No Earners | 243 (21.0%) | $24,345 |
| 1 Earner | 399 (34.4%) | $56,921 |
| 2 Earners | 450 (38.8%) | $96,173 |
| 3+ Earners | 67 (5.8%) | $138,405 |
| Total | 1,159 (100.0%) | $69,375 |
Household Income in Carmi
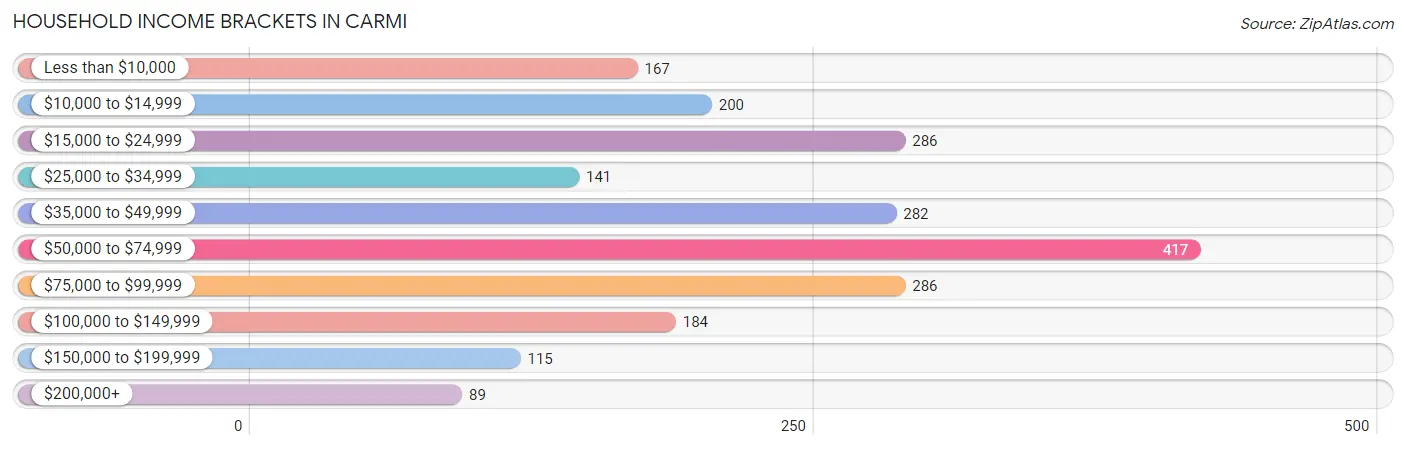
Household Income Brackets in Carmi
With 417 households falling in the category, the $50,000 to $74,999 income range is the most frequent in Carmi, accounting for 19.2% of all households. In contrast, only 89 households (4.1%) fall into the $200,000+ income bracket, making it the least populous group.
| Income Bracket | # Households | % Households |
| Less than $10,000 | 167 | 7.7% |
| $10,000 to $14,999 | 200 | 9.2% |
| $15,000 to $24,999 | 286 | 13.2% |
| $25,000 to $34,999 | 141 | 6.5% |
| $35,000 to $49,999 | 282 | 13.0% |
| $50,000 to $74,999 | 417 | 19.2% |
| $75,000 to $99,999 | 286 | 13.2% |
| $100,000 to $149,999 | 184 | 8.5% |
| $150,000 to $199,999 | 115 | 5.3% |
| $200,000+ | 89 | 4.1% |
Household Income by Householder Age in Carmi
The median household income in Carmi is $50,116, with the highest median household income of $52,321 found in the 25 to 44 years age bracket for the primary householder. A total of 656 households (30.2%) fall into this category. Meanwhile, the 15 to 24 years age bracket for the primary householder has the lowest median household income of $0, with 79 households (3.6%) in this group.
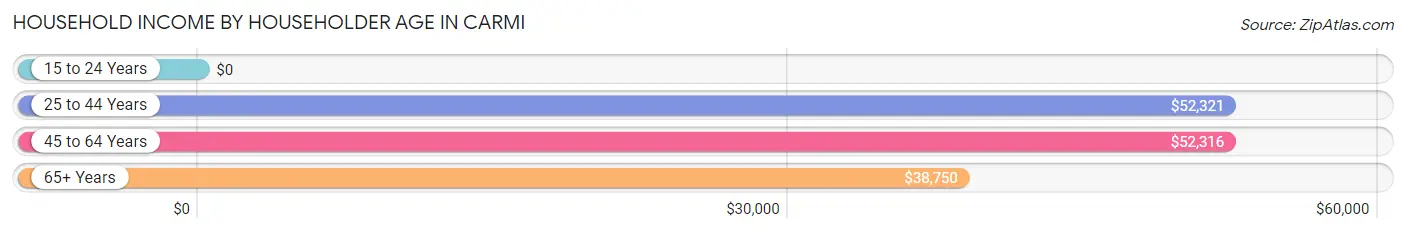
| Income Bracket | # Households | Median Income |
| 15 to 24 Years | 79 (3.6%) | $0 |
| 25 to 44 Years | 656 (30.2%) | $52,321 |
| 45 to 64 Years | 687 (31.7%) | $52,316 |
| 65+ Years | 748 (34.5%) | $38,750 |
| Total | 2,170 (100.0%) | $50,116 |
Poverty in Carmi
Income Below Poverty by Sex and Age in Carmi
With 18.8% poverty level for males and 21.2% for females among the residents of Carmi, 18 to 24 year old males and 15 year old females are the most vulnerable to poverty, with 97 males (48.7%) and 27 females (100.0%) in their respective age groups living below the poverty level.
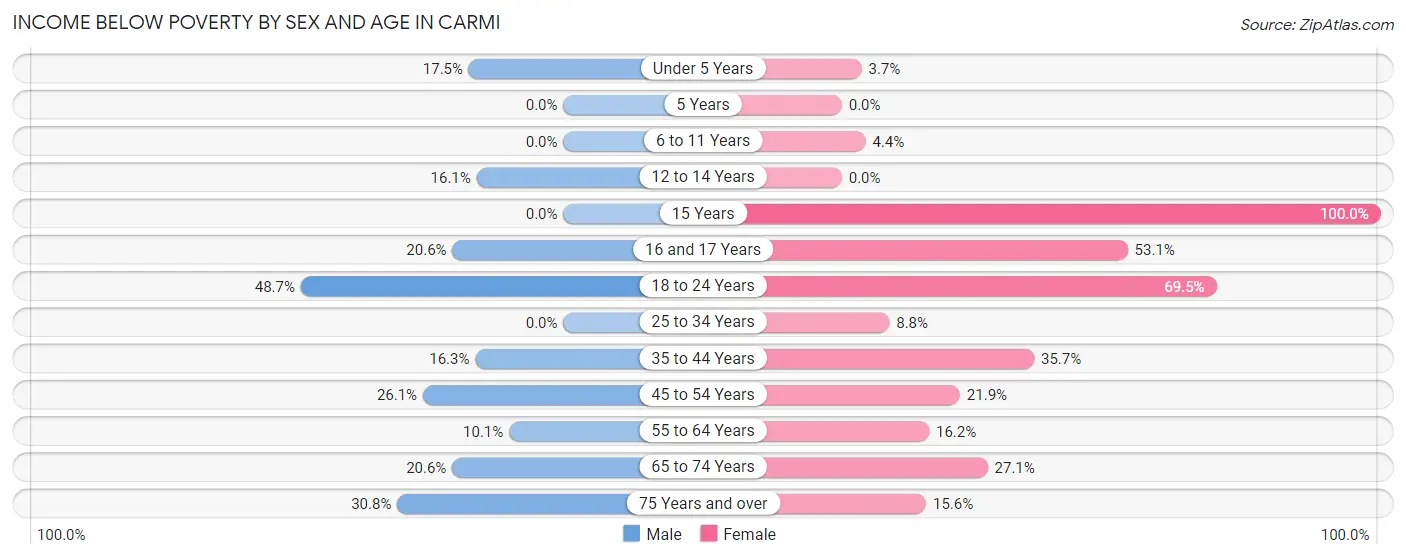
| Age Bracket | Male | Female |
| Under 5 Years | 30 (17.5%) | 6 (3.7%) |
| 5 Years | 0 (0.0%) | 0 (0.0%) |
| 6 to 11 Years | 0 (0.0%) | 7 (4.4%) |
| 12 to 14 Years | 19 (16.1%) | 0 (0.0%) |
| 15 Years | 0 (0.0%) | 27 (100.0%) |
| 16 and 17 Years | 7 (20.6%) | 26 (53.1%) |
| 18 to 24 Years | 97 (48.7%) | 89 (69.5%) |
| 25 to 34 Years | 0 (0.0%) | 32 (8.8%) |
| 35 to 44 Years | 58 (16.3%) | 71 (35.7%) |
| 45 to 54 Years | 80 (26.1%) | 57 (21.9%) |
| 55 to 64 Years | 30 (10.1%) | 68 (16.2%) |
| 65 to 74 Years | 46 (20.6%) | 72 (27.1%) |
| 75 Years and over | 74 (30.8%) | 43 (15.6%) |
| Total | 441 (18.8%) | 498 (21.2%) |
Income Above Poverty by Sex and Age in Carmi
According to the poverty statistics in Carmi, males aged 6 to 11 years and females aged 12 to 14 years are the age groups that are most secure financially, with 100.0% of males and 100.0% of females in these age groups living above the poverty line.
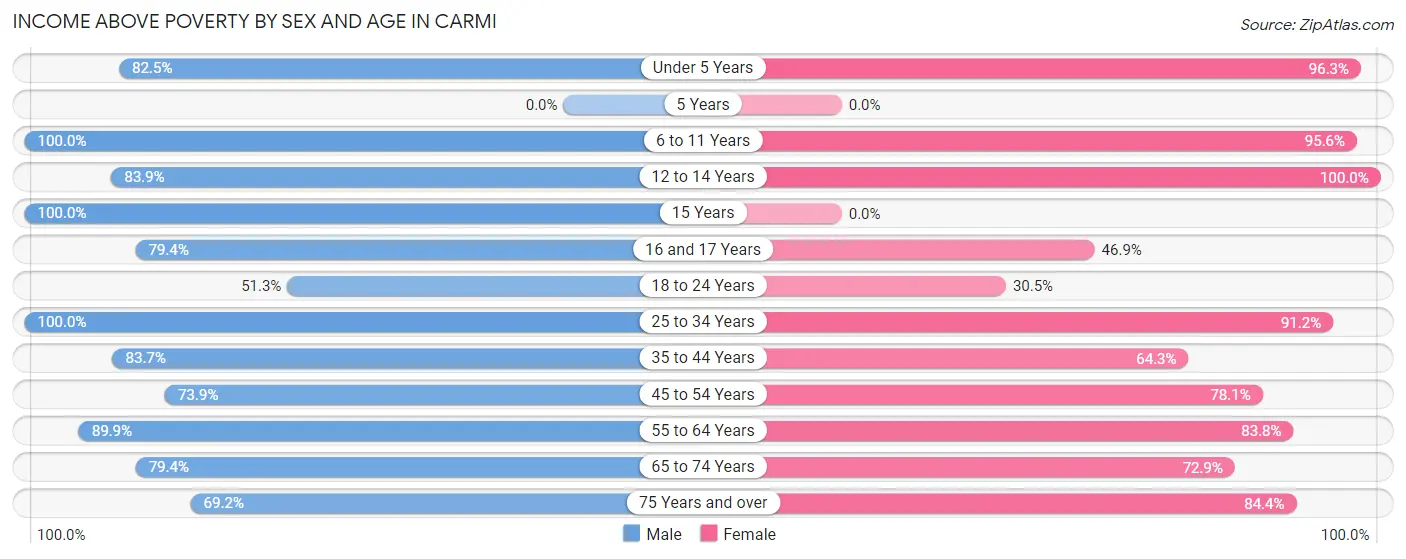
| Age Bracket | Male | Female |
| Under 5 Years | 141 (82.5%) | 158 (96.3%) |
| 5 Years | 0 (0.0%) | 0 (0.0%) |
| 6 to 11 Years | 136 (100.0%) | 152 (95.6%) |
| 12 to 14 Years | 99 (83.9%) | 44 (100.0%) |
| 15 Years | 8 (100.0%) | 0 (0.0%) |
| 16 and 17 Years | 27 (79.4%) | 23 (46.9%) |
| 18 to 24 Years | 102 (51.3%) | 39 (30.5%) |
| 25 to 34 Years | 262 (100.0%) | 331 (91.2%) |
| 35 to 44 Years | 297 (83.7%) | 128 (64.3%) |
| 45 to 54 Years | 227 (73.9%) | 203 (78.1%) |
| 55 to 64 Years | 268 (89.9%) | 352 (83.8%) |
| 65 to 74 Years | 177 (79.4%) | 194 (72.9%) |
| 75 Years and over | 166 (69.2%) | 232 (84.4%) |
| Total | 1,910 (81.2%) | 1,856 (78.8%) |
Income Below Poverty Among Married-Couple Families in Carmi
The poverty statistics for married-couple families in Carmi show that 5.1% or 39 of the total 766 families live below the poverty line. Families with no children have the highest poverty rate of 6.9%, comprising of 39 families. On the other hand, families with 1 or 2 children have the lowest poverty rate of 0.0%, which includes 0 families.
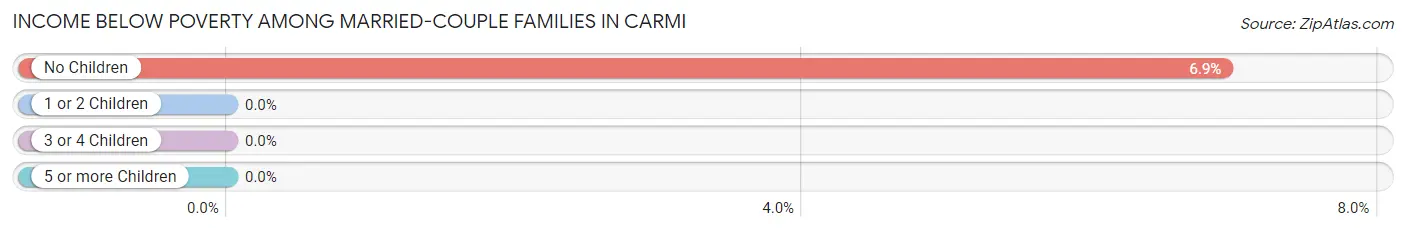
| Children | Above Poverty | Below Poverty |
| No Children | 524 (93.1%) | 39 (6.9%) |
| 1 or 2 Children | 94 (100.0%) | 0 (0.0%) |
| 3 or 4 Children | 109 (100.0%) | 0 (0.0%) |
| 5 or more Children | 0 (0.0%) | 0 (0.0%) |
| Total | 727 (94.9%) | 39 (5.1%) |
Income Below Poverty Among Single-Parent Households in Carmi
According to the poverty data in Carmi, 21.5% or 17 single-father households and 40.5% or 127 single-mother households are living below the poverty line. Among single-father households, those with no children have the highest poverty rate, with 17 households (54.8%) experiencing poverty. Likewise, among single-mother households, those with 1 or 2 children have the highest poverty rate, with 53 households (55.2%) falling below the poverty line.
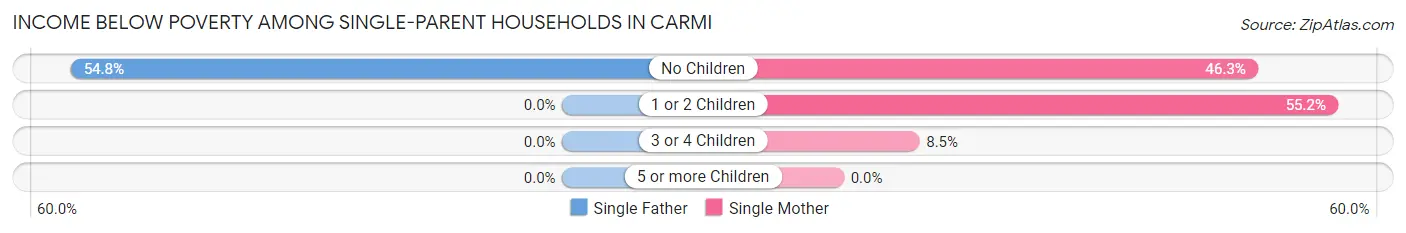
| Children | Single Father | Single Mother |
| No Children | 17 (54.8%) | 68 (46.3%) |
| 1 or 2 Children | 0 (0.0%) | 53 (55.2%) |
| 3 or 4 Children | 0 (0.0%) | 6 (8.5%) |
| 5 or more Children | 0 (0.0%) | 0 (0.0%) |
| Total | 17 (21.5%) | 127 (40.5%) |
Income Below Poverty Among Married-Couple vs Single-Parent Households in Carmi
The poverty data for Carmi shows that 39 of the married-couple family households (5.1%) and 144 of the single-parent households (36.6%) are living below the poverty level. Within the married-couple family households, those with no children have the highest poverty rate, with 39 households (6.9%) falling below the poverty line. Among the single-parent households, those with no children have the highest poverty rate, with 85 household (47.7%) living below poverty.
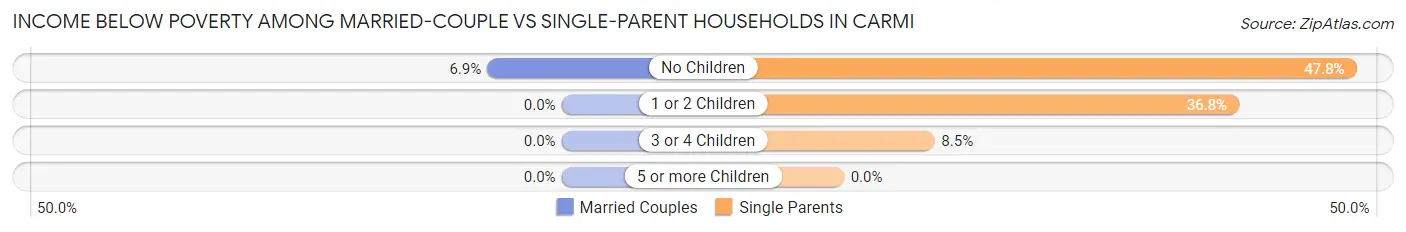
| Children | Married-Couple Families | Single-Parent Households |
| No Children | 39 (6.9%) | 85 (47.7%) |
| 1 or 2 Children | 0 (0.0%) | 53 (36.8%) |
| 3 or 4 Children | 0 (0.0%) | 6 (8.5%) |
| 5 or more Children | 0 (0.0%) | 0 (0.0%) |
| Total | 39 (5.1%) | 144 (36.6%) |
Race in Carmi
The most populous races in Carmi are White / Caucasian (4,833 | 95.9%), Hispanic or Latino (87 | 1.7%), and Two or more Races (72 | 1.4%).
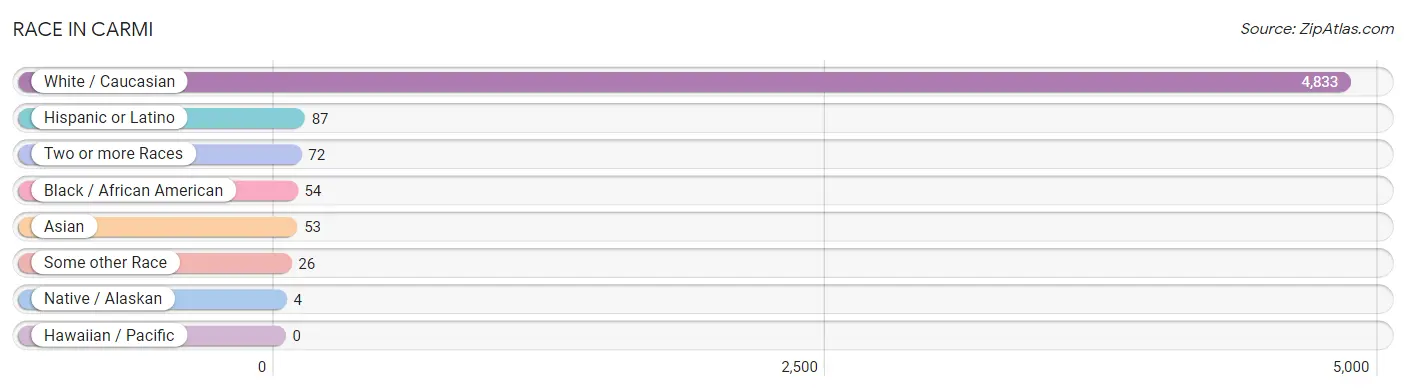
| Race | # Population | % Population |
| Asian | 53 | 1.1% |
| Black / African American | 54 | 1.1% |
| Hawaiian / Pacific | 0 | 0.0% |
| Hispanic or Latino | 87 | 1.7% |
| Native / Alaskan | 4 | 0.1% |
| White / Caucasian | 4,833 | 95.9% |
| Two or more Races | 72 | 1.4% |
| Some other Race | 26 | 0.5% |
| Total | 5,042 | 100.0% |
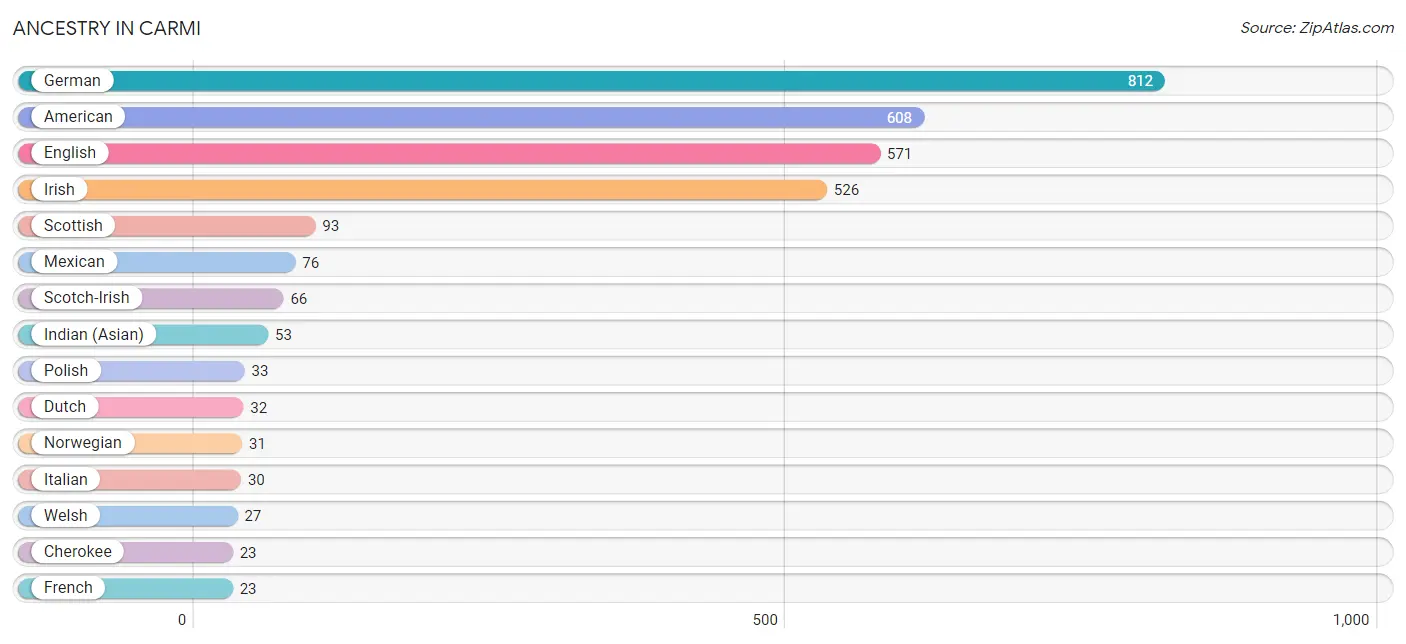
Ancestry in Carmi
The most populous ancestries reported in Carmi are German (812 | 16.1%), American (608 | 12.1%), English (571 | 11.3%), Irish (526 | 10.4%), and Scottish (93 | 1.8%), together accounting for 51.8% of all Carmi residents.
| Ancestry | # Population | % Population |
| African | 13 | 0.3% |
| American | 608 | 12.1% |
| Bhutanese | 2 | 0.0% |
| British | 17 | 0.3% |
| Cherokee | 23 | 0.5% |
| Croatian | 13 | 0.3% |
| Dutch | 32 | 0.6% |
| English | 571 | 11.3% |
| European | 16 | 0.3% |
| French | 23 | 0.5% |
| German | 812 | 16.1% |
| Indian (Asian) | 53 | 1.1% |
| Irish | 526 | 10.4% |
| Italian | 30 | 0.6% |
| Korean | 2 | 0.0% |
| Mexican | 76 | 1.5% |
| Native Hawaiian | 1 | 0.0% |
| Nigerian | 5 | 0.1% |
| Norwegian | 31 | 0.6% |
| Polish | 33 | 0.6% |
| Puerto Rican | 11 | 0.2% |
| Romanian | 10 | 0.2% |
| Scandinavian | 23 | 0.5% |
| Scotch-Irish | 66 | 1.3% |
| Scottish | 93 | 1.8% |
| Subsaharan African | 18 | 0.4% |
| Swedish | 17 | 0.3% |
| Welsh | 27 | 0.5% | View All 28 Rows |
Immigrants in Carmi
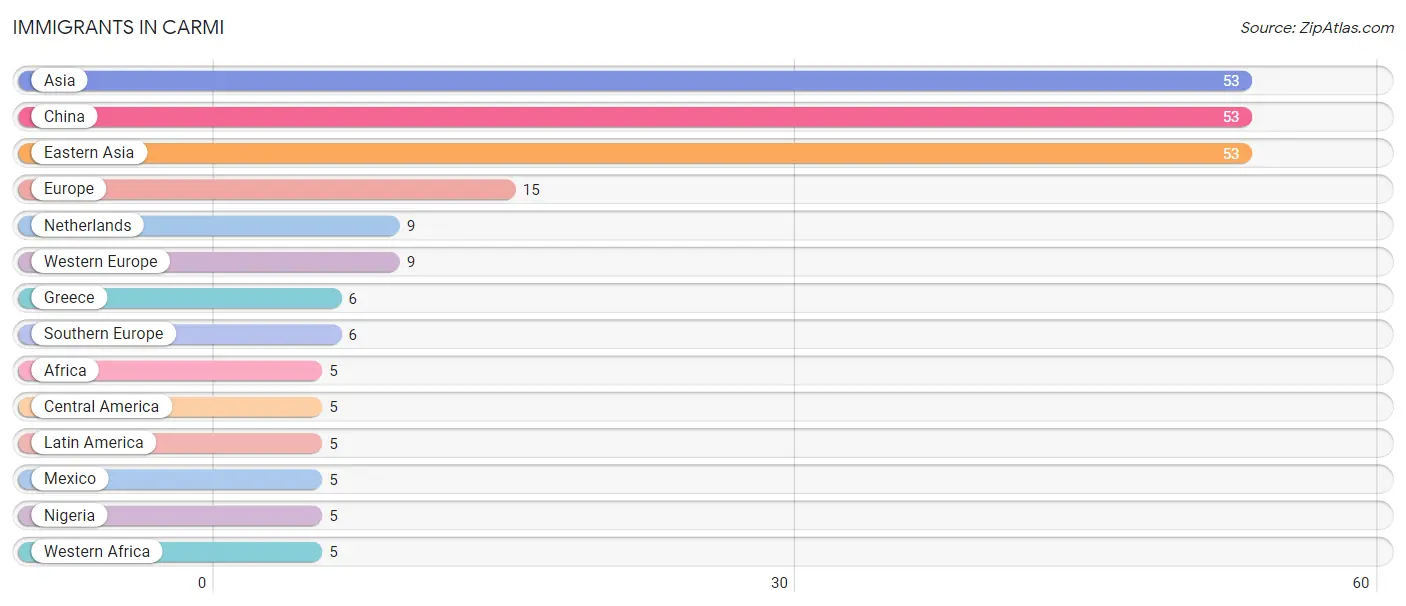
The most numerous immigrant groups reported in Carmi came from Asia (53 | 1.1%), China (53 | 1.1%), Eastern Asia (53 | 1.1%), Europe (15 | 0.3%), and Netherlands (9 | 0.2%), together accounting for 3.6% of all Carmi residents.
| Immigration Origin | # Population | % Population |
| Africa | 5 | 0.1% |
| Asia | 53 | 1.1% |
| Central America | 5 | 0.1% |
| China | 53 | 1.1% |
| Eastern Asia | 53 | 1.1% |
| Europe | 15 | 0.3% |
| Greece | 6 | 0.1% |
| Latin America | 5 | 0.1% |
| Mexico | 5 | 0.1% |
| Netherlands | 9 | 0.2% |
| Nigeria | 5 | 0.1% |
| Southern Europe | 6 | 0.1% |
| Western Africa | 5 | 0.1% |
| Western Europe | 9 | 0.2% | View All 14 Rows |
Sex and Age in Carmi
Sex and Age in Carmi
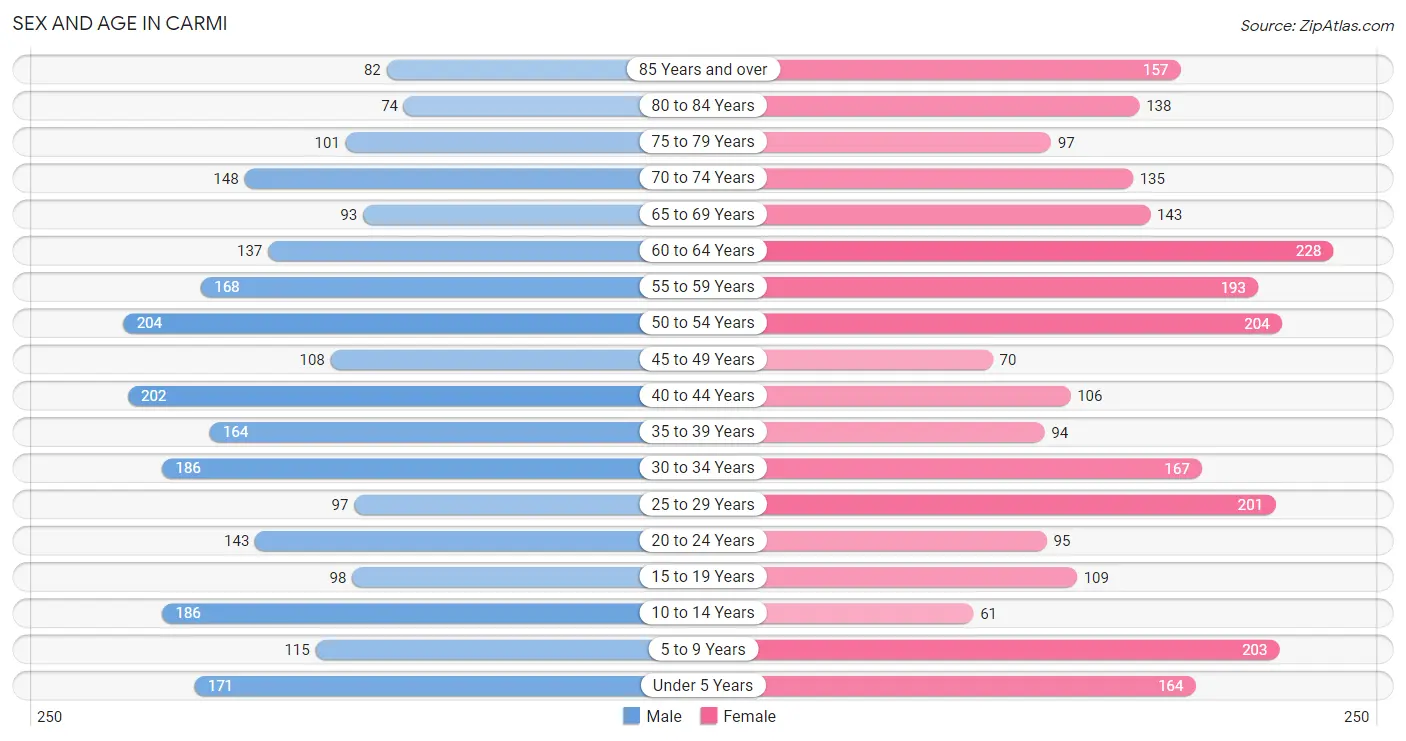
The most populous age groups in Carmi are 50 to 54 Years (204 | 8.2%) for men and 60 to 64 Years (228 | 8.9%) for women.
| Age Bracket | Male | Female |
| Under 5 Years | 171 (6.9%) | 164 (6.4%) |
| 5 to 9 Years | 115 (4.6%) | 203 (7.9%) |
| 10 to 14 Years | 186 (7.5%) | 61 (2.4%) |
| 15 to 19 Years | 98 (4.0%) | 109 (4.3%) |
| 20 to 24 Years | 143 (5.8%) | 95 (3.7%) |
| 25 to 29 Years | 97 (3.9%) | 201 (7.8%) |
| 30 to 34 Years | 186 (7.5%) | 167 (6.5%) |
| 35 to 39 Years | 164 (6.6%) | 94 (3.7%) |
| 40 to 44 Years | 202 (8.2%) | 106 (4.1%) |
| 45 to 49 Years | 108 (4.4%) | 70 (2.7%) |
| 50 to 54 Years | 204 (8.2%) | 204 (8.0%) |
| 55 to 59 Years | 168 (6.8%) | 193 (7.5%) |
| 60 to 64 Years | 137 (5.5%) | 228 (8.9%) |
| 65 to 69 Years | 93 (3.7%) | 143 (5.6%) |
| 70 to 74 Years | 148 (6.0%) | 135 (5.3%) |
| 75 to 79 Years | 101 (4.1%) | 97 (3.8%) |
| 80 to 84 Years | 74 (3.0%) | 138 (5.4%) |
| 85 Years and over | 82 (3.3%) | 157 (6.1%) |
| Total | 2,477 (100.0%) | 2,565 (100.0%) |
Families and Households in Carmi
Median Family Size in Carmi
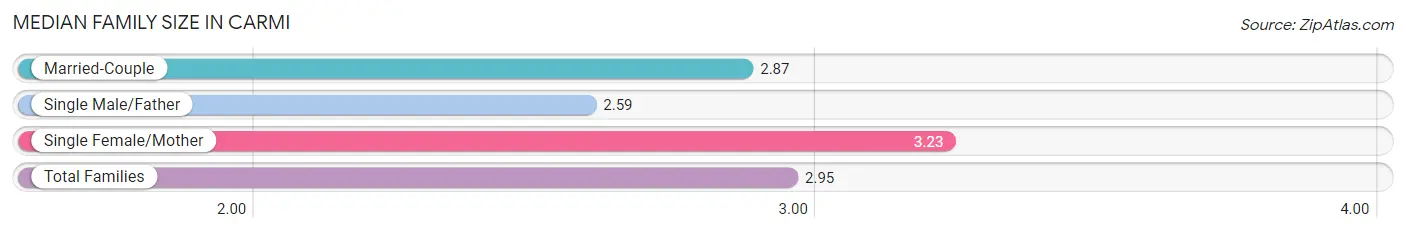
The median family size in Carmi is 2.95 persons per family, with single female/mother families (314 | 27.1%) accounting for the largest median family size of 3.23 persons per family. On the other hand, single male/father families (79 | 6.8%) represent the smallest median family size with 2.59 persons per family.
| Family Type | # Families | Family Size |
| Married-Couple | 766 (66.1%) | 2.87 |
| Single Male/Father | 79 (6.8%) | 2.59 |
| Single Female/Mother | 314 (27.1%) | 3.23 |
| Total Families | 1,159 (100.0%) | 2.95 |
Median Household Size in Carmi
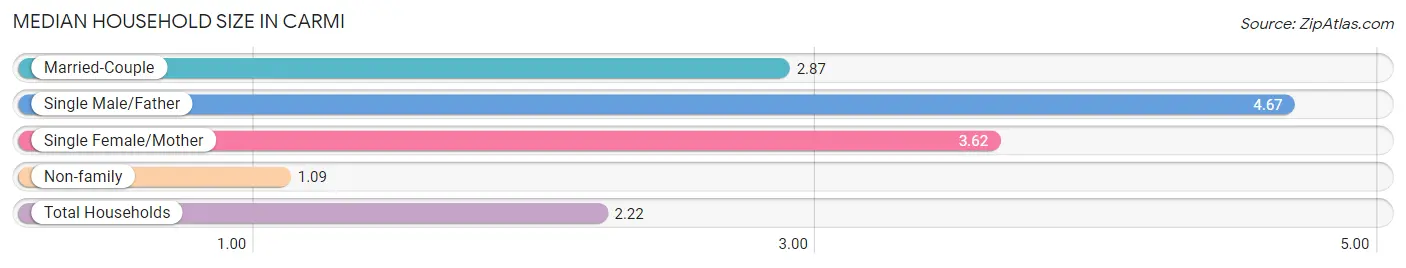
The median household size in Carmi is 2.22 persons per household, with single male/father households (79 | 3.6%) accounting for the largest median household size of 4.67 persons per household. non-family households (1,011 | 46.6%) represent the smallest median household size with 1.09 persons per household.
| Household Type | # Households | Household Size |
| Married-Couple | 766 (35.3%) | 2.87 |
| Single Male/Father | 79 (3.6%) | 4.67 |
| Single Female/Mother | 314 (14.5%) | 3.62 |
| Non-family | 1,011 (46.6%) | 1.09 |
| Total Households | 2,170 (100.0%) | 2.22 |
Household Size by Marriage Status in Carmi
Out of a total of 2,170 households in Carmi, 1,159 (53.4%) are family households, while 1,011 (46.6%) are nonfamily households. The most numerous type of family households are 2-person households, comprising 555, and the most common type of nonfamily households are 1-person households, comprising 937.
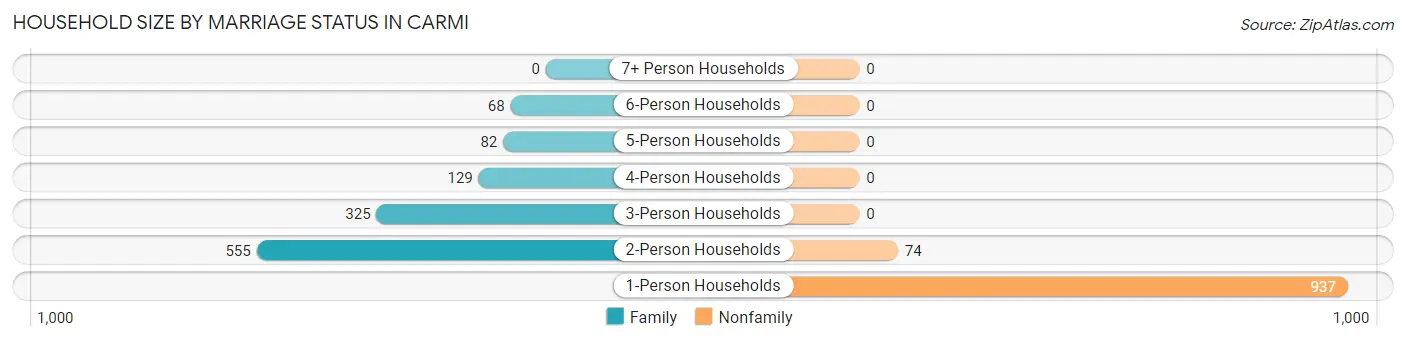
| Household Size | Family Households | Nonfamily Households |
| 1-Person Households | - | 937 (43.2%) |
| 2-Person Households | 555 (25.6%) | 74 (3.4%) |
| 3-Person Households | 325 (15.0%) | 0 (0.0%) |
| 4-Person Households | 129 (5.9%) | 0 (0.0%) |
| 5-Person Households | 82 (3.8%) | 0 (0.0%) |
| 6-Person Households | 68 (3.1%) | 0 (0.0%) |
| 7+ Person Households | 0 (0.0%) | 0 (0.0%) |
| Total | 1,159 (53.4%) | 1,011 (46.6%) |
Female Fertility in Carmi
Fertility by Age in Carmi
Average fertility rate in Carmi is 103.0 births per 1,000 women. Women in the age bracket of 20 to 34 years have the highest fertility rate with 190.0 births per 1,000 women. Women in the age bracket of 20 to 34 years acount for 100.0% of all women with births.
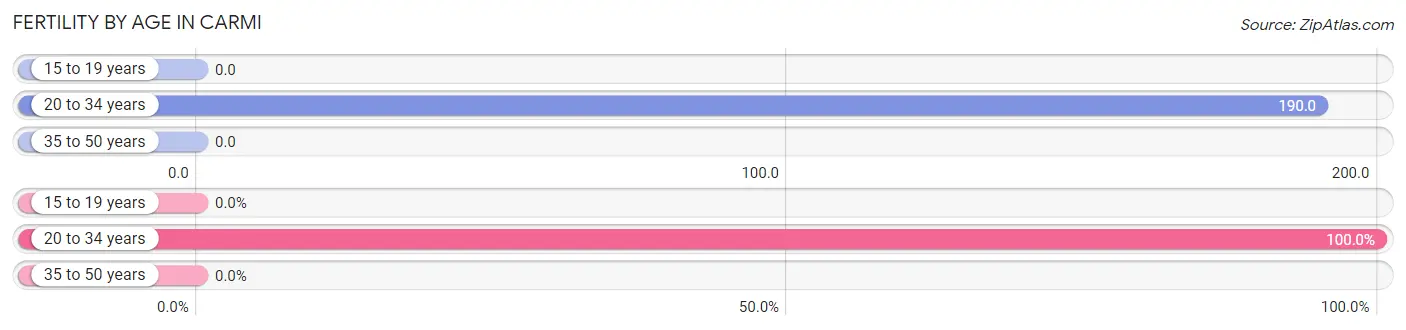
| Age Bracket | Women with Births | Births / 1,000 Women |
| 15 to 19 years | 0 (0.0%) | 0.0 |
| 20 to 34 years | 88 (100.0%) | 190.0 |
| 35 to 50 years | 0 (0.0%) | 0.0 |
| Total | 88 (100.0%) | 103.0 |
Fertility by Age by Marriage Status in Carmi
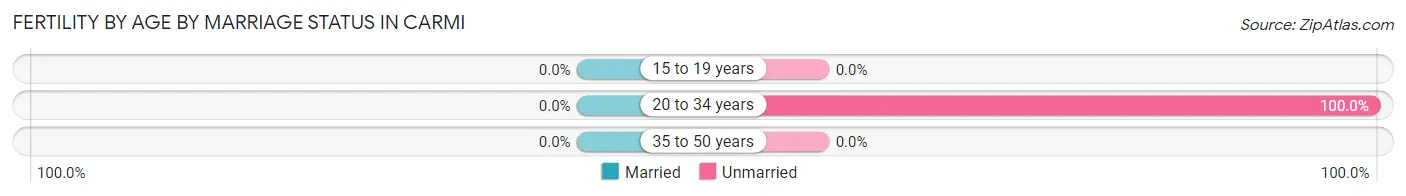
| Age Bracket | Married | Unmarried |
| 15 to 19 years | 0 (0.0%) | 0 (0.0%) |
| 20 to 34 years | 0 (0.0%) | 88 (100.0%) |
| 35 to 50 years | 0 (0.0%) | 0 (0.0%) |
| Total | 0 (0.0%) | 88 (100.0%) |
Fertility by Education in Carmi
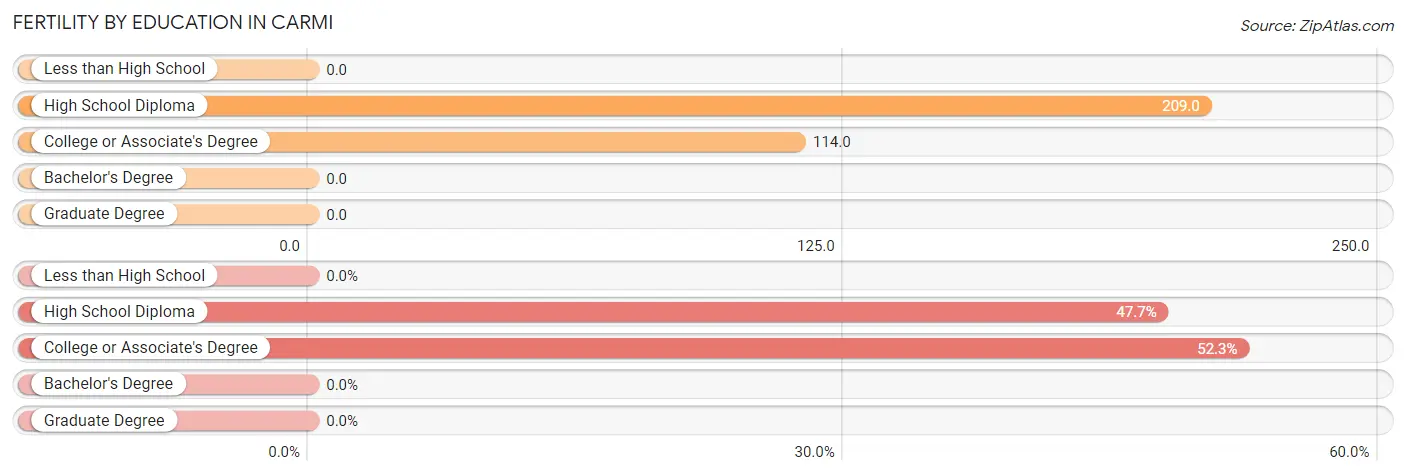
| Educational Attainment | Women with Births | Births / 1,000 Women |
| Less than High School | 0 (0.0%) | 0.0 |
| High School Diploma | 42 (47.7%) | 209.0 |
| College or Associate's Degree | 46 (52.3%) | 114.0 |
| Bachelor's Degree | 0 (0.0%) | 0.0 |
| Graduate Degree | 0 (0.0%) | 0.0 |
| Total | 88 (100.0%) | 103.0 |
Fertility by Education by Marriage Status in Carmi
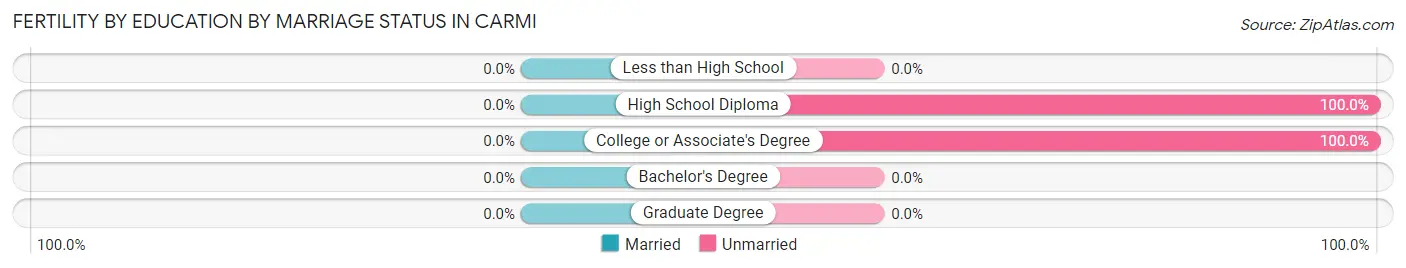
| Educational Attainment | Married | Unmarried |
| Less than High School | 0 (0.0%) | 0 (0.0%) |
| High School Diploma | 0 (0.0%) | 42 (100.0%) |
| College or Associate's Degree | 0 (0.0%) | 46 (100.0%) |
| Bachelor's Degree | 0 (0.0%) | 0 (0.0%) |
| Graduate Degree | 0 (0.0%) | 0 (0.0%) |
| Total | 0 (0.0%) | 88 (100.0%) |
Employment Characteristics in Carmi
Employment by Class of Employer in Carmi
Among the 2,019 employed individuals in Carmi, private company employees (1,487 | 73.7%), not-for-profit organizations (154 | 7.6%), and local government employees (131 | 6.5%) make up the most common classes of employment.
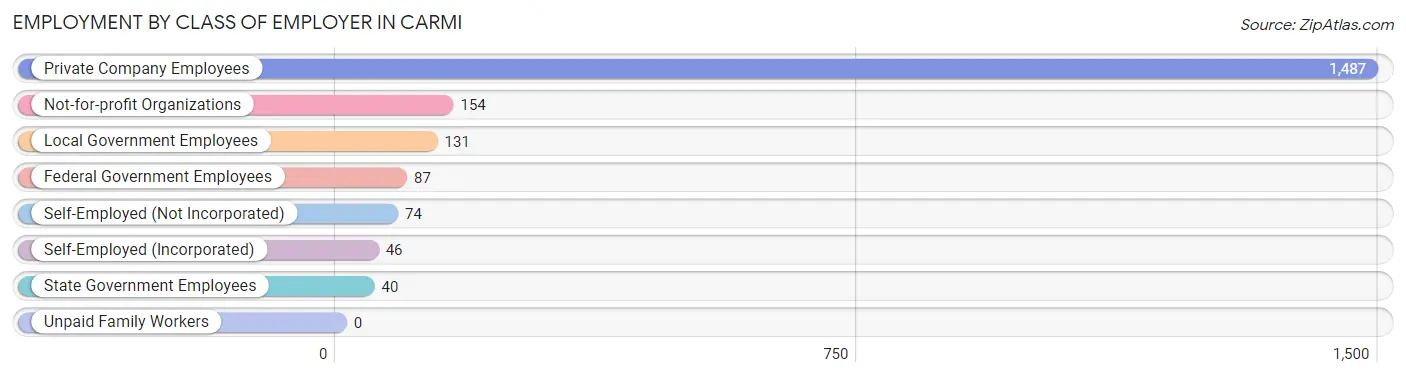
| Employer Class | # Employees | % Employees |
| Private Company Employees | 1,487 | 73.7% |
| Self-Employed (Incorporated) | 46 | 2.3% |
| Self-Employed (Not Incorporated) | 74 | 3.7% |
| Not-for-profit Organizations | 154 | 7.6% |
| Local Government Employees | 131 | 6.5% |
| State Government Employees | 40 | 2.0% |
| Federal Government Employees | 87 | 4.3% |
| Unpaid Family Workers | 0 | 0.0% |
| Total | 2,019 | 100.0% |
Employment Status by Age in Carmi
According to the labor force statistics for Carmi, out of the total population over 16 years of age (4,107), 50.7% or 2,082 individuals are in the labor force, with 1.9% or 40 of them unemployed. The age group with the highest labor force participation rate is 30 to 34 years, with 88.4% or 312 individuals in the labor force. Within the labor force, the 65 to 74 years age range has the highest percentage of unemployed individuals, with 14.5% or 9 of them being unemployed.
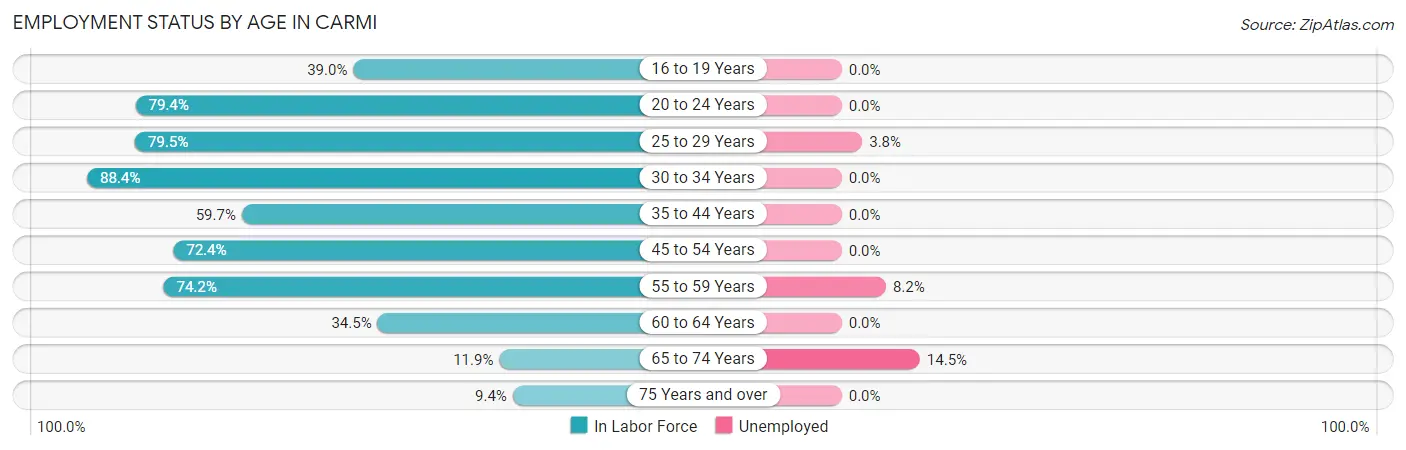
| Age Bracket | In Labor Force | Unemployed |
| 16 to 19 Years | 67 (39.0%) | 0 (0.0%) |
| 20 to 24 Years | 189 (79.4%) | 0 (0.0%) |
| 25 to 29 Years | 237 (79.5%) | 9 (3.8%) |
| 30 to 34 Years | 312 (88.4%) | 0 (0.0%) |
| 35 to 44 Years | 338 (59.7%) | 0 (0.0%) |
| 45 to 54 Years | 424 (72.4%) | 0 (0.0%) |
| 55 to 59 Years | 268 (74.2%) | 22 (8.2%) |
| 60 to 64 Years | 126 (34.5%) | 0 (0.0%) |
| 65 to 74 Years | 62 (11.9%) | 9 (14.5%) |
| 75 Years and over | 61 (9.4%) | 0 (0.0%) |
| Total | 2,082 (50.7%) | 40 (1.9%) |
Employment Status by Educational Attainment in Carmi
According to labor force statistics for Carmi, 67.4% of individuals (1,705) out of the total population between 25 and 64 years of age (2,529) are in the labor force, with 1.8% or 31 of them being unemployed. The group with the highest labor force participation rate are those with the educational attainment of bachelor's degree or higher, with 79.7% or 231 individuals in the labor force. Within the labor force, individuals with bachelor's degree or higher education have the highest percentage of unemployment, with 9.5% or 22 of them being unemployed.
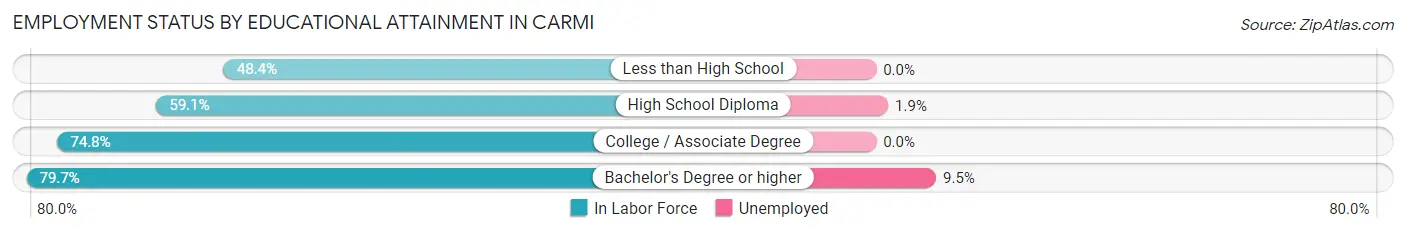
| Educational Attainment | In Labor Force | Unemployed |
| Less than High School | 133 (48.4%) | 0 (0.0%) |
| High School Diploma | 484 (59.1%) | 16 (1.9%) |
| College / Associate Degree | 856 (74.8%) | 0 (0.0%) |
| Bachelor's Degree or higher | 231 (79.7%) | 28 (9.5%) |
| Total | 1,705 (67.4%) | 46 (1.8%) |
Employment Occupations by Sex in Carmi
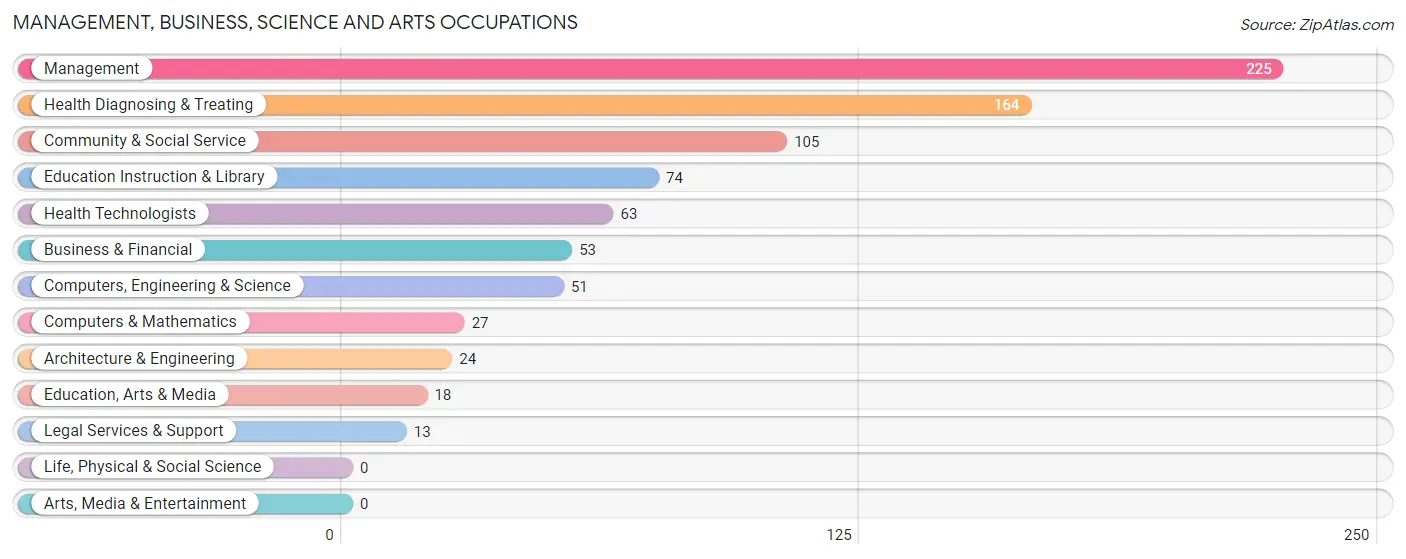
Management, Business, Science and Arts Occupations
The most common Management, Business, Science and Arts occupations in Carmi are Management (225 | 11.0%), Health Diagnosing & Treating (164 | 8.0%), Community & Social Service (105 | 5.1%), Education Instruction & Library (74 | 3.6%), and Health Technologists (63 | 3.1%).
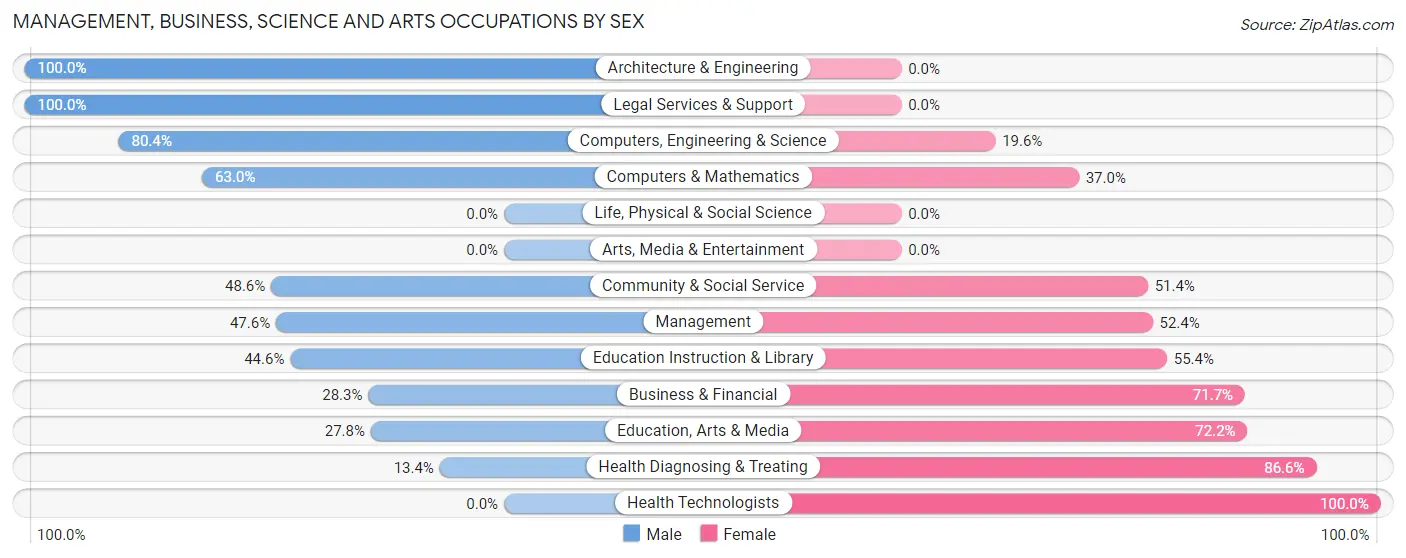
Management, Business, Science and Arts Occupations by Sex
Within the Management, Business, Science and Arts occupations in Carmi, the most male-oriented occupations are Architecture & Engineering (100.0%), Legal Services & Support (100.0%), and Computers, Engineering & Science (80.4%), while the most female-oriented occupations are Health Technologists (100.0%), Health Diagnosing & Treating (86.6%), and Education, Arts & Media (72.2%).
| Occupation | Male | Female |
| Management | 107 (47.6%) | 118 (52.4%) |
| Business & Financial | 15 (28.3%) | 38 (71.7%) |
| Computers, Engineering & Science | 41 (80.4%) | 10 (19.6%) |
| Computers & Mathematics | 17 (63.0%) | 10 (37.0%) |
| Architecture & Engineering | 24 (100.0%) | 0 (0.0%) |
| Life, Physical & Social Science | 0 (0.0%) | 0 (0.0%) |
| Community & Social Service | 51 (48.6%) | 54 (51.4%) |
| Education, Arts & Media | 5 (27.8%) | 13 (72.2%) |
| Legal Services & Support | 13 (100.0%) | 0 (0.0%) |
| Education Instruction & Library | 33 (44.6%) | 41 (55.4%) |
| Arts, Media & Entertainment | 0 (0.0%) | 0 (0.0%) |
| Health Diagnosing & Treating | 22 (13.4%) | 142 (86.6%) |
| Health Technologists | 0 (0.0%) | 63 (100.0%) |
| Total (Category) | 236 (39.5%) | 362 (60.5%) |
| Total (Overall) | 1,089 (53.3%) | 955 (46.7%) |
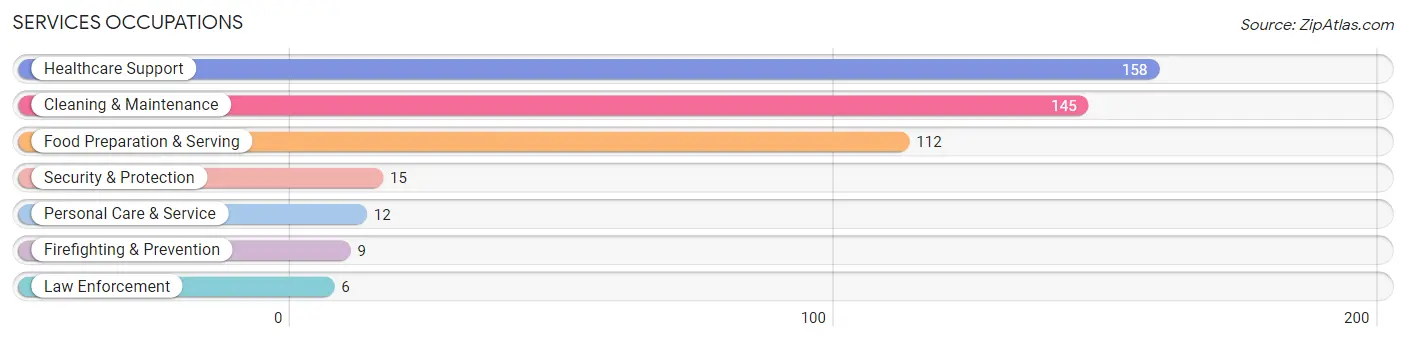
Services Occupations
The most common Services occupations in Carmi are Healthcare Support (158 | 7.7%), Cleaning & Maintenance (145 | 7.1%), Food Preparation & Serving (112 | 5.5%), Security & Protection (15 | 0.7%), and Personal Care & Service (12 | 0.6%).
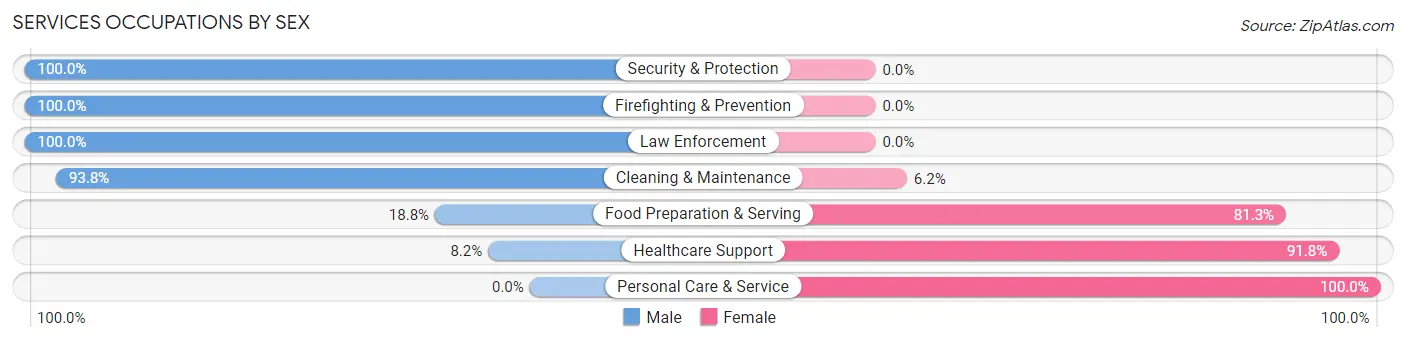
Services Occupations by Sex
Within the Services occupations in Carmi, the most male-oriented occupations are Security & Protection (100.0%), Firefighting & Prevention (100.0%), and Law Enforcement (100.0%), while the most female-oriented occupations are Personal Care & Service (100.0%), Healthcare Support (91.8%), and Food Preparation & Serving (81.2%).
| Occupation | Male | Female |
| Healthcare Support | 13 (8.2%) | 145 (91.8%) |
| Security & Protection | 15 (100.0%) | 0 (0.0%) |
| Firefighting & Prevention | 9 (100.0%) | 0 (0.0%) |
| Law Enforcement | 6 (100.0%) | 0 (0.0%) |
| Food Preparation & Serving | 21 (18.8%) | 91 (81.2%) |
| Cleaning & Maintenance | 136 (93.8%) | 9 (6.2%) |
| Personal Care & Service | 0 (0.0%) | 12 (100.0%) |
| Total (Category) | 185 (41.9%) | 257 (58.1%) |
| Total (Overall) | 1,089 (53.3%) | 955 (46.7%) |
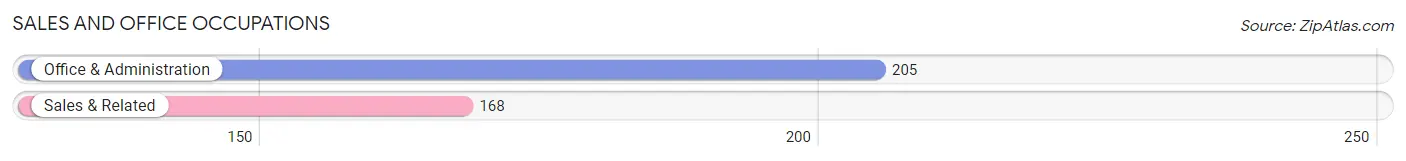
Sales and Office Occupations
The most common Sales and Office occupations in Carmi are Office & Administration (205 | 10.0%), and Sales & Related (168 | 8.2%).
Sales and Office Occupations by Sex
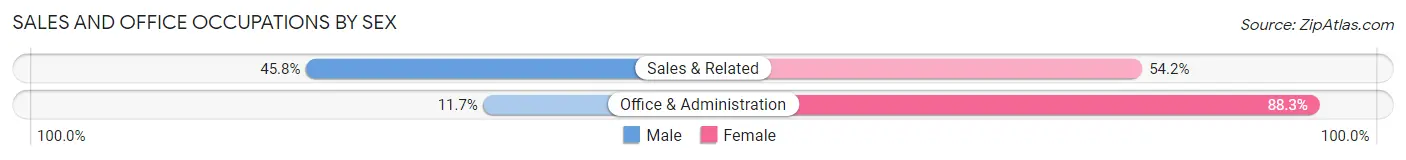
| Occupation | Male | Female |
| Sales & Related | 77 (45.8%) | 91 (54.2%) |
| Office & Administration | 24 (11.7%) | 181 (88.3%) |
| Total (Category) | 101 (27.1%) | 272 (72.9%) |
| Total (Overall) | 1,089 (53.3%) | 955 (46.7%) |
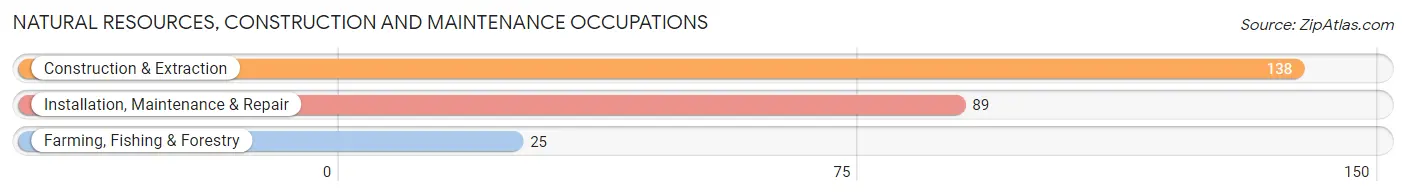
Natural Resources, Construction and Maintenance Occupations
The most common Natural Resources, Construction and Maintenance occupations in Carmi are Construction & Extraction (138 | 6.8%), Installation, Maintenance & Repair (89 | 4.3%), and Farming, Fishing & Forestry (25 | 1.2%).
Natural Resources, Construction and Maintenance Occupations by Sex
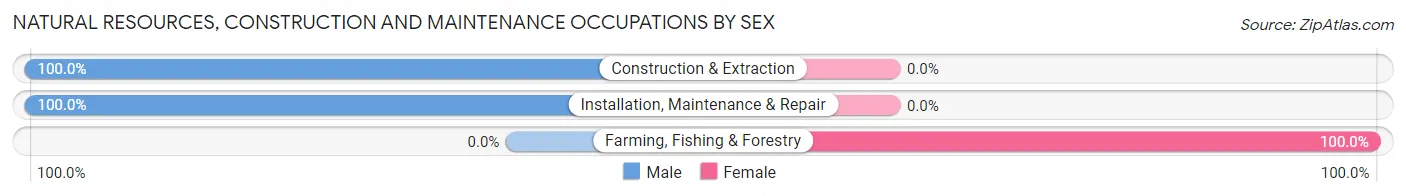
| Occupation | Male | Female |
| Farming, Fishing & Forestry | 0 (0.0%) | 25 (100.0%) |
| Construction & Extraction | 138 (100.0%) | 0 (0.0%) |
| Installation, Maintenance & Repair | 89 (100.0%) | 0 (0.0%) |
| Total (Category) | 227 (90.1%) | 25 (9.9%) |
| Total (Overall) | 1,089 (53.3%) | 955 (46.7%) |
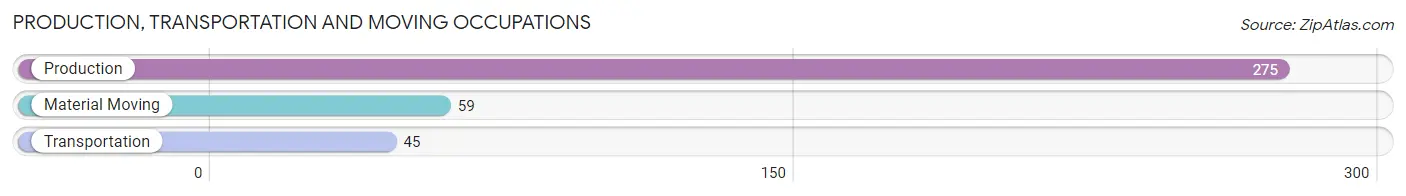
Production, Transportation and Moving Occupations
The most common Production, Transportation and Moving occupations in Carmi are Production (275 | 13.5%), Material Moving (59 | 2.9%), and Transportation (45 | 2.2%).
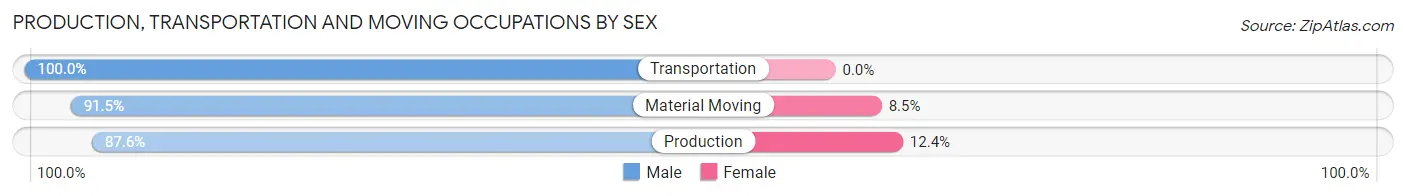
Production, Transportation and Moving Occupations by Sex
| Occupation | Male | Female |
| Production | 241 (87.6%) | 34 (12.4%) |
| Transportation | 45 (100.0%) | 0 (0.0%) |
| Material Moving | 54 (91.5%) | 5 (8.5%) |
| Total (Category) | 340 (89.7%) | 39 (10.3%) |
| Total (Overall) | 1,089 (53.3%) | 955 (46.7%) |
Employment Industries by Sex in Carmi
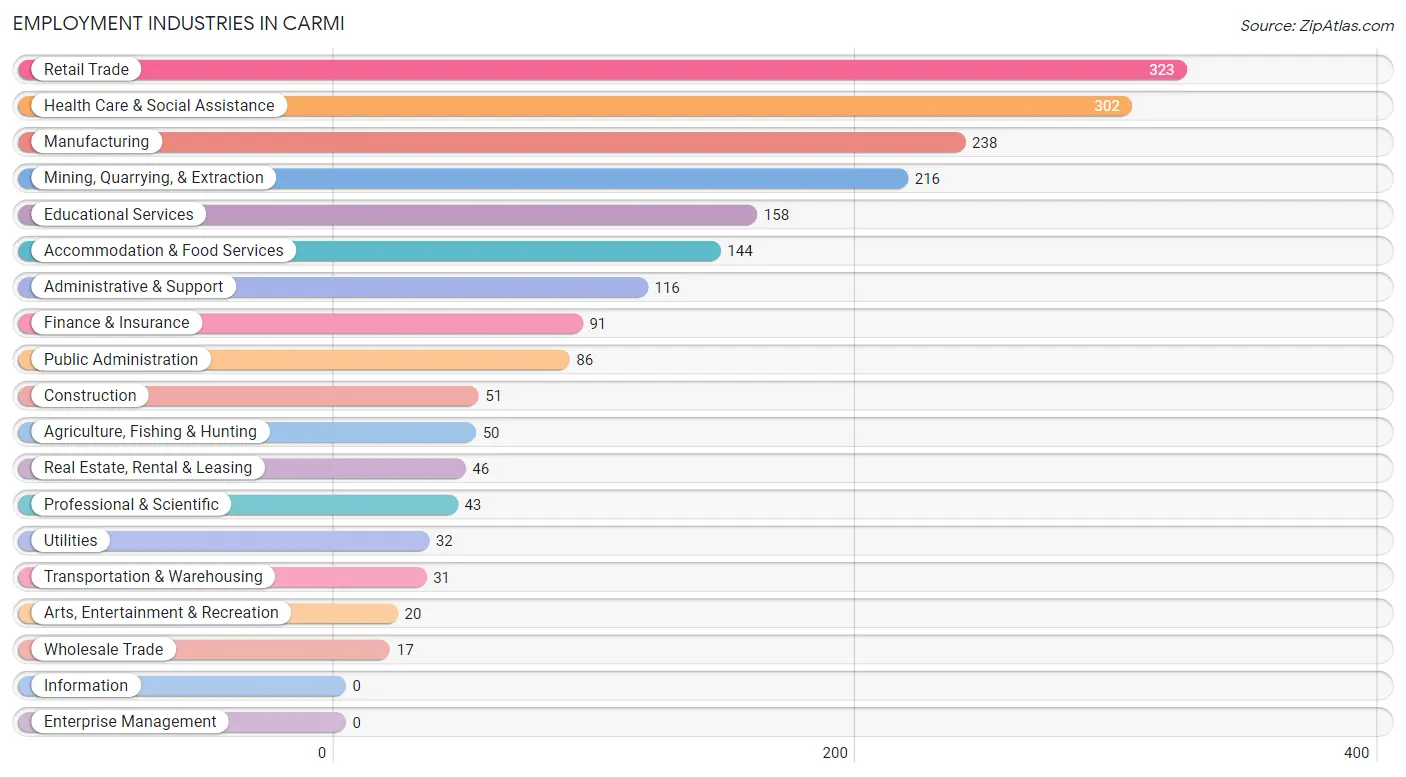
Employment Industries in Carmi
The major employment industries in Carmi include Retail Trade (323 | 15.8%), Health Care & Social Assistance (302 | 14.8%), Manufacturing (238 | 11.6%), Mining, Quarrying, & Extraction (216 | 10.6%), and Educational Services (158 | 7.7%).
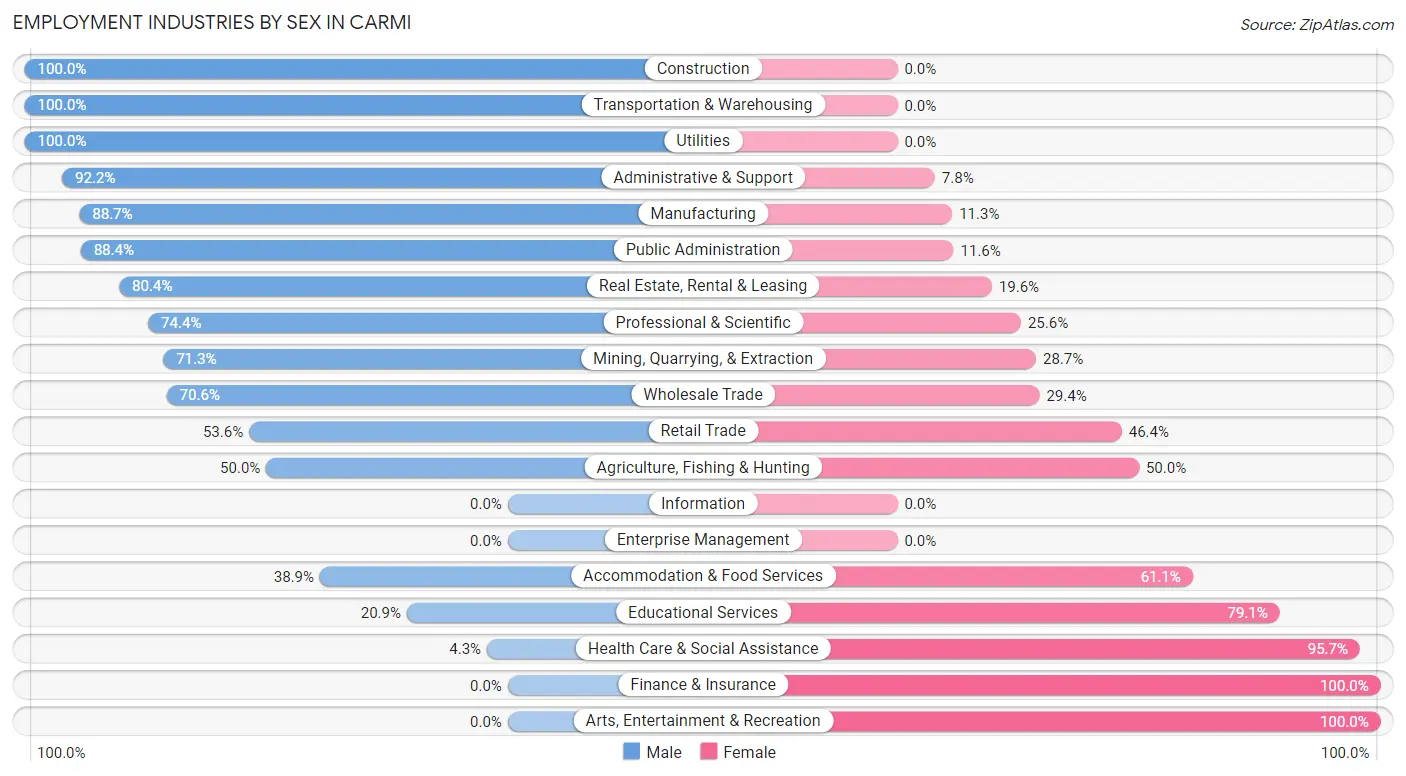
Employment Industries by Sex in Carmi
The Carmi industries that see more men than women are Construction (100.0%), Transportation & Warehousing (100.0%), and Utilities (100.0%), whereas the industries that tend to have a higher number of women are Finance & Insurance (100.0%), Arts, Entertainment & Recreation (100.0%), and Health Care & Social Assistance (95.7%).
| Industry | Male | Female |
| Agriculture, Fishing & Hunting | 25 (50.0%) | 25 (50.0%) |
| Mining, Quarrying, & Extraction | 154 (71.3%) | 62 (28.7%) |
| Construction | 51 (100.0%) | 0 (0.0%) |
| Manufacturing | 211 (88.7%) | 27 (11.3%) |
| Wholesale Trade | 12 (70.6%) | 5 (29.4%) |
| Retail Trade | 173 (53.6%) | 150 (46.4%) |
| Transportation & Warehousing | 31 (100.0%) | 0 (0.0%) |
| Utilities | 32 (100.0%) | 0 (0.0%) |
| Information | 0 (0.0%) | 0 (0.0%) |
| Finance & Insurance | 0 (0.0%) | 91 (100.0%) |
| Real Estate, Rental & Leasing | 37 (80.4%) | 9 (19.6%) |
| Professional & Scientific | 32 (74.4%) | 11 (25.6%) |
| Enterprise Management | 0 (0.0%) | 0 (0.0%) |
| Administrative & Support | 107 (92.2%) | 9 (7.8%) |
| Educational Services | 33 (20.9%) | 125 (79.1%) |
| Health Care & Social Assistance | 13 (4.3%) | 289 (95.7%) |
| Arts, Entertainment & Recreation | 0 (0.0%) | 20 (100.0%) |
| Accommodation & Food Services | 56 (38.9%) | 88 (61.1%) |
| Public Administration | 76 (88.4%) | 10 (11.6%) |
| Total | 1,089 (53.3%) | 955 (46.7%) |
Education in Carmi
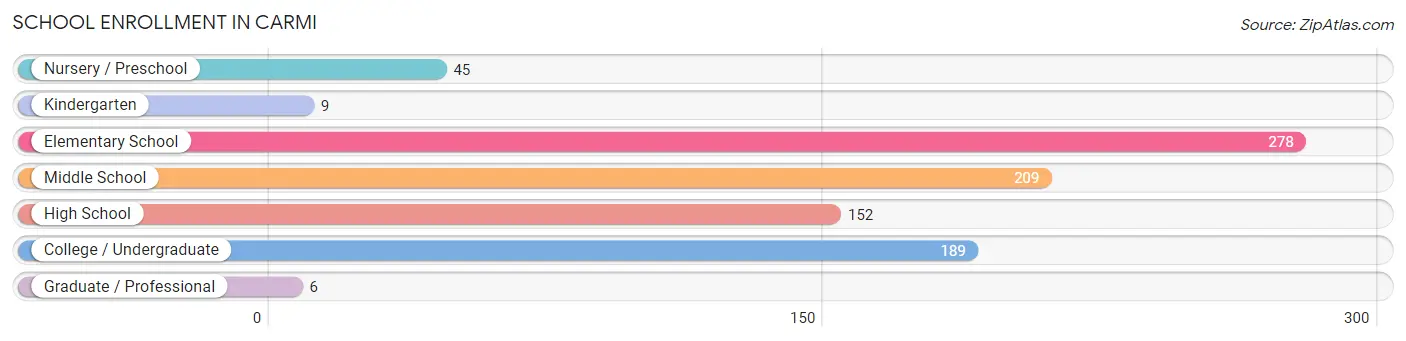
School Enrollment in Carmi
The most common levels of schooling among the 888 students in Carmi are elementary school (278 | 31.3%), middle school (209 | 23.5%), and college / undergraduate (189 | 21.3%).
| School Level | # Students | % Students |
| Nursery / Preschool | 45 | 5.1% |
| Kindergarten | 9 | 1.0% |
| Elementary School | 278 | 31.3% |
| Middle School | 209 | 23.5% |
| High School | 152 | 17.1% |
| College / Undergraduate | 189 | 21.3% |
| Graduate / Professional | 6 | 0.7% |
| Total | 888 | 100.0% |
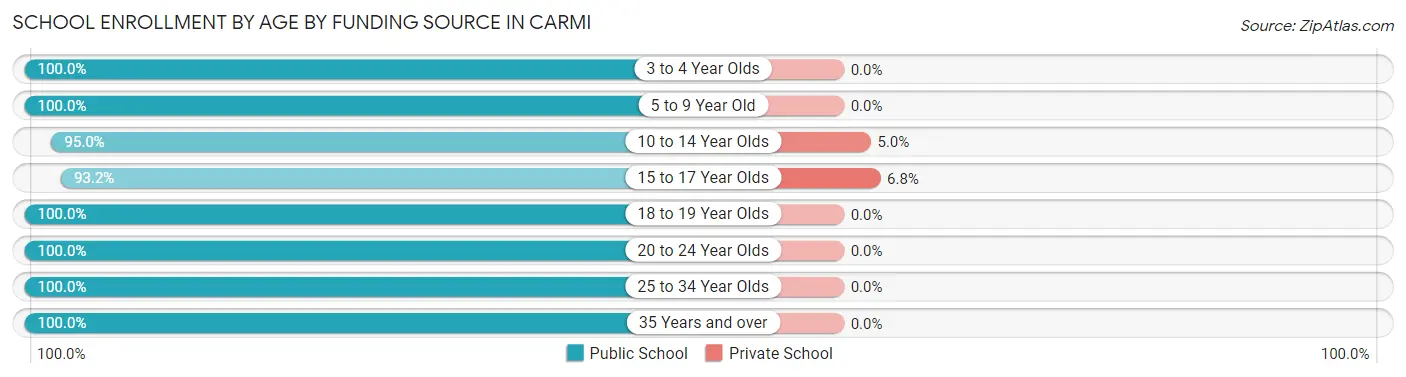
School Enrollment by Age by Funding Source in Carmi
Out of a total of 888 students who are enrolled in schools in Carmi, 18 (2.0%) attend a private institution, while the remaining 870 (98.0%) are enrolled in public schools. The age group of 15 to 17 year olds has the highest likelihood of being enrolled in private schools, with 8 (6.8% in the age bracket) enrolled. Conversely, the age group of 3 to 4 year olds has the lowest likelihood of being enrolled in a private school, with 54 (100.0% in the age bracket) attending a public institution.
| Age Bracket | Public School | Private School |
| 3 to 4 Year Olds | 54 (100.0%) | 0 (0.0%) |
| 5 to 9 Year Old | 257 (100.0%) | 0 (0.0%) |
| 10 to 14 Year Olds | 190 (95.0%) | 10 (5.0%) |
| 15 to 17 Year Olds | 110 (93.2%) | 8 (6.8%) |
| 18 to 19 Year Olds | 89 (100.0%) | 0 (0.0%) |
| 20 to 24 Year Olds | 92 (100.0%) | 0 (0.0%) |
| 25 to 34 Year Olds | 38 (100.0%) | 0 (0.0%) |
| 35 Years and over | 40 (100.0%) | 0 (0.0%) |
| Total | 870 (98.0%) | 18 (2.0%) |
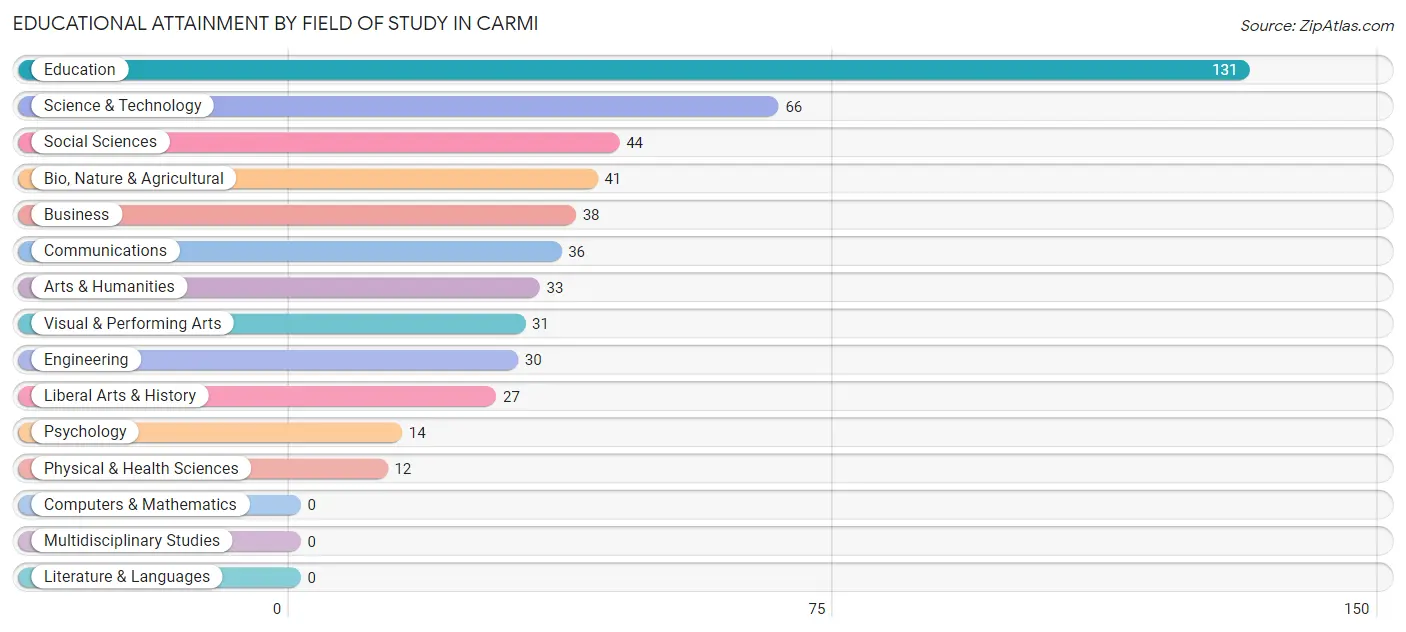
Educational Attainment by Field of Study in Carmi
Education (131 | 26.0%), science & technology (66 | 13.1%), social sciences (44 | 8.7%), bio, nature & agricultural (41 | 8.2%), and business (38 | 7.5%) are the most common fields of study among 503 individuals in Carmi who have obtained a bachelor's degree or higher.
| Field of Study | # Graduates | % Graduates |
| Computers & Mathematics | 0 | 0.0% |
| Bio, Nature & Agricultural | 41 | 8.2% |
| Physical & Health Sciences | 12 | 2.4% |
| Psychology | 14 | 2.8% |
| Social Sciences | 44 | 8.7% |
| Engineering | 30 | 6.0% |
| Multidisciplinary Studies | 0 | 0.0% |
| Science & Technology | 66 | 13.1% |
| Business | 38 | 7.5% |
| Education | 131 | 26.0% |
| Literature & Languages | 0 | 0.0% |
| Liberal Arts & History | 27 | 5.4% |
| Visual & Performing Arts | 31 | 6.2% |
| Communications | 36 | 7.2% |
| Arts & Humanities | 33 | 6.6% |
| Total | 503 | 100.0% |
Transportation & Commute in Carmi
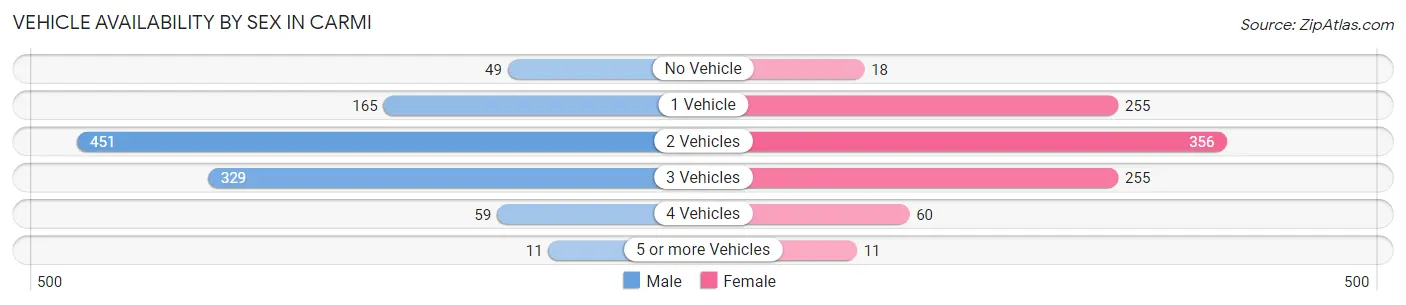
Vehicle Availability by Sex in Carmi
The most prevalent vehicle ownership categories in Carmi are males with 2 vehicles (451, accounting for 42.4%) and females with 2 vehicles (356, making up 47.2%).
| Vehicles Available | Male | Female |
| No Vehicle | 49 (4.6%) | 18 (1.9%) |
| 1 Vehicle | 165 (15.5%) | 255 (26.7%) |
| 2 Vehicles | 451 (42.4%) | 356 (37.3%) |
| 3 Vehicles | 329 (30.9%) | 255 (26.7%) |
| 4 Vehicles | 59 (5.6%) | 60 (6.3%) |
| 5 or more Vehicles | 11 (1.0%) | 11 (1.1%) |
| Total | 1,064 (100.0%) | 955 (100.0%) |
Commute Time in Carmi
The most frequently occuring commute durations in Carmi are 5 to 9 minutes (520 commuters, 26.5%), 10 to 14 minutes (371 commuters, 18.9%), and less than 5 minutes (307 commuters, 15.7%).
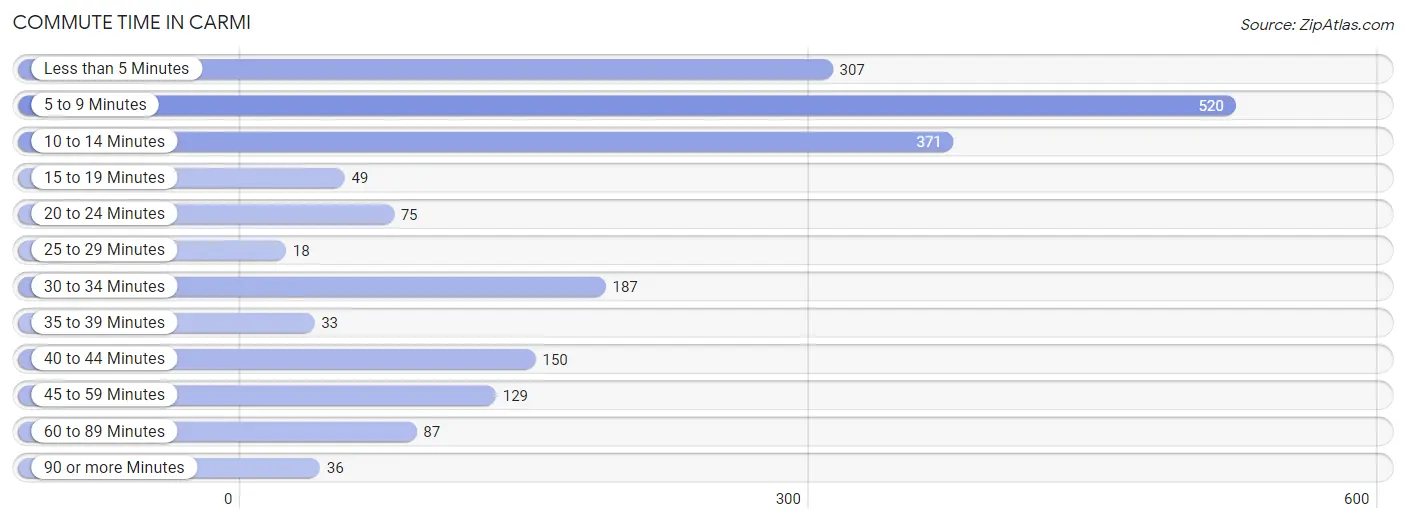
| Commute Time | # Commuters | % Commuters |
| Less than 5 Minutes | 307 | 15.7% |
| 5 to 9 Minutes | 520 | 26.5% |
| 10 to 14 Minutes | 371 | 18.9% |
| 15 to 19 Minutes | 49 | 2.5% |
| 20 to 24 Minutes | 75 | 3.8% |
| 25 to 29 Minutes | 18 | 0.9% |
| 30 to 34 Minutes | 187 | 9.5% |
| 35 to 39 Minutes | 33 | 1.7% |
| 40 to 44 Minutes | 150 | 7.6% |
| 45 to 59 Minutes | 129 | 6.6% |
| 60 to 89 Minutes | 87 | 4.4% |
| 90 or more Minutes | 36 | 1.8% |
Commute Time by Sex in Carmi
The most common commute times in Carmi are 5 to 9 minutes (256 commuters, 24.2%) for males and 5 to 9 minutes (264 commuters, 29.1%) for females.
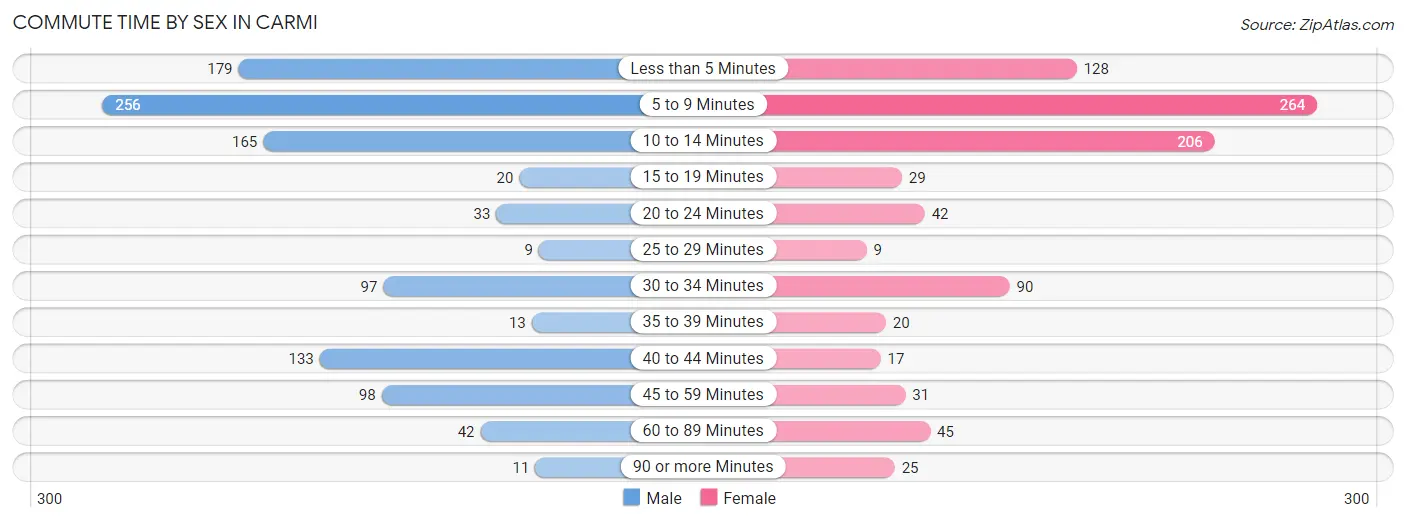
| Commute Time | Male | Female |
| Less than 5 Minutes | 179 (17.0%) | 128 (14.1%) |
| 5 to 9 Minutes | 256 (24.2%) | 264 (29.1%) |
| 10 to 14 Minutes | 165 (15.6%) | 206 (22.7%) |
| 15 to 19 Minutes | 20 (1.9%) | 29 (3.2%) |
| 20 to 24 Minutes | 33 (3.1%) | 42 (4.6%) |
| 25 to 29 Minutes | 9 (0.9%) | 9 (1.0%) |
| 30 to 34 Minutes | 97 (9.2%) | 90 (9.9%) |
| 35 to 39 Minutes | 13 (1.2%) | 20 (2.2%) |
| 40 to 44 Minutes | 133 (12.6%) | 17 (1.9%) |
| 45 to 59 Minutes | 98 (9.3%) | 31 (3.4%) |
| 60 to 89 Minutes | 42 (4.0%) | 45 (5.0%) |
| 90 or more Minutes | 11 (1.0%) | 25 (2.8%) |
Time of Departure to Work by Sex in Carmi
The most frequent times of departure to work in Carmi are 6:30 AM to 6:59 AM (223, 21.1%) for males and 7:30 AM to 7:59 AM (217, 23.9%) for females.
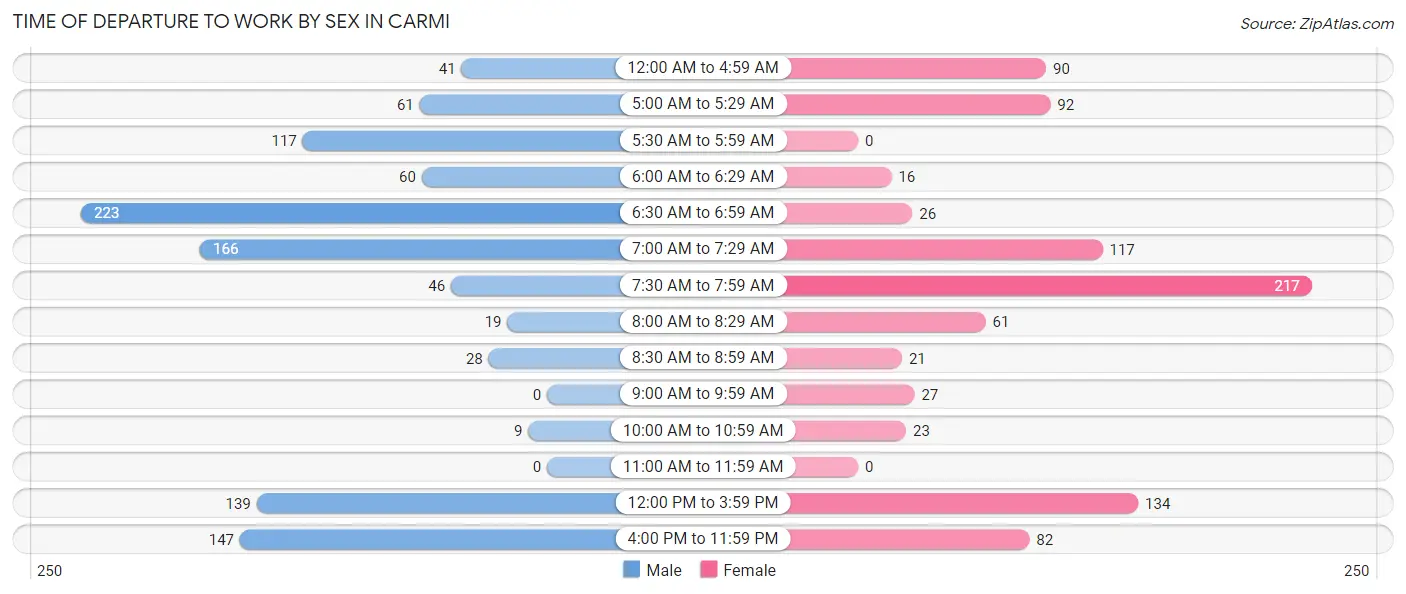
| Time of Departure | Male | Female |
| 12:00 AM to 4:59 AM | 41 (3.9%) | 90 (9.9%) |
| 5:00 AM to 5:29 AM | 61 (5.8%) | 92 (10.2%) |
| 5:30 AM to 5:59 AM | 117 (11.1%) | 0 (0.0%) |
| 6:00 AM to 6:29 AM | 60 (5.7%) | 16 (1.8%) |
| 6:30 AM to 6:59 AM | 223 (21.1%) | 26 (2.9%) |
| 7:00 AM to 7:29 AM | 166 (15.7%) | 117 (12.9%) |
| 7:30 AM to 7:59 AM | 46 (4.4%) | 217 (23.9%) |
| 8:00 AM to 8:29 AM | 19 (1.8%) | 61 (6.7%) |
| 8:30 AM to 8:59 AM | 28 (2.6%) | 21 (2.3%) |
| 9:00 AM to 9:59 AM | 0 (0.0%) | 27 (3.0%) |
| 10:00 AM to 10:59 AM | 9 (0.9%) | 23 (2.5%) |
| 11:00 AM to 11:59 AM | 0 (0.0%) | 0 (0.0%) |
| 12:00 PM to 3:59 PM | 139 (13.2%) | 134 (14.8%) |
| 4:00 PM to 11:59 PM | 147 (13.9%) | 82 (9.0%) |
| Total | 1,056 (100.0%) | 906 (100.0%) |
Housing Occupancy in Carmi
Occupancy by Ownership in Carmi
Of the total 2,170 dwellings in Carmi, owner-occupied units account for 1,411 (65.0%), while renter-occupied units make up 759 (35.0%).
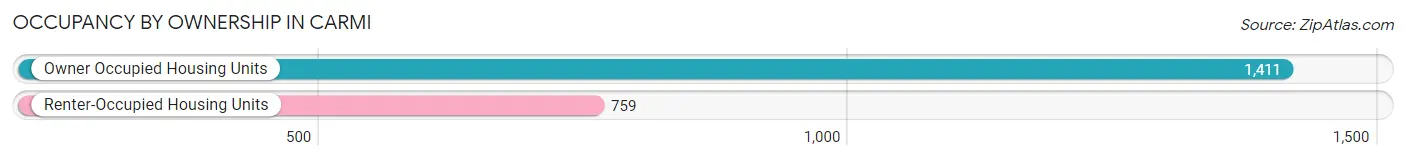
| Occupancy | # Housing Units | % Housing Units |
| Owner Occupied Housing Units | 1,411 | 65.0% |
| Renter-Occupied Housing Units | 759 | 35.0% |
| Total Occupied Housing Units | 2,170 | 100.0% |
Occupancy by Household Size in Carmi
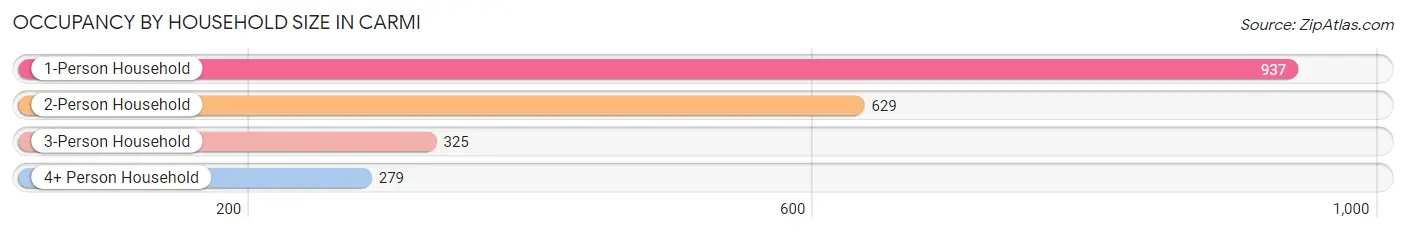
| Household Size | # Housing Units | % Housing Units |
| 1-Person Household | 937 | 43.2% |
| 2-Person Household | 629 | 29.0% |
| 3-Person Household | 325 | 15.0% |
| 4+ Person Household | 279 | 12.9% |
| Total Housing Units | 2,170 | 100.0% |
Occupancy by Ownership by Household Size in Carmi
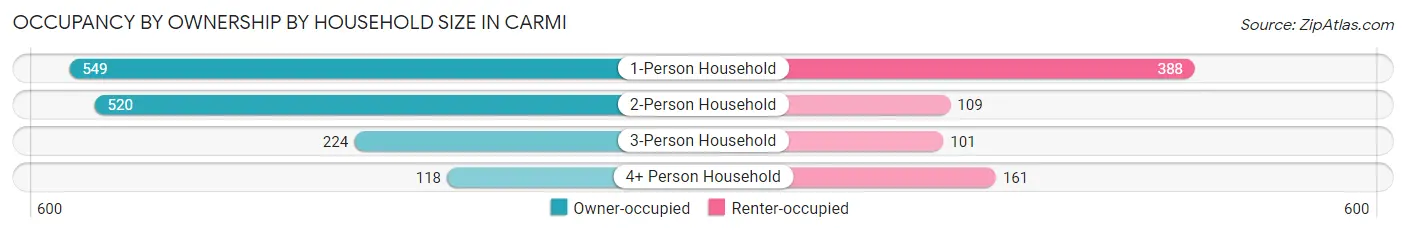
| Household Size | Owner-occupied | Renter-occupied |
| 1-Person Household | 549 (58.6%) | 388 (41.4%) |
| 2-Person Household | 520 (82.7%) | 109 (17.3%) |
| 3-Person Household | 224 (68.9%) | 101 (31.1%) |
| 4+ Person Household | 118 (42.3%) | 161 (57.7%) |
| Total Housing Units | 1,411 (65.0%) | 759 (35.0%) |
Occupancy by Educational Attainment in Carmi
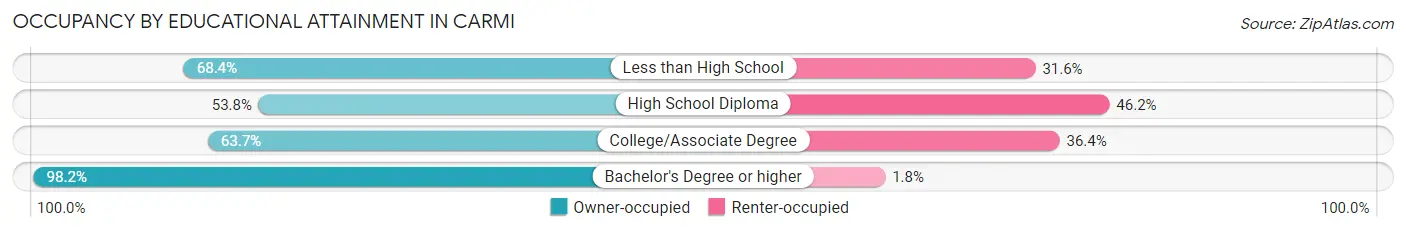
| Household Size | Owner-occupied | Renter-occupied |
| Less than High School | 104 (68.4%) | 48 (31.6%) |
| High School Diploma | 400 (53.8%) | 344 (46.2%) |
| College/Associate Degree | 634 (63.6%) | 362 (36.3%) |
| Bachelor's Degree or higher | 273 (98.2%) | 5 (1.8%) |
Occupancy by Age of Householder in Carmi
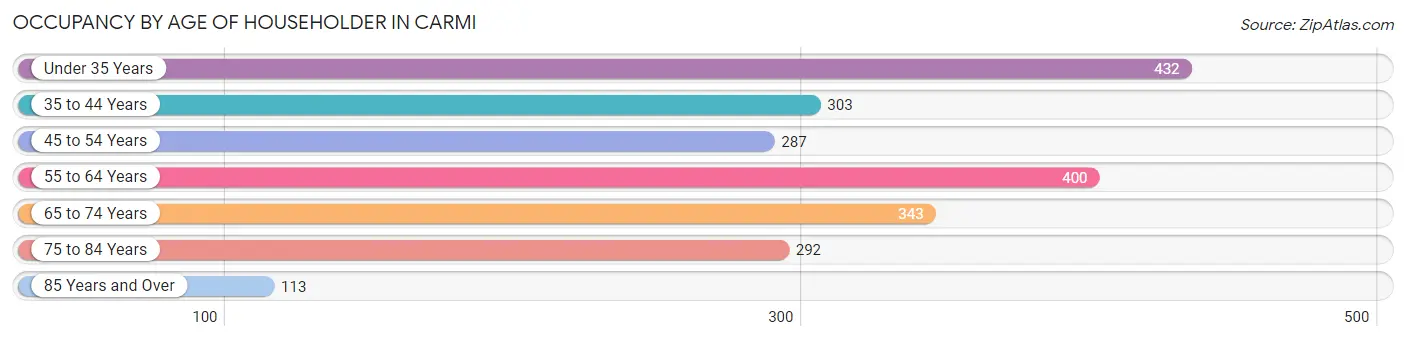
| Age Bracket | # Households | % Households |
| Under 35 Years | 432 | 19.9% |
| 35 to 44 Years | 303 | 14.0% |
| 45 to 54 Years | 287 | 13.2% |
| 55 to 64 Years | 400 | 18.4% |
| 65 to 74 Years | 343 | 15.8% |
| 75 to 84 Years | 292 | 13.5% |
| 85 Years and Over | 113 | 5.2% |
| Total | 2,170 | 100.0% |
Housing Finances in Carmi
Median Income by Occupancy in Carmi
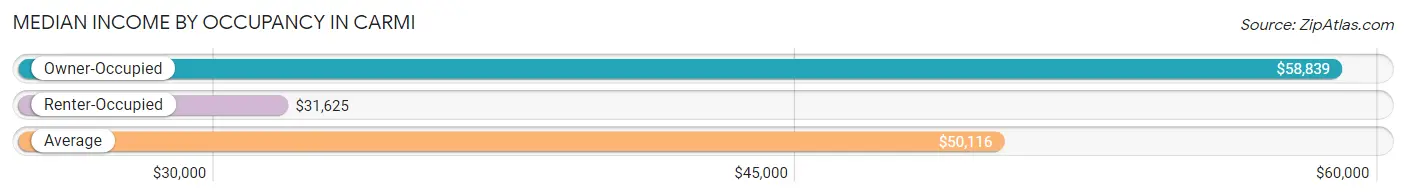
| Occupancy Type | # Households | Median Income |
| Owner-Occupied | 1,411 (65.0%) | $58,839 |
| Renter-Occupied | 759 (35.0%) | $31,625 |
| Average | 2,170 (100.0%) | $50,116 |
Occupancy by Householder Income Bracket in Carmi
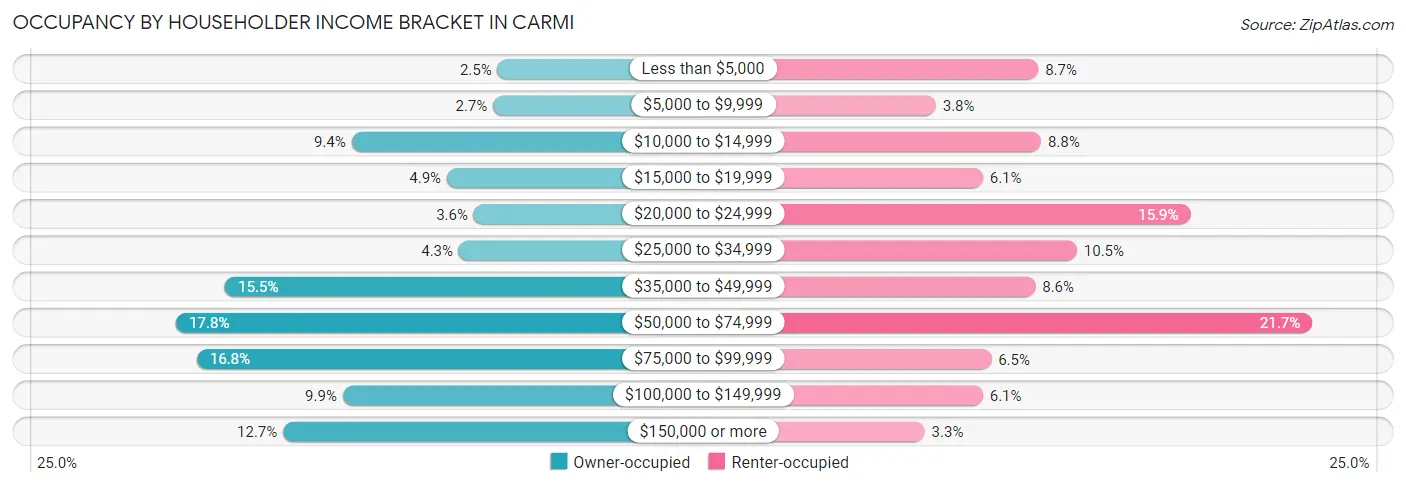
| Income Bracket | Owner-occupied | Renter-occupied |
| Less than $5,000 | 35 (2.5%) | 66 (8.7%) |
| $5,000 to $9,999 | 38 (2.7%) | 29 (3.8%) |
| $10,000 to $14,999 | 133 (9.4%) | 67 (8.8%) |
| $15,000 to $19,999 | 69 (4.9%) | 46 (6.1%) |
| $20,000 to $24,999 | 51 (3.6%) | 121 (15.9%) |
| $25,000 to $34,999 | 61 (4.3%) | 80 (10.5%) |
| $35,000 to $49,999 | 218 (15.4%) | 65 (8.6%) |
| $50,000 to $74,999 | 251 (17.8%) | 165 (21.7%) |
| $75,000 to $99,999 | 237 (16.8%) | 49 (6.5%) |
| $100,000 to $149,999 | 139 (9.9%) | 46 (6.1%) |
| $150,000 or more | 179 (12.7%) | 25 (3.3%) |
| Total | 1,411 (100.0%) | 759 (100.0%) |
Monthly Housing Cost Tiers in Carmi
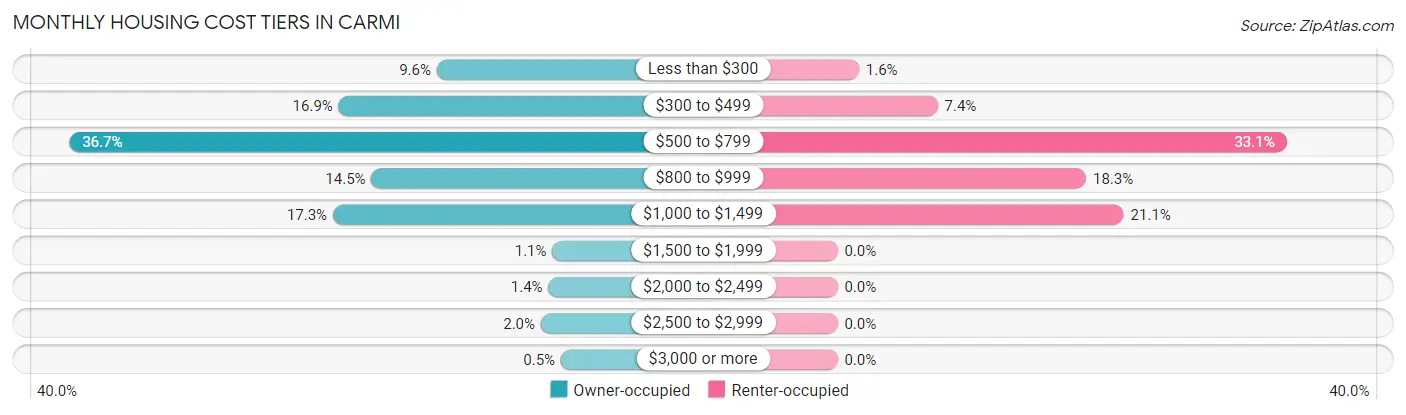
| Monthly Cost | Owner-occupied | Renter-occupied |
| Less than $300 | 136 (9.6%) | 12 (1.6%) |
| $300 to $499 | 238 (16.9%) | 56 (7.4%) |
| $500 to $799 | 518 (36.7%) | 251 (33.1%) |
| $800 to $999 | 204 (14.5%) | 139 (18.3%) |
| $1,000 to $1,499 | 244 (17.3%) | 160 (21.1%) |
| $1,500 to $1,999 | 16 (1.1%) | 0 (0.0%) |
| $2,000 to $2,499 | 20 (1.4%) | 0 (0.0%) |
| $2,500 to $2,999 | 28 (2.0%) | 0 (0.0%) |
| $3,000 or more | 7 (0.5%) | 0 (0.0%) |
| Total | 1,411 (100.0%) | 759 (100.0%) |
Physical Housing Characteristics in Carmi
Housing Structures in Carmi
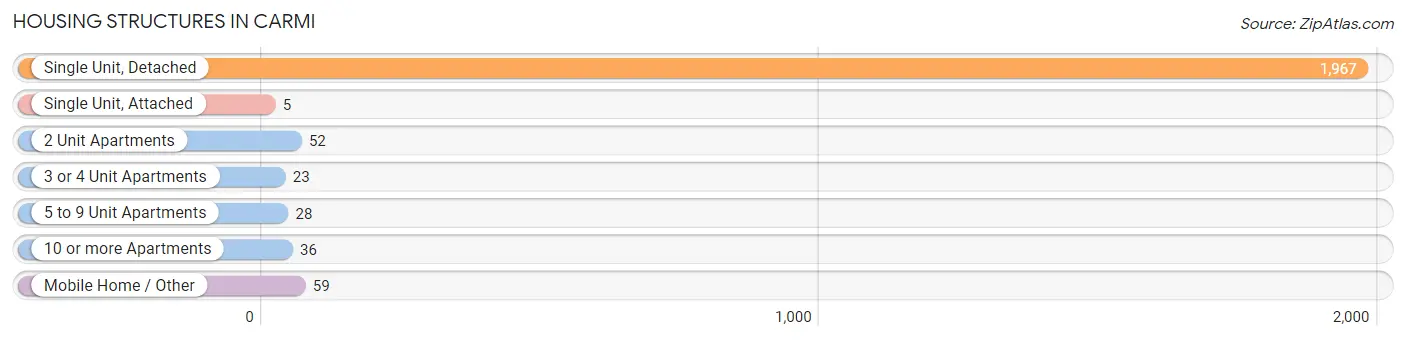
| Structure Type | # Housing Units | % Housing Units |
| Single Unit, Detached | 1,967 | 90.6% |
| Single Unit, Attached | 5 | 0.2% |
| 2 Unit Apartments | 52 | 2.4% |
| 3 or 4 Unit Apartments | 23 | 1.1% |
| 5 to 9 Unit Apartments | 28 | 1.3% |
| 10 or more Apartments | 36 | 1.7% |
| Mobile Home / Other | 59 | 2.7% |
| Total | 2,170 | 100.0% |
Housing Structures by Occupancy in Carmi
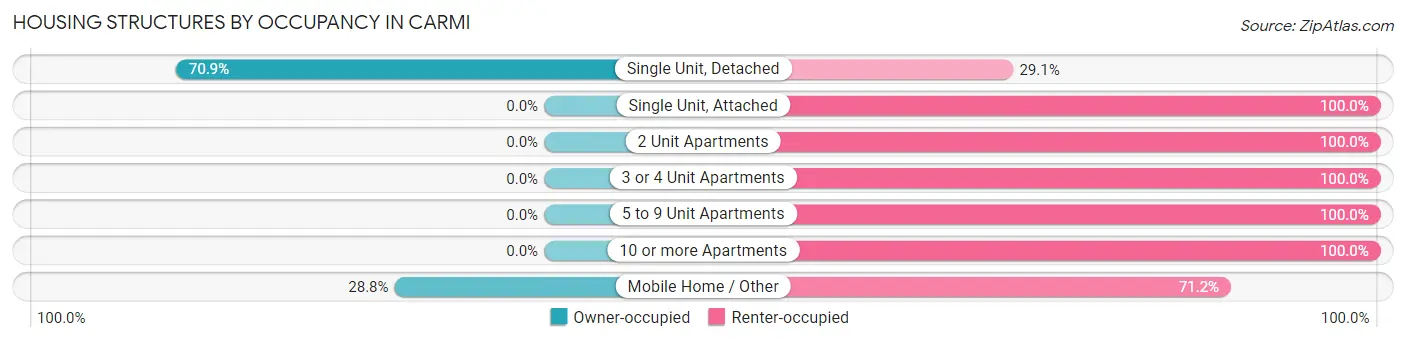
| Structure Type | Owner-occupied | Renter-occupied |
| Single Unit, Detached | 1,394 (70.9%) | 573 (29.1%) |
| Single Unit, Attached | 0 (0.0%) | 5 (100.0%) |
| 2 Unit Apartments | 0 (0.0%) | 52 (100.0%) |
| 3 or 4 Unit Apartments | 0 (0.0%) | 23 (100.0%) |
| 5 to 9 Unit Apartments | 0 (0.0%) | 28 (100.0%) |
| 10 or more Apartments | 0 (0.0%) | 36 (100.0%) |
| Mobile Home / Other | 17 (28.8%) | 42 (71.2%) |
| Total | 1,411 (65.0%) | 759 (35.0%) |
Housing Structures by Number of Rooms in Carmi
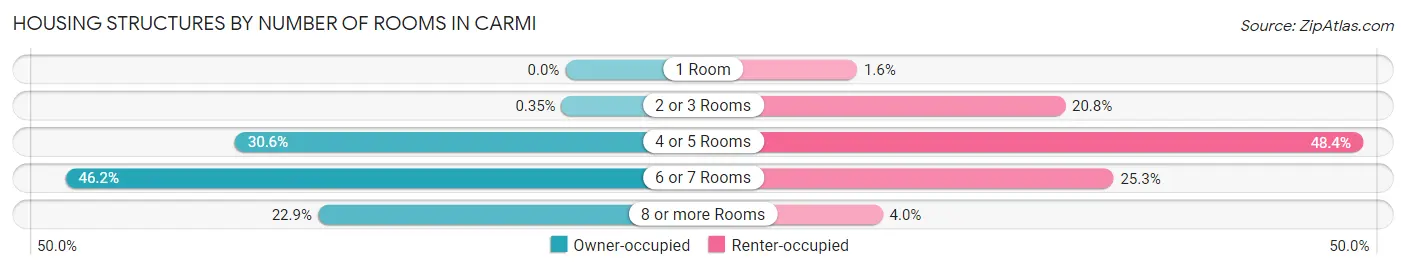
| Number of Rooms | Owner-occupied | Renter-occupied |
| 1 Room | 0 (0.0%) | 12 (1.6%) |
| 2 or 3 Rooms | 5 (0.4%) | 158 (20.8%) |
| 4 or 5 Rooms | 431 (30.5%) | 367 (48.3%) |
| 6 or 7 Rooms | 652 (46.2%) | 192 (25.3%) |
| 8 or more Rooms | 323 (22.9%) | 30 (4.0%) |
| Total | 1,411 (100.0%) | 759 (100.0%) |
Housing Structure by Heating Type in Carmi
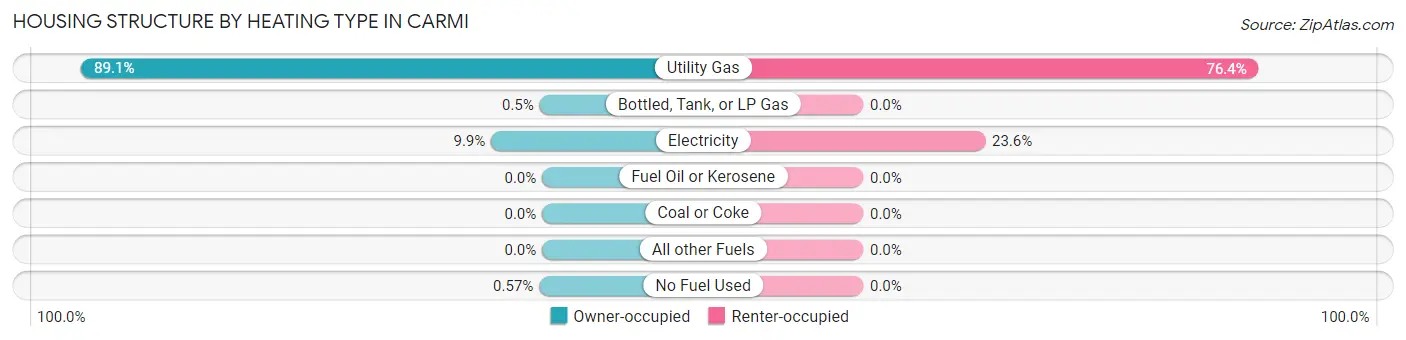
| Heating Type | Owner-occupied | Renter-occupied |
| Utility Gas | 1,257 (89.1%) | 580 (76.4%) |
| Bottled, Tank, or LP Gas | 7 (0.5%) | 0 (0.0%) |
| Electricity | 139 (9.9%) | 179 (23.6%) |
| Fuel Oil or Kerosene | 0 (0.0%) | 0 (0.0%) |
| Coal or Coke | 0 (0.0%) | 0 (0.0%) |
| All other Fuels | 0 (0.0%) | 0 (0.0%) |
| No Fuel Used | 8 (0.6%) | 0 (0.0%) |
| Total | 1,411 (100.0%) | 759 (100.0%) |
Household Vehicle Usage in Carmi
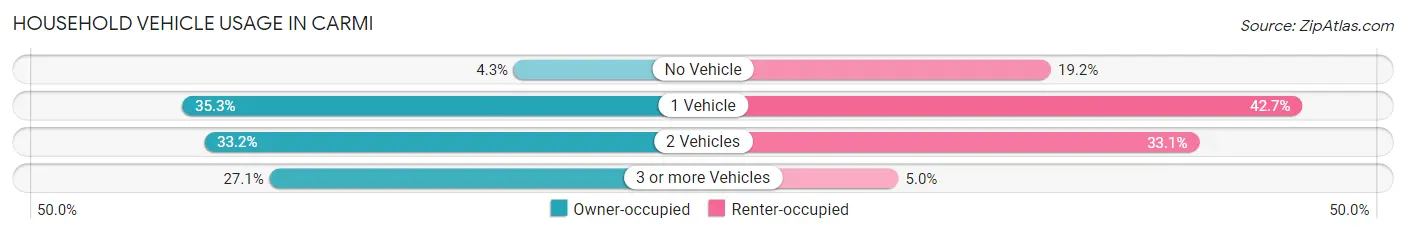
| Vehicles per Household | Owner-occupied | Renter-occupied |
| No Vehicle | 61 (4.3%) | 146 (19.2%) |
| 1 Vehicle | 498 (35.3%) | 324 (42.7%) |
| 2 Vehicles | 469 (33.2%) | 251 (33.1%) |
| 3 or more Vehicles | 383 (27.1%) | 38 (5.0%) |
| Total | 1,411 (100.0%) | 759 (100.0%) |
Real Estate & Mortgages in Carmi
Real Estate and Mortgage Overview in Carmi
| Characteristic | Without Mortgage | With Mortgage |
| Housing Units | 791 | 620 |
| Median Property Value | $106,600 | $89,400 |
| Median Household Income | $52,450 | $68 |
| Monthly Housing Costs | $534 | $7 |
| Real Estate Taxes | $2,006 | $83 |
Property Value by Mortgage Status in Carmi
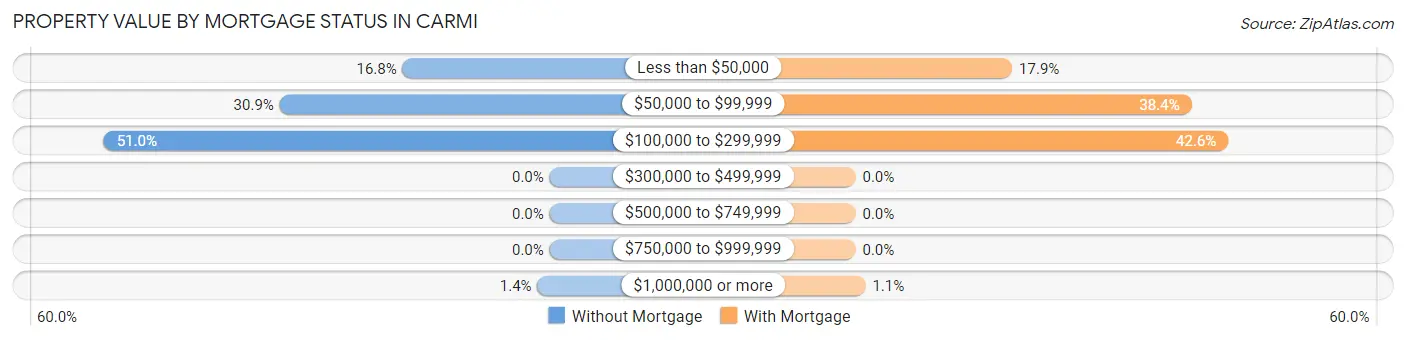
| Property Value | Without Mortgage | With Mortgage |
| Less than $50,000 | 133 (16.8%) | 111 (17.9%) |
| $50,000 to $99,999 | 244 (30.8%) | 238 (38.4%) |
| $100,000 to $299,999 | 403 (50.9%) | 264 (42.6%) |
| $300,000 to $499,999 | 0 (0.0%) | 0 (0.0%) |
| $500,000 to $749,999 | 0 (0.0%) | 0 (0.0%) |
| $750,000 to $999,999 | 0 (0.0%) | 0 (0.0%) |
| $1,000,000 or more | 11 (1.4%) | 7 (1.1%) |
| Total | 791 (100.0%) | 620 (100.0%) |
Household Income by Mortgage Status in Carmi
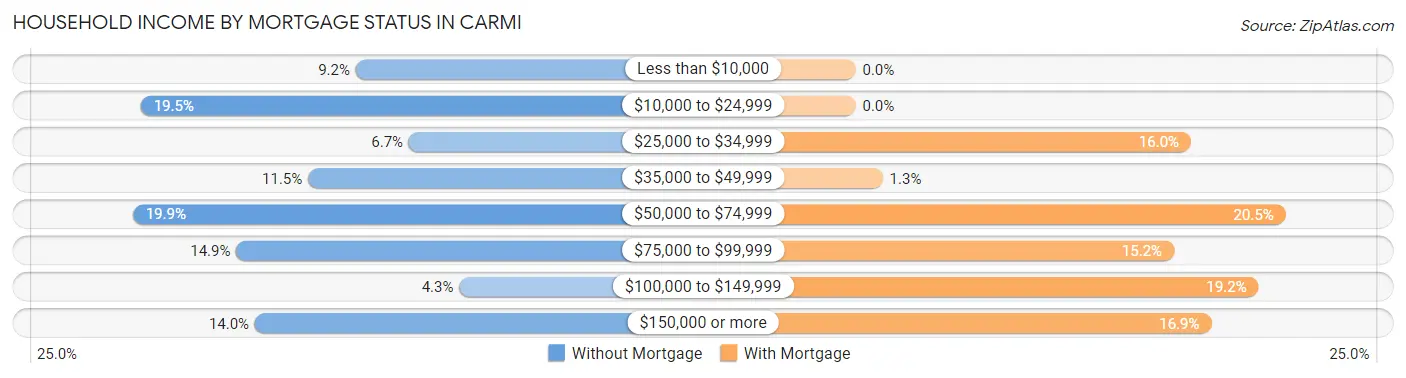
| Household Income | Without Mortgage | With Mortgage |
| Less than $10,000 | 73 (9.2%) | 0 (0.0%) |
| $10,000 to $24,999 | 154 (19.5%) | 0 (0.0%) |
| $25,000 to $34,999 | 53 (6.7%) | 99 (16.0%) |
| $35,000 to $49,999 | 91 (11.5%) | 8 (1.3%) |
| $50,000 to $74,999 | 157 (19.9%) | 127 (20.5%) |
| $75,000 to $99,999 | 118 (14.9%) | 94 (15.2%) |
| $100,000 to $149,999 | 34 (4.3%) | 119 (19.2%) |
| $150,000 or more | 111 (14.0%) | 105 (16.9%) |
| Total | 791 (100.0%) | 620 (100.0%) |
Property Value to Household Income Ratio in Carmi
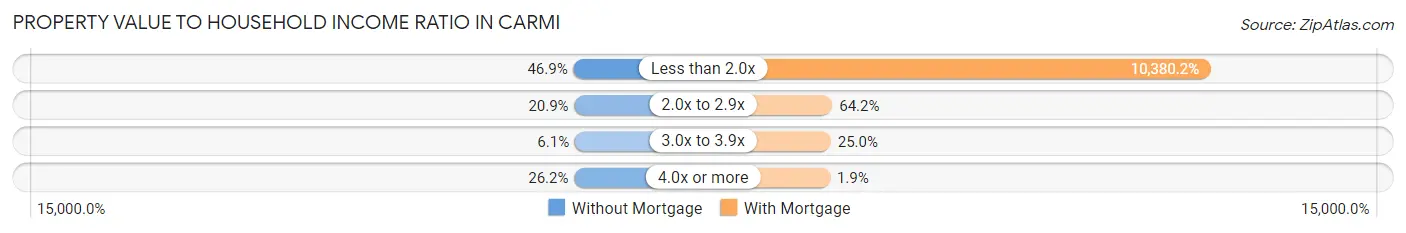
| Value-to-Income Ratio | Without Mortgage | With Mortgage |
| Less than 2.0x | 371 (46.9%) | 64,357 (10,380.2%) |
| 2.0x to 2.9x | 165 (20.9%) | 398 (64.2%) |
| 3.0x to 3.9x | 48 (6.1%) | 155 (25.0%) |
| 4.0x or more | 207 (26.2%) | 12 (1.9%) |
| Total | 791 (100.0%) | 620 (100.0%) |
Real Estate Taxes by Mortgage Status in Carmi
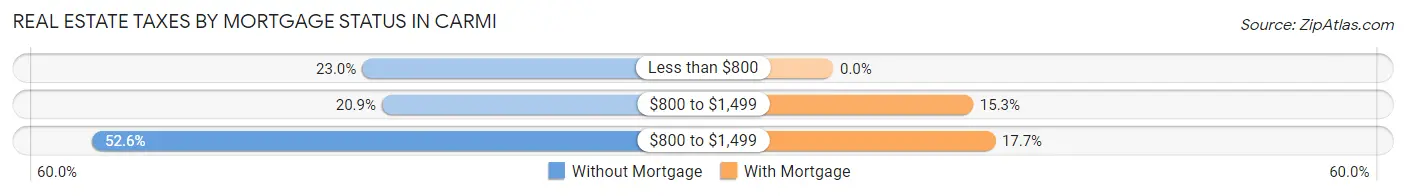
| Property Taxes | Without Mortgage | With Mortgage |
| Less than $800 | 182 (23.0%) | 0 (0.0%) |
| $800 to $1,499 | 165 (20.9%) | 95 (15.3%) |
| $800 to $1,499 | 416 (52.6%) | 110 (17.7%) |
| Total | 791 (100.0%) | 620 (100.0%) |
Health & Disability in Carmi
Health Insurance Coverage by Age in Carmi
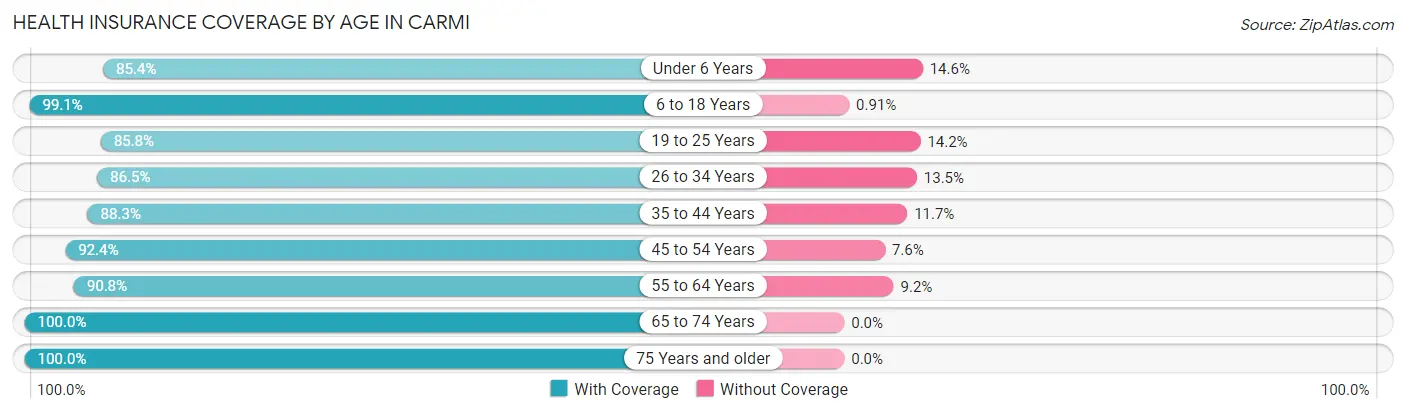
| Age Bracket | With Coverage | Without Coverage |
| Under 6 Years | 286 (85.4%) | 49 (14.6%) |
| 6 to 18 Years | 765 (99.1%) | 7 (0.9%) |
| 19 to 25 Years | 284 (85.8%) | 47 (14.2%) |
| 26 to 34 Years | 460 (86.5%) | 72 (13.5%) |
| 35 to 44 Years | 489 (88.3%) | 65 (11.7%) |
| 45 to 54 Years | 524 (92.4%) | 43 (7.6%) |
| 55 to 64 Years | 652 (90.8%) | 66 (9.2%) |
| 65 to 74 Years | 489 (100.0%) | 0 (0.0%) |
| 75 Years and older | 515 (100.0%) | 0 (0.0%) |
| Total | 4,464 (92.7%) | 349 (7.2%) |
Health Insurance Coverage by Citizenship Status in Carmi
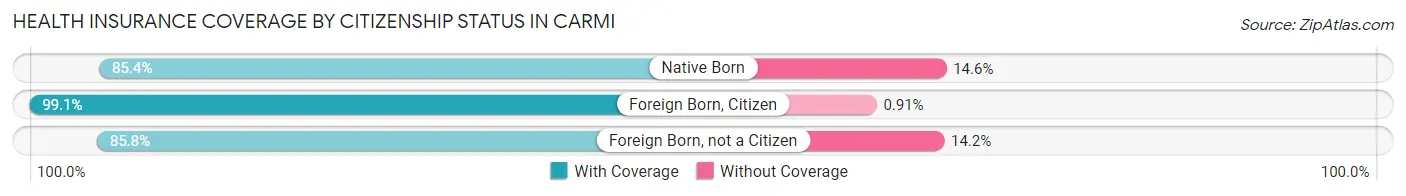
| Citizenship Status | With Coverage | Without Coverage |
| Native Born | 286 (85.4%) | 49 (14.6%) |
| Foreign Born, Citizen | 765 (99.1%) | 7 (0.9%) |
| Foreign Born, not a Citizen | 284 (85.8%) | 47 (14.2%) |
Health Insurance Coverage by Household Income in Carmi
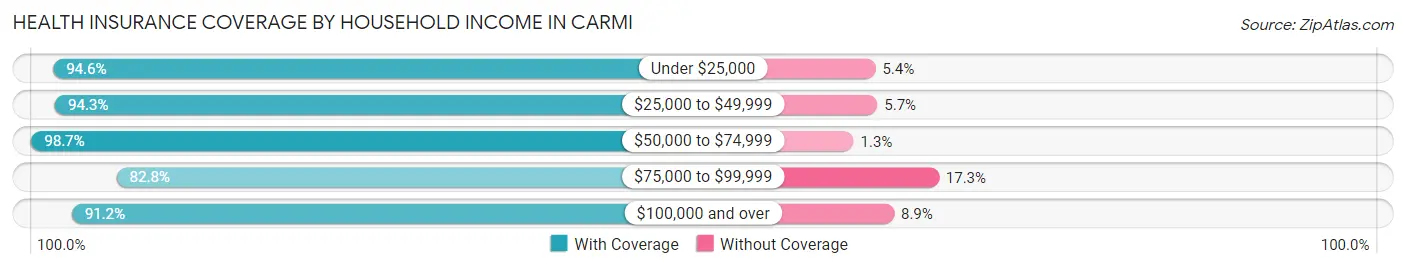
| Household Income | With Coverage | Without Coverage |
| Under $25,000 | 898 (94.6%) | 51 (5.4%) |
| $25,000 to $49,999 | 742 (94.3%) | 45 (5.7%) |
| $50,000 to $74,999 | 1,164 (98.7%) | 15 (1.3%) |
| $75,000 to $99,999 | 691 (82.8%) | 144 (17.2%) |
| $100,000 and over | 968 (91.1%) | 94 (8.8%) |
Public vs Private Health Insurance Coverage by Age in Carmi
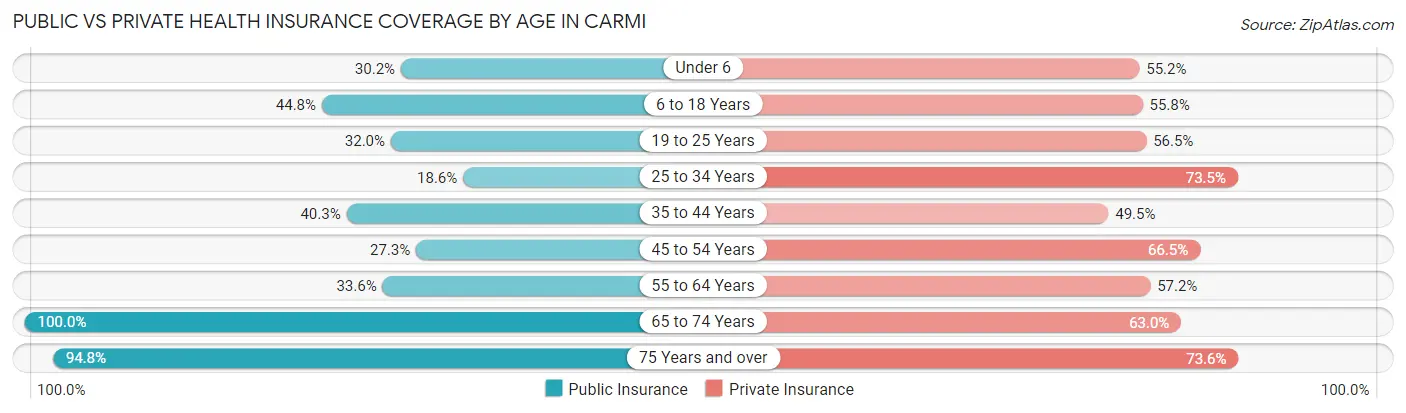
| Age Bracket | Public Insurance | Private Insurance |
| Under 6 | 101 (30.1%) | 185 (55.2%) |
| 6 to 18 Years | 346 (44.8%) | 431 (55.8%) |
| 19 to 25 Years | 106 (32.0%) | 187 (56.5%) |
| 25 to 34 Years | 99 (18.6%) | 391 (73.5%) |
| 35 to 44 Years | 223 (40.3%) | 274 (49.5%) |
| 45 to 54 Years | 155 (27.3%) | 377 (66.5%) |
| 55 to 64 Years | 241 (33.6%) | 411 (57.2%) |
| 65 to 74 Years | 489 (100.0%) | 308 (63.0%) |
| 75 Years and over | 488 (94.8%) | 379 (73.6%) |
| Total | 2,248 (46.7%) | 2,943 (61.2%) |
Disability Status by Sex by Age in Carmi
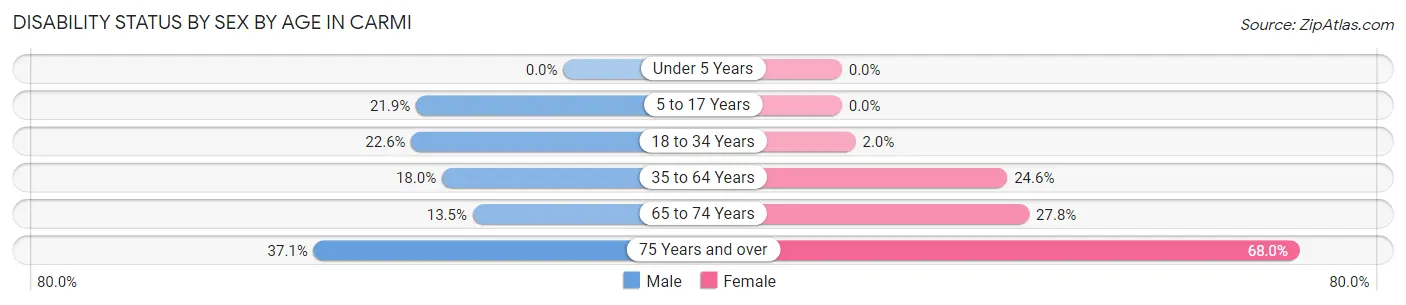
| Age Bracket | Male | Female |
| Under 5 Years | 0 (0.0%) | 0 (0.0%) |
| 5 to 17 Years | 75 (21.9%) | 0 (0.0%) |
| 18 to 34 Years | 104 (22.6%) | 10 (2.0%) |
| 35 to 64 Years | 173 (18.0%) | 216 (24.6%) |
| 65 to 74 Years | 30 (13.5%) | 74 (27.8%) |
| 75 Years and over | 89 (37.1%) | 187 (68.0%) |
Disability Class by Sex by Age in Carmi
Disability Class: Hearing Difficulty
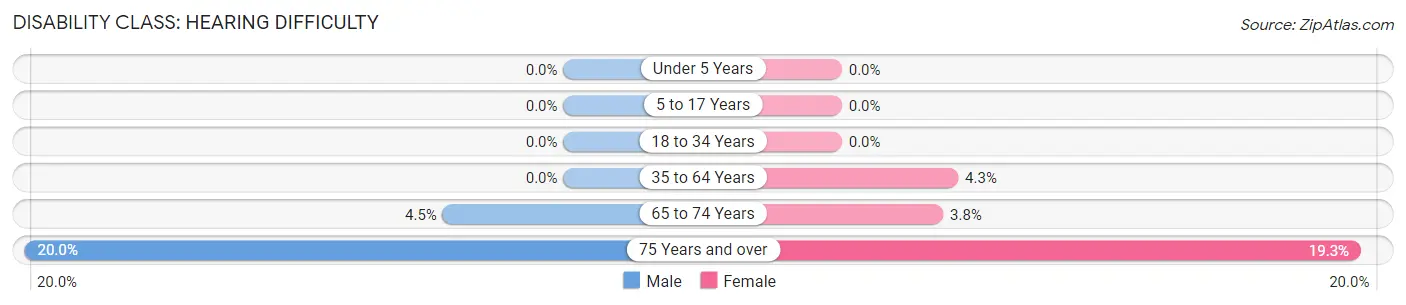
| Age Bracket | Male | Female |
| Under 5 Years | 0 (0.0%) | 0 (0.0%) |
| 5 to 17 Years | 0 (0.0%) | 0 (0.0%) |
| 18 to 34 Years | 0 (0.0%) | 0 (0.0%) |
| 35 to 64 Years | 0 (0.0%) | 38 (4.3%) |
| 65 to 74 Years | 10 (4.5%) | 10 (3.8%) |
| 75 Years and over | 48 (20.0%) | 53 (19.3%) |
Disability Class: Vision Difficulty
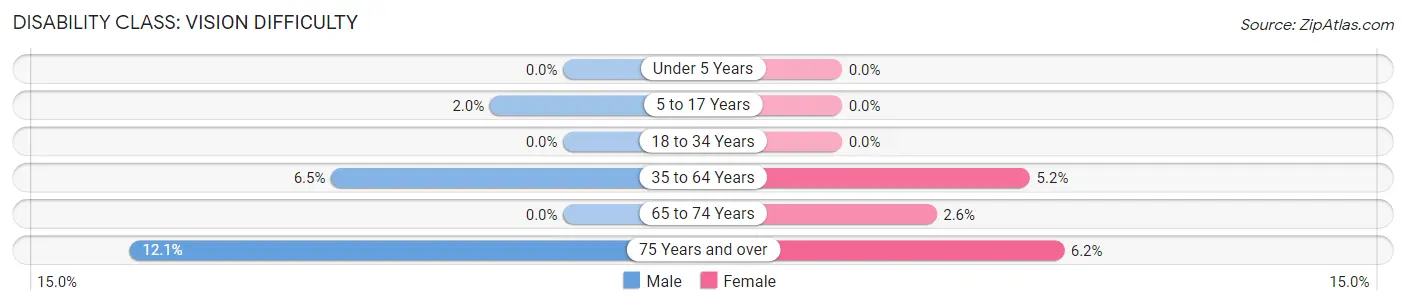
| Age Bracket | Male | Female |
| Under 5 Years | 0 (0.0%) | 0 (0.0%) |
| 5 to 17 Years | 7 (2.0%) | 0 (0.0%) |
| 18 to 34 Years | 0 (0.0%) | 0 (0.0%) |
| 35 to 64 Years | 62 (6.5%) | 46 (5.2%) |
| 65 to 74 Years | 0 (0.0%) | 7 (2.6%) |
| 75 Years and over | 29 (12.1%) | 17 (6.2%) |
Disability Class: Cognitive Difficulty
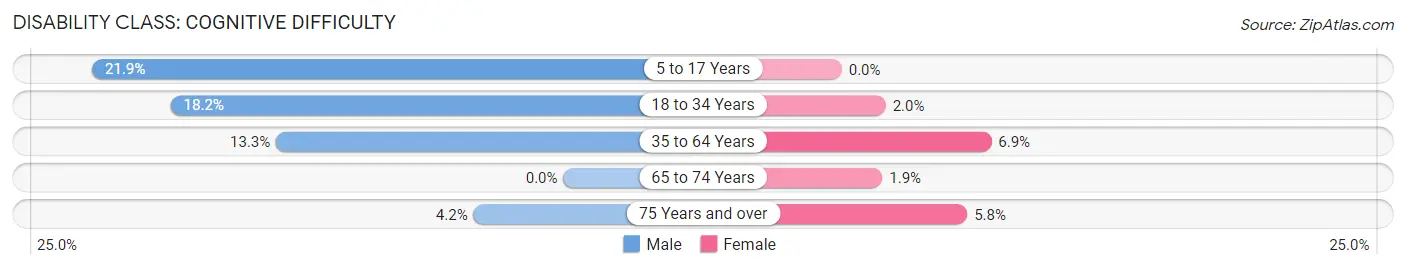
| Age Bracket | Male | Female |
| 5 to 17 Years | 75 (21.9%) | 0 (0.0%) |
| 18 to 34 Years | 84 (18.2%) | 10 (2.0%) |
| 35 to 64 Years | 128 (13.3%) | 61 (6.9%) |
| 65 to 74 Years | 0 (0.0%) | 5 (1.9%) |
| 75 Years and over | 10 (4.2%) | 16 (5.8%) |
Disability Class: Ambulatory Difficulty
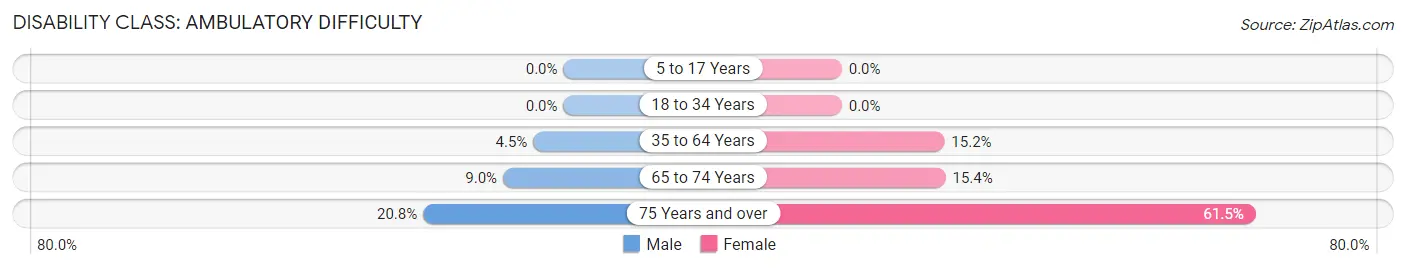
| Age Bracket | Male | Female |
| 5 to 17 Years | 0 (0.0%) | 0 (0.0%) |
| 18 to 34 Years | 0 (0.0%) | 0 (0.0%) |
| 35 to 64 Years | 43 (4.5%) | 134 (15.2%) |
| 65 to 74 Years | 20 (9.0%) | 41 (15.4%) |
| 75 Years and over | 50 (20.8%) | 169 (61.5%) |
Disability Class: Self-Care Difficulty
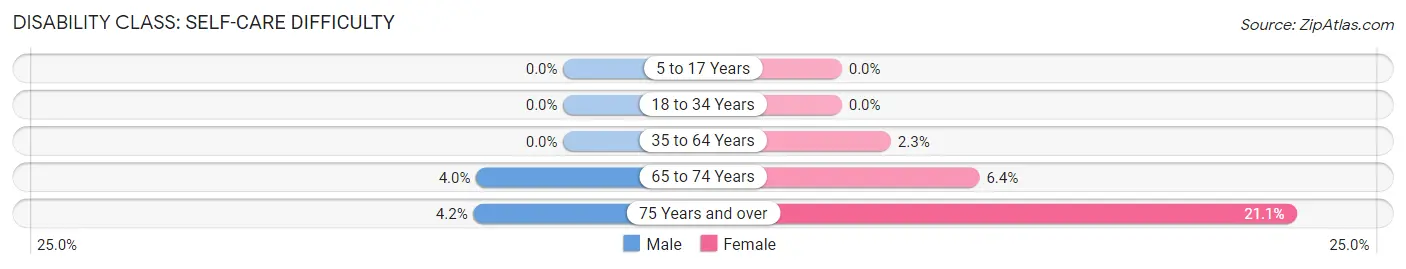
| Age Bracket | Male | Female |
| 5 to 17 Years | 0 (0.0%) | 0 (0.0%) |
| 18 to 34 Years | 0 (0.0%) | 0 (0.0%) |
| 35 to 64 Years | 0 (0.0%) | 20 (2.3%) |
| 65 to 74 Years | 9 (4.0%) | 17 (6.4%) |
| 75 Years and over | 10 (4.2%) | 58 (21.1%) |
Technology Access in Carmi
Computing Device Access in Carmi
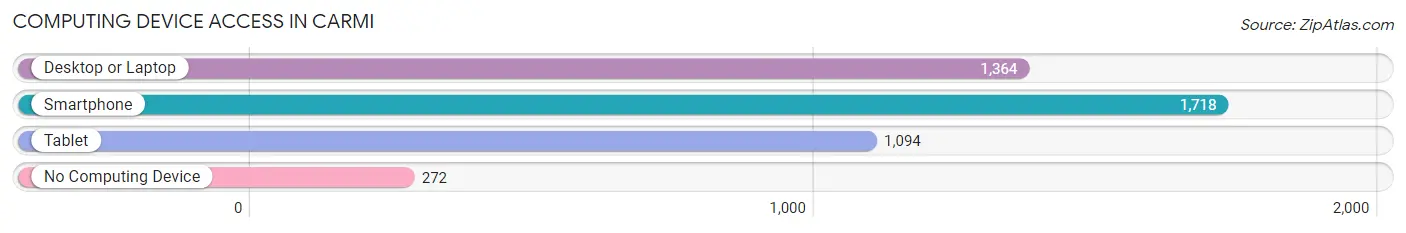
| Device Type | # Households | % Households |
| Desktop or Laptop | 1,364 | 62.9% |
| Smartphone | 1,718 | 79.2% |
| Tablet | 1,094 | 50.4% |
| No Computing Device | 272 | 12.5% |
| Total | 2,170 | 100.0% |
Internet Access in Carmi
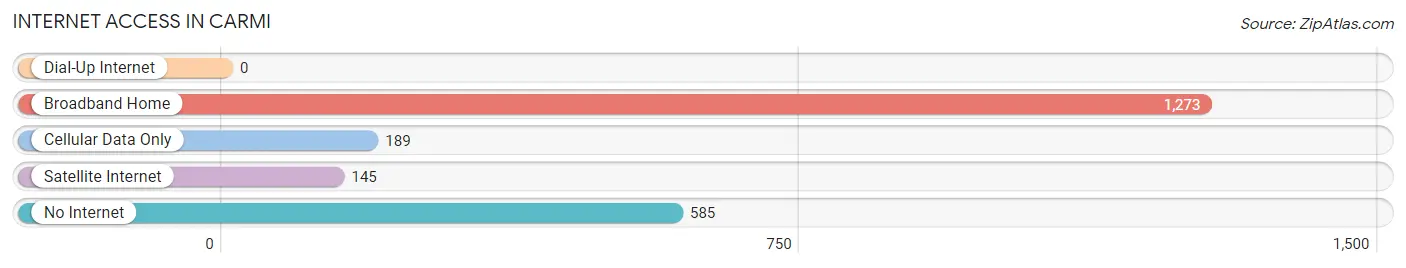
| Internet Type | # Households | % Households |
| Dial-Up Internet | 0 | 0.0% |
| Broadband Home | 1,273 | 58.7% |
| Cellular Data Only | 189 | 8.7% |
| Satellite Internet | 145 | 6.7% |
| No Internet | 585 | 27.0% |
| Total | 2,170 | 100.0% |
Carmi Summary
Carmi is a city located in White County, Illinois, United States. It is the county seat of White County. The population was 5,422 at the 2010 census.
History
Carmi was founded in 1817 by John Carmichael, a Revolutionary War veteran. The town was originally known as Carmichael's Station, and was later shortened to Carmi. The town was incorporated in 1837.
Carmi was the site of a major Civil War battle in 1862, when Confederate forces under General Nathan Bedford Forrest attempted to capture the town. The Union forces were able to repel the attack, and the town remained in Union hands for the remainder of the war.
Geography
Carmi is located at the intersection of U.S. Route 45 and Illinois Route 1. It is situated in the southeastern corner of White County, near the Wabash River. The city has a total area of 2.2 square miles, all of which is land.
Economy
Carmi's economy is largely based on agriculture and manufacturing. The city is home to several large manufacturing plants, including a Tyson Foods poultry processing plant and a General Electric lighting plant. The city is also home to several small businesses, including restaurants, retail stores, and service providers.
Demographics
As of the 2010 census, there were 5,422 people, 2,093 households, and 1,372 families residing in the city. The population density was 2,457.2 people per square mile. The racial makeup of the city was 97.2% White, 0.7% African American, 0.2% Native American, 0.3% Asian, 0.2% from other races, and 1.4% from two or more races. Hispanic or Latino of any race were 1.2% of the population.
The median income for a household in the city was $35,938, and the median income for a family was $45,938. The per capita income for the city was $17,938. About 16.2% of families and 19.2% of the population were below the poverty line, including 25.2% of those under age 18 and 11.2% of those age 65 or over.
Conclusion
Carmi is a small city located in White County, Illinois. It has a long history, dating back to its founding in 1817. The city's economy is largely based on agriculture and manufacturing, and it is home to several large manufacturing plants. The population of Carmi is 5,422, with a median household income of $35,938. The city has a diverse racial makeup, with 97.2% of the population being White, 0.7% African American, 0.2% Native American, 0.3% Asian, and 1.4% from two or more races.
Common Questions
What is Per Capita Income in Carmi?
Per Capita income in Carmi is $28,910.
What is the Median Family Income in Carmi?
Median Family Income in Carmi is $69,375.
What is the Median Household income in Carmi?
Median Household Income in Carmi is $50,116.
What is Income or Wage Gap in Carmi?
Income or Wage Gap in Carmi is 19.5%.
Women in Carmi earn 80.5 cents for every dollar earned by a man.
What is Inequality or Gini Index in Carmi?
Inequality or Gini Index in Carmi is 0.46.
What is the Total Population of Carmi?
Total Population of Carmi is 5,042.
What is the Total Male Population of Carmi?
Total Male Population of Carmi is 2,477.
What is the Total Female Population of Carmi?
Total Female Population of Carmi is 2,565.
What is the Ratio of Males per 100 Females in Carmi?
There are 96.57 Males per 100 Females in Carmi.
What is the Ratio of Females per 100 Males in Carmi?
There are 103.55 Females per 100 Males in Carmi.
What is the Median Population Age in Carmi?
Median Population Age in Carmi is 44.7 Years.
What is the Average Family Size in Carmi
Average Family Size in Carmi is 3.0 People.
What is the Average Household Size in Carmi
Average Household Size in Carmi is 2.2 People.
How Large is the Labor Force in Carmi?
There are 2,082 People in the Labor Forcein in Carmi.
What is the Percentage of People in the Labor Force in Carmi?
50.7% of People are in the Labor Force in Carmi.
What is the Unemployment Rate in Carmi?
Unemployment Rate in Carmi is 1.9%.