Morris, IL Map & Demographics
Morris Map
Morris Overview
$38,503
PER CAPITA INCOME
$96,530
AVG FAMILY INCOME
$73,909
AVG HOUSEHOLD INCOME
49.3%
WAGE / INCOME GAP [ % ]
50.7¢/ $1
WAGE / INCOME GAP [ $ ]
0.38
INEQUALITY / GINI INDEX
14,491
TOTAL POPULATION
7,228
MALE POPULATION
7,263
FEMALE POPULATION
99.52
MALES / 100 FEMALES
100.48
FEMALES / 100 MALES
39.5
MEDIAN AGE
3.0
AVG FAMILY SIZE
2.3
AVG HOUSEHOLD SIZE
7,521
LABOR FORCE [ PEOPLE ]
64.7%
PERCENT IN LABOR FORCE
2.2%
UNEMPLOYMENT RATE
Morris Zip Codes
Morris Area Codes
Income in Morris
Income Overview in Morris
Per Capita Income in Morris is $38,503, while median incomes of families and households are $96,530 and $73,909 respectively.
| Characteristic | Number | Measure |
| Per Capita Income | 14,491 | $38,503 |
| Median Family Income | 3,765 | $96,530 |
| Mean Family Income | 3,765 | $103,954 |
| Median Household Income | 6,258 | $73,909 |
| Mean Household Income | 6,258 | $86,961 |
| Income Deficit | 3,765 | $0 |
| Wage / Income Gap (%) | 14,491 | 49.30% |
| Wage / Income Gap ($) | 14,491 | 50.70¢ per $1 |
| Gini / Inequality Index | 14,491 | 0.38 |
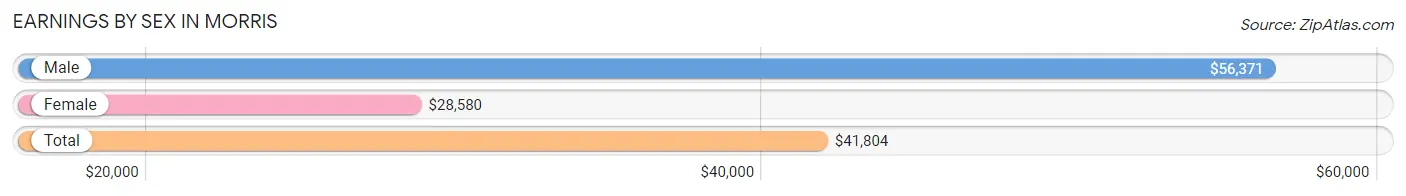
Earnings by Sex in Morris
Average Earnings in Morris are $41,804, $56,371 for men and $28,580 for women, a difference of 49.3%.
| Sex | Number | Average Earnings |
| Male | 4,276 (53.9%) | $56,371 |
| Female | 3,652 (46.1%) | $28,580 |
| Total | 7,928 (100.0%) | $41,804 |
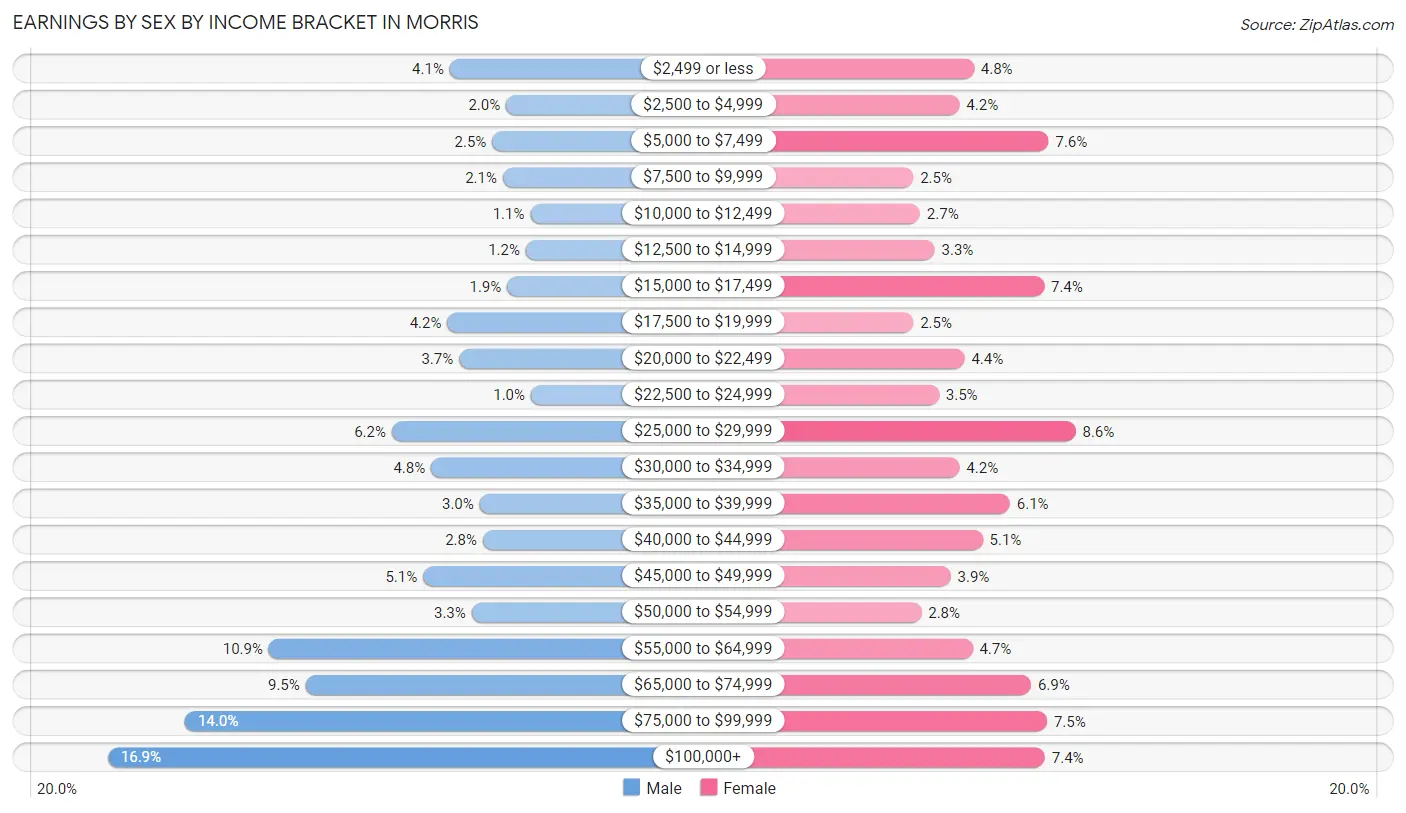
Earnings by Sex by Income Bracket in Morris
The most common earnings brackets in Morris are $100,000+ for men (722 | 16.9%) and $25,000 to $29,999 for women (313 | 8.6%).
| Income | Male | Female |
| $2,499 or less | 174 (4.1%) | 174 (4.8%) |
| $2,500 to $4,999 | 84 (2.0%) | 154 (4.2%) |
| $5,000 to $7,499 | 106 (2.5%) | 276 (7.6%) |
| $7,500 to $9,999 | 89 (2.1%) | 91 (2.5%) |
| $10,000 to $12,499 | 45 (1.1%) | 100 (2.7%) |
| $12,500 to $14,999 | 52 (1.2%) | 120 (3.3%) |
| $15,000 to $17,499 | 82 (1.9%) | 270 (7.4%) |
| $17,500 to $19,999 | 178 (4.2%) | 91 (2.5%) |
| $20,000 to $22,499 | 159 (3.7%) | 161 (4.4%) |
| $22,500 to $24,999 | 44 (1.0%) | 126 (3.5%) |
| $25,000 to $29,999 | 267 (6.2%) | 313 (8.6%) |
| $30,000 to $34,999 | 204 (4.8%) | 154 (4.2%) |
| $35,000 to $39,999 | 126 (2.9%) | 223 (6.1%) |
| $40,000 to $44,999 | 121 (2.8%) | 186 (5.1%) |
| $45,000 to $49,999 | 217 (5.1%) | 142 (3.9%) |
| $50,000 to $54,999 | 139 (3.3%) | 102 (2.8%) |
| $55,000 to $64,999 | 464 (10.8%) | 172 (4.7%) |
| $65,000 to $74,999 | 405 (9.5%) | 252 (6.9%) |
| $75,000 to $99,999 | 598 (14.0%) | 274 (7.5%) |
| $100,000+ | 722 (16.9%) | 271 (7.4%) |
| Total | 4,276 (100.0%) | 3,652 (100.0%) |
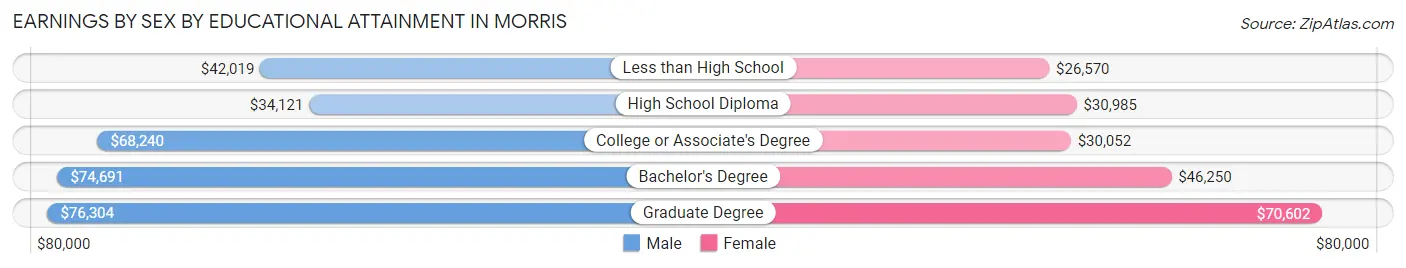
Earnings by Sex by Educational Attainment in Morris
Average earnings in Morris are $61,750 for men and $35,825 for women, a difference of 42.0%. Men with an educational attainment of graduate degree enjoy the highest average annual earnings of $76,304, while those with high school diploma education earn the least with $34,121. Women with an educational attainment of graduate degree earn the most with the average annual earnings of $70,602, while those with less than high school education have the smallest earnings of $26,570.
| Educational Attainment | Male Income | Female Income |
| Less than High School | $42,019 | $26,570 |
| High School Diploma | $34,121 | $30,985 |
| College or Associate's Degree | $68,240 | $30,052 |
| Bachelor's Degree | $74,691 | $46,250 |
| Graduate Degree | $76,304 | $70,602 |
| Total | $61,750 | $35,825 |
Family Income in Morris
Family Income Brackets in Morris
According to the Morris family income data, there are 1,005 families falling into the $100,000 to $149,999 income range, which is the most common income bracket and makes up 26.7% of all families.
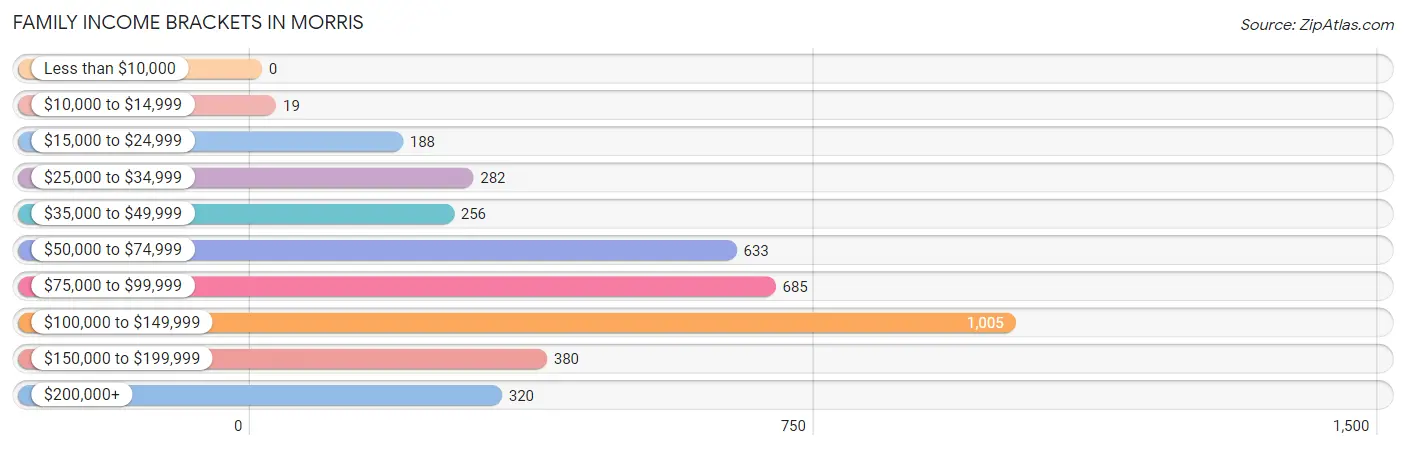
| Income Bracket | # Families | % Families |
| Less than $10,000 | 0 | 0.0% |
| $10,000 to $14,999 | 19 | 0.5% |
| $15,000 to $24,999 | 188 | 5.0% |
| $25,000 to $34,999 | 282 | 7.5% |
| $35,000 to $49,999 | 256 | 6.8% |
| $50,000 to $74,999 | 633 | 16.8% |
| $75,000 to $99,999 | 685 | 18.2% |
| $100,000 to $149,999 | 1,005 | 26.7% |
| $150,000 to $199,999 | 380 | 10.1% |
| $200,000+ | 320 | 8.5% |
Family Income by Famaliy Size in Morris
6-person families (155 | 4.1%) account for the highest median family income in Morris with $163,801 per family, while 3-person families (946 | 25.1%) have the highest median income of $36,415 per family member.
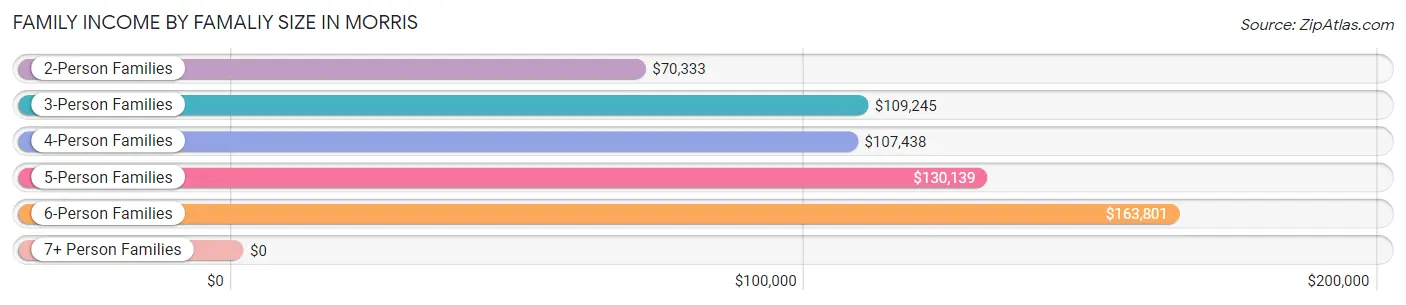
| Income Bracket | # Families | Median Income |
| 2-Person Families | 1,822 (48.4%) | $70,333 |
| 3-Person Families | 946 (25.1%) | $109,245 |
| 4-Person Families | 550 (14.6%) | $107,438 |
| 5-Person Families | 263 (7.0%) | $130,139 |
| 6-Person Families | 155 (4.1%) | $163,801 |
| 7+ Person Families | 29 (0.8%) | $0 |
| Total | 3,765 (100.0%) | $96,530 |
Family Income by Number of Earners in Morris
The median family income in Morris is $96,530, with families comprising 3+ earners (514) having the highest median family income of $124,833, while families with no earners (510) have the lowest median family income of $70,333, accounting for 13.7% and 13.6% of families, respectively.
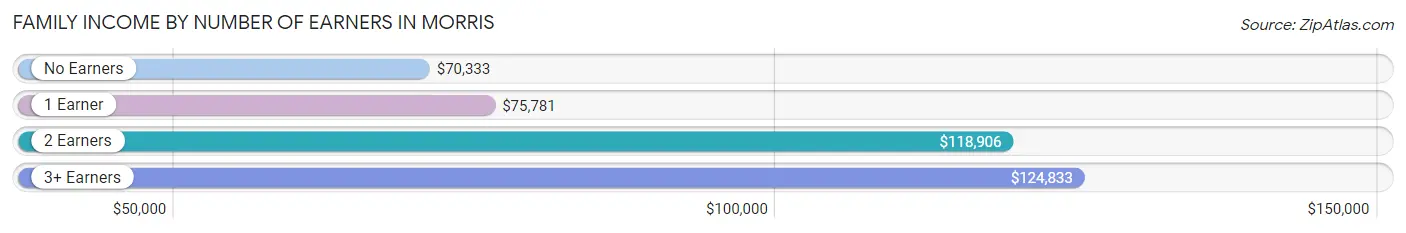
| Number of Earners | # Families | Median Income |
| No Earners | 510 (13.6%) | $70,333 |
| 1 Earner | 1,210 (32.1%) | $75,781 |
| 2 Earners | 1,531 (40.7%) | $118,906 |
| 3+ Earners | 514 (13.7%) | $124,833 |
| Total | 3,765 (100.0%) | $96,530 |
Household Income in Morris
Household Income Brackets in Morris
With 1,245 households falling in the category, the $100,000 to $149,999 income range is the most frequent in Morris, accounting for 19.9% of all households. In contrast, only 94 households (1.5%) fall into the less than $10,000 income bracket, making it the least populous group.
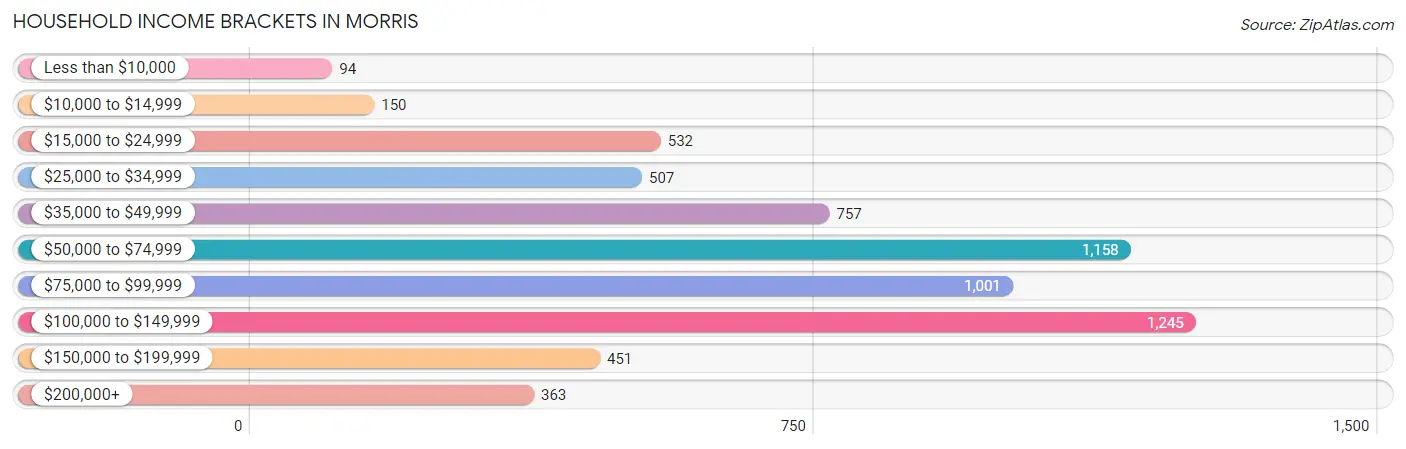
| Income Bracket | # Households | % Households |
| Less than $10,000 | 94 | 1.5% |
| $10,000 to $14,999 | 150 | 2.4% |
| $15,000 to $24,999 | 532 | 8.5% |
| $25,000 to $34,999 | 507 | 8.1% |
| $35,000 to $49,999 | 757 | 12.1% |
| $50,000 to $74,999 | 1,158 | 18.5% |
| $75,000 to $99,999 | 1,001 | 16.0% |
| $100,000 to $149,999 | 1,245 | 19.9% |
| $150,000 to $199,999 | 451 | 7.2% |
| $200,000+ | 363 | 5.8% |
Household Income by Householder Age in Morris
The median household income in Morris is $73,909, with the highest median household income of $92,411 found in the 25 to 44 years age bracket for the primary householder. A total of 2,014 households (32.2%) fall into this category. Meanwhile, the 65+ years age bracket for the primary householder has the lowest median household income of $51,836, with 1,695 households (27.1%) in this group.
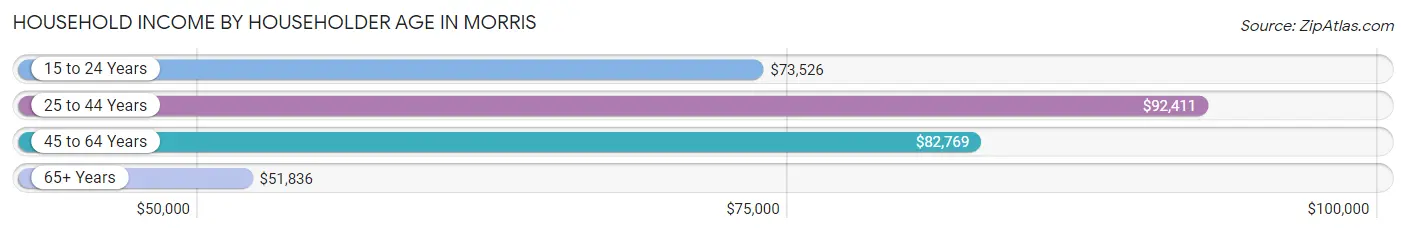
| Income Bracket | # Households | Median Income |
| 15 to 24 Years | 248 (4.0%) | $73,526 |
| 25 to 44 Years | 2,014 (32.2%) | $92,411 |
| 45 to 64 Years | 2,301 (36.8%) | $82,769 |
| 65+ Years | 1,695 (27.1%) | $51,836 |
| Total | 6,258 (100.0%) | $73,909 |
Poverty in Morris
Income Below Poverty by Sex and Age in Morris
With 6.0% poverty level for males and 5.4% for females among the residents of Morris, 15 year old males and 5 year old females are the most vulnerable to poverty, with 39 males (48.1%) and 21 females (22.1%) in their respective age groups living below the poverty level.
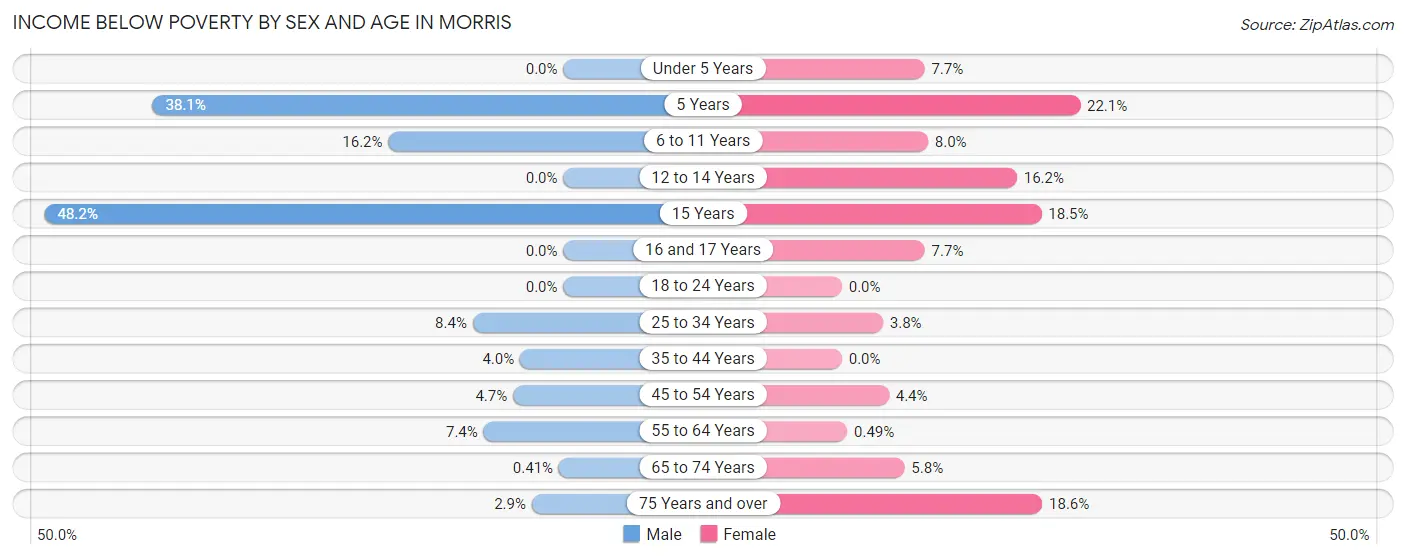
| Age Bracket | Male | Female |
| Under 5 Years | 0 (0.0%) | 31 (7.7%) |
| 5 Years | 53 (38.1%) | 21 (22.1%) |
| 6 to 11 Years | 89 (16.2%) | 53 (8.0%) |
| 12 to 14 Years | 0 (0.0%) | 19 (16.2%) |
| 15 Years | 39 (48.1%) | 15 (18.5%) |
| 16 and 17 Years | 0 (0.0%) | 15 (7.7%) |
| 18 to 24 Years | 0 (0.0%) | 0 (0.0%) |
| 25 to 34 Years | 74 (8.4%) | 33 (3.8%) |
| 35 to 44 Years | 39 (4.0%) | 0 (0.0%) |
| 45 to 54 Years | 45 (4.7%) | 43 (4.4%) |
| 55 to 64 Years | 73 (7.4%) | 4 (0.5%) |
| 65 to 74 Years | 3 (0.4%) | 46 (5.8%) |
| 75 Years and over | 9 (2.9%) | 103 (18.6%) |
| Total | 424 (6.0%) | 383 (5.4%) |
Income Above Poverty by Sex and Age in Morris
According to the poverty statistics in Morris, males aged under 5 years and females aged 18 to 24 years are the age groups that are most secure financially, with 100.0% of males and 100.0% of females in these age groups living above the poverty line.
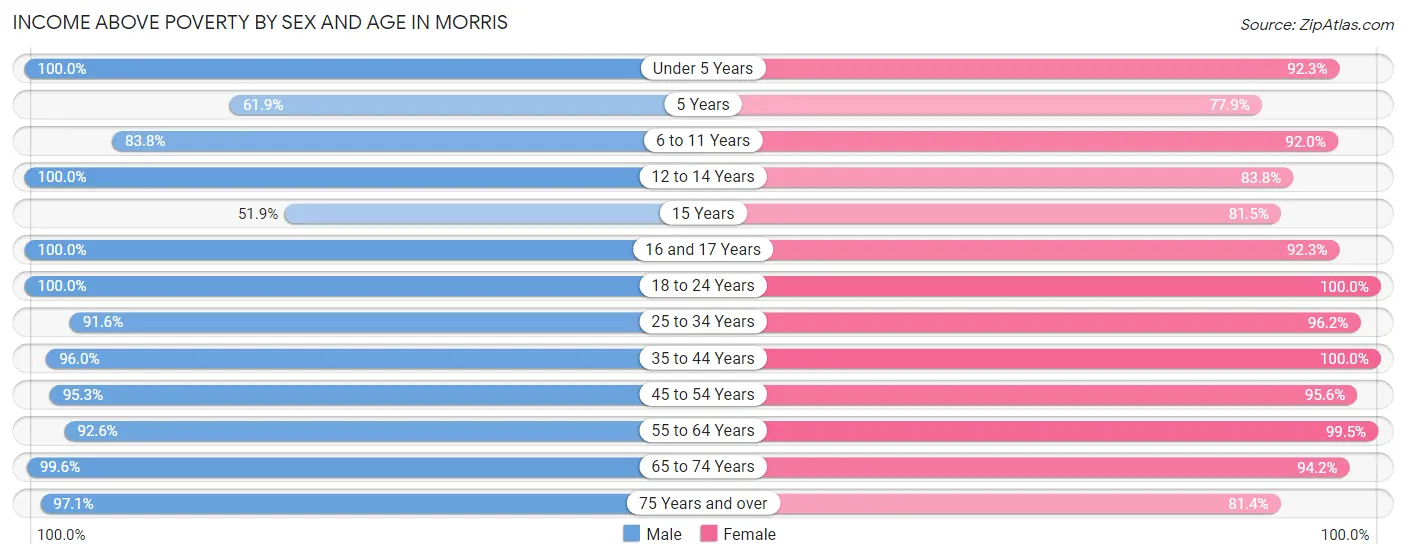
| Age Bracket | Male | Female |
| Under 5 Years | 387 (100.0%) | 373 (92.3%) |
| 5 Years | 86 (61.9%) | 74 (77.9%) |
| 6 to 11 Years | 459 (83.8%) | 610 (92.0%) |
| 12 to 14 Years | 299 (100.0%) | 98 (83.8%) |
| 15 Years | 42 (51.8%) | 66 (81.5%) |
| 16 and 17 Years | 138 (100.0%) | 180 (92.3%) |
| 18 to 24 Years | 626 (100.0%) | 595 (100.0%) |
| 25 to 34 Years | 806 (91.6%) | 834 (96.2%) |
| 35 to 44 Years | 932 (96.0%) | 892 (100.0%) |
| 45 to 54 Years | 919 (95.3%) | 944 (95.6%) |
| 55 to 64 Years | 913 (92.6%) | 808 (99.5%) |
| 65 to 74 Years | 732 (99.6%) | 746 (94.2%) |
| 75 Years and over | 298 (97.1%) | 451 (81.4%) |
| Total | 6,637 (94.0%) | 6,671 (94.6%) |
Income Below Poverty Among Married-Couple Families in Morris
The poverty statistics for married-couple families in Morris show that 0.4% or 12 of the total 2,918 families live below the poverty line. Families with 3 or 4 children have the highest poverty rate of 4.5%, comprising of 12 families. On the other hand, families with no children have the lowest poverty rate of 0.0%, which includes 0 families.
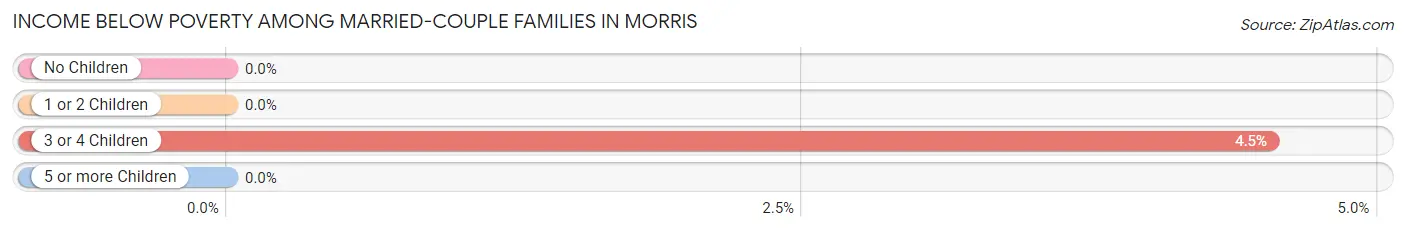
| Children | Above Poverty | Below Poverty |
| No Children | 1,646 (100.0%) | 0 (0.0%) |
| 1 or 2 Children | 996 (100.0%) | 0 (0.0%) |
| 3 or 4 Children | 253 (95.5%) | 12 (4.5%) |
| 5 or more Children | 11 (100.0%) | 0 (0.0%) |
| Total | 2,906 (99.6%) | 12 (0.4%) |
Income Below Poverty Among Single-Parent Households in Morris
According to the poverty data in Morris, 27.4% or 87 single-father households and 7.9% or 42 single-mother households are living below the poverty line. Among single-father households, those with 1 or 2 children have the highest poverty rate, with 87 households (43.9%) experiencing poverty. Likewise, among single-mother households, those with 1 or 2 children have the highest poverty rate, with 42 households (17.6%) falling below the poverty line.
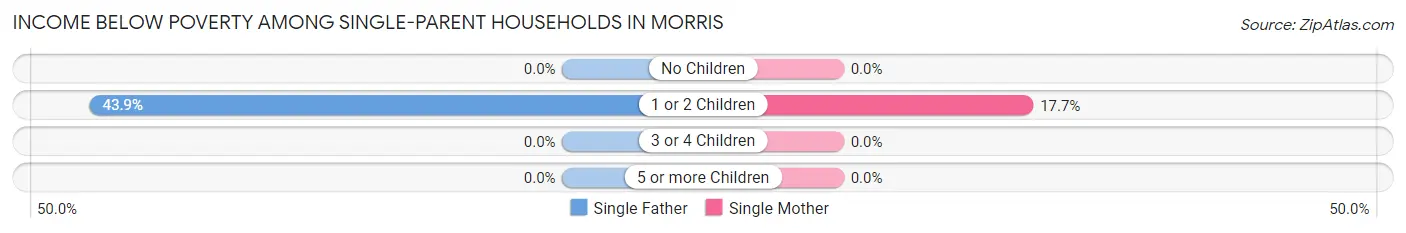
| Children | Single Father | Single Mother |
| No Children | 0 (0.0%) | 0 (0.0%) |
| 1 or 2 Children | 87 (43.9%) | 42 (17.6%) |
| 3 or 4 Children | 0 (0.0%) | 0 (0.0%) |
| 5 or more Children | 0 (0.0%) | 0 (0.0%) |
| Total | 87 (27.4%) | 42 (7.9%) |
Income Below Poverty Among Married-Couple vs Single-Parent Households in Morris
The poverty data for Morris shows that 12 of the married-couple family households (0.4%) and 129 of the single-parent households (15.2%) are living below the poverty level. Within the married-couple family households, those with 3 or 4 children have the highest poverty rate, with 12 households (4.5%) falling below the poverty line. Among the single-parent households, those with 1 or 2 children have the highest poverty rate, with 129 household (29.6%) living below poverty.
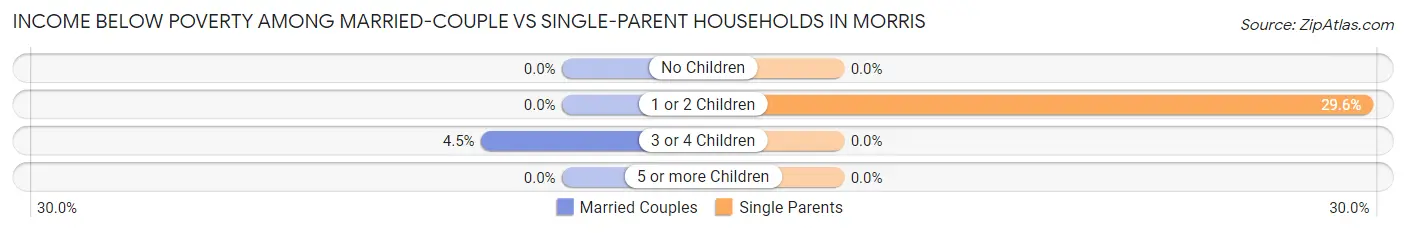
| Children | Married-Couple Families | Single-Parent Households |
| No Children | 0 (0.0%) | 0 (0.0%) |
| 1 or 2 Children | 0 (0.0%) | 129 (29.6%) |
| 3 or 4 Children | 12 (4.5%) | 0 (0.0%) |
| 5 or more Children | 0 (0.0%) | 0 (0.0%) |
| Total | 12 (0.4%) | 129 (15.2%) |
Race in Morris
The most populous races in Morris are White / Caucasian (12,843 | 88.6%), Hispanic or Latino (1,289 | 8.9%), and Two or more Races (861 | 5.9%).
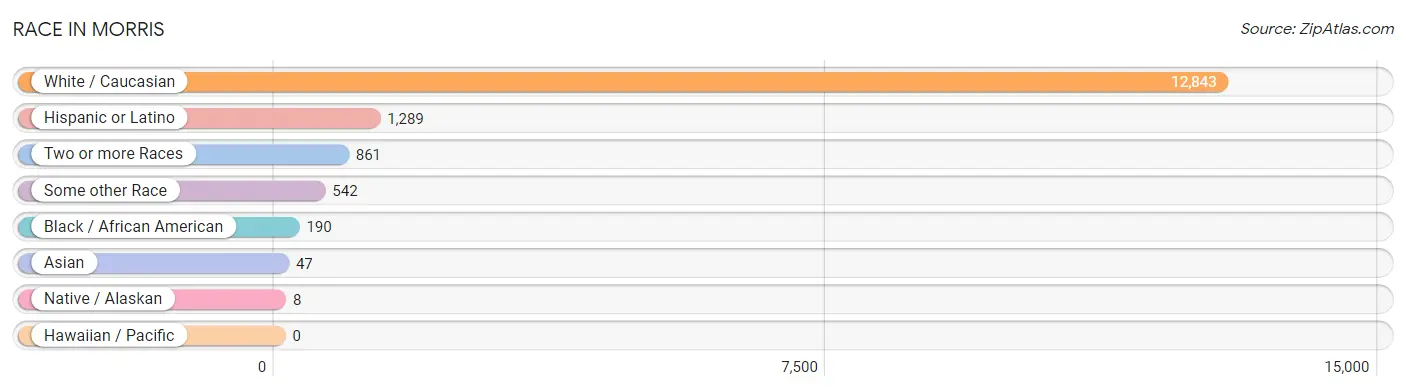
| Race | # Population | % Population |
| Asian | 47 | 0.3% |
| Black / African American | 190 | 1.3% |
| Hawaiian / Pacific | 0 | 0.0% |
| Hispanic or Latino | 1,289 | 8.9% |
| Native / Alaskan | 8 | 0.1% |
| White / Caucasian | 12,843 | 88.6% |
| Two or more Races | 861 | 5.9% |
| Some other Race | 542 | 3.7% |
| Total | 14,491 | 100.0% |
Ancestry in Morris
The most populous ancestries reported in Morris are German (3,370 | 23.3%), Irish (2,517 | 17.4%), English (1,764 | 12.2%), Norwegian (1,498 | 10.3%), and Polish (1,301 | 9.0%), together accounting for 72.1% of all Morris residents.
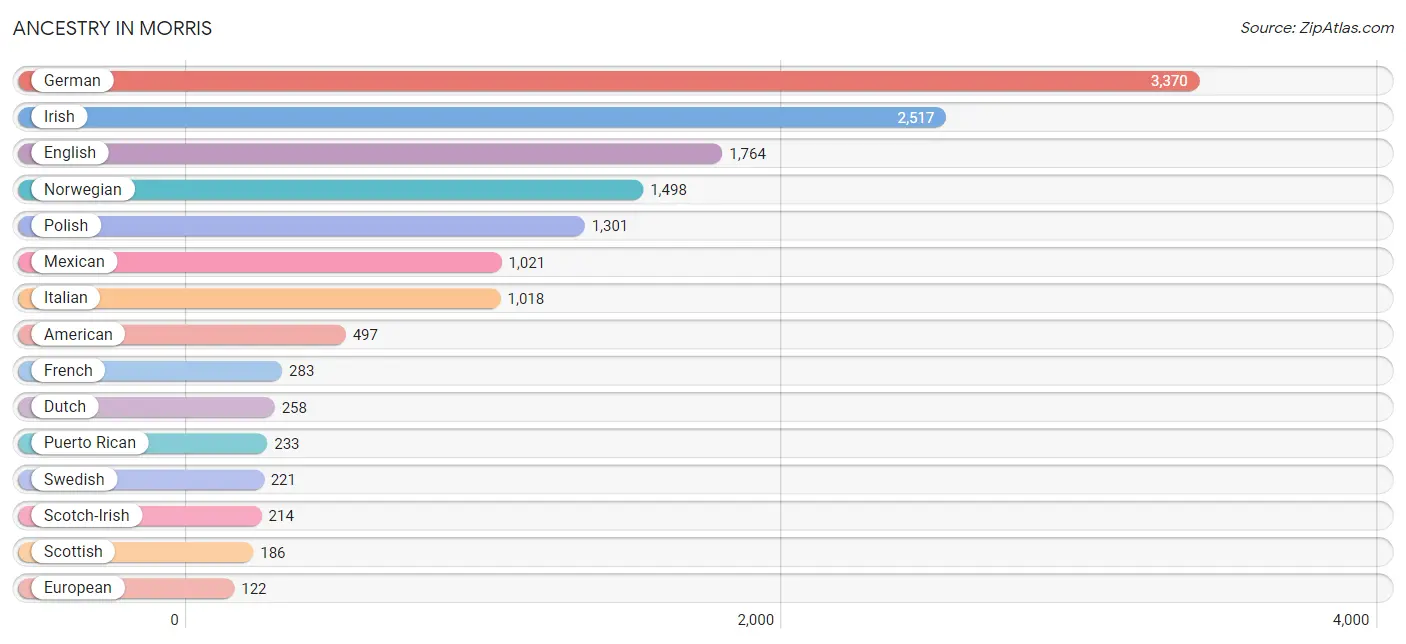
| Ancestry | # Population | % Population |
| American | 497 | 3.4% |
| Arab | 51 | 0.4% |
| Austrian | 74 | 0.5% |
| Belgian | 54 | 0.4% |
| British | 27 | 0.2% |
| Cherokee | 9 | 0.1% |
| Cheyenne | 8 | 0.1% |
| Colombian | 32 | 0.2% |
| Croatian | 86 | 0.6% |
| Czech | 55 | 0.4% |
| Czechoslovakian | 2 | 0.0% |
| Danish | 60 | 0.4% |
| Dutch | 258 | 1.8% |
| Eastern European | 63 | 0.4% |
| English | 1,764 | 12.2% |
| European | 122 | 0.8% |
| Finnish | 44 | 0.3% |
| French | 283 | 1.9% |
| German | 3,370 | 23.3% |
| Greek | 100 | 0.7% |
| Hungarian | 31 | 0.2% |
| Indian (Asian) | 23 | 0.2% |
| Irish | 2,517 | 17.4% |
| Italian | 1,018 | 7.0% |
| Korean | 115 | 0.8% |
| Lebanese | 34 | 0.2% |
| Lithuanian | 119 | 0.8% |
| Luxembourger | 20 | 0.1% |
| Mexican | 1,021 | 7.0% |
| Nigerian | 8 | 0.1% |
| Northern European | 10 | 0.1% |
| Norwegian | 1,498 | 10.3% |
| Palestinian | 17 | 0.1% |
| Polish | 1,301 | 9.0% |
| Puerto Rican | 233 | 1.6% |
| Romanian | 18 | 0.1% |
| Russian | 23 | 0.2% |
| Scandinavian | 11 | 0.1% |
| Scotch-Irish | 214 | 1.5% |
| Scottish | 186 | 1.3% |
| Slavic | 21 | 0.1% |
| Slovak | 12 | 0.1% |
| South American | 32 | 0.2% |
| Sri Lankan | 11 | 0.1% |
| Subsaharan African | 8 | 0.1% |
| Swedish | 221 | 1.5% |
| Swiss | 37 | 0.3% |
| Thai | 24 | 0.2% |
| Welsh | 22 | 0.2% | View All 49 Rows |
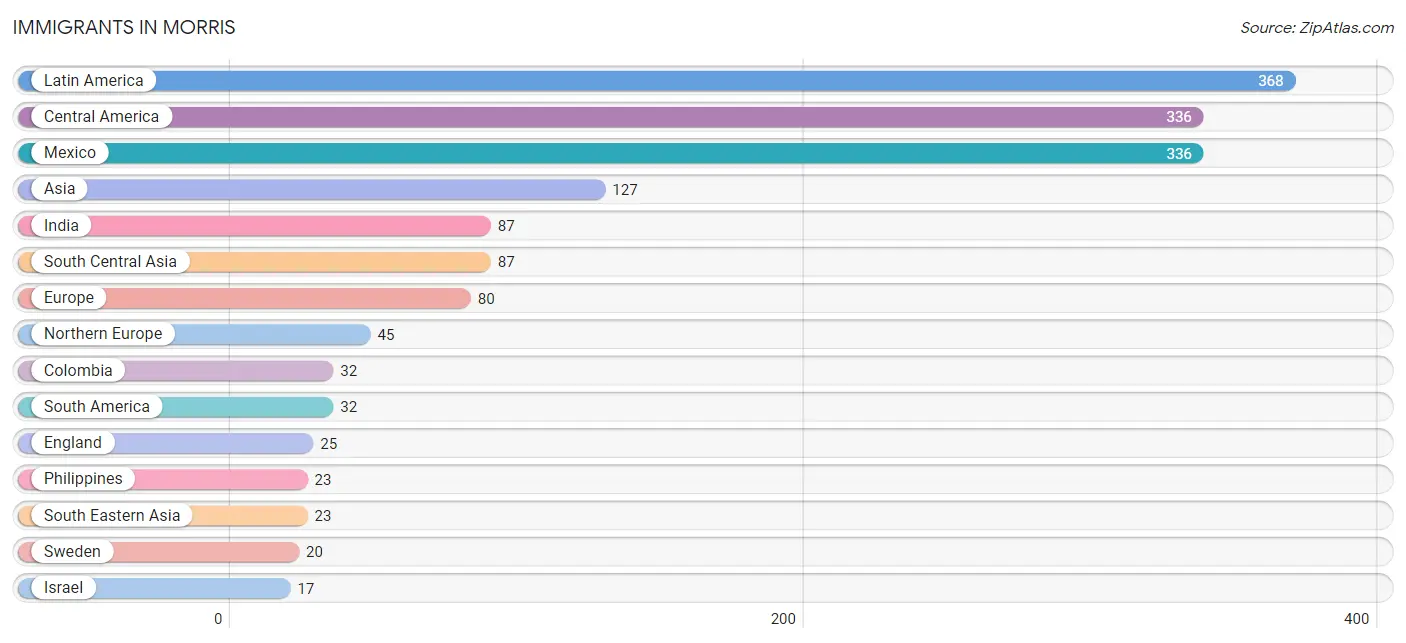
Immigrants in Morris
The most numerous immigrant groups reported in Morris came from Latin America (368 | 2.5%), Central America (336 | 2.3%), Mexico (336 | 2.3%), Asia (127 | 0.9%), and India (87 | 0.6%), together accounting for 8.7% of all Morris residents.
| Immigration Origin | # Population | % Population |
| Asia | 127 | 0.9% |
| Central America | 336 | 2.3% |
| Colombia | 32 | 0.2% |
| Eastern Europe | 12 | 0.1% |
| England | 25 | 0.2% |
| Europe | 80 | 0.5% |
| France | 12 | 0.1% |
| Greece | 11 | 0.1% |
| India | 87 | 0.6% |
| Israel | 17 | 0.1% |
| Latin America | 368 | 2.5% |
| Lithuania | 9 | 0.1% |
| Mexico | 336 | 2.3% |
| Northern Europe | 45 | 0.3% |
| Philippines | 23 | 0.2% |
| Poland | 3 | 0.0% |
| South America | 32 | 0.2% |
| South Central Asia | 87 | 0.6% |
| South Eastern Asia | 23 | 0.2% |
| Southern Europe | 11 | 0.1% |
| Sweden | 20 | 0.1% |
| Western Asia | 17 | 0.1% |
| Western Europe | 12 | 0.1% | View All 23 Rows |
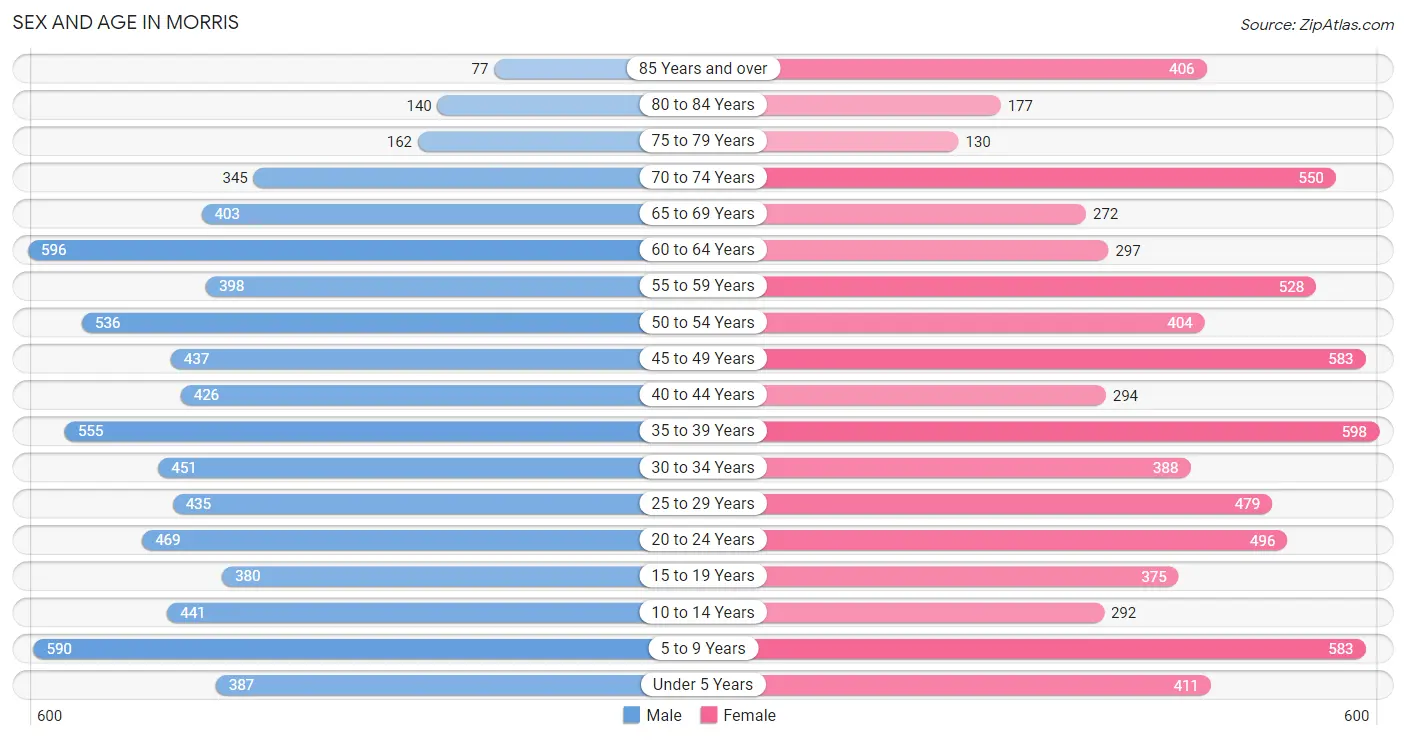
Sex and Age in Morris
Sex and Age in Morris
The most populous age groups in Morris are 60 to 64 Years (596 | 8.3%) for men and 35 to 39 Years (598 | 8.2%) for women.
| Age Bracket | Male | Female |
| Under 5 Years | 387 (5.3%) | 411 (5.7%) |
| 5 to 9 Years | 590 (8.2%) | 583 (8.0%) |
| 10 to 14 Years | 441 (6.1%) | 292 (4.0%) |
| 15 to 19 Years | 380 (5.3%) | 375 (5.2%) |
| 20 to 24 Years | 469 (6.5%) | 496 (6.8%) |
| 25 to 29 Years | 435 (6.0%) | 479 (6.6%) |
| 30 to 34 Years | 451 (6.2%) | 388 (5.3%) |
| 35 to 39 Years | 555 (7.7%) | 598 (8.2%) |
| 40 to 44 Years | 426 (5.9%) | 294 (4.1%) |
| 45 to 49 Years | 437 (6.0%) | 583 (8.0%) |
| 50 to 54 Years | 536 (7.4%) | 404 (5.6%) |
| 55 to 59 Years | 398 (5.5%) | 528 (7.3%) |
| 60 to 64 Years | 596 (8.3%) | 297 (4.1%) |
| 65 to 69 Years | 403 (5.6%) | 272 (3.7%) |
| 70 to 74 Years | 345 (4.8%) | 550 (7.6%) |
| 75 to 79 Years | 162 (2.2%) | 130 (1.8%) |
| 80 to 84 Years | 140 (1.9%) | 177 (2.4%) |
| 85 Years and over | 77 (1.1%) | 406 (5.6%) |
| Total | 7,228 (100.0%) | 7,263 (100.0%) |
Families and Households in Morris
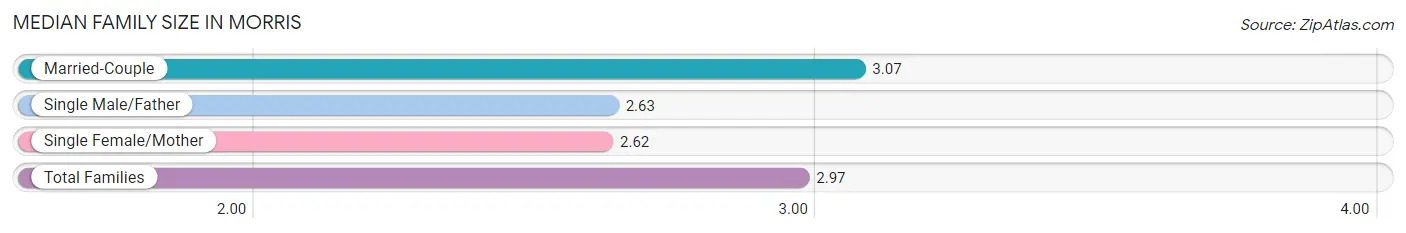
Median Family Size in Morris
The median family size in Morris is 2.97 persons per family, with married-couple families (2,918 | 77.5%) accounting for the largest median family size of 3.07 persons per family. On the other hand, single female/mother families (530 | 14.1%) represent the smallest median family size with 2.62 persons per family.
| Family Type | # Families | Family Size |
| Married-Couple | 2,918 (77.5%) | 3.07 |
| Single Male/Father | 317 (8.4%) | 2.63 |
| Single Female/Mother | 530 (14.1%) | 2.62 |
| Total Families | 3,765 (100.0%) | 2.97 |
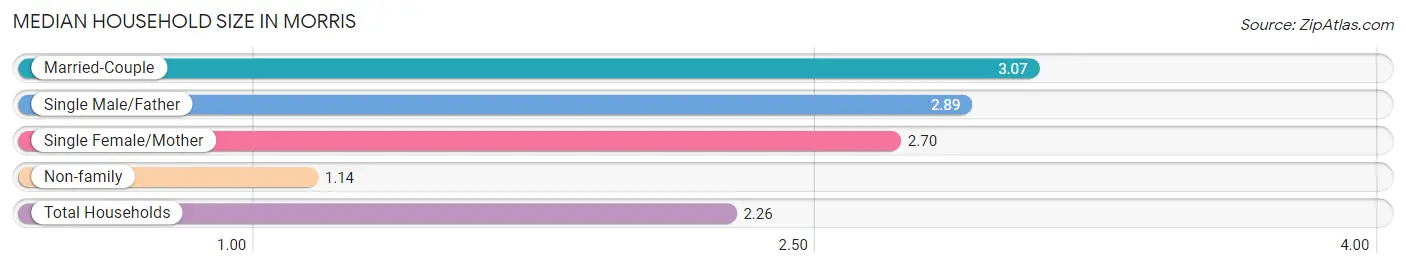
Median Household Size in Morris
The median household size in Morris is 2.26 persons per household, with married-couple households (2,918 | 46.6%) accounting for the largest median household size of 3.07 persons per household. non-family households (2,493 | 39.8%) represent the smallest median household size with 1.14 persons per household.
| Household Type | # Households | Household Size |
| Married-Couple | 2,918 (46.6%) | 3.07 |
| Single Male/Father | 317 (5.1%) | 2.89 |
| Single Female/Mother | 530 (8.5%) | 2.70 |
| Non-family | 2,493 (39.8%) | 1.14 |
| Total Households | 6,258 (100.0%) | 2.26 |
Household Size by Marriage Status in Morris
Out of a total of 6,258 households in Morris, 3,765 (60.2%) are family households, while 2,493 (39.8%) are nonfamily households. The most numerous type of family households are 2-person households, comprising 1,768, and the most common type of nonfamily households are 1-person households, comprising 2,193.
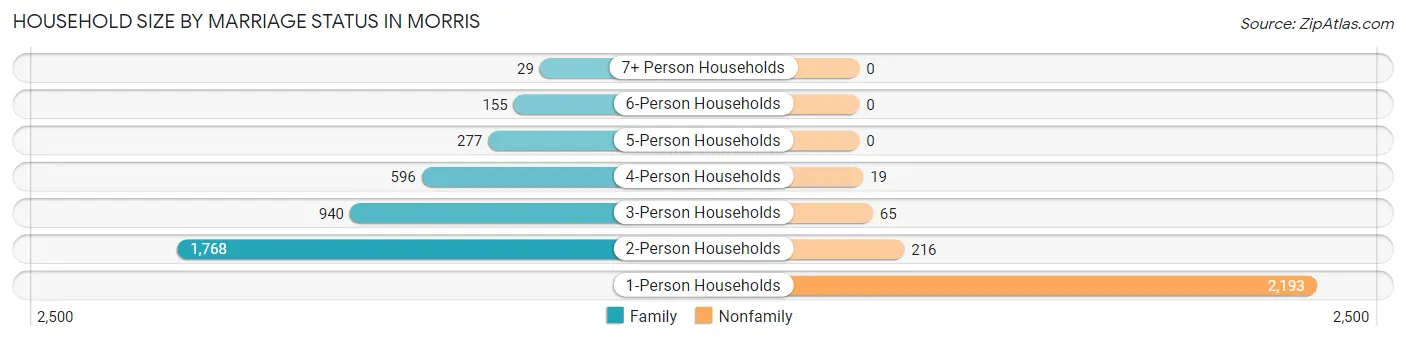
| Household Size | Family Households | Nonfamily Households |
| 1-Person Households | - | 2,193 (35.0%) |
| 2-Person Households | 1,768 (28.2%) | 216 (3.5%) |
| 3-Person Households | 940 (15.0%) | 65 (1.0%) |
| 4-Person Households | 596 (9.5%) | 19 (0.3%) |
| 5-Person Households | 277 (4.4%) | 0 (0.0%) |
| 6-Person Households | 155 (2.5%) | 0 (0.0%) |
| 7+ Person Households | 29 (0.5%) | 0 (0.0%) |
| Total | 3,765 (60.2%) | 2,493 (39.8%) |
Female Fertility in Morris
Fertility by Age in Morris
Average fertility rate in Morris is 56.0 births per 1,000 women. Women in the age bracket of 20 to 34 years have the highest fertility rate with 103.0 births per 1,000 women. Women in the age bracket of 20 to 34 years acount for 76.2% of all women with births.
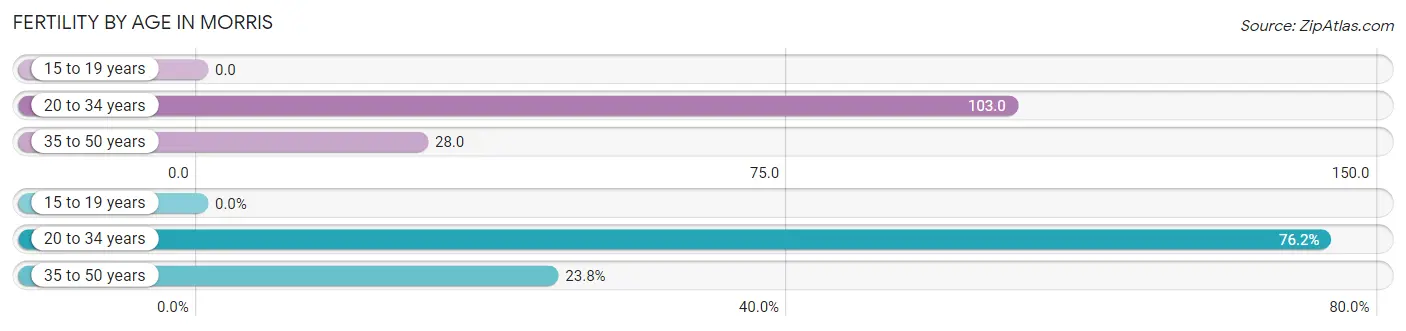
| Age Bracket | Women with Births | Births / 1,000 Women |
| 15 to 19 years | 0 (0.0%) | 0.0 |
| 20 to 34 years | 141 (76.2%) | 103.0 |
| 35 to 50 years | 44 (23.8%) | 28.0 |
| Total | 185 (100.0%) | 56.0 |
Fertility by Age by Marriage Status in Morris
73.5% of women with births (185) in Morris are married. The highest percentage of unmarried women with births falls into 20 to 34 years age bracket with 34.7% of them unmarried at the time of birth, while the lowest percentage of unmarried women with births belong to 35 to 50 years age bracket with 0.0% of them unmarried.
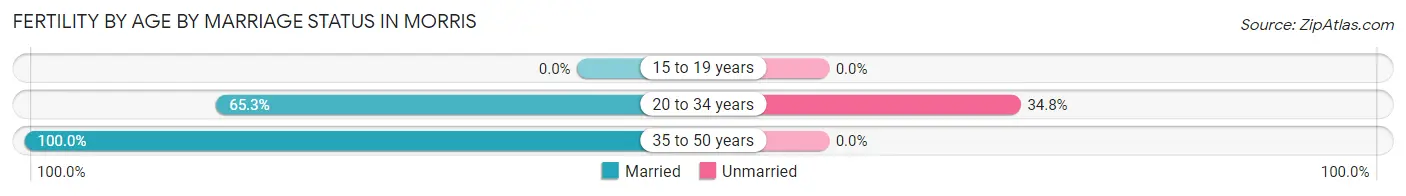
| Age Bracket | Married | Unmarried |
| 15 to 19 years | 0 (0.0%) | 0 (0.0%) |
| 20 to 34 years | 92 (65.2%) | 49 (34.7%) |
| 35 to 50 years | 44 (100.0%) | 0 (0.0%) |
| Total | 136 (73.5%) | 49 (26.5%) |
Fertility by Education in Morris
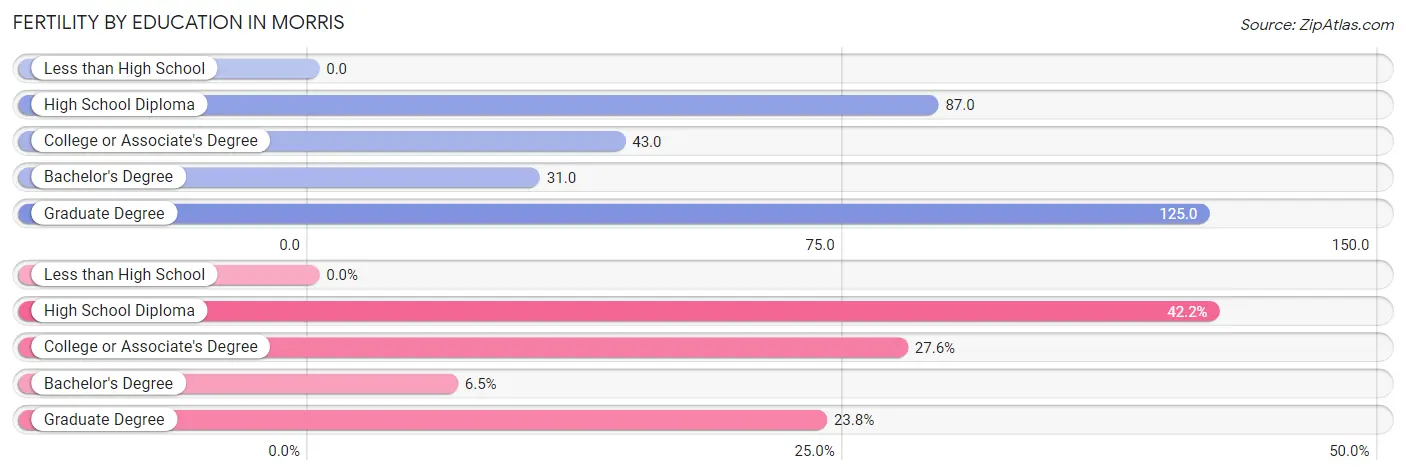
| Educational Attainment | Women with Births | Births / 1,000 Women |
| Less than High School | 0 (0.0%) | 0.0 |
| High School Diploma | 78 (42.2%) | 87.0 |
| College or Associate's Degree | 51 (27.6%) | 43.0 |
| Bachelor's Degree | 12 (6.5%) | 31.0 |
| Graduate Degree | 44 (23.8%) | 125.0 |
| Total | 185 (100.0%) | 56.0 |
Fertility by Education by Marriage Status in Morris
26.5% of women with births in Morris are unmarried. Women with the educational attainment of college or associate's degree are most likely to be married with 100.0% of them married at childbirth, while women with the educational attainment of high school diploma are least likely to be married with 62.8% of them unmarried at childbirth.
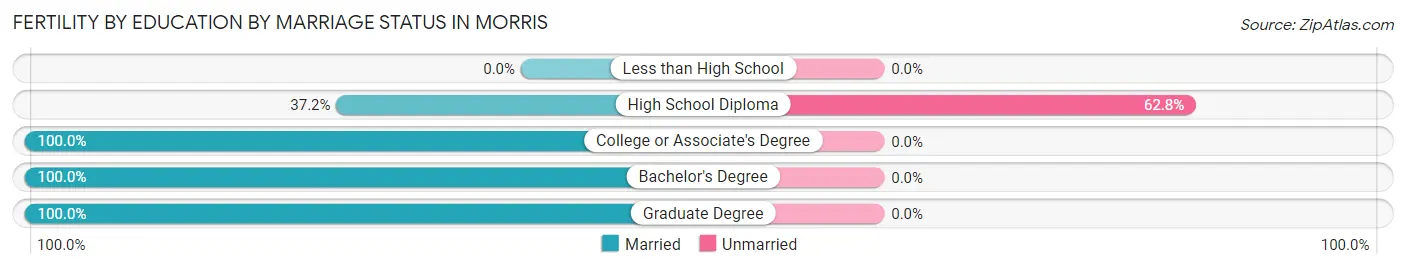
| Educational Attainment | Married | Unmarried |
| Less than High School | 0 (0.0%) | 0 (0.0%) |
| High School Diploma | 29 (37.2%) | 49 (62.8%) |
| College or Associate's Degree | 51 (100.0%) | 0 (0.0%) |
| Bachelor's Degree | 12 (100.0%) | 0 (0.0%) |
| Graduate Degree | 44 (100.0%) | 0 (0.0%) |
| Total | 136 (73.5%) | 49 (26.5%) |
Employment Characteristics in Morris
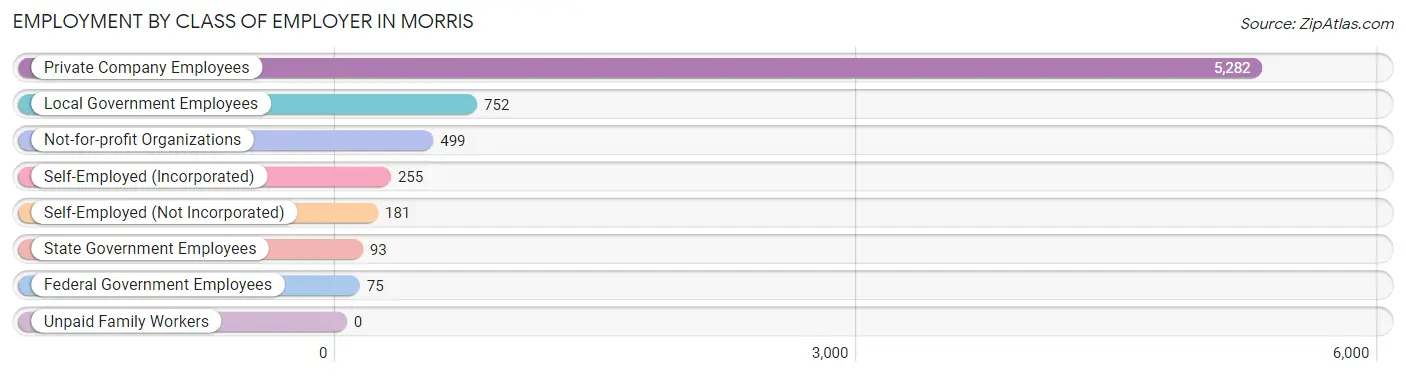
Employment by Class of Employer in Morris
Among the 7,137 employed individuals in Morris, private company employees (5,282 | 74.0%), local government employees (752 | 10.5%), and not-for-profit organizations (499 | 7.0%) make up the most common classes of employment.
| Employer Class | # Employees | % Employees |
| Private Company Employees | 5,282 | 74.0% |
| Self-Employed (Incorporated) | 255 | 3.6% |
| Self-Employed (Not Incorporated) | 181 | 2.5% |
| Not-for-profit Organizations | 499 | 7.0% |
| Local Government Employees | 752 | 10.5% |
| State Government Employees | 93 | 1.3% |
| Federal Government Employees | 75 | 1.1% |
| Unpaid Family Workers | 0 | 0.0% |
| Total | 7,137 | 100.0% |
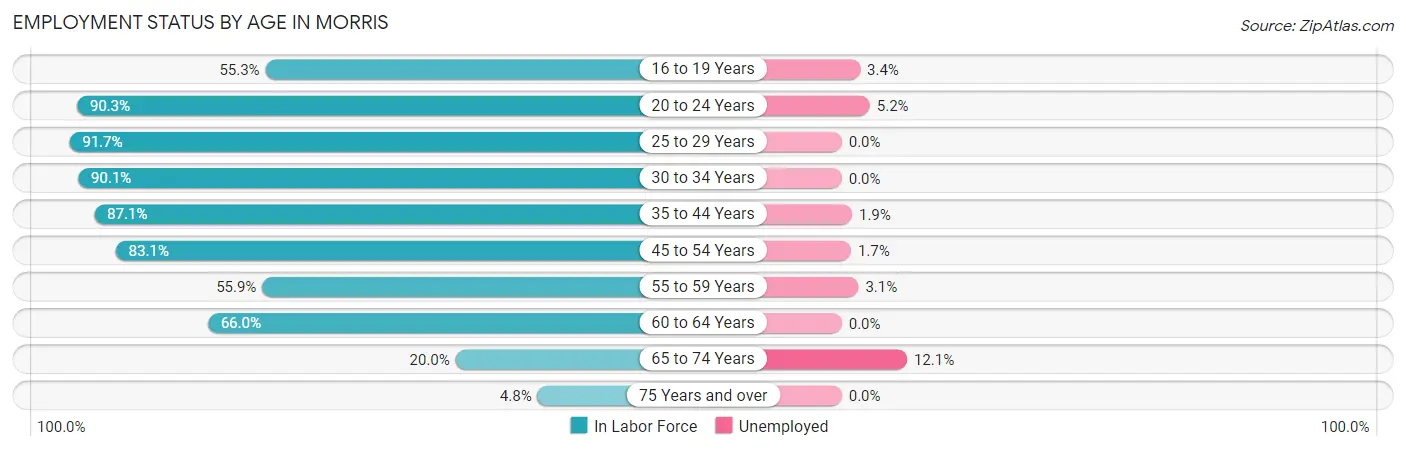
Employment Status by Age in Morris
According to the labor force statistics for Morris, out of the total population over 16 years of age (11,625), 64.7% or 7,521 individuals are in the labor force, with 2.2% or 165 of them unemployed. The age group with the highest labor force participation rate is 25 to 29 years, with 91.7% or 838 individuals in the labor force. Within the labor force, the 65 to 74 years age range has the highest percentage of unemployed individuals, with 12.1% or 38 of them being unemployed.
| Age Bracket | In Labor Force | Unemployed |
| 16 to 19 Years | 328 (55.3%) | 11 (3.4%) |
| 20 to 24 Years | 871 (90.3%) | 45 (5.2%) |
| 25 to 29 Years | 838 (91.7%) | 0 (0.0%) |
| 30 to 34 Years | 756 (90.1%) | 0 (0.0%) |
| 35 to 44 Years | 1,631 (87.1%) | 31 (1.9%) |
| 45 to 54 Years | 1,629 (83.1%) | 28 (1.7%) |
| 55 to 59 Years | 518 (55.9%) | 16 (3.1%) |
| 60 to 64 Years | 589 (66.0%) | 0 (0.0%) |
| 65 to 74 Years | 314 (20.0%) | 38 (12.1%) |
| 75 Years and over | 52 (4.8%) | 0 (0.0%) |
| Total | 7,521 (64.7%) | 165 (2.2%) |
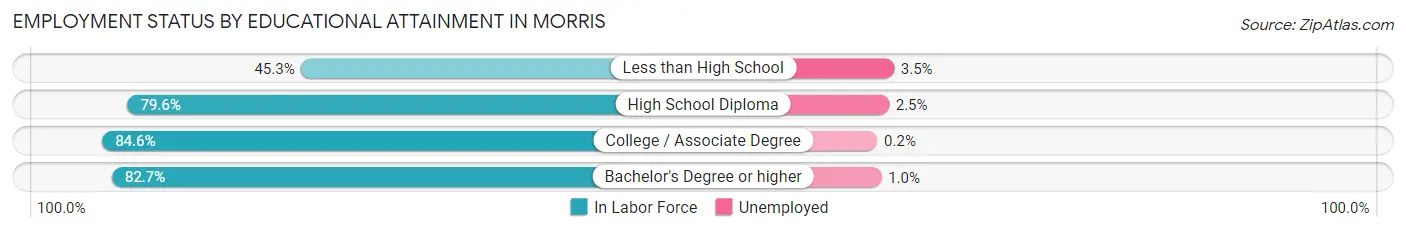
Employment Status by Educational Attainment in Morris
According to labor force statistics for Morris, 80.5% of individuals (5,961) out of the total population between 25 and 64 years of age (7,405) are in the labor force, with 1.2% or 72 of them being unemployed. The group with the highest labor force participation rate are those with the educational attainment of college / associate degree, with 84.6% or 2,288 individuals in the labor force. Within the labor force, individuals with less than high school education have the highest percentage of unemployment, with 3.5% or 6 of them being unemployed.
| Educational Attainment | In Labor Force | Unemployed |
| Less than High School | 172 (45.3%) | 13 (3.5%) |
| High School Diploma | 1,869 (79.6%) | 59 (2.5%) |
| College / Associate Degree | 2,288 (84.6%) | 5 (0.2%) |
| Bachelor's Degree or higher | 1,631 (82.7%) | 20 (1.0%) |
| Total | 5,961 (80.5%) | 89 (1.2%) |
Employment Occupations by Sex in Morris
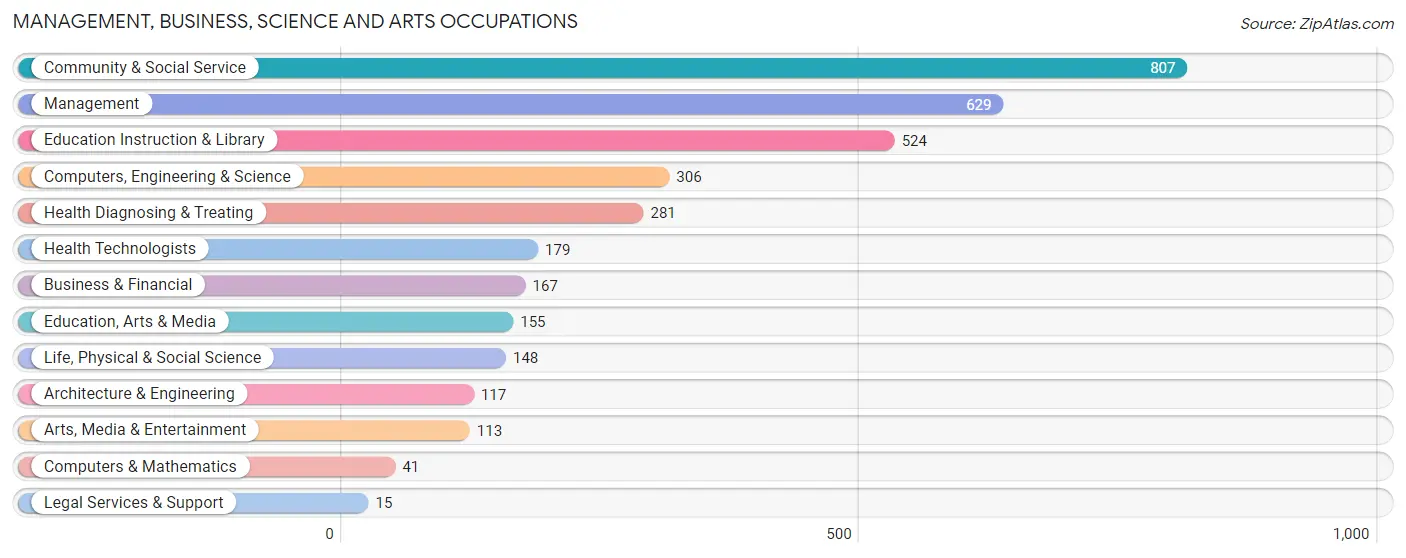
Management, Business, Science and Arts Occupations
The most common Management, Business, Science and Arts occupations in Morris are Community & Social Service (807 | 11.0%), Management (629 | 8.6%), Education Instruction & Library (524 | 7.1%), Computers, Engineering & Science (306 | 4.2%), and Health Diagnosing & Treating (281 | 3.8%).
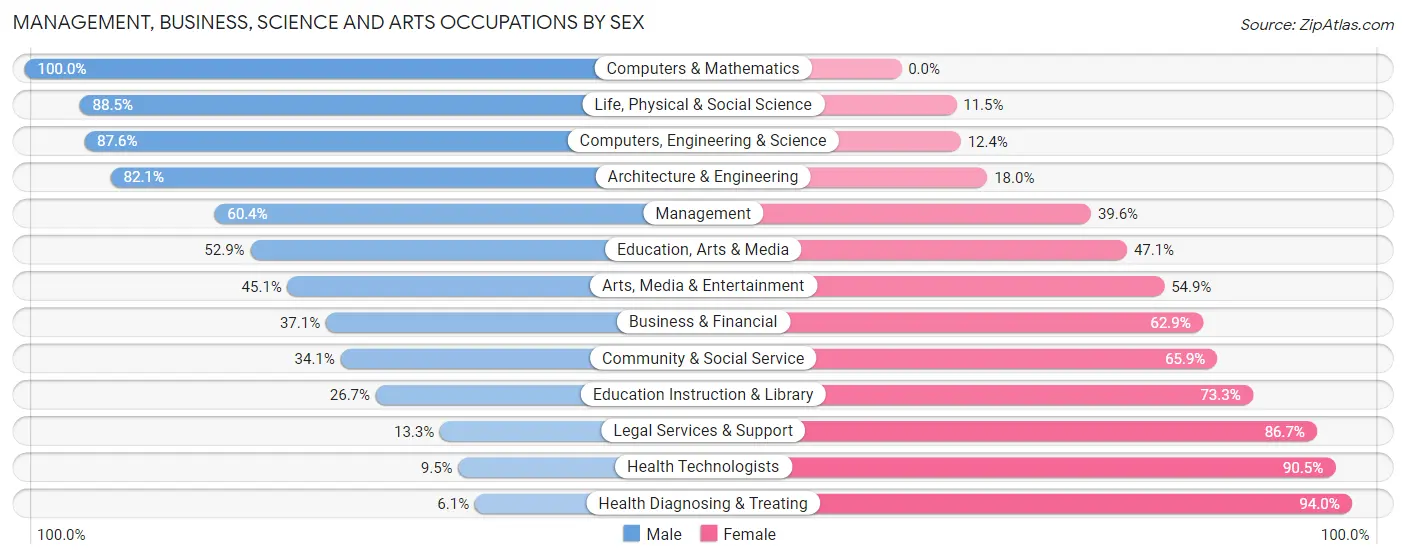
Management, Business, Science and Arts Occupations by Sex
Within the Management, Business, Science and Arts occupations in Morris, the most male-oriented occupations are Computers & Mathematics (100.0%), Life, Physical & Social Science (88.5%), and Computers, Engineering & Science (87.6%), while the most female-oriented occupations are Health Diagnosing & Treating (94.0%), Health Technologists (90.5%), and Legal Services & Support (86.7%).
| Occupation | Male | Female |
| Management | 380 (60.4%) | 249 (39.6%) |
| Business & Financial | 62 (37.1%) | 105 (62.9%) |
| Computers, Engineering & Science | 268 (87.6%) | 38 (12.4%) |
| Computers & Mathematics | 41 (100.0%) | 0 (0.0%) |
| Architecture & Engineering | 96 (82.1%) | 21 (17.9%) |
| Life, Physical & Social Science | 131 (88.5%) | 17 (11.5%) |
| Community & Social Service | 275 (34.1%) | 532 (65.9%) |
| Education, Arts & Media | 82 (52.9%) | 73 (47.1%) |
| Legal Services & Support | 2 (13.3%) | 13 (86.7%) |
| Education Instruction & Library | 140 (26.7%) | 384 (73.3%) |
| Arts, Media & Entertainment | 51 (45.1%) | 62 (54.9%) |
| Health Diagnosing & Treating | 17 (6.0%) | 264 (94.0%) |
| Health Technologists | 17 (9.5%) | 162 (90.5%) |
| Total (Category) | 1,002 (45.8%) | 1,188 (54.2%) |
| Total (Overall) | 4,105 (55.8%) | 3,253 (44.2%) |
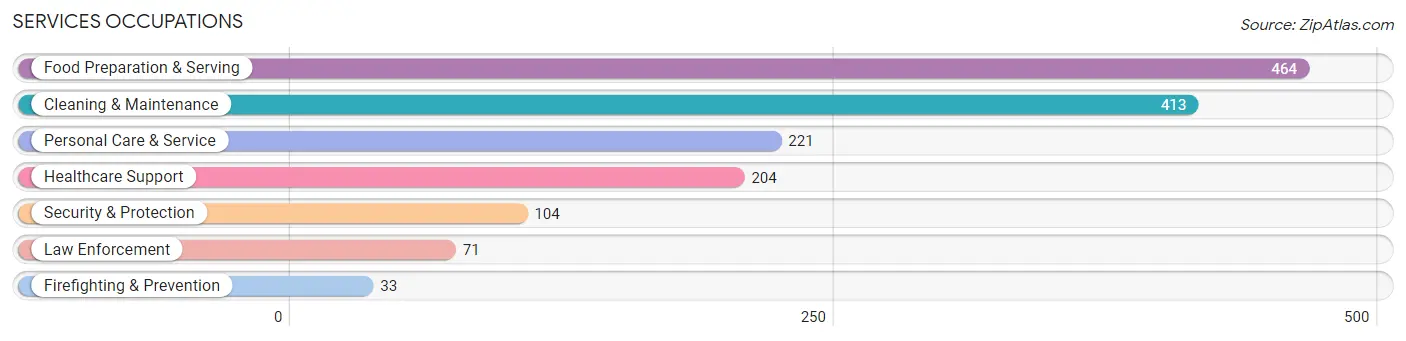
Services Occupations
The most common Services occupations in Morris are Food Preparation & Serving (464 | 6.3%), Cleaning & Maintenance (413 | 5.6%), Personal Care & Service (221 | 3.0%), Healthcare Support (204 | 2.8%), and Security & Protection (104 | 1.4%).
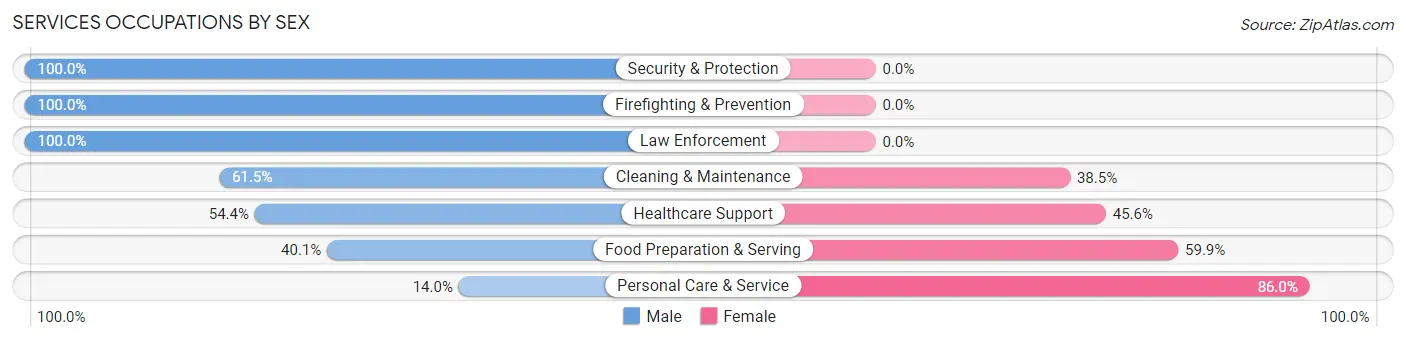
Services Occupations by Sex
Within the Services occupations in Morris, the most male-oriented occupations are Security & Protection (100.0%), Firefighting & Prevention (100.0%), and Law Enforcement (100.0%), while the most female-oriented occupations are Personal Care & Service (86.0%), Food Preparation & Serving (59.9%), and Healthcare Support (45.6%).
| Occupation | Male | Female |
| Healthcare Support | 111 (54.4%) | 93 (45.6%) |
| Security & Protection | 104 (100.0%) | 0 (0.0%) |
| Firefighting & Prevention | 33 (100.0%) | 0 (0.0%) |
| Law Enforcement | 71 (100.0%) | 0 (0.0%) |
| Food Preparation & Serving | 186 (40.1%) | 278 (59.9%) |
| Cleaning & Maintenance | 254 (61.5%) | 159 (38.5%) |
| Personal Care & Service | 31 (14.0%) | 190 (86.0%) |
| Total (Category) | 686 (48.8%) | 720 (51.2%) |
| Total (Overall) | 4,105 (55.8%) | 3,253 (44.2%) |
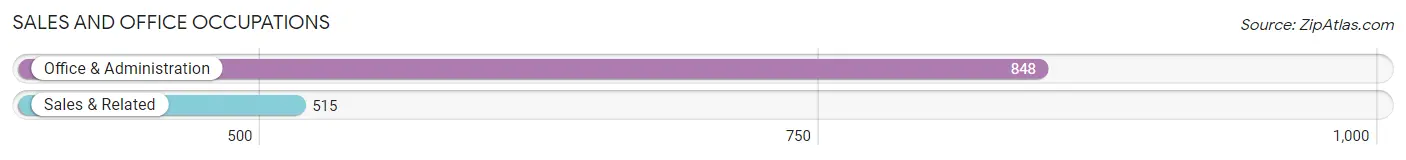
Sales and Office Occupations
The most common Sales and Office occupations in Morris are Office & Administration (848 | 11.5%), and Sales & Related (515 | 7.0%).
Sales and Office Occupations by Sex
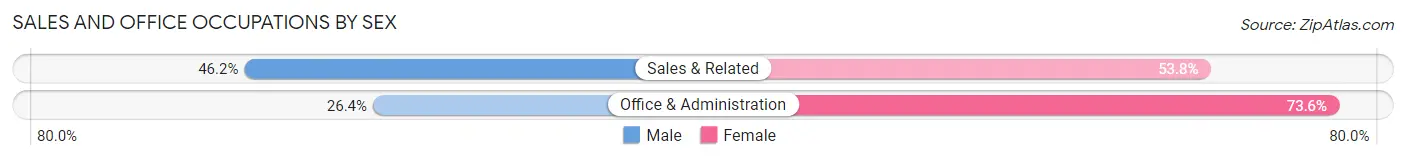
| Occupation | Male | Female |
| Sales & Related | 238 (46.2%) | 277 (53.8%) |
| Office & Administration | 224 (26.4%) | 624 (73.6%) |
| Total (Category) | 462 (33.9%) | 901 (66.1%) |
| Total (Overall) | 4,105 (55.8%) | 3,253 (44.2%) |
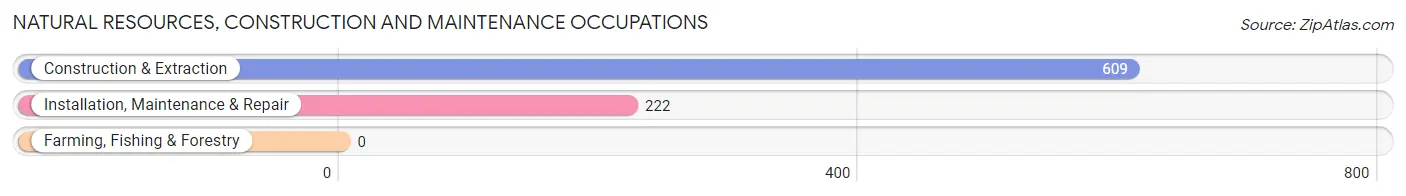
Natural Resources, Construction and Maintenance Occupations
The most common Natural Resources, Construction and Maintenance occupations in Morris are Construction & Extraction (609 | 8.3%), and Installation, Maintenance & Repair (222 | 3.0%).
Natural Resources, Construction and Maintenance Occupations by Sex
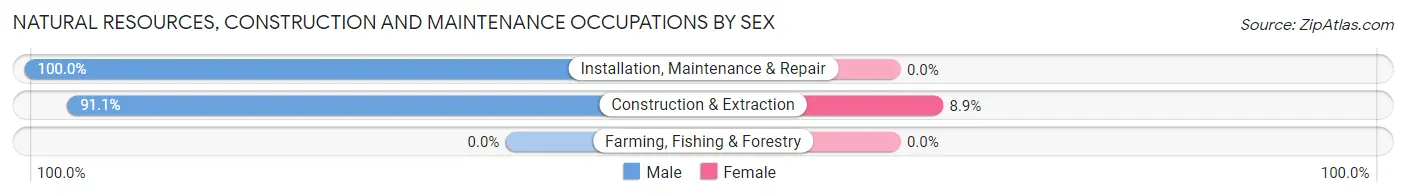
| Occupation | Male | Female |
| Farming, Fishing & Forestry | 0 (0.0%) | 0 (0.0%) |
| Construction & Extraction | 555 (91.1%) | 54 (8.9%) |
| Installation, Maintenance & Repair | 222 (100.0%) | 0 (0.0%) |
| Total (Category) | 777 (93.5%) | 54 (6.5%) |
| Total (Overall) | 4,105 (55.8%) | 3,253 (44.2%) |
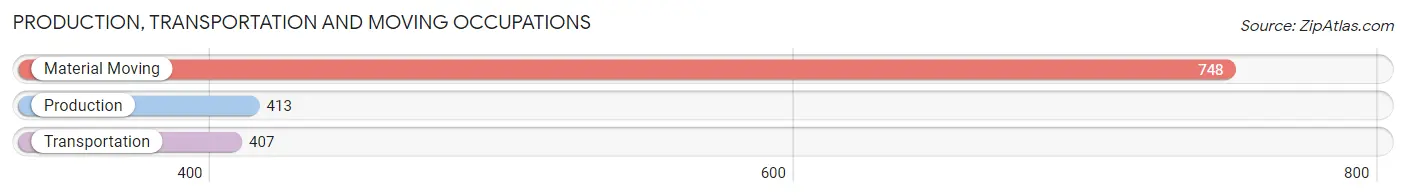
Production, Transportation and Moving Occupations
The most common Production, Transportation and Moving occupations in Morris are Material Moving (748 | 10.2%), Production (413 | 5.6%), and Transportation (407 | 5.5%).
Production, Transportation and Moving Occupations by Sex
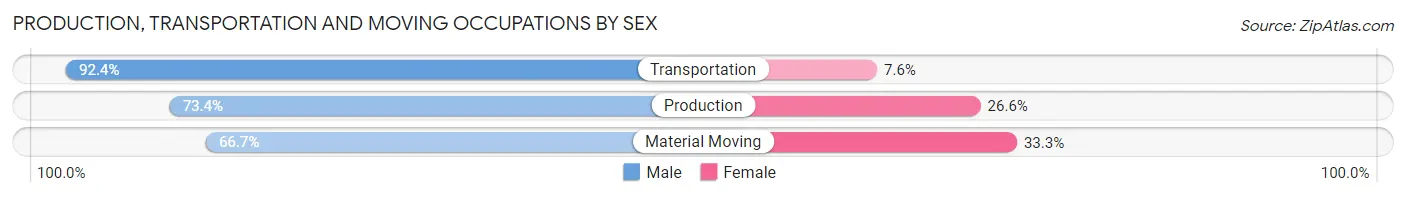
| Occupation | Male | Female |
| Production | 303 (73.4%) | 110 (26.6%) |
| Transportation | 376 (92.4%) | 31 (7.6%) |
| Material Moving | 499 (66.7%) | 249 (33.3%) |
| Total (Category) | 1,178 (75.1%) | 390 (24.9%) |
| Total (Overall) | 4,105 (55.8%) | 3,253 (44.2%) |
Employment Industries by Sex in Morris
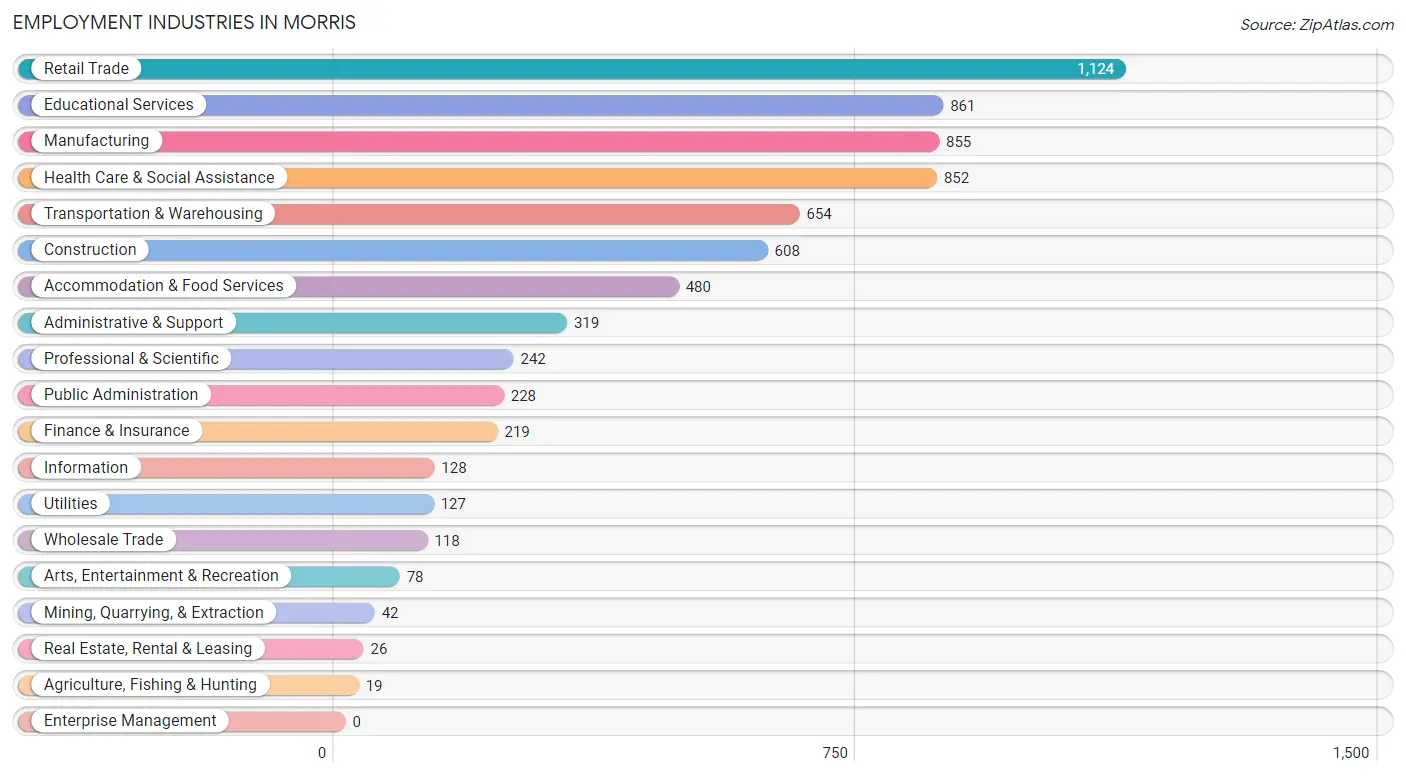
Employment Industries in Morris
The major employment industries in Morris include Retail Trade (1,124 | 15.3%), Educational Services (861 | 11.7%), Manufacturing (855 | 11.6%), Health Care & Social Assistance (852 | 11.6%), and Transportation & Warehousing (654 | 8.9%).
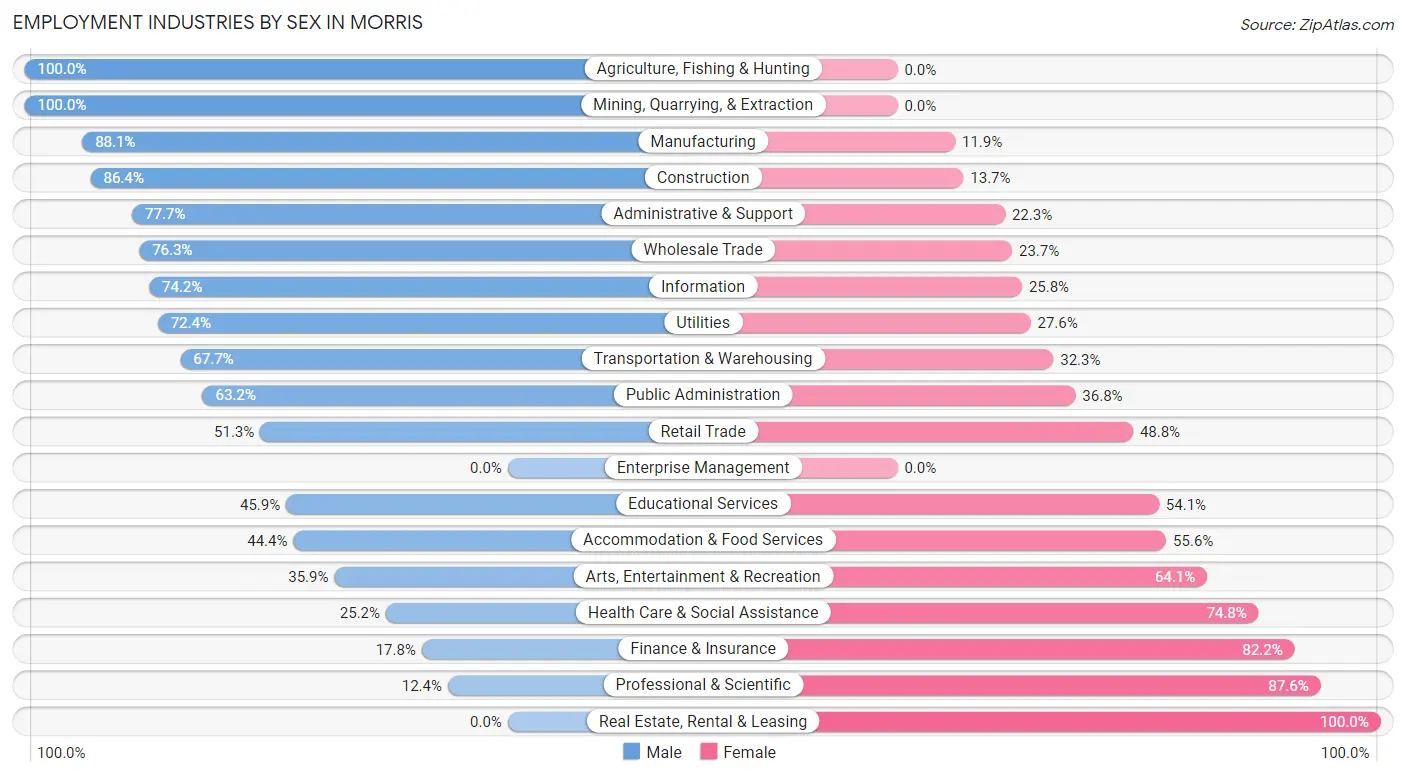
Employment Industries by Sex in Morris
The Morris industries that see more men than women are Agriculture, Fishing & Hunting (100.0%), Mining, Quarrying, & Extraction (100.0%), and Manufacturing (88.1%), whereas the industries that tend to have a higher number of women are Real Estate, Rental & Leasing (100.0%), Professional & Scientific (87.6%), and Finance & Insurance (82.2%).
| Industry | Male | Female |
| Agriculture, Fishing & Hunting | 19 (100.0%) | 0 (0.0%) |
| Mining, Quarrying, & Extraction | 42 (100.0%) | 0 (0.0%) |
| Construction | 525 (86.4%) | 83 (13.7%) |
| Manufacturing | 753 (88.1%) | 102 (11.9%) |
| Wholesale Trade | 90 (76.3%) | 28 (23.7%) |
| Retail Trade | 576 (51.2%) | 548 (48.7%) |
| Transportation & Warehousing | 443 (67.7%) | 211 (32.3%) |
| Utilities | 92 (72.4%) | 35 (27.6%) |
| Information | 95 (74.2%) | 33 (25.8%) |
| Finance & Insurance | 39 (17.8%) | 180 (82.2%) |
| Real Estate, Rental & Leasing | 0 (0.0%) | 26 (100.0%) |
| Professional & Scientific | 30 (12.4%) | 212 (87.6%) |
| Enterprise Management | 0 (0.0%) | 0 (0.0%) |
| Administrative & Support | 248 (77.7%) | 71 (22.3%) |
| Educational Services | 395 (45.9%) | 466 (54.1%) |
| Health Care & Social Assistance | 215 (25.2%) | 637 (74.8%) |
| Arts, Entertainment & Recreation | 28 (35.9%) | 50 (64.1%) |
| Accommodation & Food Services | 213 (44.4%) | 267 (55.6%) |
| Public Administration | 144 (63.2%) | 84 (36.8%) |
| Total | 4,105 (55.8%) | 3,253 (44.2%) |
Education in Morris
School Enrollment in Morris
The most common levels of schooling among the 3,252 students in Morris are elementary school (918 | 28.2%), high school (689 | 21.2%), and college / undergraduate (585 | 18.0%).
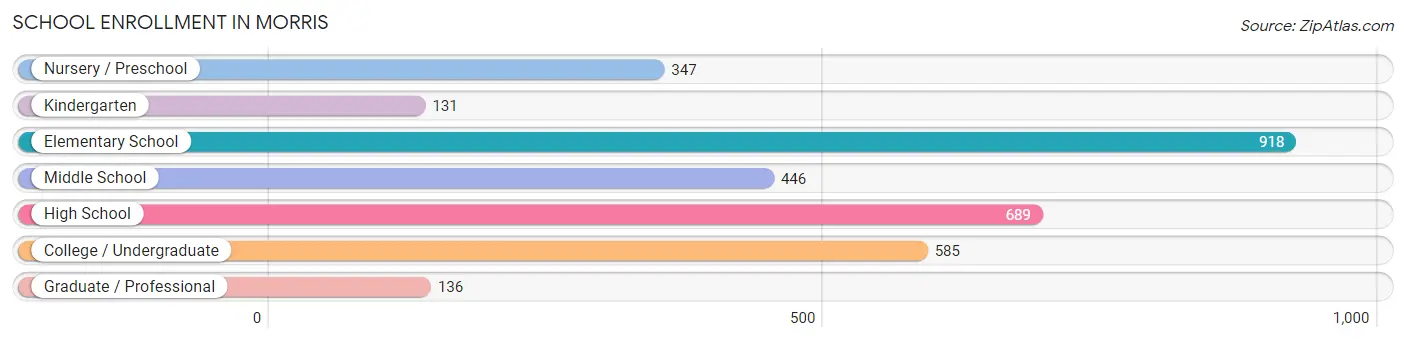
| School Level | # Students | % Students |
| Nursery / Preschool | 347 | 10.7% |
| Kindergarten | 131 | 4.0% |
| Elementary School | 918 | 28.2% |
| Middle School | 446 | 13.7% |
| High School | 689 | 21.2% |
| College / Undergraduate | 585 | 18.0% |
| Graduate / Professional | 136 | 4.2% |
| Total | 3,252 | 100.0% |
School Enrollment by Age by Funding Source in Morris
Out of a total of 3,252 students who are enrolled in schools in Morris, 306 (9.4%) attend a private institution, while the remaining 2,946 (90.6%) are enrolled in public schools. The age group of 25 to 34 year olds has the highest likelihood of being enrolled in private schools, with 59 (34.3% in the age bracket) enrolled. Conversely, the age group of 3 to 4 year olds has the lowest likelihood of being enrolled in a private school, with 267 (100.0% in the age bracket) attending a public institution.
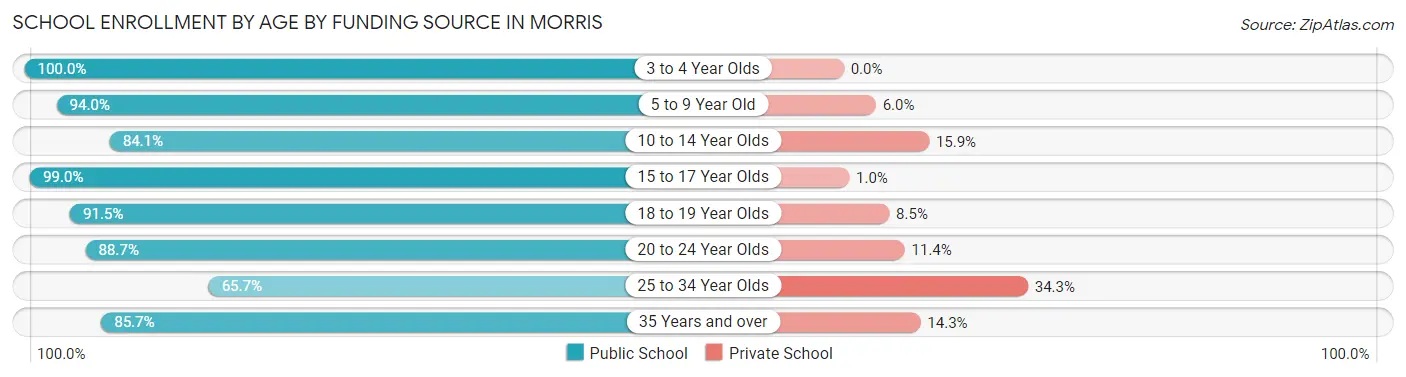
| Age Bracket | Public School | Private School |
| 3 to 4 Year Olds | 267 (100.0%) | 0 (0.0%) |
| 5 to 9 Year Old | 930 (94.0%) | 59 (6.0%) |
| 10 to 14 Year Olds | 567 (84.1%) | 107 (15.9%) |
| 15 to 17 Year Olds | 490 (99.0%) | 5 (1.0%) |
| 18 to 19 Year Olds | 162 (91.5%) | 15 (8.5%) |
| 20 to 24 Year Olds | 250 (88.6%) | 32 (11.4%) |
| 25 to 34 Year Olds | 113 (65.7%) | 59 (34.3%) |
| 35 Years and over | 168 (85.7%) | 28 (14.3%) |
| Total | 2,946 (90.6%) | 306 (9.4%) |
Educational Attainment by Field of Study in Morris
Education (554 | 20.0%), business (419 | 15.1%), social sciences (308 | 11.1%), physical & health sciences (227 | 8.2%), and science & technology (222 | 8.0%) are the most common fields of study among 2,771 individuals in Morris who have obtained a bachelor's degree or higher.
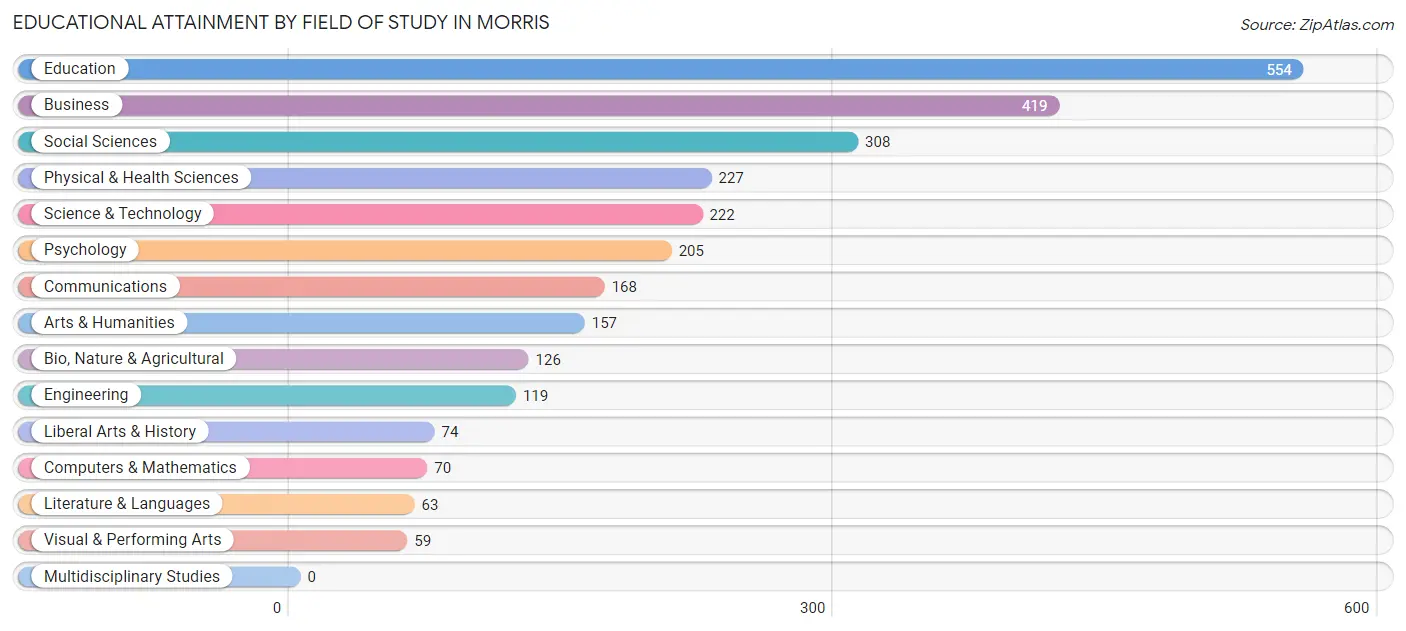
| Field of Study | # Graduates | % Graduates |
| Computers & Mathematics | 70 | 2.5% |
| Bio, Nature & Agricultural | 126 | 4.5% |
| Physical & Health Sciences | 227 | 8.2% |
| Psychology | 205 | 7.4% |
| Social Sciences | 308 | 11.1% |
| Engineering | 119 | 4.3% |
| Multidisciplinary Studies | 0 | 0.0% |
| Science & Technology | 222 | 8.0% |
| Business | 419 | 15.1% |
| Education | 554 | 20.0% |
| Literature & Languages | 63 | 2.3% |
| Liberal Arts & History | 74 | 2.7% |
| Visual & Performing Arts | 59 | 2.1% |
| Communications | 168 | 6.1% |
| Arts & Humanities | 157 | 5.7% |
| Total | 2,771 | 100.0% |
Transportation & Commute in Morris
Vehicle Availability by Sex in Morris
The most prevalent vehicle ownership categories in Morris are males with 2 vehicles (2,058, accounting for 50.8%) and females with 2 vehicles (1,540, making up 66.8%).
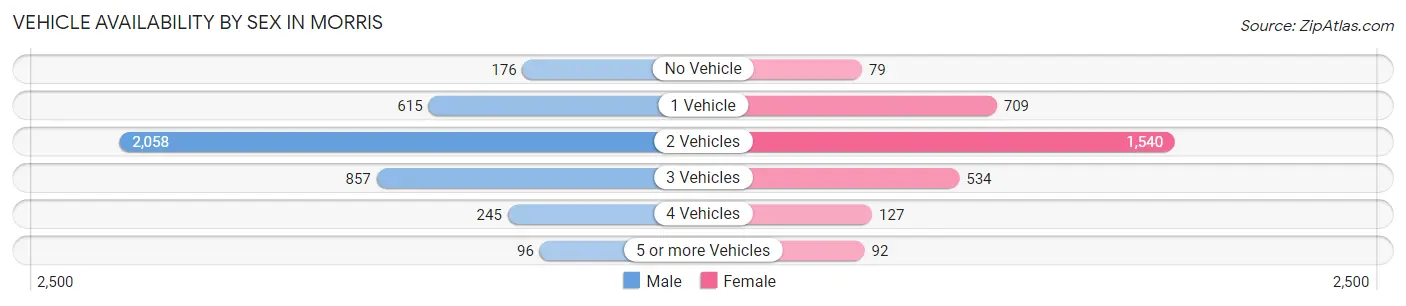
| Vehicles Available | Male | Female |
| No Vehicle | 176 (4.3%) | 79 (2.6%) |
| 1 Vehicle | 615 (15.2%) | 709 (23.0%) |
| 2 Vehicles | 2,058 (50.8%) | 1,540 (50.0%) |
| 3 Vehicles | 857 (21.2%) | 534 (17.3%) |
| 4 Vehicles | 245 (6.0%) | 127 (4.1%) |
| 5 or more Vehicles | 96 (2.4%) | 92 (3.0%) |
| Total | 4,047 (100.0%) | 3,081 (100.0%) |
Commute Time in Morris
The most frequently occuring commute durations in Morris are 5 to 9 minutes (1,501 commuters, 23.0%), 10 to 14 minutes (955 commuters, 14.6%), and 30 to 34 minutes (865 commuters, 13.3%).
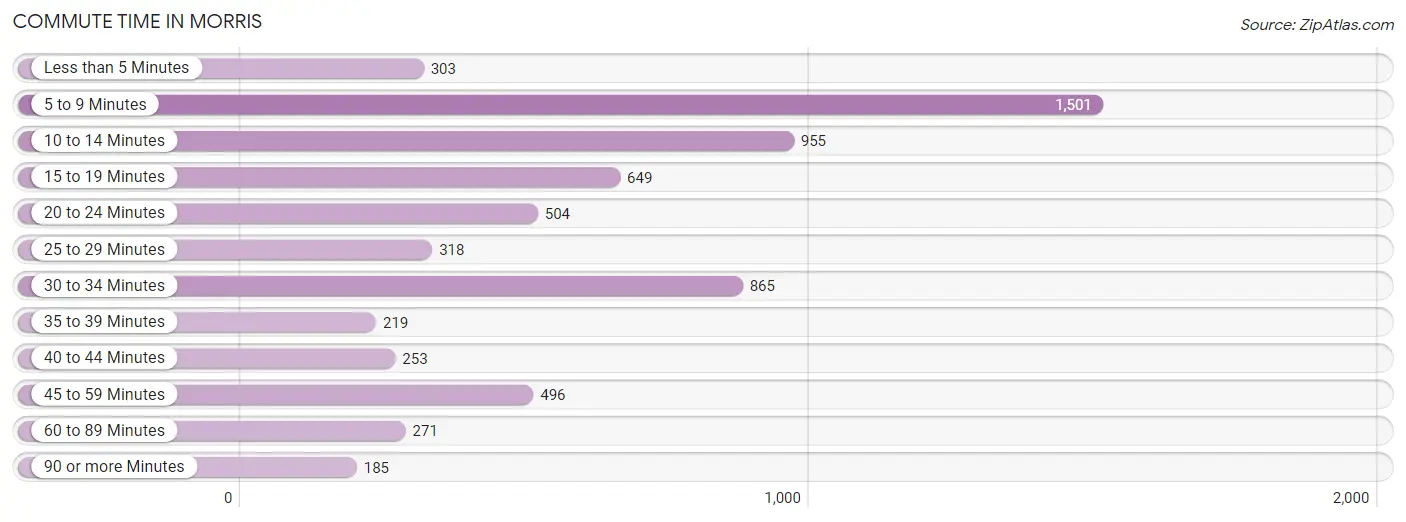
| Commute Time | # Commuters | % Commuters |
| Less than 5 Minutes | 303 | 4.6% |
| 5 to 9 Minutes | 1,501 | 23.0% |
| 10 to 14 Minutes | 955 | 14.6% |
| 15 to 19 Minutes | 649 | 10.0% |
| 20 to 24 Minutes | 504 | 7.7% |
| 25 to 29 Minutes | 318 | 4.9% |
| 30 to 34 Minutes | 865 | 13.3% |
| 35 to 39 Minutes | 219 | 3.4% |
| 40 to 44 Minutes | 253 | 3.9% |
| 45 to 59 Minutes | 496 | 7.6% |
| 60 to 89 Minutes | 271 | 4.2% |
| 90 or more Minutes | 185 | 2.8% |
Commute Time by Sex in Morris
The most common commute times in Morris are 5 to 9 minutes (518 commuters, 14.1%) for males and 5 to 9 minutes (983 commuters, 34.4%) for females.
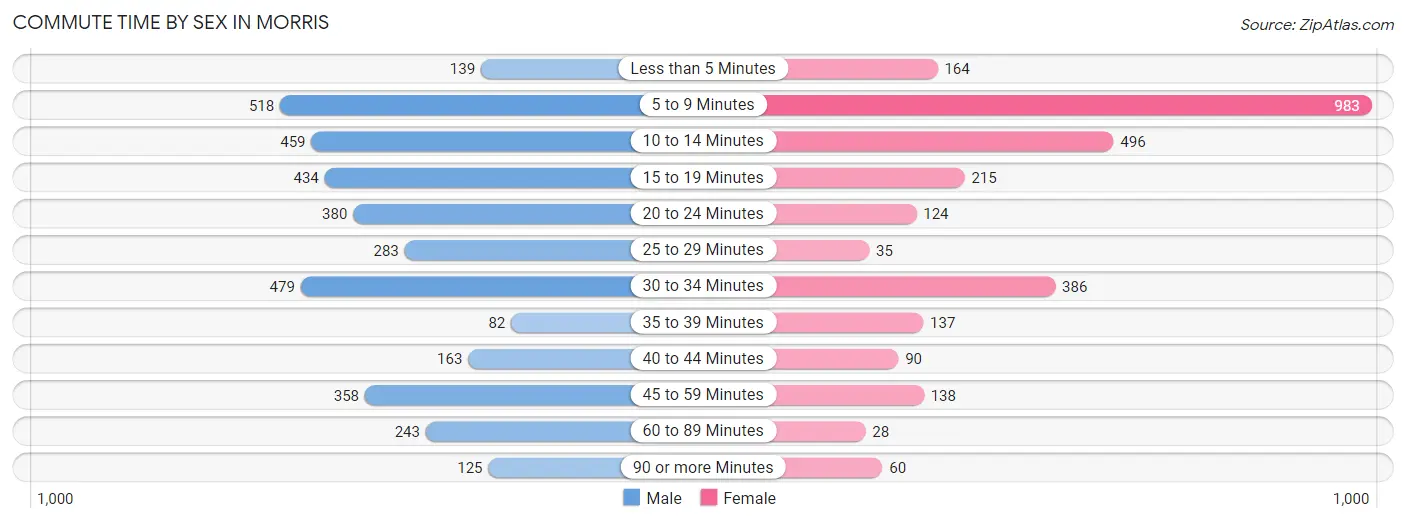
| Commute Time | Male | Female |
| Less than 5 Minutes | 139 (3.8%) | 164 (5.7%) |
| 5 to 9 Minutes | 518 (14.1%) | 983 (34.4%) |
| 10 to 14 Minutes | 459 (12.5%) | 496 (17.4%) |
| 15 to 19 Minutes | 434 (11.8%) | 215 (7.5%) |
| 20 to 24 Minutes | 380 (10.4%) | 124 (4.3%) |
| 25 to 29 Minutes | 283 (7.7%) | 35 (1.2%) |
| 30 to 34 Minutes | 479 (13.1%) | 386 (13.5%) |
| 35 to 39 Minutes | 82 (2.2%) | 137 (4.8%) |
| 40 to 44 Minutes | 163 (4.4%) | 90 (3.2%) |
| 45 to 59 Minutes | 358 (9.8%) | 138 (4.8%) |
| 60 to 89 Minutes | 243 (6.6%) | 28 (1.0%) |
| 90 or more Minutes | 125 (3.4%) | 60 (2.1%) |
Time of Departure to Work by Sex in Morris
The most frequent times of departure to work in Morris are 6:00 AM to 6:29 AM (602, 16.4%) for males and 7:00 AM to 7:29 AM (587, 20.5%) for females.
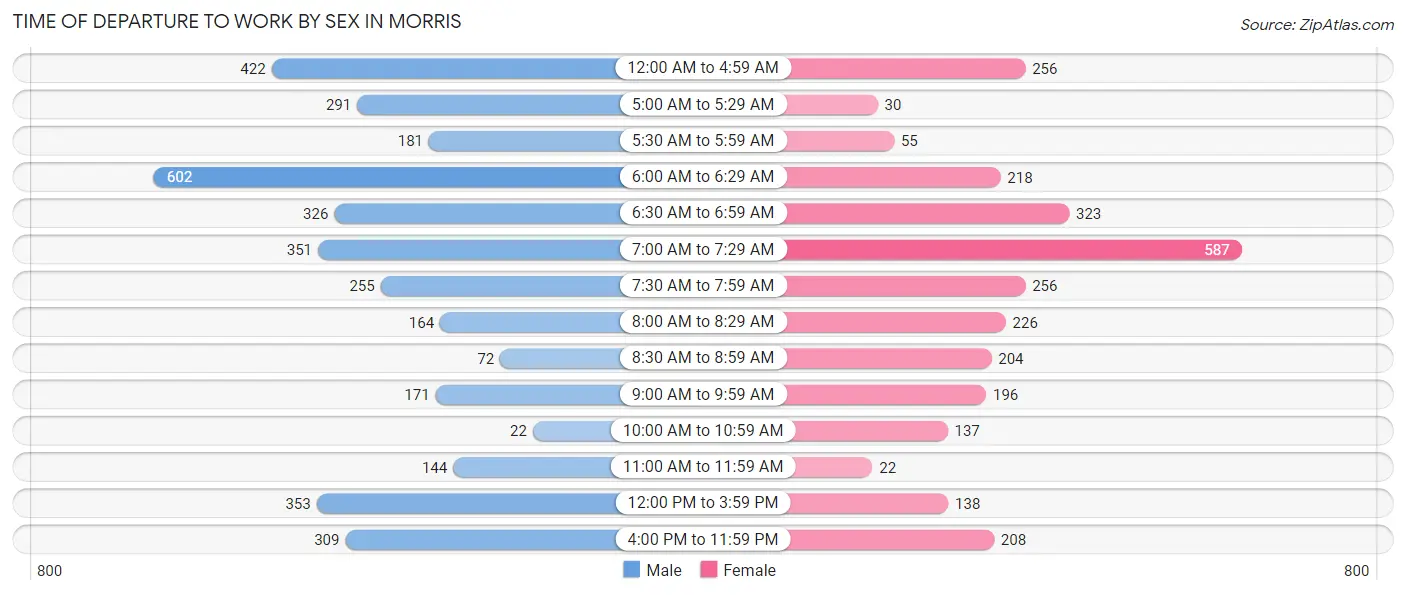
| Time of Departure | Male | Female |
| 12:00 AM to 4:59 AM | 422 (11.5%) | 256 (9.0%) |
| 5:00 AM to 5:29 AM | 291 (7.9%) | 30 (1.1%) |
| 5:30 AM to 5:59 AM | 181 (4.9%) | 55 (1.9%) |
| 6:00 AM to 6:29 AM | 602 (16.4%) | 218 (7.6%) |
| 6:30 AM to 6:59 AM | 326 (8.9%) | 323 (11.3%) |
| 7:00 AM to 7:29 AM | 351 (9.6%) | 587 (20.5%) |
| 7:30 AM to 7:59 AM | 255 (7.0%) | 256 (9.0%) |
| 8:00 AM to 8:29 AM | 164 (4.5%) | 226 (7.9%) |
| 8:30 AM to 8:59 AM | 72 (2.0%) | 204 (7.1%) |
| 9:00 AM to 9:59 AM | 171 (4.7%) | 196 (6.9%) |
| 10:00 AM to 10:59 AM | 22 (0.6%) | 137 (4.8%) |
| 11:00 AM to 11:59 AM | 144 (3.9%) | 22 (0.8%) |
| 12:00 PM to 3:59 PM | 353 (9.6%) | 138 (4.8%) |
| 4:00 PM to 11:59 PM | 309 (8.4%) | 208 (7.3%) |
| Total | 3,663 (100.0%) | 2,856 (100.0%) |
Housing Occupancy in Morris
Occupancy by Ownership in Morris
Of the total 6,258 dwellings in Morris, owner-occupied units account for 3,622 (57.9%), while renter-occupied units make up 2,636 (42.1%).
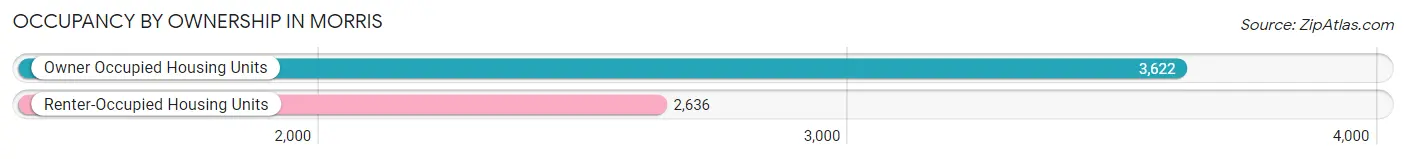
| Occupancy | # Housing Units | % Housing Units |
| Owner Occupied Housing Units | 3,622 | 57.9% |
| Renter-Occupied Housing Units | 2,636 | 42.1% |
| Total Occupied Housing Units | 6,258 | 100.0% |
Occupancy by Household Size in Morris
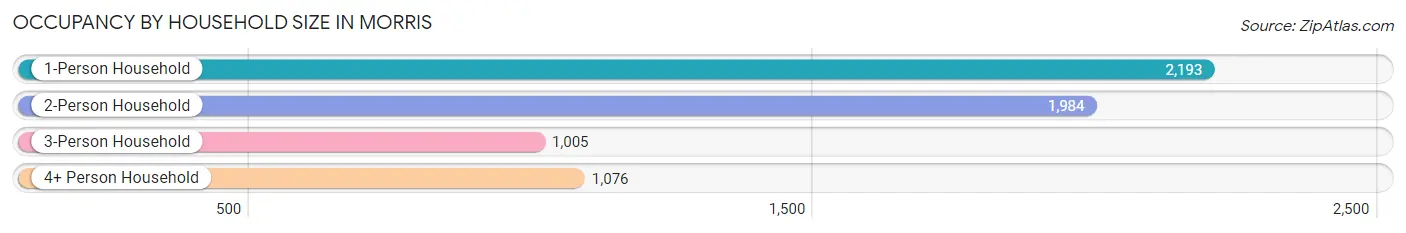
| Household Size | # Housing Units | % Housing Units |
| 1-Person Household | 2,193 | 35.0% |
| 2-Person Household | 1,984 | 31.7% |
| 3-Person Household | 1,005 | 16.1% |
| 4+ Person Household | 1,076 | 17.2% |
| Total Housing Units | 6,258 | 100.0% |
Occupancy by Ownership by Household Size in Morris
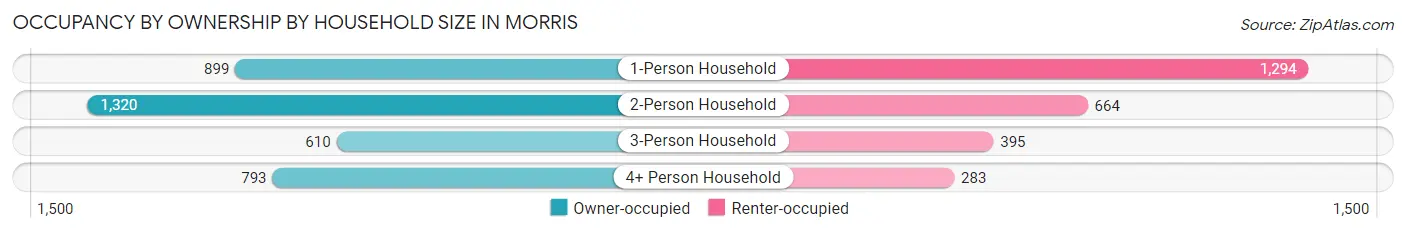
| Household Size | Owner-occupied | Renter-occupied |
| 1-Person Household | 899 (41.0%) | 1,294 (59.0%) |
| 2-Person Household | 1,320 (66.5%) | 664 (33.5%) |
| 3-Person Household | 610 (60.7%) | 395 (39.3%) |
| 4+ Person Household | 793 (73.7%) | 283 (26.3%) |
| Total Housing Units | 3,622 (57.9%) | 2,636 (42.1%) |
Occupancy by Educational Attainment in Morris
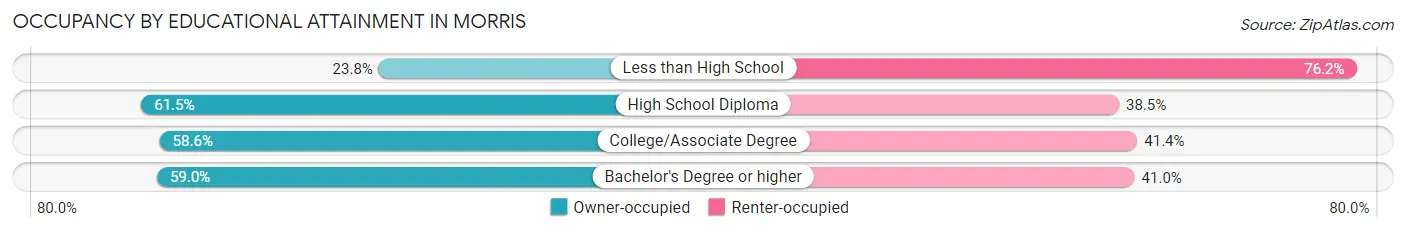
| Household Size | Owner-occupied | Renter-occupied |
| Less than High School | 77 (23.8%) | 246 (76.2%) |
| High School Diploma | 1,312 (61.5%) | 822 (38.5%) |
| College/Associate Degree | 1,315 (58.6%) | 930 (41.4%) |
| Bachelor's Degree or higher | 918 (59.0%) | 638 (41.0%) |
Occupancy by Age of Householder in Morris
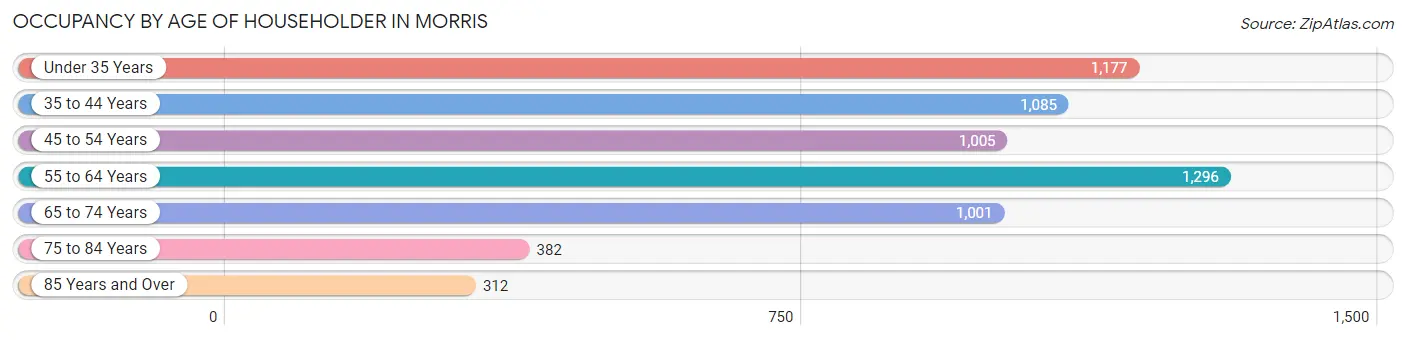
| Age Bracket | # Households | % Households |
| Under 35 Years | 1,177 | 18.8% |
| 35 to 44 Years | 1,085 | 17.3% |
| 45 to 54 Years | 1,005 | 16.1% |
| 55 to 64 Years | 1,296 | 20.7% |
| 65 to 74 Years | 1,001 | 16.0% |
| 75 to 84 Years | 382 | 6.1% |
| 85 Years and Over | 312 | 5.0% |
| Total | 6,258 | 100.0% |
Housing Finances in Morris
Median Income by Occupancy in Morris
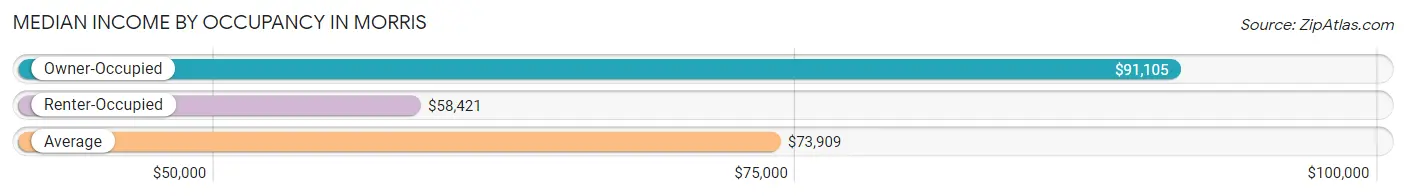
| Occupancy Type | # Households | Median Income |
| Owner-Occupied | 3,622 (57.9%) | $91,105 |
| Renter-Occupied | 2,636 (42.1%) | $58,421 |
| Average | 6,258 (100.0%) | $73,909 |
Occupancy by Householder Income Bracket in Morris
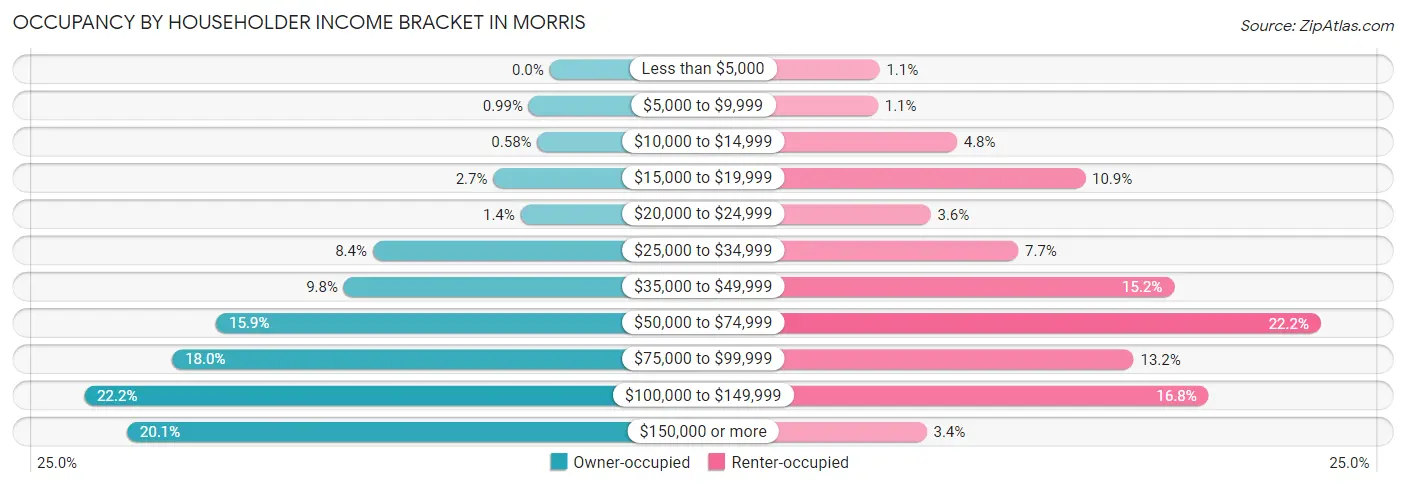
| Income Bracket | Owner-occupied | Renter-occupied |
| Less than $5,000 | 0 (0.0%) | 30 (1.1%) |
| $5,000 to $9,999 | 36 (1.0%) | 28 (1.1%) |
| $10,000 to $14,999 | 21 (0.6%) | 127 (4.8%) |
| $15,000 to $19,999 | 97 (2.7%) | 288 (10.9%) |
| $20,000 to $24,999 | 50 (1.4%) | 94 (3.6%) |
| $25,000 to $34,999 | 305 (8.4%) | 204 (7.7%) |
| $35,000 to $49,999 | 355 (9.8%) | 400 (15.2%) |
| $50,000 to $74,999 | 575 (15.9%) | 584 (22.2%) |
| $75,000 to $99,999 | 651 (18.0%) | 349 (13.2%) |
| $100,000 to $149,999 | 803 (22.2%) | 443 (16.8%) |
| $150,000 or more | 729 (20.1%) | 89 (3.4%) |
| Total | 3,622 (100.0%) | 2,636 (100.0%) |
Monthly Housing Cost Tiers in Morris
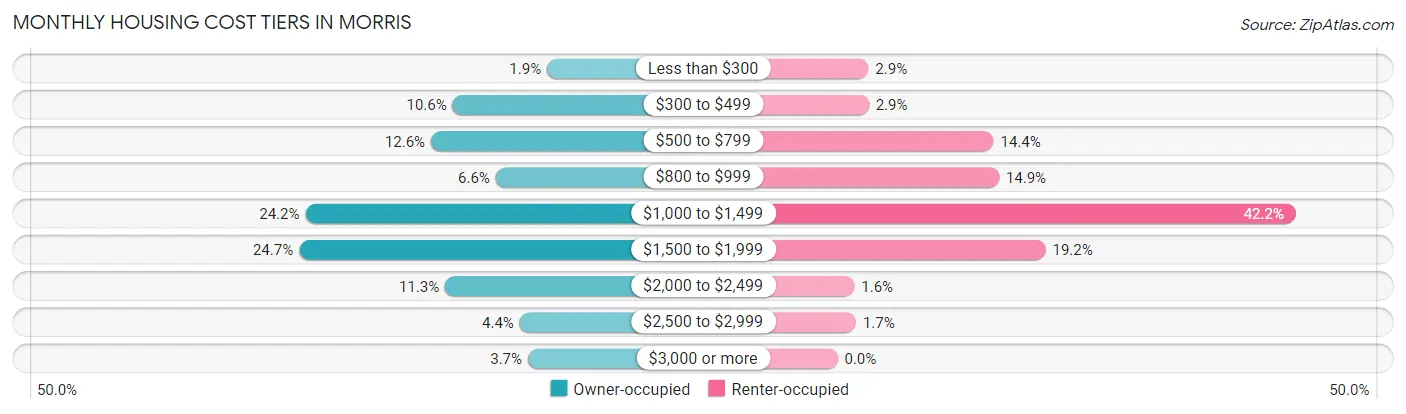
| Monthly Cost | Owner-occupied | Renter-occupied |
| Less than $300 | 69 (1.9%) | 75 (2.9%) |
| $300 to $499 | 384 (10.6%) | 76 (2.9%) |
| $500 to $799 | 456 (12.6%) | 379 (14.4%) |
| $800 to $999 | 240 (6.6%) | 392 (14.9%) |
| $1,000 to $1,499 | 875 (24.2%) | 1,112 (42.2%) |
| $1,500 to $1,999 | 896 (24.7%) | 505 (19.2%) |
| $2,000 to $2,499 | 409 (11.3%) | 41 (1.6%) |
| $2,500 to $2,999 | 160 (4.4%) | 45 (1.7%) |
| $3,000 or more | 133 (3.7%) | 0 (0.0%) |
| Total | 3,622 (100.0%) | 2,636 (100.0%) |
Physical Housing Characteristics in Morris
Housing Structures in Morris
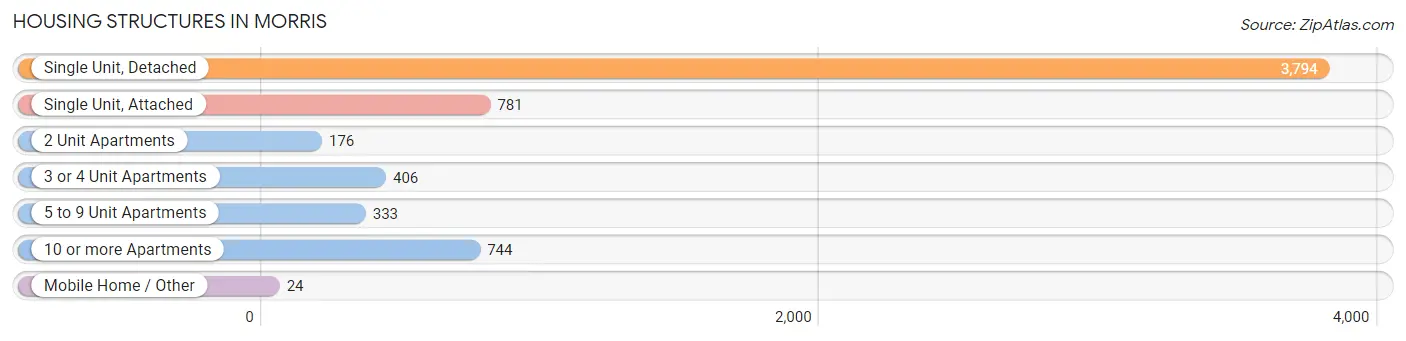
| Structure Type | # Housing Units | % Housing Units |
| Single Unit, Detached | 3,794 | 60.6% |
| Single Unit, Attached | 781 | 12.5% |
| 2 Unit Apartments | 176 | 2.8% |
| 3 or 4 Unit Apartments | 406 | 6.5% |
| 5 to 9 Unit Apartments | 333 | 5.3% |
| 10 or more Apartments | 744 | 11.9% |
| Mobile Home / Other | 24 | 0.4% |
| Total | 6,258 | 100.0% |
Housing Structures by Occupancy in Morris
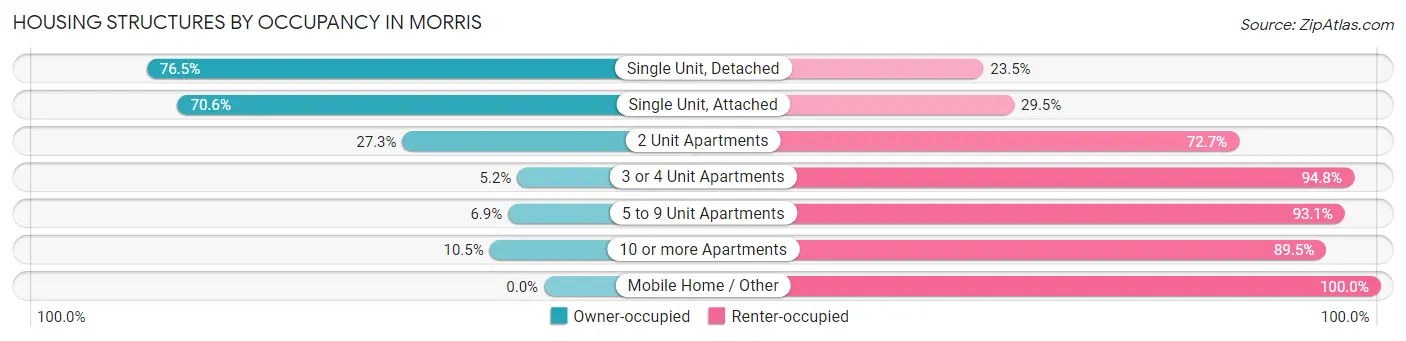
| Structure Type | Owner-occupied | Renter-occupied |
| Single Unit, Detached | 2,901 (76.5%) | 893 (23.5%) |
| Single Unit, Attached | 551 (70.6%) | 230 (29.4%) |
| 2 Unit Apartments | 48 (27.3%) | 128 (72.7%) |
| 3 or 4 Unit Apartments | 21 (5.2%) | 385 (94.8%) |
| 5 to 9 Unit Apartments | 23 (6.9%) | 310 (93.1%) |
| 10 or more Apartments | 78 (10.5%) | 666 (89.5%) |
| Mobile Home / Other | 0 (0.0%) | 24 (100.0%) |
| Total | 3,622 (57.9%) | 2,636 (42.1%) |
Housing Structures by Number of Rooms in Morris
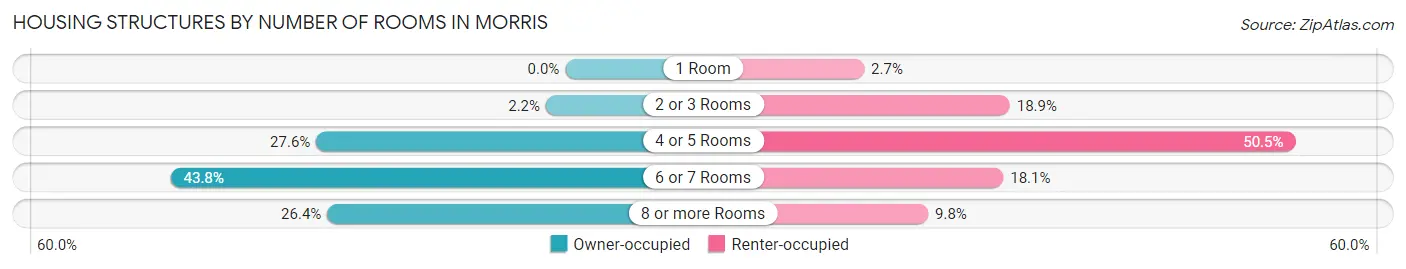
| Number of Rooms | Owner-occupied | Renter-occupied |
| 1 Room | 0 (0.0%) | 71 (2.7%) |
| 2 or 3 Rooms | 78 (2.1%) | 497 (18.9%) |
| 4 or 5 Rooms | 1,001 (27.6%) | 1,332 (50.5%) |
| 6 or 7 Rooms | 1,586 (43.8%) | 478 (18.1%) |
| 8 or more Rooms | 957 (26.4%) | 258 (9.8%) |
| Total | 3,622 (100.0%) | 2,636 (100.0%) |
Housing Structure by Heating Type in Morris
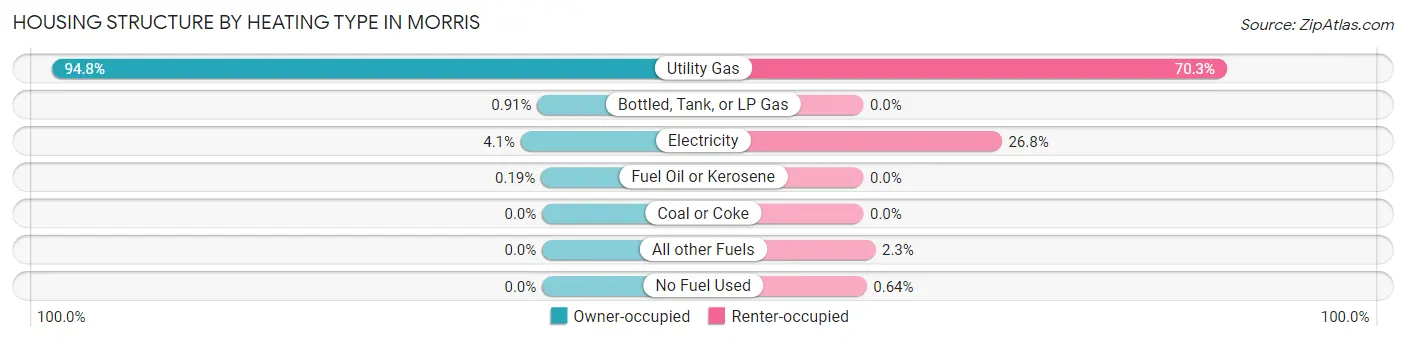
| Heating Type | Owner-occupied | Renter-occupied |
| Utility Gas | 3,433 (94.8%) | 1,853 (70.3%) |
| Bottled, Tank, or LP Gas | 33 (0.9%) | 0 (0.0%) |
| Electricity | 149 (4.1%) | 705 (26.8%) |
| Fuel Oil or Kerosene | 7 (0.2%) | 0 (0.0%) |
| Coal or Coke | 0 (0.0%) | 0 (0.0%) |
| All other Fuels | 0 (0.0%) | 61 (2.3%) |
| No Fuel Used | 0 (0.0%) | 17 (0.6%) |
| Total | 3,622 (100.0%) | 2,636 (100.0%) |
Household Vehicle Usage in Morris
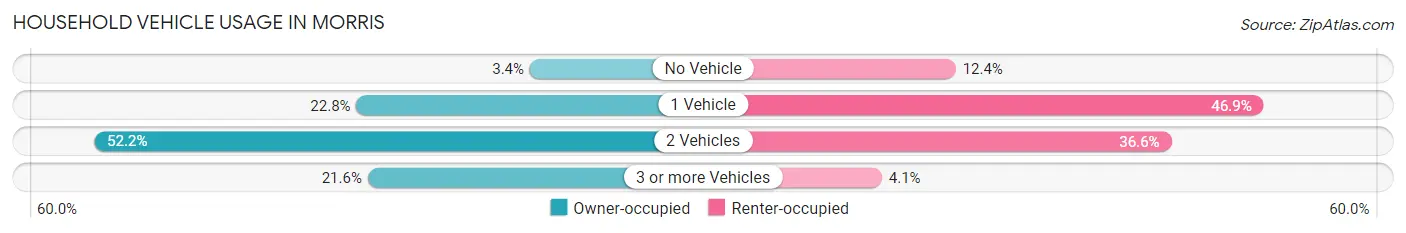
| Vehicles per Household | Owner-occupied | Renter-occupied |
| No Vehicle | 123 (3.4%) | 327 (12.4%) |
| 1 Vehicle | 827 (22.8%) | 1,236 (46.9%) |
| 2 Vehicles | 1,891 (52.2%) | 964 (36.6%) |
| 3 or more Vehicles | 781 (21.6%) | 109 (4.1%) |
| Total | 3,622 (100.0%) | 2,636 (100.0%) |
Real Estate & Mortgages in Morris
Real Estate and Mortgage Overview in Morris
| Characteristic | Without Mortgage | With Mortgage |
| Housing Units | 1,217 | 2,405 |
| Median Property Value | $213,300 | $240,900 |
| Median Household Income | $66,719 | $573 |
| Monthly Housing Costs | $681 | $133 |
| Real Estate Taxes | $4,387 | $54 |
Property Value by Mortgage Status in Morris
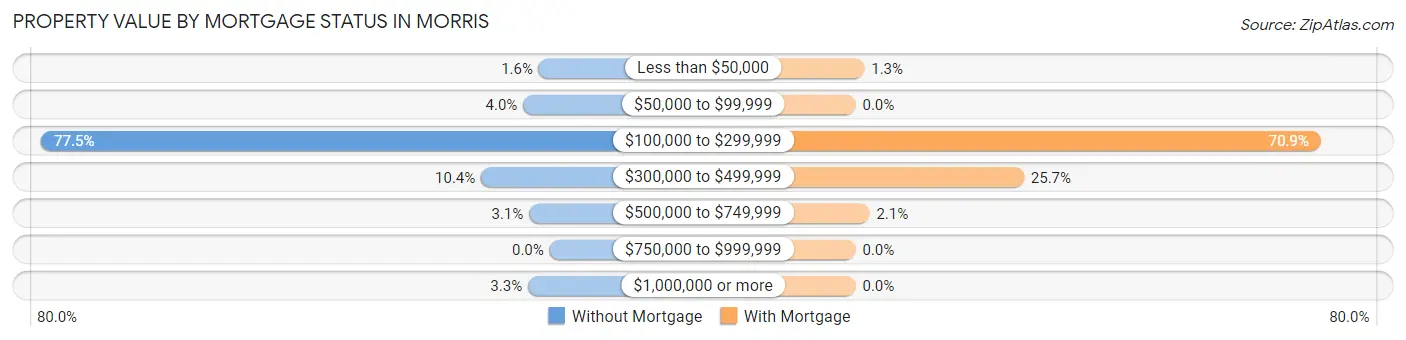
| Property Value | Without Mortgage | With Mortgage |
| Less than $50,000 | 20 (1.6%) | 32 (1.3%) |
| $50,000 to $99,999 | 49 (4.0%) | 0 (0.0%) |
| $100,000 to $299,999 | 943 (77.5%) | 1,705 (70.9%) |
| $300,000 to $499,999 | 127 (10.4%) | 617 (25.7%) |
| $500,000 to $749,999 | 38 (3.1%) | 51 (2.1%) |
| $750,000 to $999,999 | 0 (0.0%) | 0 (0.0%) |
| $1,000,000 or more | 40 (3.3%) | 0 (0.0%) |
| Total | 1,217 (100.0%) | 2,405 (100.0%) |
Household Income by Mortgage Status in Morris
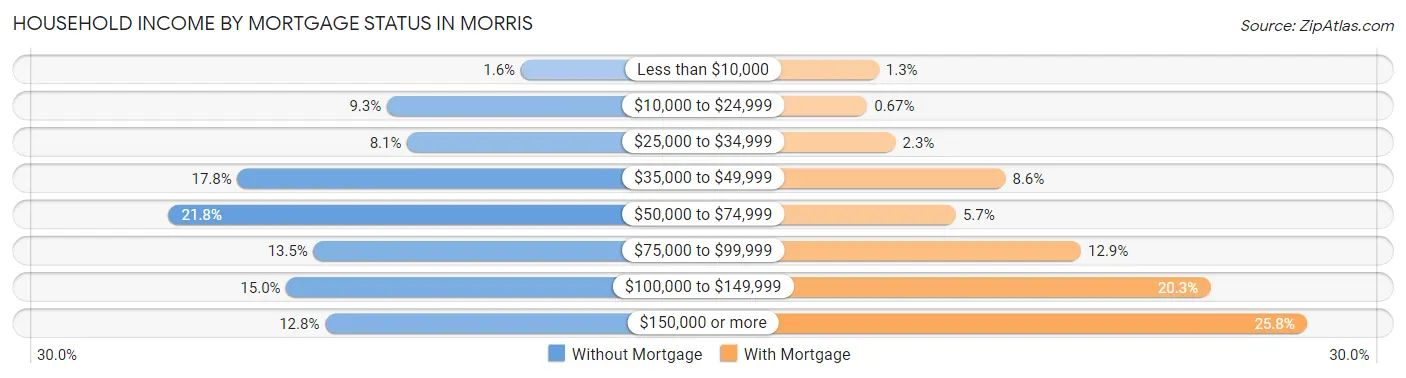
| Household Income | Without Mortgage | With Mortgage |
| Less than $10,000 | 20 (1.6%) | 32 (1.3%) |
| $10,000 to $24,999 | 113 (9.3%) | 16 (0.7%) |
| $25,000 to $34,999 | 99 (8.1%) | 55 (2.3%) |
| $35,000 to $49,999 | 217 (17.8%) | 206 (8.6%) |
| $50,000 to $74,999 | 265 (21.8%) | 138 (5.7%) |
| $75,000 to $99,999 | 164 (13.5%) | 310 (12.9%) |
| $100,000 to $149,999 | 183 (15.0%) | 487 (20.3%) |
| $150,000 or more | 156 (12.8%) | 620 (25.8%) |
| Total | 1,217 (100.0%) | 2,405 (100.0%) |
Property Value to Household Income Ratio in Morris
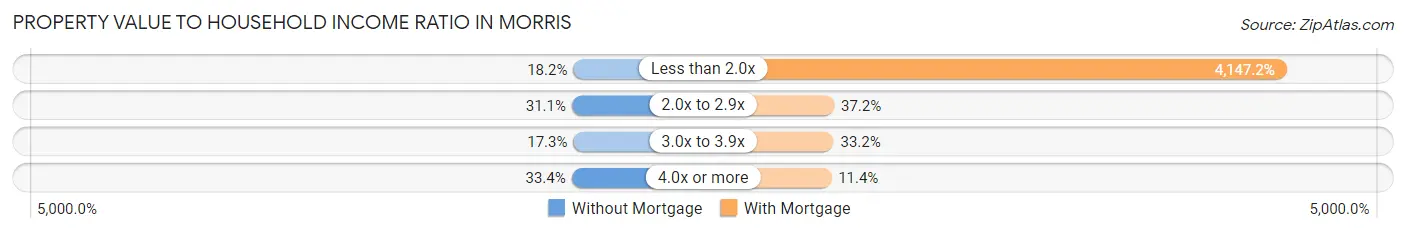
| Value-to-Income Ratio | Without Mortgage | With Mortgage |
| Less than 2.0x | 221 (18.2%) | 99,739 (4,147.1%) |
| 2.0x to 2.9x | 379 (31.1%) | 895 (37.2%) |
| 3.0x to 3.9x | 210 (17.3%) | 799 (33.2%) |
| 4.0x or more | 407 (33.4%) | 274 (11.4%) |
| Total | 1,217 (100.0%) | 2,405 (100.0%) |
Real Estate Taxes by Mortgage Status in Morris
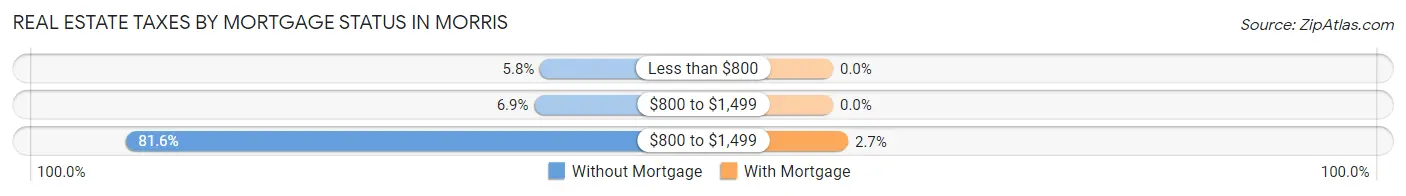
| Property Taxes | Without Mortgage | With Mortgage |
| Less than $800 | 71 (5.8%) | 0 (0.0%) |
| $800 to $1,499 | 84 (6.9%) | 0 (0.0%) |
| $800 to $1,499 | 993 (81.6%) | 66 (2.7%) |
| Total | 1,217 (100.0%) | 2,405 (100.0%) |
Health & Disability in Morris
Health Insurance Coverage by Age in Morris
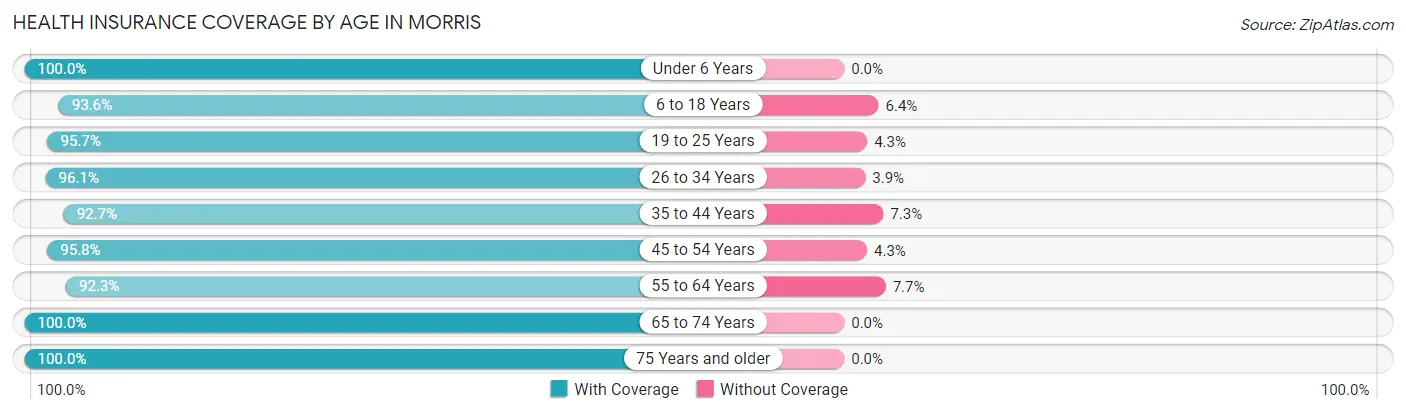
| Age Bracket | With Coverage | Without Coverage |
| Under 6 Years | 1,032 (100.0%) | 0 (0.0%) |
| 6 to 18 Years | 2,167 (93.6%) | 148 (6.4%) |
| 19 to 25 Years | 1,163 (95.7%) | 52 (4.3%) |
| 26 to 34 Years | 1,542 (96.1%) | 63 (3.9%) |
| 35 to 44 Years | 1,727 (92.7%) | 136 (7.3%) |
| 45 to 54 Years | 1,868 (95.8%) | 83 (4.3%) |
| 55 to 64 Years | 1,659 (92.3%) | 139 (7.7%) |
| 65 to 74 Years | 1,527 (100.0%) | 0 (0.0%) |
| 75 Years and older | 861 (100.0%) | 0 (0.0%) |
| Total | 13,546 (95.6%) | 621 (4.4%) |
Health Insurance Coverage by Citizenship Status in Morris
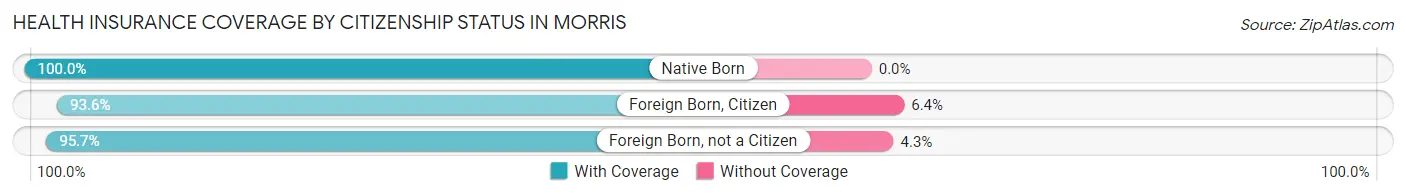
| Citizenship Status | With Coverage | Without Coverage |
| Native Born | 1,032 (100.0%) | 0 (0.0%) |
| Foreign Born, Citizen | 2,167 (93.6%) | 148 (6.4%) |
| Foreign Born, not a Citizen | 1,163 (95.7%) | 52 (4.3%) |
Health Insurance Coverage by Household Income in Morris
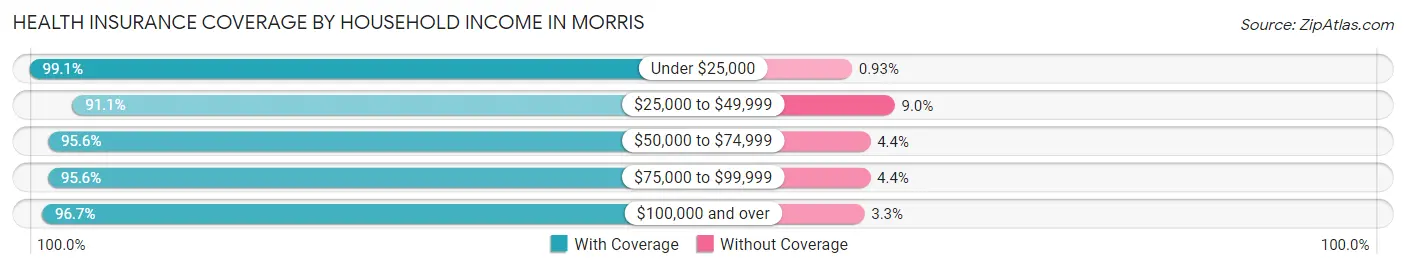
| Household Income | With Coverage | Without Coverage |
| Under $25,000 | 1,062 (99.1%) | 10 (0.9%) |
| $25,000 to $49,999 | 1,893 (91.0%) | 186 (8.9%) |
| $50,000 to $74,999 | 2,158 (95.6%) | 99 (4.4%) |
| $75,000 to $99,999 | 2,326 (95.6%) | 106 (4.4%) |
| $100,000 and over | 6,095 (96.7%) | 207 (3.3%) |
Public vs Private Health Insurance Coverage by Age in Morris
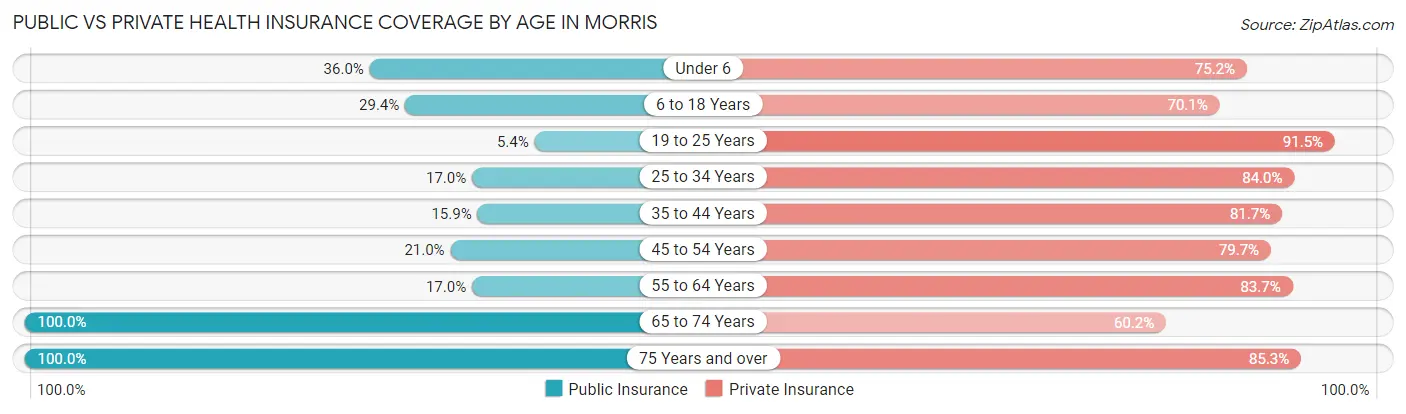
| Age Bracket | Public Insurance | Private Insurance |
| Under 6 | 371 (35.9%) | 776 (75.2%) |
| 6 to 18 Years | 680 (29.4%) | 1,623 (70.1%) |
| 19 to 25 Years | 65 (5.3%) | 1,112 (91.5%) |
| 25 to 34 Years | 272 (17.0%) | 1,348 (84.0%) |
| 35 to 44 Years | 297 (15.9%) | 1,522 (81.7%) |
| 45 to 54 Years | 409 (21.0%) | 1,554 (79.6%) |
| 55 to 64 Years | 305 (17.0%) | 1,504 (83.7%) |
| 65 to 74 Years | 1,527 (100.0%) | 919 (60.2%) |
| 75 Years and over | 861 (100.0%) | 734 (85.3%) |
| Total | 4,787 (33.8%) | 11,092 (78.3%) |
Disability Status by Sex by Age in Morris
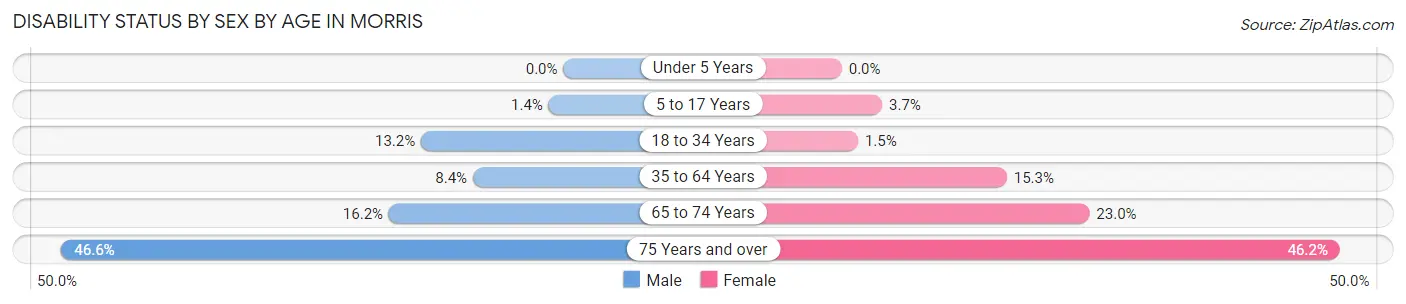
| Age Bracket | Male | Female |
| Under 5 Years | 0 (0.0%) | 0 (0.0%) |
| 5 to 17 Years | 17 (1.4%) | 43 (3.7%) |
| 18 to 34 Years | 199 (13.2%) | 22 (1.5%) |
| 35 to 64 Years | 245 (8.4%) | 412 (15.3%) |
| 65 to 74 Years | 119 (16.2%) | 182 (23.0%) |
| 75 Years and over | 143 (46.6%) | 256 (46.2%) |
Disability Class by Sex by Age in Morris
Disability Class: Hearing Difficulty
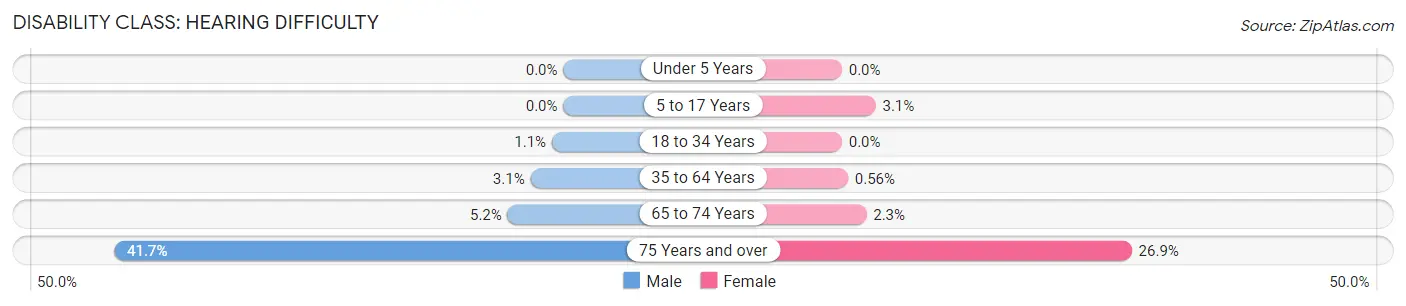
| Age Bracket | Male | Female |
| Under 5 Years | 0 (0.0%) | 0 (0.0%) |
| 5 to 17 Years | 0 (0.0%) | 36 (3.1%) |
| 18 to 34 Years | 16 (1.1%) | 0 (0.0%) |
| 35 to 64 Years | 89 (3.0%) | 15 (0.6%) |
| 65 to 74 Years | 38 (5.2%) | 18 (2.3%) |
| 75 Years and over | 128 (41.7%) | 149 (26.9%) |
Disability Class: Vision Difficulty
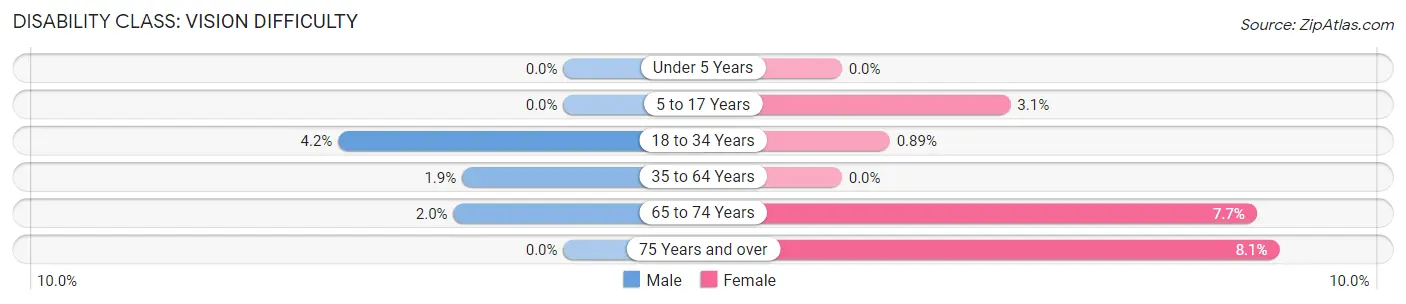
| Age Bracket | Male | Female |
| Under 5 Years | 0 (0.0%) | 0 (0.0%) |
| 5 to 17 Years | 0 (0.0%) | 36 (3.1%) |
| 18 to 34 Years | 63 (4.2%) | 13 (0.9%) |
| 35 to 64 Years | 55 (1.9%) | 0 (0.0%) |
| 65 to 74 Years | 15 (2.0%) | 61 (7.7%) |
| 75 Years and over | 0 (0.0%) | 45 (8.1%) |
Disability Class: Cognitive Difficulty
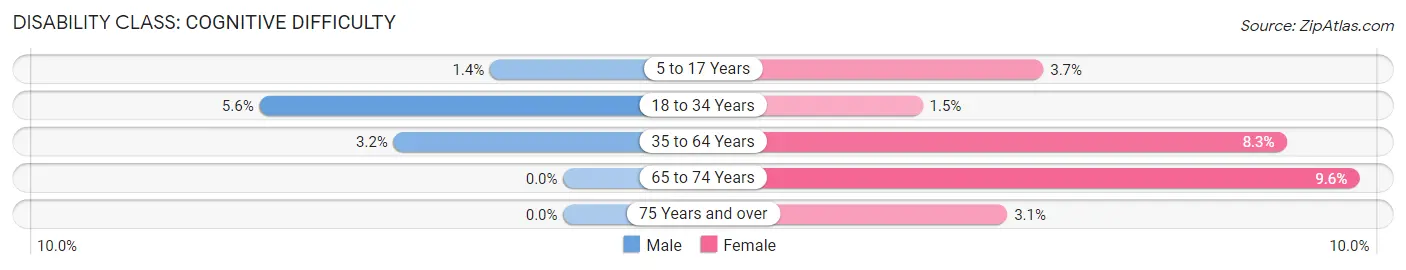
| Age Bracket | Male | Female |
| 5 to 17 Years | 17 (1.4%) | 43 (3.7%) |
| 18 to 34 Years | 85 (5.6%) | 22 (1.5%) |
| 35 to 64 Years | 92 (3.2%) | 222 (8.3%) |
| 65 to 74 Years | 0 (0.0%) | 76 (9.6%) |
| 75 Years and over | 0 (0.0%) | 17 (3.1%) |
Disability Class: Ambulatory Difficulty
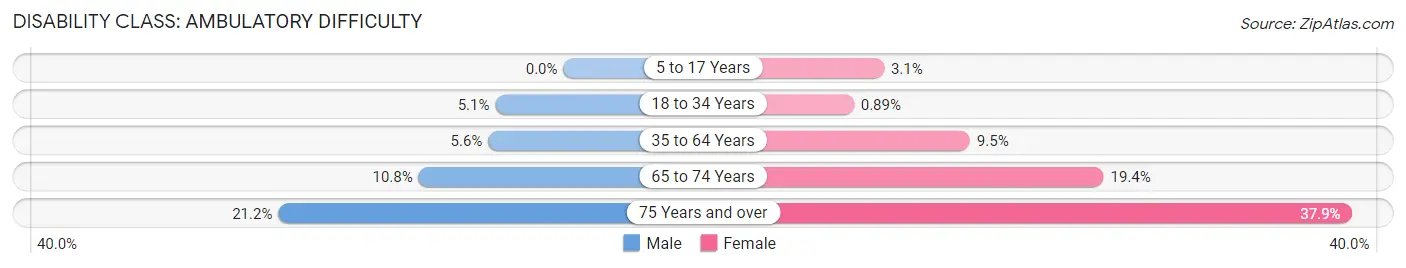
| Age Bracket | Male | Female |
| 5 to 17 Years | 0 (0.0%) | 36 (3.1%) |
| 18 to 34 Years | 76 (5.1%) | 13 (0.9%) |
| 35 to 64 Years | 163 (5.6%) | 256 (9.5%) |
| 65 to 74 Years | 79 (10.7%) | 154 (19.4%) |
| 75 Years and over | 65 (21.2%) | 210 (37.9%) |
Disability Class: Self-Care Difficulty
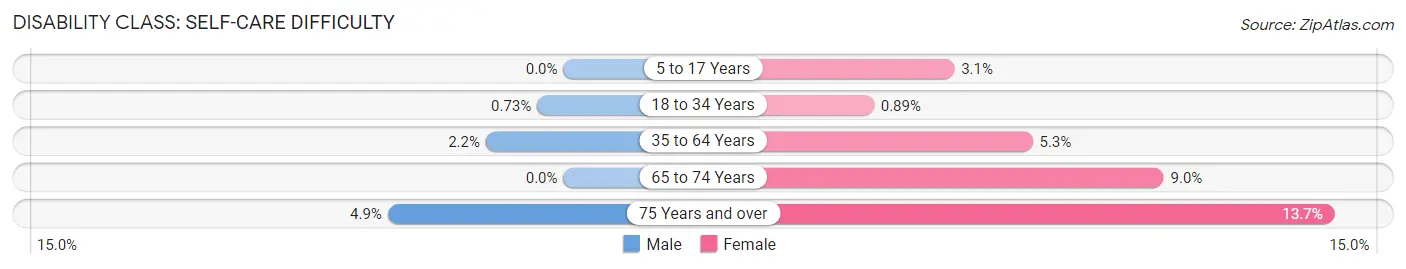
| Age Bracket | Male | Female |
| 5 to 17 Years | 0 (0.0%) | 36 (3.1%) |
| 18 to 34 Years | 11 (0.7%) | 13 (0.9%) |
| 35 to 64 Years | 63 (2.2%) | 143 (5.3%) |
| 65 to 74 Years | 0 (0.0%) | 71 (9.0%) |
| 75 Years and over | 15 (4.9%) | 76 (13.7%) |
Technology Access in Morris
Computing Device Access in Morris
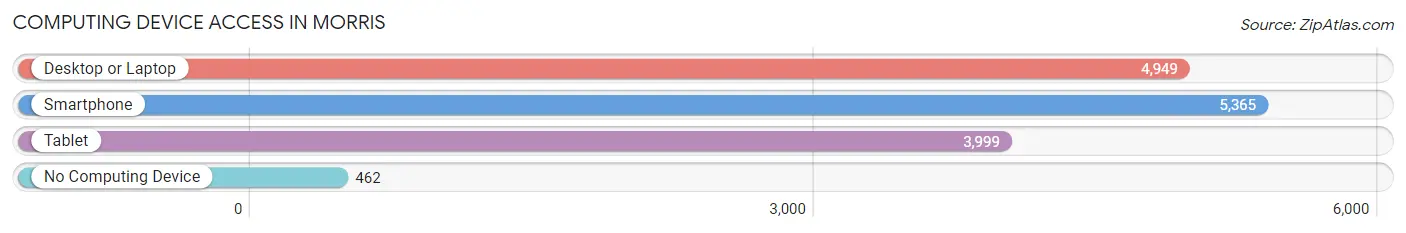
| Device Type | # Households | % Households |
| Desktop or Laptop | 4,949 | 79.1% |
| Smartphone | 5,365 | 85.7% |
| Tablet | 3,999 | 63.9% |
| No Computing Device | 462 | 7.4% |
| Total | 6,258 | 100.0% |
Internet Access in Morris
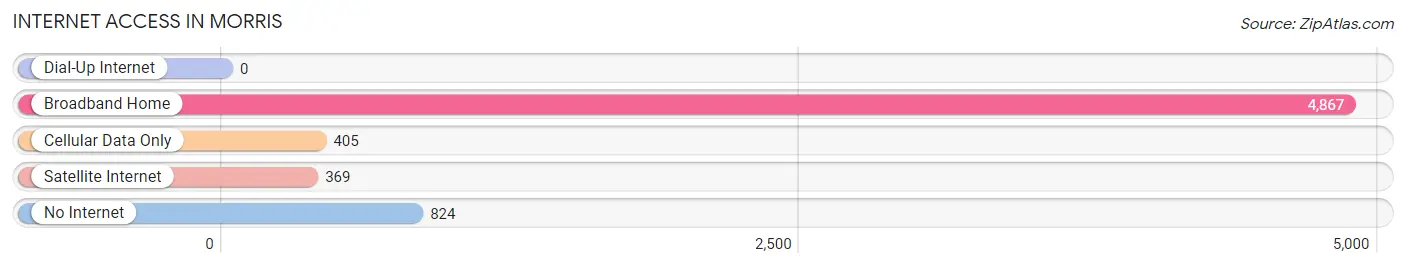
| Internet Type | # Households | % Households |
| Dial-Up Internet | 0 | 0.0% |
| Broadband Home | 4,867 | 77.8% |
| Cellular Data Only | 405 | 6.5% |
| Satellite Internet | 369 | 5.9% |
| No Internet | 824 | 13.2% |
| Total | 6,258 | 100.0% |
Morris Summary
Morris, Illinois is a city located in Grundy County, Illinois, United States. The population was 13,636 at the 2010 census, making it the largest city in Grundy County. Morris is part of the Chicago metropolitan area and is located approximately 60 miles southwest of Chicago.
History
The area that is now Morris was first settled in 1835 by William and Mary Morris. The Morris family was among the first settlers in the area and the city was named after them. The city was officially incorporated in 1853.
In the late 19th century, Morris was a major stop on the Chicago, Rock Island and Pacific Railroad. The railroad brought many new people to the area and helped to spur the growth of the city.
In the early 20th century, Morris was a major center for the coal mining industry. The city was home to several coal mines, which provided employment for many of the city’s residents.
Geography
Morris is located at 41°21′N 88°27′W (41.35, -88.45). According to the 2010 census, the city has a total area of 8.9 square miles (23.1 km2), of which 8.8 square miles (22.8 km2) is land and 0.1 square miles (0.3 km2) is water.
Economy
Morris is a major center for the coal mining industry. The city is home to several coal mines, which provide employment for many of the city’s residents.
The city is also home to several manufacturing companies, including Morris Manufacturing, which produces industrial equipment, and Morris Tool and Die, which produces machine tools.
Morris is also home to several retail stores including Walmart Target and Kohl s
Demographics
As of the 2010 census, there were 13,636 people, 5,541 households, and 3,619 families residing in the city. The population density was 1,541.3 people per square mile (595.2/km2). There were 5,945 housing units at an average density of 672.3 per square mile (259.7/km2). The racial makeup of the city was 94.2% White, 0.7% African American, 0.2% Native American, 0.7% Asian, 2.3% from other races, and 1.9% from two or more races. Hispanic or Latino of any race were 5.7% of the population.
There were 5,541 households, out of which 30.2% had children under the age of 18 living with them, 48.2% were married couples living together, 12.2% had a female householder with no husband present, and 34.7% were non-families. 29.3% of all households were made up of individuals, and 12.7% had someone living alone who was 65 years of age or older. The average household size was 2.44 and the average family size was 3.01.
In the city, the population was spread out, with 24.2% under the age of 18, 8.2% from 18 to 24, 28.2% from 25 to 44, 22.7% from 45 to 64, and 16.7% who were 65 years of age or older. The median age was 38 years. For every 100 females, there were 93.2 males. For every 100 females age 18 and over, there were 89.7 males.
The median income for a household in the city was $45,945, and the median income for a family was $54,945. Males had a median income of $41,945 versus $30,945 for females. The per capita income for the city was $21,945. About 5.2% of families and 7.2% of the population were below the poverty line, including 9.2% of those under age 18 and 6.2% of those age 65 or over.
Common Questions
What is Per Capita Income in Morris?
Per Capita income in Morris is $38,503.
What is the Median Family Income in Morris?
Median Family Income in Morris is $96,530.
What is the Median Household income in Morris?
Median Household Income in Morris is $73,909.
What is Income or Wage Gap in Morris?
Income or Wage Gap in Morris is 49.3%.
Women in Morris earn 50.7 cents for every dollar earned by a man.
What is Inequality or Gini Index in Morris?
Inequality or Gini Index in Morris is 0.38.
What is the Total Population of Morris?
Total Population of Morris is 14,491.
What is the Total Male Population of Morris?
Total Male Population of Morris is 7,228.
What is the Total Female Population of Morris?
Total Female Population of Morris is 7,263.
What is the Ratio of Males per 100 Females in Morris?
There are 99.52 Males per 100 Females in Morris.
What is the Ratio of Females per 100 Males in Morris?
There are 100.48 Females per 100 Males in Morris.
What is the Median Population Age in Morris?
Median Population Age in Morris is 39.5 Years.
What is the Average Family Size in Morris
Average Family Size in Morris is 3.0 People.
What is the Average Household Size in Morris
Average Household Size in Morris is 2.3 People.
How Large is the Labor Force in Morris?
There are 7,521 People in the Labor Forcein in Morris.
What is the Percentage of People in the Labor Force in Morris?
64.7% of People are in the Labor Force in Morris.
What is the Unemployment Rate in Morris?
Unemployment Rate in Morris is 2.2%.