Effingham, IL Map & Demographics
Effingham Map
Effingham Overview
$33,472
PER CAPITA INCOME
$78,326
AVG FAMILY INCOME
$62,358
AVG HOUSEHOLD INCOME
34.0%
WAGE / INCOME GAP [ % ]
66.0¢/ $1
WAGE / INCOME GAP [ $ ]
0.44
INEQUALITY / GINI INDEX
12,244
TOTAL POPULATION
5,713
MALE POPULATION
6,531
FEMALE POPULATION
87.48
MALES / 100 FEMALES
114.32
FEMALES / 100 MALES
37.1
MEDIAN AGE
3.0
AVG FAMILY SIZE
2.3
AVG HOUSEHOLD SIZE
6,159
LABOR FORCE [ PEOPLE ]
64.0%
PERCENT IN LABOR FORCE
2.9%
UNEMPLOYMENT RATE
Effingham Zip Codes
Effingham Area Codes
Income in Effingham
Income Overview in Effingham
Per Capita Income in Effingham is $33,472, while median incomes of families and households are $78,326 and $62,358 respectively.
| Characteristic | Number | Measure |
| Per Capita Income | 12,244 | $33,472 |
| Median Family Income | 2,968 | $78,326 |
| Mean Family Income | 2,968 | $96,365 |
| Median Household Income | 5,140 | $62,358 |
| Mean Household Income | 5,140 | $79,543 |
| Income Deficit | 2,968 | $0 |
| Wage / Income Gap (%) | 12,244 | 33.98% |
| Wage / Income Gap ($) | 12,244 | 66.02¢ per $1 |
| Gini / Inequality Index | 12,244 | 0.44 |
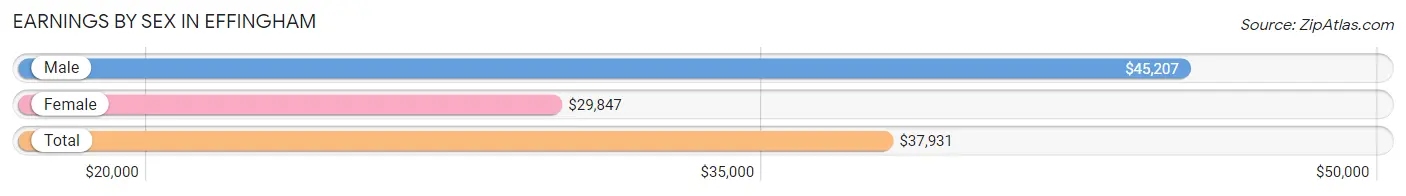
Earnings by Sex in Effingham
Average Earnings in Effingham are $37,931, $45,207 for men and $29,847 for women, a difference of 34.0%.
| Sex | Number | Average Earnings |
| Male | 3,183 (49.4%) | $45,207 |
| Female | 3,259 (50.6%) | $29,847 |
| Total | 6,442 (100.0%) | $37,931 |
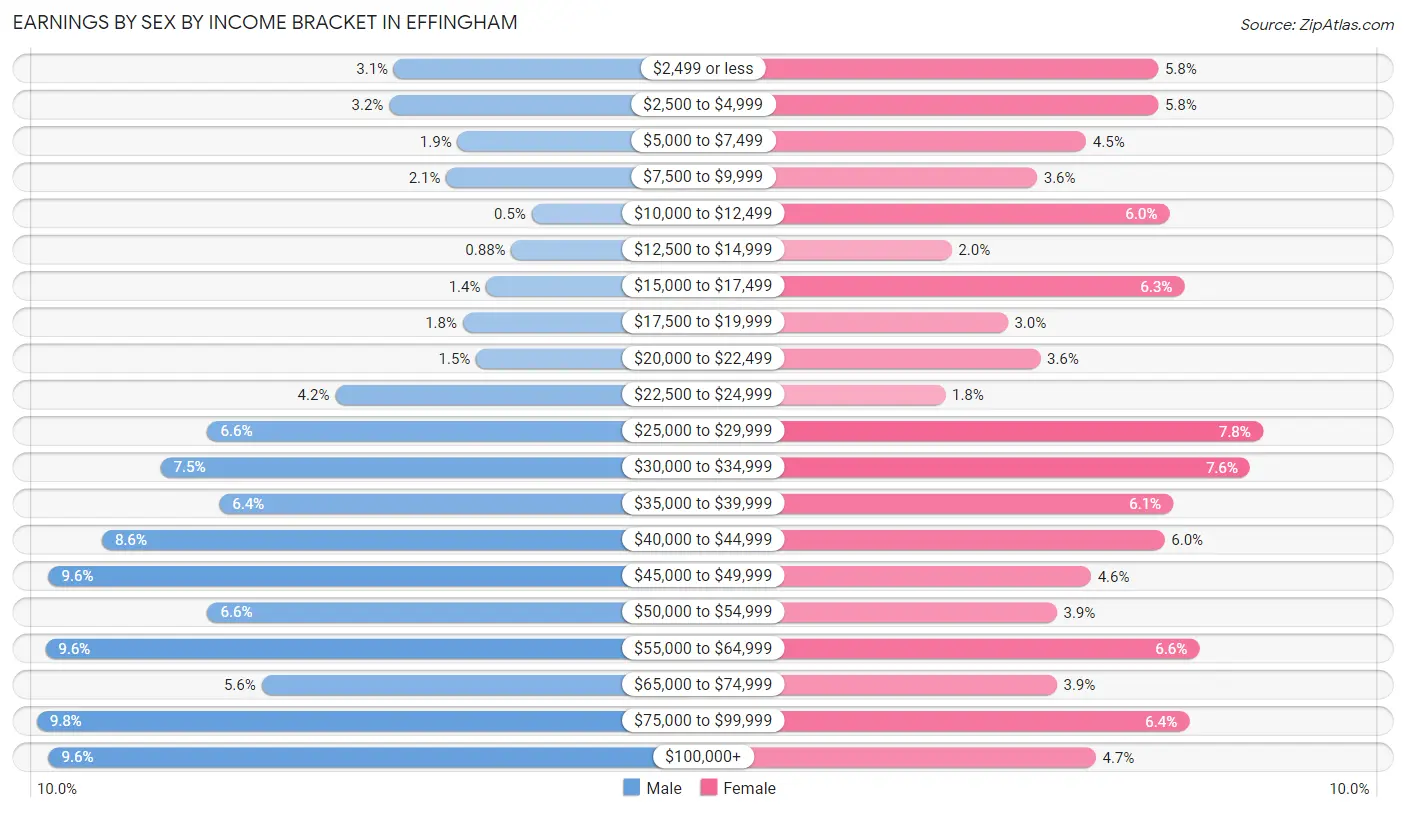
Earnings by Sex by Income Bracket in Effingham
The most common earnings brackets in Effingham are $75,000 to $99,999 for men (311 | 9.8%) and $25,000 to $29,999 for women (254 | 7.8%).
| Income | Male | Female |
| $2,499 or less | 98 (3.1%) | 190 (5.8%) |
| $2,500 to $4,999 | 101 (3.2%) | 190 (5.8%) |
| $5,000 to $7,499 | 60 (1.9%) | 146 (4.5%) |
| $7,500 to $9,999 | 67 (2.1%) | 116 (3.6%) |
| $10,000 to $12,499 | 16 (0.5%) | 197 (6.0%) |
| $12,500 to $14,999 | 28 (0.9%) | 64 (2.0%) |
| $15,000 to $17,499 | 43 (1.3%) | 206 (6.3%) |
| $17,500 to $19,999 | 57 (1.8%) | 98 (3.0%) |
| $20,000 to $22,499 | 49 (1.5%) | 118 (3.6%) |
| $22,500 to $24,999 | 133 (4.2%) | 60 (1.8%) |
| $25,000 to $29,999 | 209 (6.6%) | 254 (7.8%) |
| $30,000 to $34,999 | 237 (7.4%) | 246 (7.5%) |
| $35,000 to $39,999 | 202 (6.4%) | 199 (6.1%) |
| $40,000 to $44,999 | 272 (8.6%) | 194 (5.9%) |
| $45,000 to $49,999 | 304 (9.6%) | 149 (4.6%) |
| $50,000 to $54,999 | 209 (6.6%) | 128 (3.9%) |
| $55,000 to $64,999 | 306 (9.6%) | 215 (6.6%) |
| $65,000 to $74,999 | 177 (5.6%) | 128 (3.9%) |
| $75,000 to $99,999 | 311 (9.8%) | 209 (6.4%) |
| $100,000+ | 304 (9.6%) | 152 (4.7%) |
| Total | 3,183 (100.0%) | 3,259 (100.0%) |
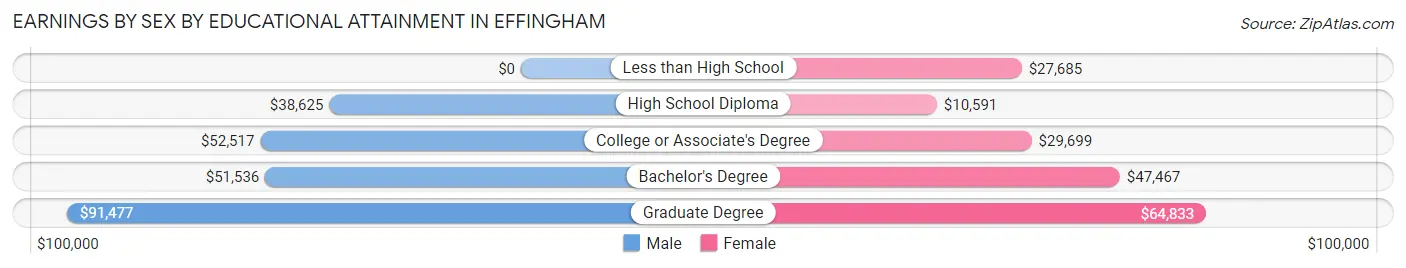
Earnings by Sex by Educational Attainment in Effingham
Average earnings in Effingham are $48,261 for men and $35,444 for women, a difference of 26.6%. Men with an educational attainment of graduate degree enjoy the highest average annual earnings of $91,477, while those with high school diploma education earn the least with $38,625. Women with an educational attainment of graduate degree earn the most with the average annual earnings of $64,833, while those with high school diploma education have the smallest earnings of $10,591.
| Educational Attainment | Male Income | Female Income |
| Less than High School | - | - |
| High School Diploma | $38,625 | $10,591 |
| College or Associate's Degree | $52,517 | $29,699 |
| Bachelor's Degree | $51,536 | $47,467 |
| Graduate Degree | $91,477 | $64,833 |
| Total | $48,261 | $35,444 |
Family Income in Effingham
Family Income Brackets in Effingham
According to the Effingham family income data, there are 614 families falling into the $100,000 to $149,999 income range, which is the most common income bracket and makes up 20.7% of all families. Conversely, the $10,000 to $14,999 income bracket is the least frequent group with only 27 families (0.9%) belonging to this category.
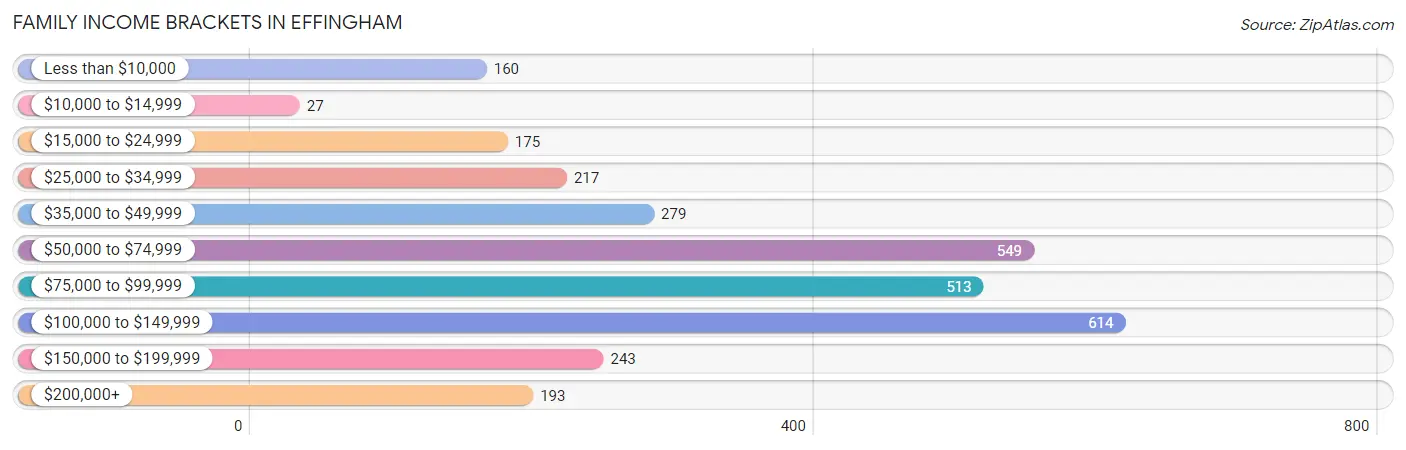
| Income Bracket | # Families | % Families |
| Less than $10,000 | 160 | 5.4% |
| $10,000 to $14,999 | 27 | 0.9% |
| $15,000 to $24,999 | 175 | 5.9% |
| $25,000 to $34,999 | 217 | 7.3% |
| $35,000 to $49,999 | 279 | 9.4% |
| $50,000 to $74,999 | 549 | 18.5% |
| $75,000 to $99,999 | 513 | 17.3% |
| $100,000 to $149,999 | 614 | 20.7% |
| $150,000 to $199,999 | 243 | 8.2% |
| $200,000+ | 193 | 6.5% |
Family Income by Famaliy Size in Effingham
6-person families (134 | 4.5%) account for the highest median family income in Effingham with $159,833 per family, while 2-person families (1,372 | 46.2%) have the highest median income of $34,358 per family member.
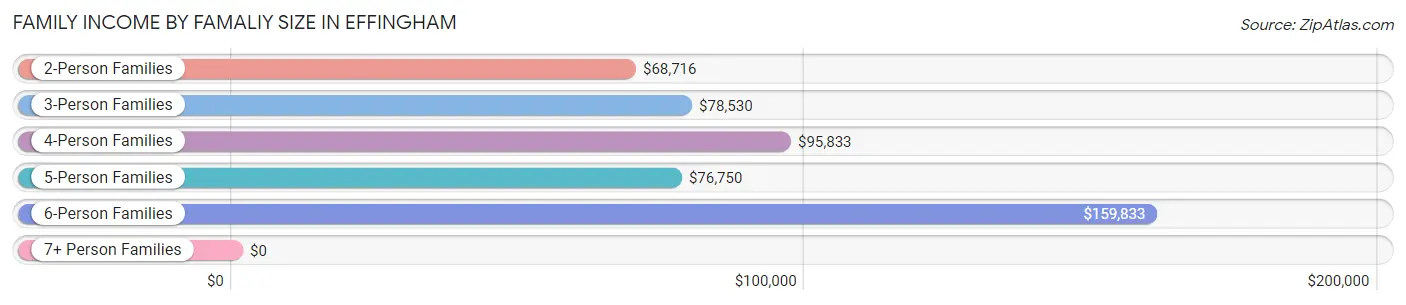
| Income Bracket | # Families | Median Income |
| 2-Person Families | 1,372 (46.2%) | $68,716 |
| 3-Person Families | 663 (22.3%) | $78,530 |
| 4-Person Families | 570 (19.2%) | $95,833 |
| 5-Person Families | 222 (7.5%) | $76,750 |
| 6-Person Families | 134 (4.5%) | $159,833 |
| 7+ Person Families | 7 (0.2%) | $0 |
| Total | 2,968 (100.0%) | $78,326 |
Family Income by Number of Earners in Effingham
The median family income in Effingham is $78,326, with families comprising 3+ earners (356) having the highest median family income of $102,292, while families with no earners (423) have the lowest median family income of $42,880, accounting for 12.0% and 14.2% of families, respectively.
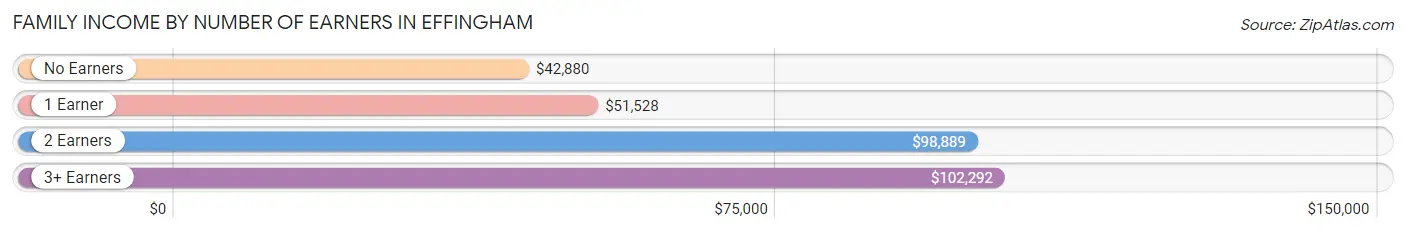
| Number of Earners | # Families | Median Income |
| No Earners | 423 (14.2%) | $42,880 |
| 1 Earner | 1,063 (35.8%) | $51,528 |
| 2 Earners | 1,126 (37.9%) | $98,889 |
| 3+ Earners | 356 (12.0%) | $102,292 |
| Total | 2,968 (100.0%) | $78,326 |
Household Income in Effingham
Household Income Brackets in Effingham
With 961 households falling in the category, the $50,000 to $74,999 income range is the most frequent in Effingham, accounting for 18.7% of all households. In contrast, only 211 households (4.1%) fall into the $10,000 to $14,999 income bracket, making it the least populous group.
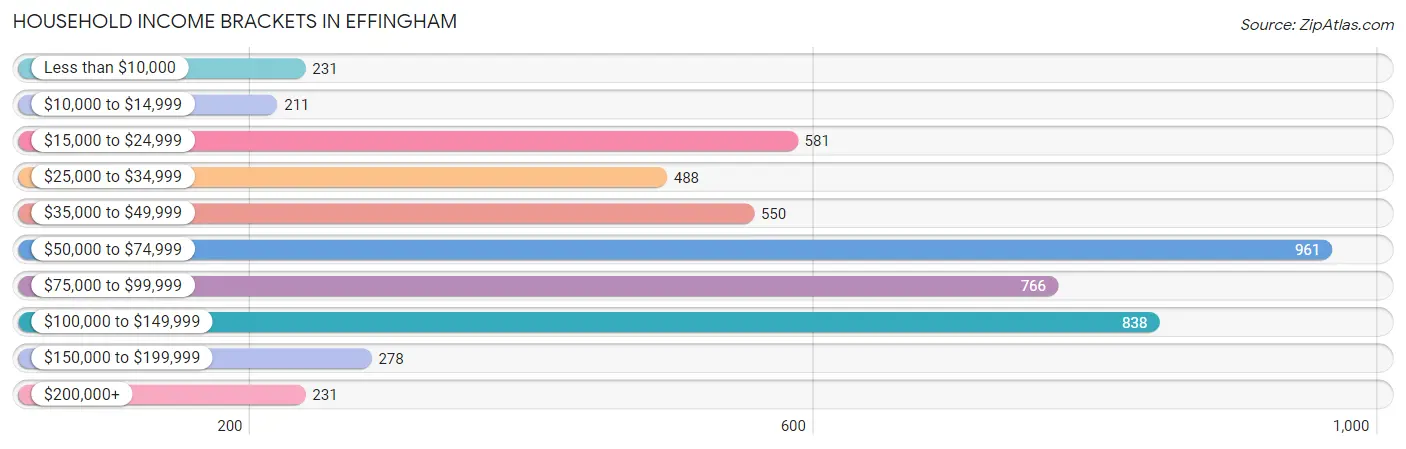
| Income Bracket | # Households | % Households |
| Less than $10,000 | 231 | 4.5% |
| $10,000 to $14,999 | 211 | 4.1% |
| $15,000 to $24,999 | 581 | 11.3% |
| $25,000 to $34,999 | 488 | 9.5% |
| $35,000 to $49,999 | 550 | 10.7% |
| $50,000 to $74,999 | 961 | 18.7% |
| $75,000 to $99,999 | 766 | 14.9% |
| $100,000 to $149,999 | 838 | 16.3% |
| $150,000 to $199,999 | 278 | 5.4% |
| $200,000+ | 231 | 4.5% |
Household Income by Householder Age in Effingham
The median household income in Effingham is $62,358, with the highest median household income of $80,962 found in the 45 to 64 years age bracket for the primary householder. A total of 1,530 households (29.8%) fall into this category. Meanwhile, the 65+ years age bracket for the primary householder has the lowest median household income of $44,007, with 1,470 households (28.6%) in this group.
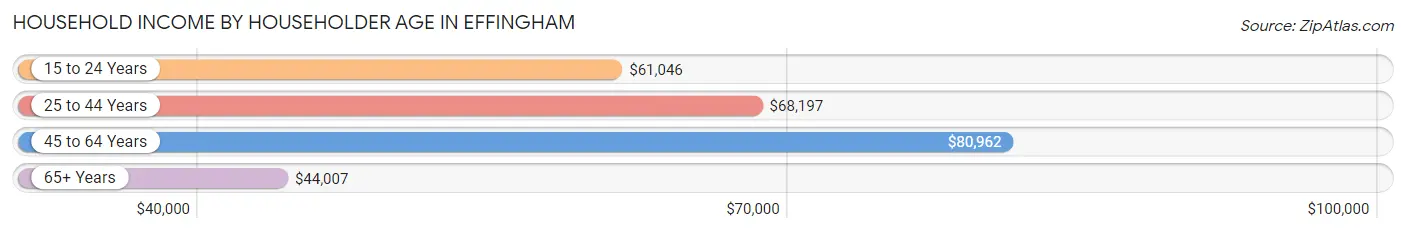
| Income Bracket | # Households | Median Income |
| 15 to 24 Years | 413 (8.0%) | $61,046 |
| 25 to 44 Years | 1,727 (33.6%) | $68,197 |
| 45 to 64 Years | 1,530 (29.8%) | $80,962 |
| 65+ Years | 1,470 (28.6%) | $44,007 |
| Total | 5,140 (100.0%) | $62,358 |
Poverty in Effingham
Income Below Poverty by Sex and Age in Effingham
With 12.9% poverty level for males and 19.4% for females among the residents of Effingham, 15 year old males and under 5 year old females are the most vulnerable to poverty, with 44 males (52.4%) and 195 females (49.0%) in their respective age groups living below the poverty level.
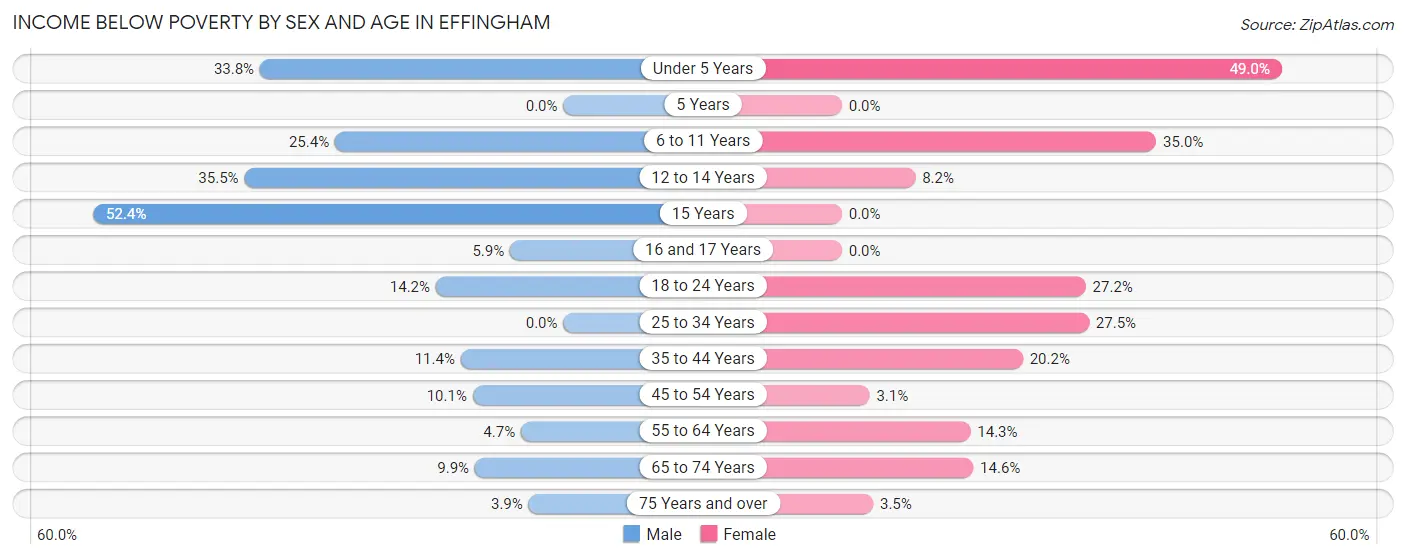
| Age Bracket | Male | Female |
| Under 5 Years | 98 (33.8%) | 195 (49.0%) |
| 5 Years | 0 (0.0%) | 0 (0.0%) |
| 6 to 11 Years | 132 (25.4%) | 195 (35.0%) |
| 12 to 14 Years | 119 (35.5%) | 18 (8.2%) |
| 15 Years | 44 (52.4%) | 0 (0.0%) |
| 16 and 17 Years | 6 (5.9%) | 0 (0.0%) |
| 18 to 24 Years | 74 (14.2%) | 182 (27.2%) |
| 25 to 34 Years | 0 (0.0%) | 246 (27.5%) |
| 35 to 44 Years | 87 (11.4%) | 138 (20.2%) |
| 45 to 54 Years | 54 (10.1%) | 21 (3.1%) |
| 55 to 64 Years | 36 (4.7%) | 109 (14.3%) |
| 65 to 74 Years | 54 (9.9%) | 103 (14.6%) |
| 75 Years and over | 12 (3.9%) | 21 (3.5%) |
| Total | 716 (12.9%) | 1,228 (19.4%) |
Income Above Poverty by Sex and Age in Effingham
According to the poverty statistics in Effingham, males aged 5 years and females aged 5 years are the age groups that are most secure financially, with 100.0% of males and 100.0% of females in these age groups living above the poverty line.
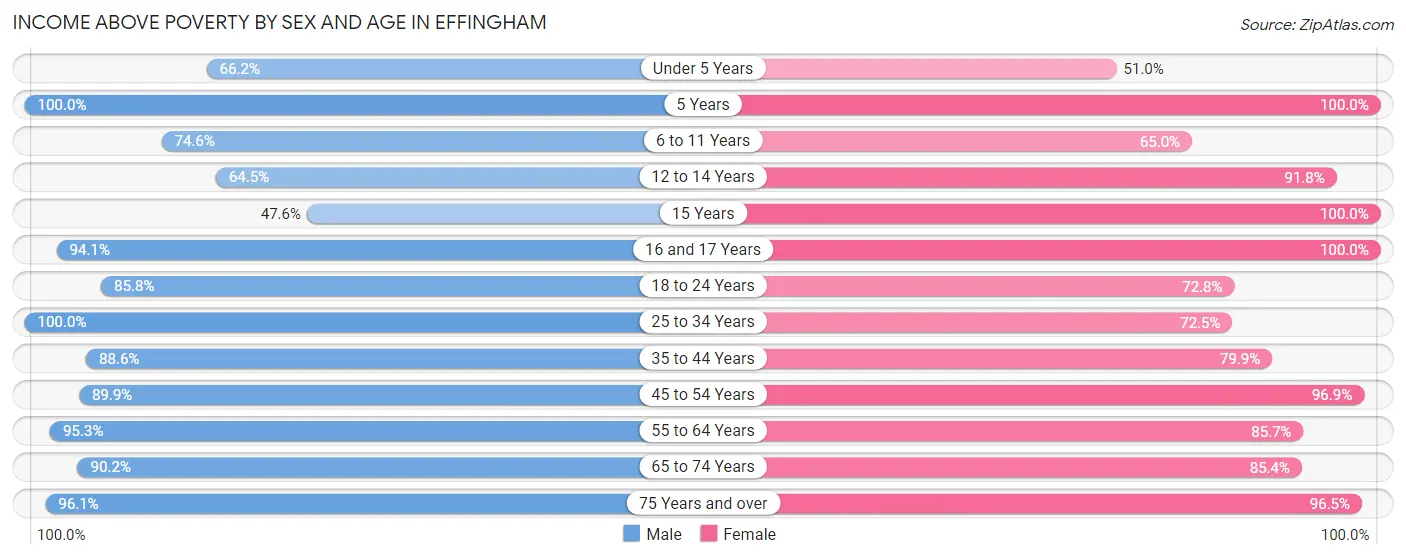
| Age Bracket | Male | Female |
| Under 5 Years | 192 (66.2%) | 203 (51.0%) |
| 5 Years | 85 (100.0%) | 19 (100.0%) |
| 6 to 11 Years | 387 (74.6%) | 362 (65.0%) |
| 12 to 14 Years | 216 (64.5%) | 202 (91.8%) |
| 15 Years | 40 (47.6%) | 36 (100.0%) |
| 16 and 17 Years | 95 (94.1%) | 89 (100.0%) |
| 18 to 24 Years | 447 (85.8%) | 488 (72.8%) |
| 25 to 34 Years | 698 (100.0%) | 648 (72.5%) |
| 35 to 44 Years | 674 (88.6%) | 547 (79.8%) |
| 45 to 54 Years | 481 (89.9%) | 661 (96.9%) |
| 55 to 64 Years | 727 (95.3%) | 652 (85.7%) |
| 65 to 74 Years | 494 (90.1%) | 601 (85.4%) |
| 75 Years and over | 298 (96.1%) | 582 (96.5%) |
| Total | 4,834 (87.1%) | 5,090 (80.6%) |
Income Below Poverty Among Married-Couple Families in Effingham
The poverty statistics for married-couple families in Effingham show that 5.9% or 124 of the total 2,101 families live below the poverty line. Families with 3 or 4 children have the highest poverty rate of 19.4%, comprising of 41 families. On the other hand, families with 5 or more children have the lowest poverty rate of 0.0%, which includes 0 families.
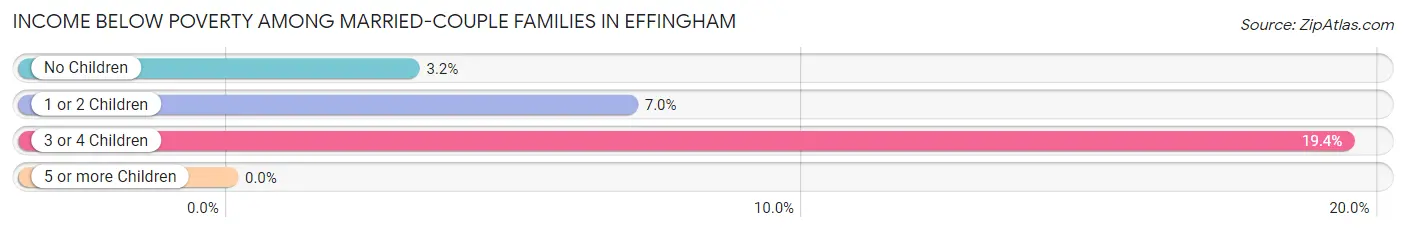
| Children | Above Poverty | Below Poverty |
| No Children | 1,225 (96.8%) | 40 (3.2%) |
| 1 or 2 Children | 575 (93.0%) | 43 (7.0%) |
| 3 or 4 Children | 170 (80.6%) | 41 (19.4%) |
| 5 or more Children | 7 (100.0%) | 0 (0.0%) |
| Total | 1,977 (94.1%) | 124 (5.9%) |
Income Below Poverty Among Single-Parent Households in Effingham
According to the poverty data in Effingham, 7.9% or 16 single-father households and 28.9% or 192 single-mother households are living below the poverty line. Among single-father households, those with 3 or 4 children have the highest poverty rate, with 16 households (100.0%) experiencing poverty. Likewise, among single-mother households, those with 3 or 4 children have the highest poverty rate, with 72 households (100.0%) falling below the poverty line.
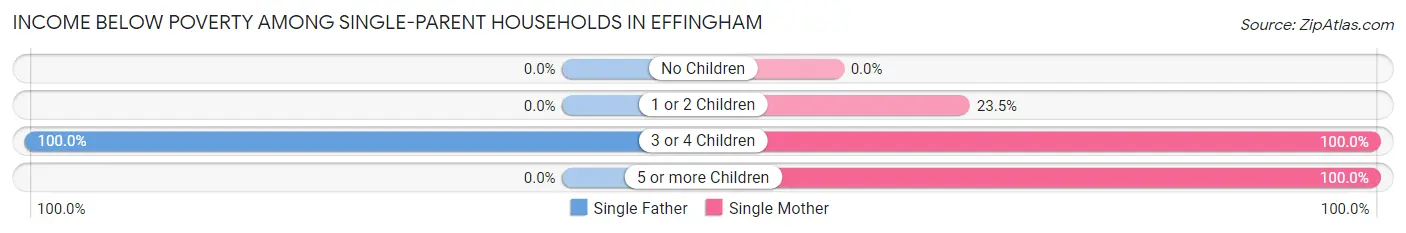
| Children | Single Father | Single Mother |
| No Children | 0 (0.0%) | 0 (0.0%) |
| 1 or 2 Children | 0 (0.0%) | 83 (23.5%) |
| 3 or 4 Children | 16 (100.0%) | 72 (100.0%) |
| 5 or more Children | 0 (0.0%) | 37 (100.0%) |
| Total | 16 (7.9%) | 192 (28.9%) |
Income Below Poverty Among Married-Couple vs Single-Parent Households in Effingham
The poverty data for Effingham shows that 124 of the married-couple family households (5.9%) and 208 of the single-parent households (24.0%) are living below the poverty level. Within the married-couple family households, those with 3 or 4 children have the highest poverty rate, with 41 households (19.4%) falling below the poverty line. Among the single-parent households, those with 3 or 4 children have the highest poverty rate, with 88 household (100.0%) living below poverty.
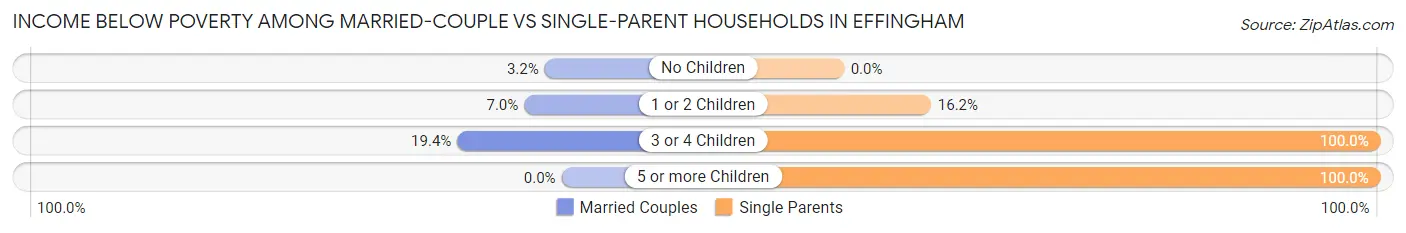
| Children | Married-Couple Families | Single-Parent Households |
| No Children | 40 (3.2%) | 0 (0.0%) |
| 1 or 2 Children | 43 (7.0%) | 83 (16.2%) |
| 3 or 4 Children | 41 (19.4%) | 88 (100.0%) |
| 5 or more Children | 0 (0.0%) | 37 (100.0%) |
| Total | 124 (5.9%) | 208 (24.0%) |
Race in Effingham
The most populous races in Effingham are White / Caucasian (11,526 | 94.1%), Hispanic or Latino (509 | 4.2%), and Two or more Races (268 | 2.2%).
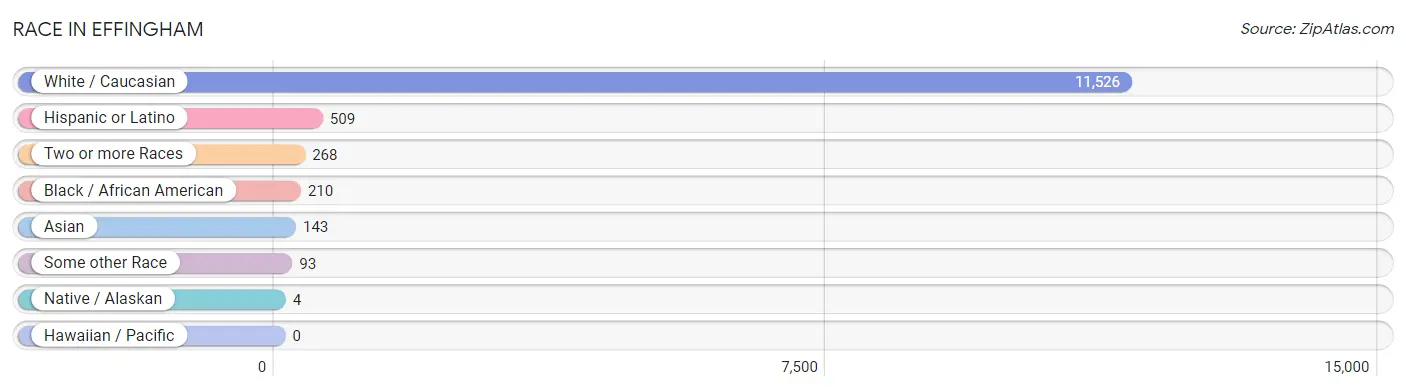
| Race | # Population | % Population |
| Asian | 143 | 1.2% |
| Black / African American | 210 | 1.7% |
| Hawaiian / Pacific | 0 | 0.0% |
| Hispanic or Latino | 509 | 4.2% |
| Native / Alaskan | 4 | 0.0% |
| White / Caucasian | 11,526 | 94.1% |
| Two or more Races | 268 | 2.2% |
| Some other Race | 93 | 0.8% |
| Total | 12,244 | 100.0% |
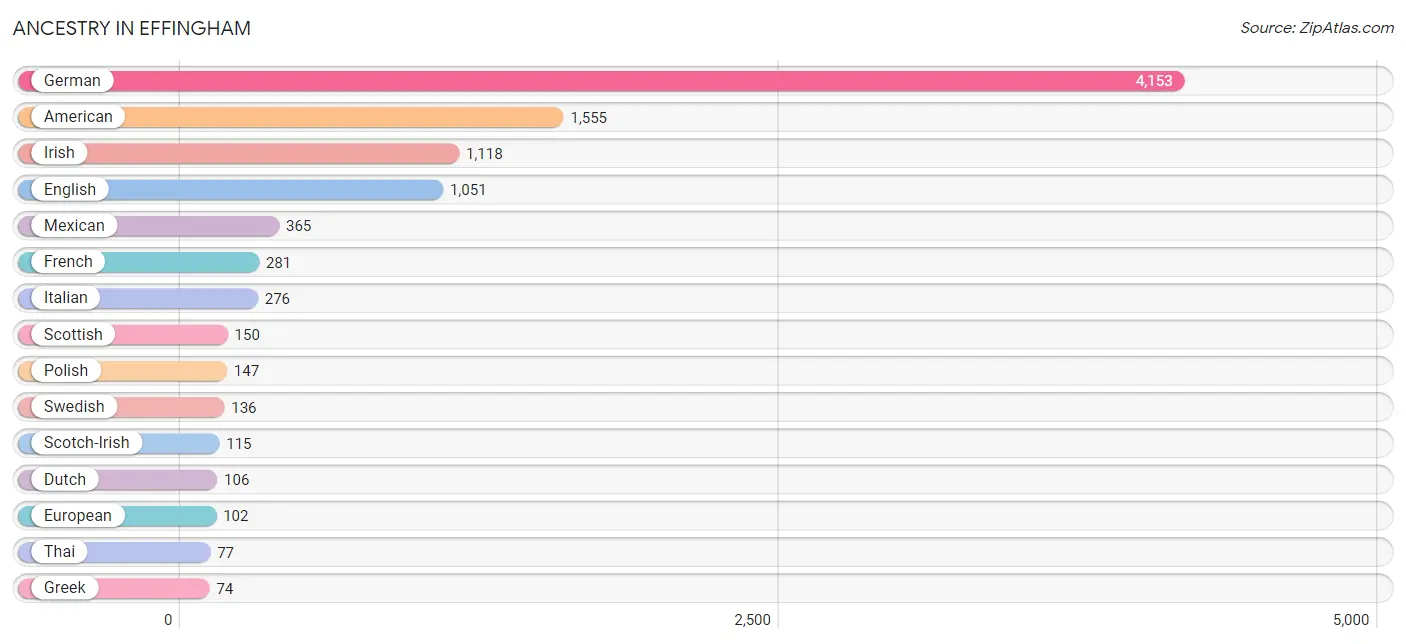
Ancestry in Effingham
The most populous ancestries reported in Effingham are German (4,153 | 33.9%), American (1,555 | 12.7%), Irish (1,118 | 9.1%), English (1,051 | 8.6%), and Mexican (365 | 3.0%), together accounting for 67.3% of all Effingham residents.
| Ancestry | # Population | % Population |
| African | 1 | 0.0% |
| American | 1,555 | 12.7% |
| Arab | 28 | 0.2% |
| Australian | 1 | 0.0% |
| Belgian | 19 | 0.2% |
| British | 33 | 0.3% |
| Burmese | 41 | 0.3% |
| Central American | 15 | 0.1% |
| Cherokee | 15 | 0.1% |
| Czechoslovakian | 9 | 0.1% |
| Danish | 31 | 0.3% |
| Dutch | 106 | 0.9% |
| Eastern European | 8 | 0.1% |
| English | 1,051 | 8.6% |
| European | 102 | 0.8% |
| Finnish | 52 | 0.4% |
| French | 281 | 2.3% |
| French Canadian | 39 | 0.3% |
| German | 4,153 | 33.9% |
| Greek | 74 | 0.6% |
| Guatemalan | 15 | 0.1% |
| Indian (Asian) | 34 | 0.3% |
| Irish | 1,118 | 9.1% |
| Italian | 276 | 2.2% |
| Korean | 19 | 0.2% |
| Mexican | 365 | 3.0% |
| Norwegian | 23 | 0.2% |
| Pakistani | 16 | 0.1% |
| Pennsylvania German | 21 | 0.2% |
| Polish | 147 | 1.2% |
| Portuguese | 12 | 0.1% |
| Puerto Rican | 43 | 0.4% |
| Romanian | 33 | 0.3% |
| Scandinavian | 46 | 0.4% |
| Scotch-Irish | 115 | 0.9% |
| Scottish | 150 | 1.2% |
| Serbian | 9 | 0.1% |
| Slovene | 32 | 0.3% |
| Subsaharan African | 1 | 0.0% |
| Swedish | 136 | 1.1% |
| Swiss | 31 | 0.3% |
| Thai | 77 | 0.6% |
| Welsh | 15 | 0.1% | View All 43 Rows |
Immigrants in Effingham
The most numerous immigrant groups reported in Effingham came from Central America (338 | 2.8%), Latin America (338 | 2.8%), Mexico (338 | 2.8%), Asia (140 | 1.1%), and India (74 | 0.6%), together accounting for 10.0% of all Effingham residents.
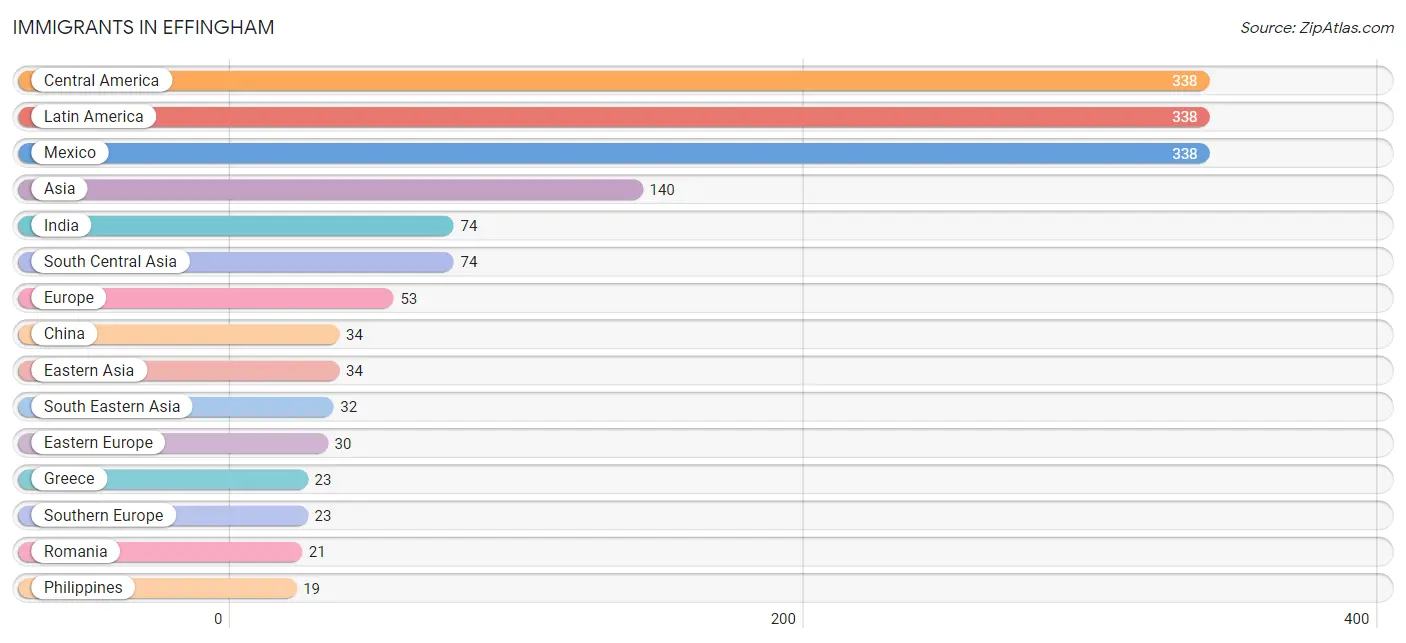
| Immigration Origin | # Population | % Population |
| Asia | 140 | 1.1% |
| Central America | 338 | 2.8% |
| China | 34 | 0.3% |
| Eastern Asia | 34 | 0.3% |
| Eastern Europe | 30 | 0.3% |
| Europe | 53 | 0.4% |
| Greece | 23 | 0.2% |
| India | 74 | 0.6% |
| Latin America | 338 | 2.8% |
| Mexico | 338 | 2.8% |
| Philippines | 19 | 0.2% |
| Romania | 21 | 0.2% |
| South Central Asia | 74 | 0.6% |
| South Eastern Asia | 32 | 0.3% |
| Southern Europe | 23 | 0.2% |
| Thailand | 13 | 0.1% | View All 16 Rows |
Sex and Age in Effingham
Sex and Age in Effingham
The most populous age groups in Effingham are 10 to 14 Years (494 | 8.6%) for men and 25 to 29 Years (453 | 6.9%) for women.
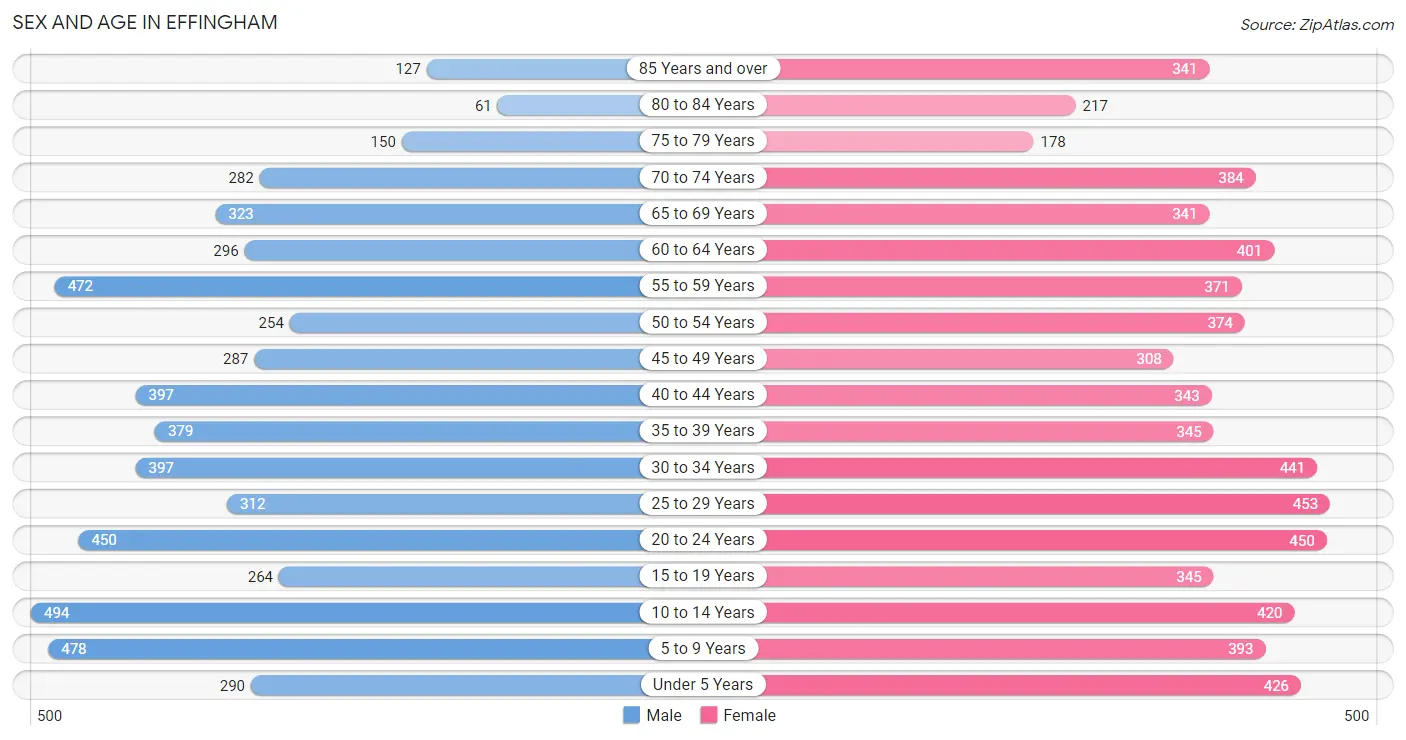
| Age Bracket | Male | Female |
| Under 5 Years | 290 (5.1%) | 426 (6.5%) |
| 5 to 9 Years | 478 (8.4%) | 393 (6.0%) |
| 10 to 14 Years | 494 (8.6%) | 420 (6.4%) |
| 15 to 19 Years | 264 (4.6%) | 345 (5.3%) |
| 20 to 24 Years | 450 (7.9%) | 450 (6.9%) |
| 25 to 29 Years | 312 (5.5%) | 453 (6.9%) |
| 30 to 34 Years | 397 (7.0%) | 441 (6.8%) |
| 35 to 39 Years | 379 (6.6%) | 345 (5.3%) |
| 40 to 44 Years | 397 (7.0%) | 343 (5.2%) |
| 45 to 49 Years | 287 (5.0%) | 308 (4.7%) |
| 50 to 54 Years | 254 (4.4%) | 374 (5.7%) |
| 55 to 59 Years | 472 (8.3%) | 371 (5.7%) |
| 60 to 64 Years | 296 (5.2%) | 401 (6.1%) |
| 65 to 69 Years | 323 (5.7%) | 341 (5.2%) |
| 70 to 74 Years | 282 (4.9%) | 384 (5.9%) |
| 75 to 79 Years | 150 (2.6%) | 178 (2.7%) |
| 80 to 84 Years | 61 (1.1%) | 217 (3.3%) |
| 85 Years and over | 127 (2.2%) | 341 (5.2%) |
| Total | 5,713 (100.0%) | 6,531 (100.0%) |
Families and Households in Effingham
Median Family Size in Effingham
The median family size in Effingham is 2.97 persons per family, with married-couple families (2,101 | 70.8%) accounting for the largest median family size of 3.07 persons per family. On the other hand, single male/father families (202 | 6.8%) represent the smallest median family size with 2.68 persons per family.
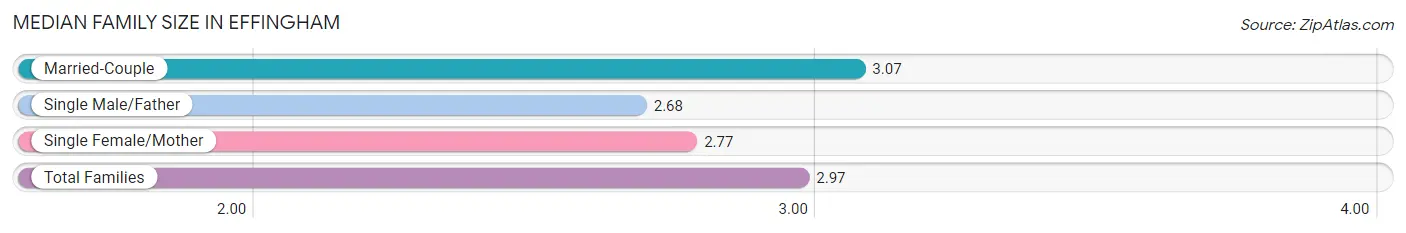
| Family Type | # Families | Family Size |
| Married-Couple | 2,101 (70.8%) | 3.07 |
| Single Male/Father | 202 (6.8%) | 2.68 |
| Single Female/Mother | 665 (22.4%) | 2.77 |
| Total Families | 2,968 (100.0%) | 2.97 |
Median Household Size in Effingham
The median household size in Effingham is 2.31 persons per household, with married-couple households (2,101 | 40.9%) accounting for the largest median household size of 3.08 persons per household. non-family households (2,172 | 42.3%) represent the smallest median household size with 1.27 persons per household.
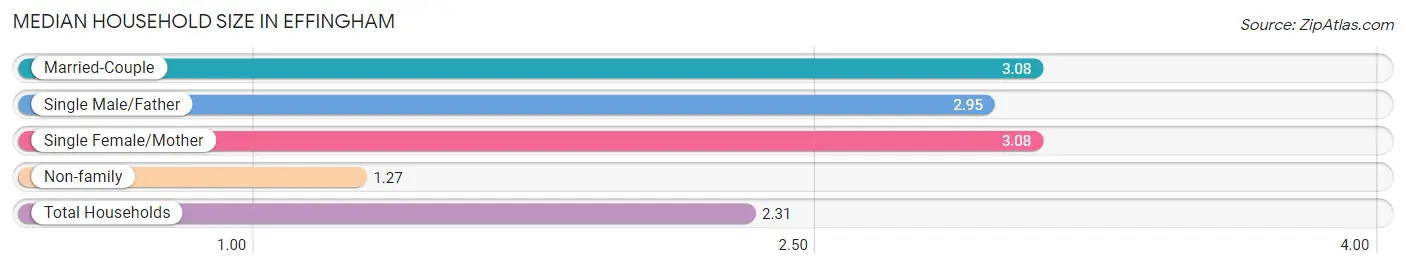
| Household Type | # Households | Household Size |
| Married-Couple | 2,101 (40.9%) | 3.08 |
| Single Male/Father | 202 (3.9%) | 2.95 |
| Single Female/Mother | 665 (12.9%) | 3.08 |
| Non-family | 2,172 (42.3%) | 1.27 |
| Total Households | 5,140 (100.0%) | 2.31 |
Household Size by Marriage Status in Effingham
Out of a total of 5,140 households in Effingham, 2,968 (57.7%) are family households, while 2,172 (42.3%) are nonfamily households. The most numerous type of family households are 2-person households, comprising 1,350, and the most common type of nonfamily households are 1-person households, comprising 1,647.
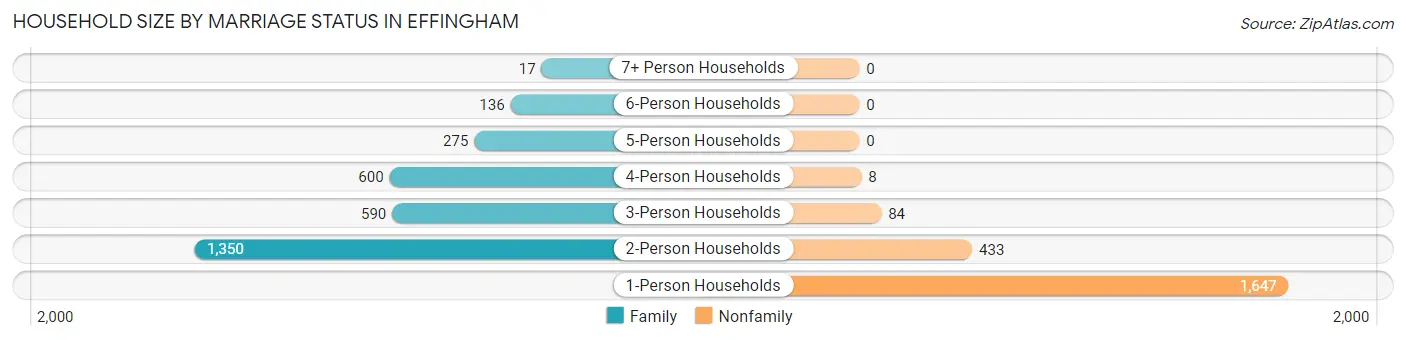
| Household Size | Family Households | Nonfamily Households |
| 1-Person Households | - | 1,647 (32.0%) |
| 2-Person Households | 1,350 (26.3%) | 433 (8.4%) |
| 3-Person Households | 590 (11.5%) | 84 (1.6%) |
| 4-Person Households | 600 (11.7%) | 8 (0.2%) |
| 5-Person Households | 275 (5.3%) | 0 (0.0%) |
| 6-Person Households | 136 (2.6%) | 0 (0.0%) |
| 7+ Person Households | 17 (0.3%) | 0 (0.0%) |
| Total | 2,968 (57.7%) | 2,172 (42.3%) |
Female Fertility in Effingham
Fertility by Age in Effingham
Average fertility rate in Effingham is 80.0 births per 1,000 women. Women in the age bracket of 20 to 34 years have the highest fertility rate with 114.0 births per 1,000 women. Women in the age bracket of 20 to 34 years acount for 69.6% of all women with births.
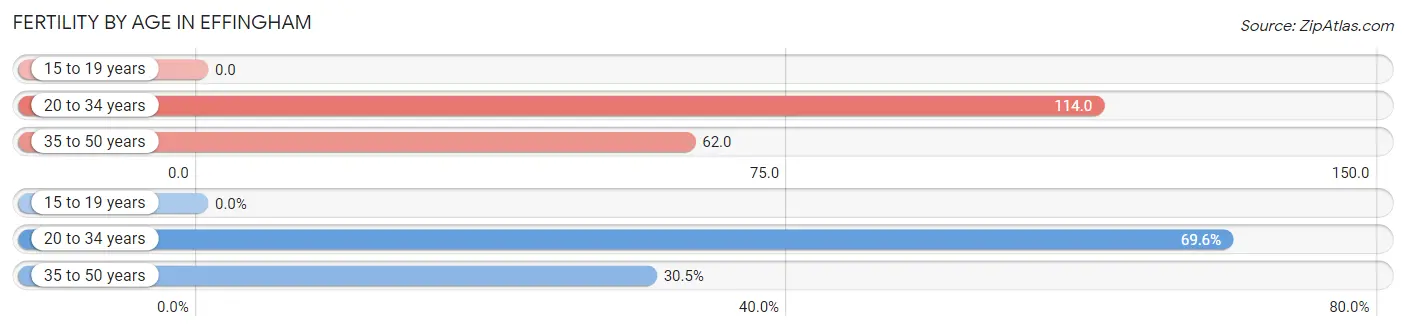
| Age Bracket | Women with Births | Births / 1,000 Women |
| 15 to 19 years | 0 (0.0%) | 0.0 |
| 20 to 34 years | 153 (69.6%) | 114.0 |
| 35 to 50 years | 67 (30.4%) | 62.0 |
| Total | 220 (100.0%) | 80.0 |
Fertility by Age by Marriage Status in Effingham
68.6% of women with births (220) in Effingham are married. The highest percentage of unmarried women with births falls into 20 to 34 years age bracket with 45.1% of them unmarried at the time of birth, while the lowest percentage of unmarried women with births belong to 35 to 50 years age bracket with 0.0% of them unmarried.
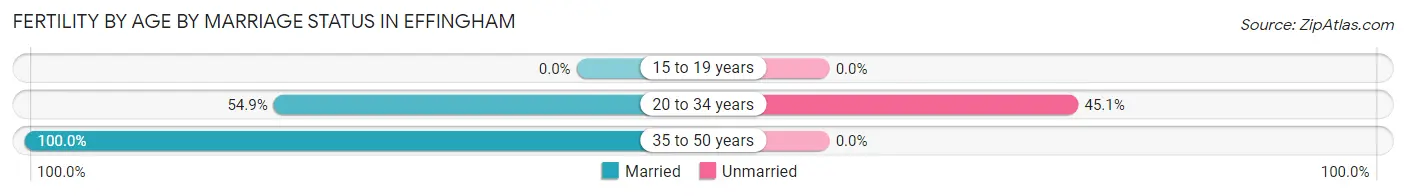
| Age Bracket | Married | Unmarried |
| 15 to 19 years | 0 (0.0%) | 0 (0.0%) |
| 20 to 34 years | 84 (54.9%) | 69 (45.1%) |
| 35 to 50 years | 67 (100.0%) | 0 (0.0%) |
| Total | 151 (68.6%) | 69 (31.4%) |
Fertility by Education in Effingham
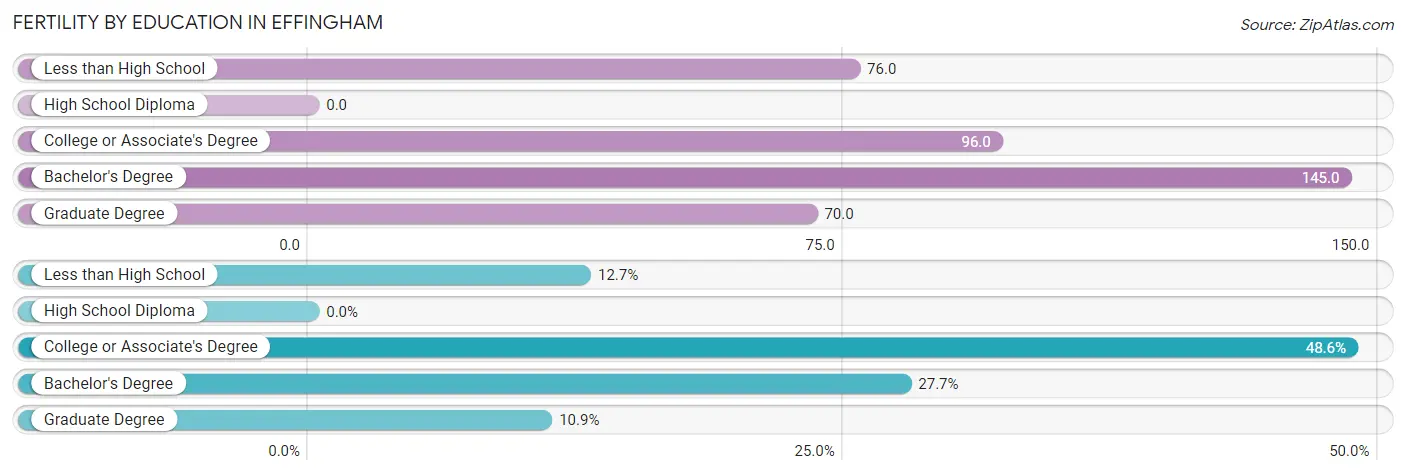
| Educational Attainment | Women with Births | Births / 1,000 Women |
| Less than High School | 28 (12.7%) | 76.0 |
| High School Diploma | 0 (0.0%) | 0.0 |
| College or Associate's Degree | 107 (48.6%) | 96.0 |
| Bachelor's Degree | 61 (27.7%) | 145.0 |
| Graduate Degree | 24 (10.9%) | 70.0 |
| Total | 220 (100.0%) | 80.0 |
Fertility by Education by Marriage Status in Effingham
31.4% of women with births in Effingham are unmarried. Women with the educational attainment of less than high school are most likely to be married with 100.0% of them married at childbirth, while women with the educational attainment of college or associate's degree are least likely to be married with 53.3% of them unmarried at childbirth.
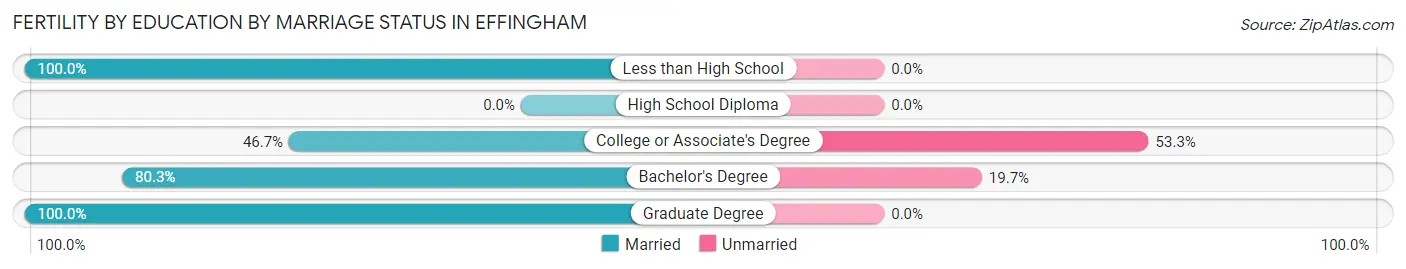
| Educational Attainment | Married | Unmarried |
| Less than High School | 28 (100.0%) | 0 (0.0%) |
| High School Diploma | 0 (0.0%) | 0 (0.0%) |
| College or Associate's Degree | 50 (46.7%) | 57 (53.3%) |
| Bachelor's Degree | 49 (80.3%) | 12 (19.7%) |
| Graduate Degree | 24 (100.0%) | 0 (0.0%) |
| Total | 151 (68.6%) | 69 (31.4%) |
Employment Characteristics in Effingham
Employment by Class of Employer in Effingham
Among the 5,864 employed individuals in Effingham, private company employees (4,541 | 77.4%), local government employees (391 | 6.7%), and not-for-profit organizations (348 | 5.9%) make up the most common classes of employment.
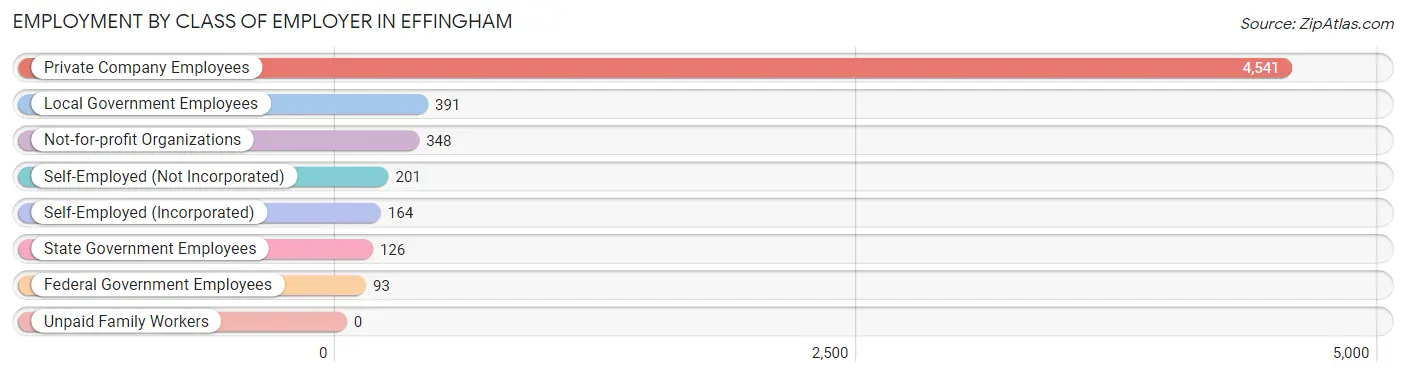
| Employer Class | # Employees | % Employees |
| Private Company Employees | 4,541 | 77.4% |
| Self-Employed (Incorporated) | 164 | 2.8% |
| Self-Employed (Not Incorporated) | 201 | 3.4% |
| Not-for-profit Organizations | 348 | 5.9% |
| Local Government Employees | 391 | 6.7% |
| State Government Employees | 126 | 2.1% |
| Federal Government Employees | 93 | 1.6% |
| Unpaid Family Workers | 0 | 0.0% |
| Total | 5,864 | 100.0% |
Employment Status by Age in Effingham
According to the labor force statistics for Effingham, out of the total population over 16 years of age (9,623), 64.0% or 6,159 individuals are in the labor force, with 2.9% or 179 of them unemployed. The age group with the highest labor force participation rate is 45 to 54 years, with 86.8% or 1,062 individuals in the labor force. Within the labor force, the 35 to 44 years age range has the highest percentage of unemployed individuals, with 6.2% or 75 of them being unemployed.
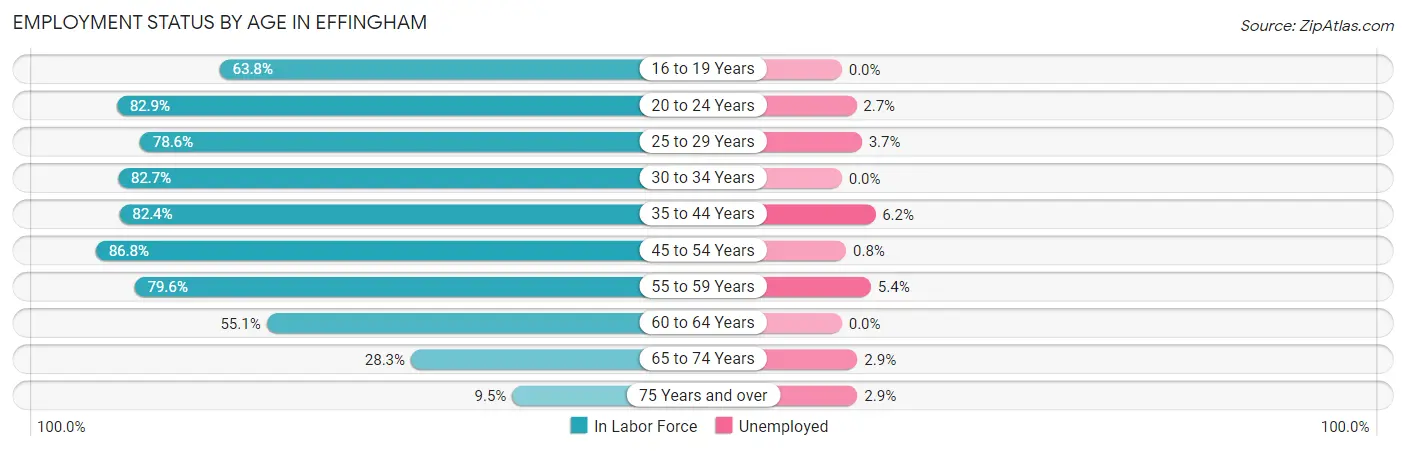
| Age Bracket | In Labor Force | Unemployed |
| 16 to 19 Years | 312 (63.8%) | 0 (0.0%) |
| 20 to 24 Years | 746 (82.9%) | 20 (2.7%) |
| 25 to 29 Years | 601 (78.6%) | 22 (3.7%) |
| 30 to 34 Years | 693 (82.7%) | 0 (0.0%) |
| 35 to 44 Years | 1,206 (82.4%) | 75 (6.2%) |
| 45 to 54 Years | 1,062 (86.8%) | 8 (0.8%) |
| 55 to 59 Years | 671 (79.6%) | 36 (5.4%) |
| 60 to 64 Years | 384 (55.1%) | 0 (0.0%) |
| 65 to 74 Years | 376 (28.3%) | 11 (2.9%) |
| 75 Years and over | 102 (9.5%) | 3 (2.9%) |
| Total | 6,159 (64.0%) | 179 (2.9%) |
Employment Status by Educational Attainment in Effingham
According to labor force statistics for Effingham, 79.2% of individuals (4,617) out of the total population between 25 and 64 years of age (5,830) are in the labor force, with 3.1% or 143 of them being unemployed. The group with the highest labor force participation rate are those with the educational attainment of bachelor's degree or higher, with 91.8% or 1,509 individuals in the labor force. Within the labor force, individuals with less than high school education have the highest percentage of unemployment, with 14.7% or 33 of them being unemployed.
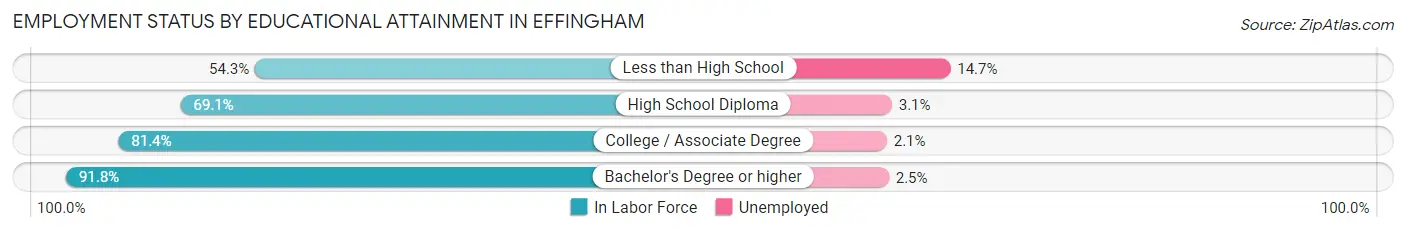
| Educational Attainment | In Labor Force | Unemployed |
| Less than High School | 225 (54.3%) | 61 (14.7%) |
| High School Diploma | 1,059 (69.1%) | 48 (3.1%) |
| College / Associate Degree | 1,823 (81.4%) | 47 (2.1%) |
| Bachelor's Degree or higher | 1,509 (91.8%) | 41 (2.5%) |
| Total | 4,617 (79.2%) | 181 (3.1%) |
Employment Occupations by Sex in Effingham
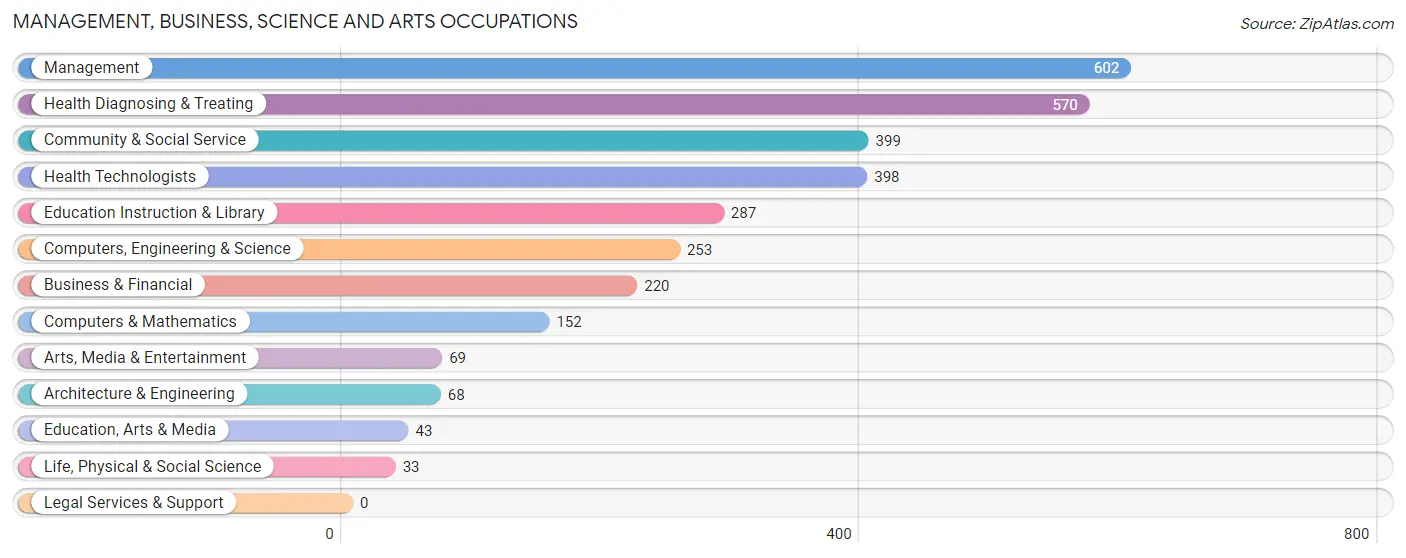
Management, Business, Science and Arts Occupations
The most common Management, Business, Science and Arts occupations in Effingham are Management (602 | 10.1%), Health Diagnosing & Treating (570 | 9.5%), Community & Social Service (399 | 6.7%), Health Technologists (398 | 6.7%), and Education Instruction & Library (287 | 4.8%).
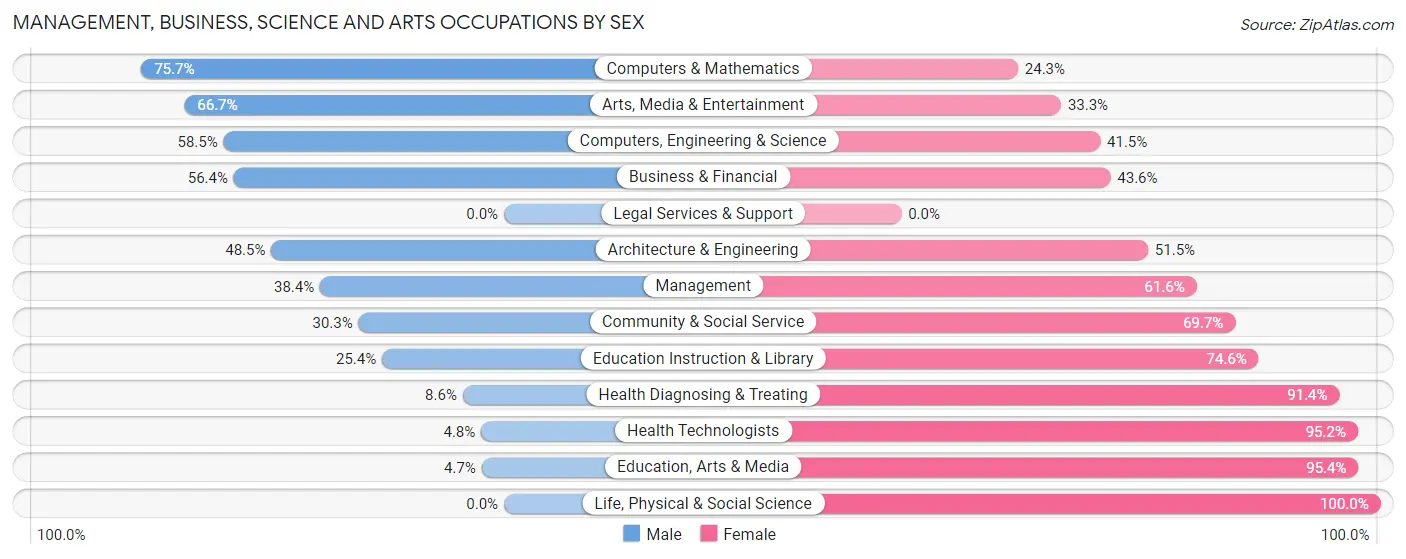
Management, Business, Science and Arts Occupations by Sex
Within the Management, Business, Science and Arts occupations in Effingham, the most male-oriented occupations are Computers & Mathematics (75.7%), Arts, Media & Entertainment (66.7%), and Computers, Engineering & Science (58.5%), while the most female-oriented occupations are Life, Physical & Social Science (100.0%), Education, Arts & Media (95.4%), and Health Technologists (95.2%).
| Occupation | Male | Female |
| Management | 231 (38.4%) | 371 (61.6%) |
| Business & Financial | 124 (56.4%) | 96 (43.6%) |
| Computers, Engineering & Science | 148 (58.5%) | 105 (41.5%) |
| Computers & Mathematics | 115 (75.7%) | 37 (24.3%) |
| Architecture & Engineering | 33 (48.5%) | 35 (51.5%) |
| Life, Physical & Social Science | 0 (0.0%) | 33 (100.0%) |
| Community & Social Service | 121 (30.3%) | 278 (69.7%) |
| Education, Arts & Media | 2 (4.6%) | 41 (95.4%) |
| Legal Services & Support | 0 (0.0%) | 0 (0.0%) |
| Education Instruction & Library | 73 (25.4%) | 214 (74.6%) |
| Arts, Media & Entertainment | 46 (66.7%) | 23 (33.3%) |
| Health Diagnosing & Treating | 49 (8.6%) | 521 (91.4%) |
| Health Technologists | 19 (4.8%) | 379 (95.2%) |
| Total (Category) | 673 (32.9%) | 1,371 (67.1%) |
| Total (Overall) | 2,920 (48.8%) | 3,058 (51.1%) |
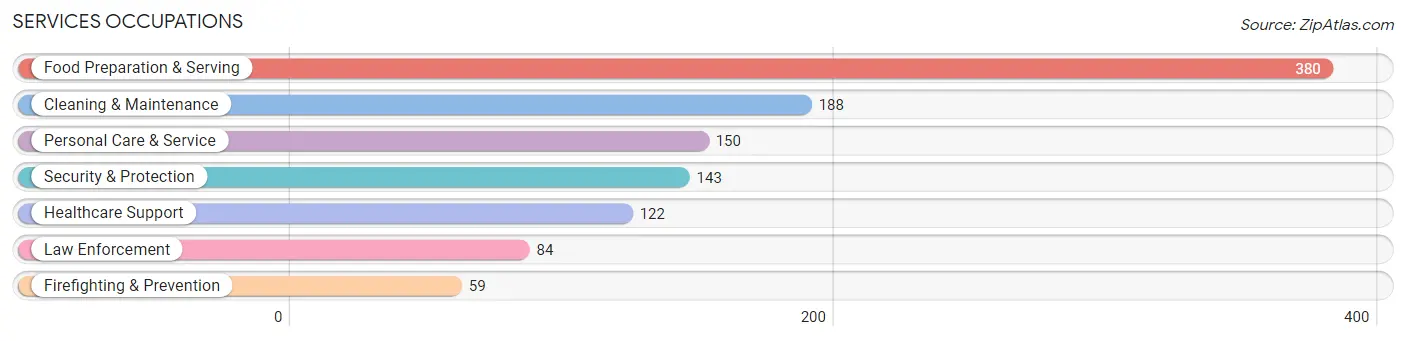
Services Occupations
The most common Services occupations in Effingham are Food Preparation & Serving (380 | 6.4%), Cleaning & Maintenance (188 | 3.1%), Personal Care & Service (150 | 2.5%), Security & Protection (143 | 2.4%), and Healthcare Support (122 | 2.0%).
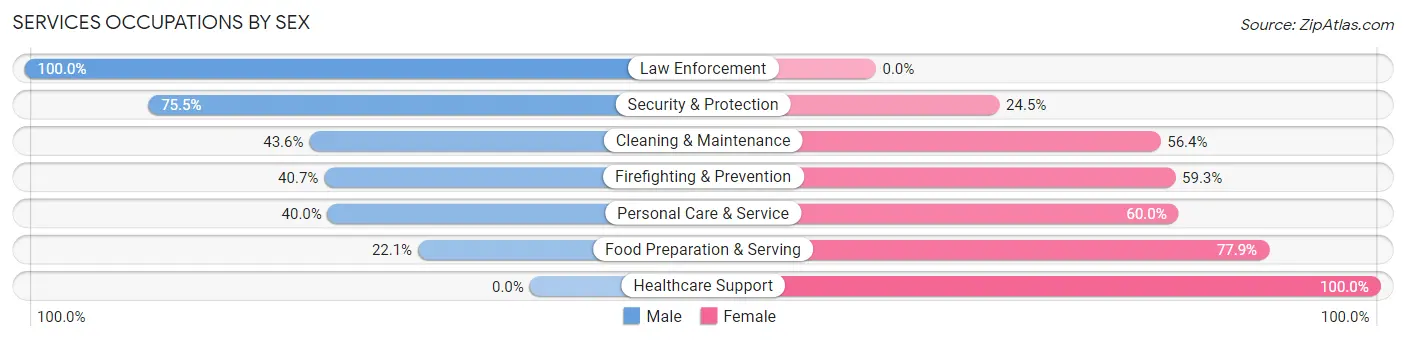
Services Occupations by Sex
Within the Services occupations in Effingham, the most male-oriented occupations are Law Enforcement (100.0%), Security & Protection (75.5%), and Cleaning & Maintenance (43.6%), while the most female-oriented occupations are Healthcare Support (100.0%), Food Preparation & Serving (77.9%), and Personal Care & Service (60.0%).
| Occupation | Male | Female |
| Healthcare Support | 0 (0.0%) | 122 (100.0%) |
| Security & Protection | 108 (75.5%) | 35 (24.5%) |
| Firefighting & Prevention | 24 (40.7%) | 35 (59.3%) |
| Law Enforcement | 84 (100.0%) | 0 (0.0%) |
| Food Preparation & Serving | 84 (22.1%) | 296 (77.9%) |
| Cleaning & Maintenance | 82 (43.6%) | 106 (56.4%) |
| Personal Care & Service | 60 (40.0%) | 90 (60.0%) |
| Total (Category) | 334 (34.0%) | 649 (66.0%) |
| Total (Overall) | 2,920 (48.8%) | 3,058 (51.1%) |
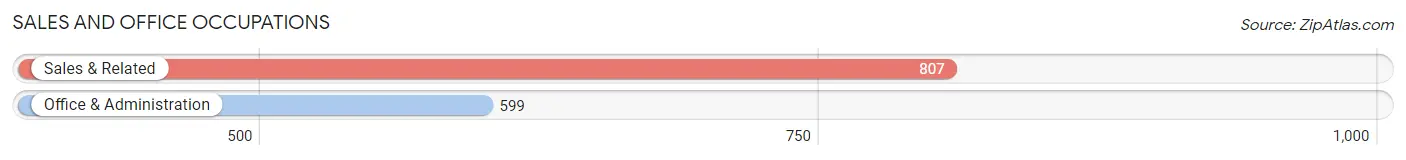
Sales and Office Occupations
The most common Sales and Office occupations in Effingham are Sales & Related (807 | 13.5%), and Office & Administration (599 | 10.0%).
Sales and Office Occupations by Sex
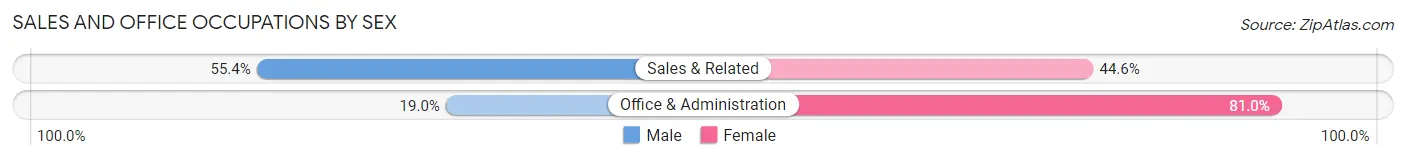
| Occupation | Male | Female |
| Sales & Related | 447 (55.4%) | 360 (44.6%) |
| Office & Administration | 114 (19.0%) | 485 (81.0%) |
| Total (Category) | 561 (39.9%) | 845 (60.1%) |
| Total (Overall) | 2,920 (48.8%) | 3,058 (51.1%) |
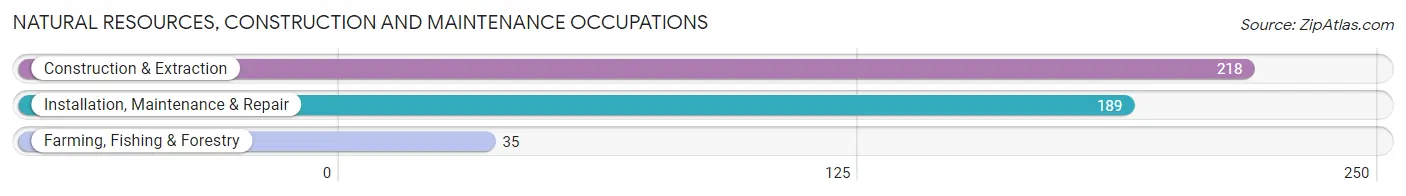
Natural Resources, Construction and Maintenance Occupations
The most common Natural Resources, Construction and Maintenance occupations in Effingham are Construction & Extraction (218 | 3.6%), Installation, Maintenance & Repair (189 | 3.2%), and Farming, Fishing & Forestry (35 | 0.6%).
Natural Resources, Construction and Maintenance Occupations by Sex
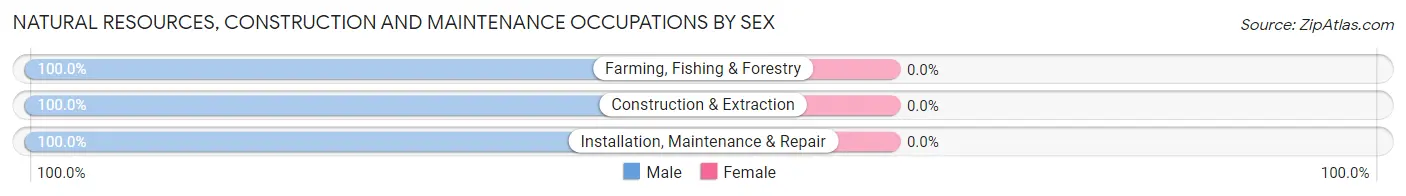
| Occupation | Male | Female |
| Farming, Fishing & Forestry | 35 (100.0%) | 0 (0.0%) |
| Construction & Extraction | 218 (100.0%) | 0 (0.0%) |
| Installation, Maintenance & Repair | 189 (100.0%) | 0 (0.0%) |
| Total (Category) | 442 (100.0%) | 0 (0.0%) |
| Total (Overall) | 2,920 (48.8%) | 3,058 (51.1%) |
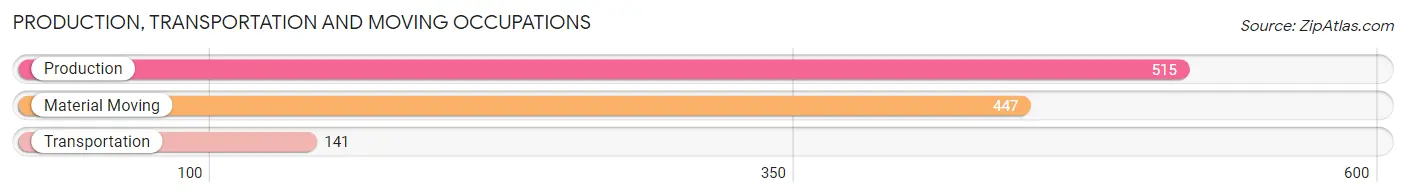
Production, Transportation and Moving Occupations
The most common Production, Transportation and Moving occupations in Effingham are Production (515 | 8.6%), Material Moving (447 | 7.5%), and Transportation (141 | 2.4%).
Production, Transportation and Moving Occupations by Sex
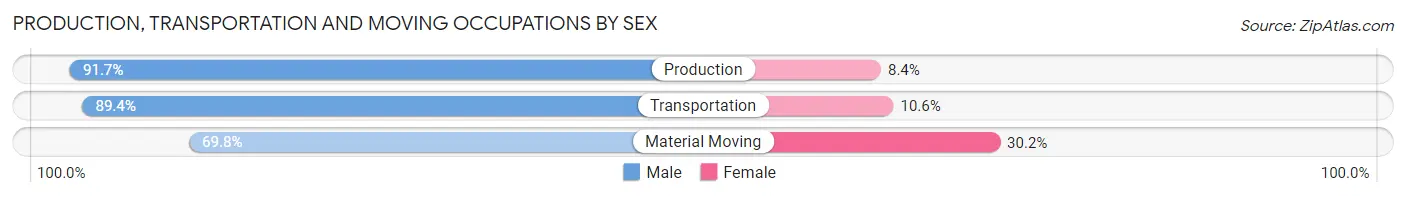
| Occupation | Male | Female |
| Production | 472 (91.6%) | 43 (8.4%) |
| Transportation | 126 (89.4%) | 15 (10.6%) |
| Material Moving | 312 (69.8%) | 135 (30.2%) |
| Total (Category) | 910 (82.5%) | 193 (17.5%) |
| Total (Overall) | 2,920 (48.8%) | 3,058 (51.1%) |
Employment Industries by Sex in Effingham
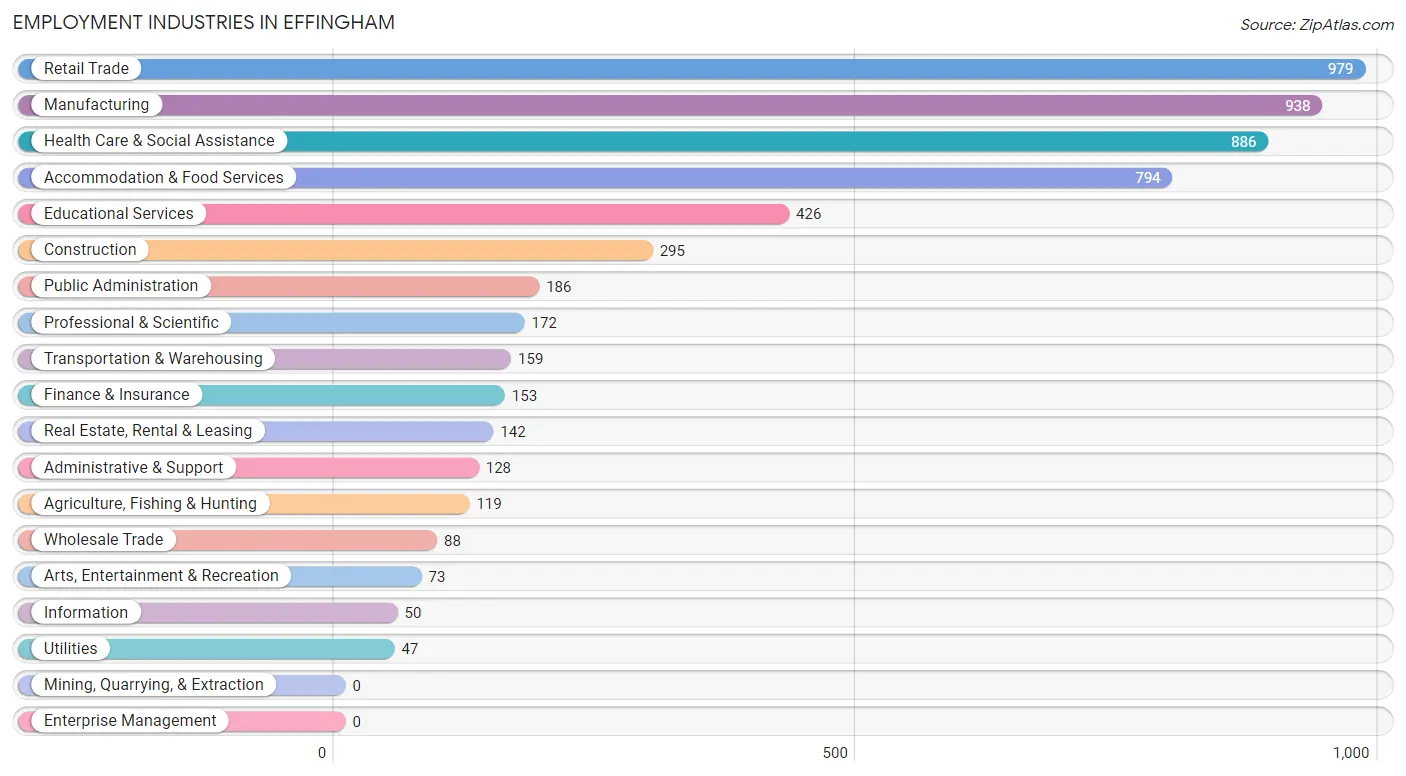
Employment Industries in Effingham
The major employment industries in Effingham include Retail Trade (979 | 16.4%), Manufacturing (938 | 15.7%), Health Care & Social Assistance (886 | 14.8%), Accommodation & Food Services (794 | 13.3%), and Educational Services (426 | 7.1%).
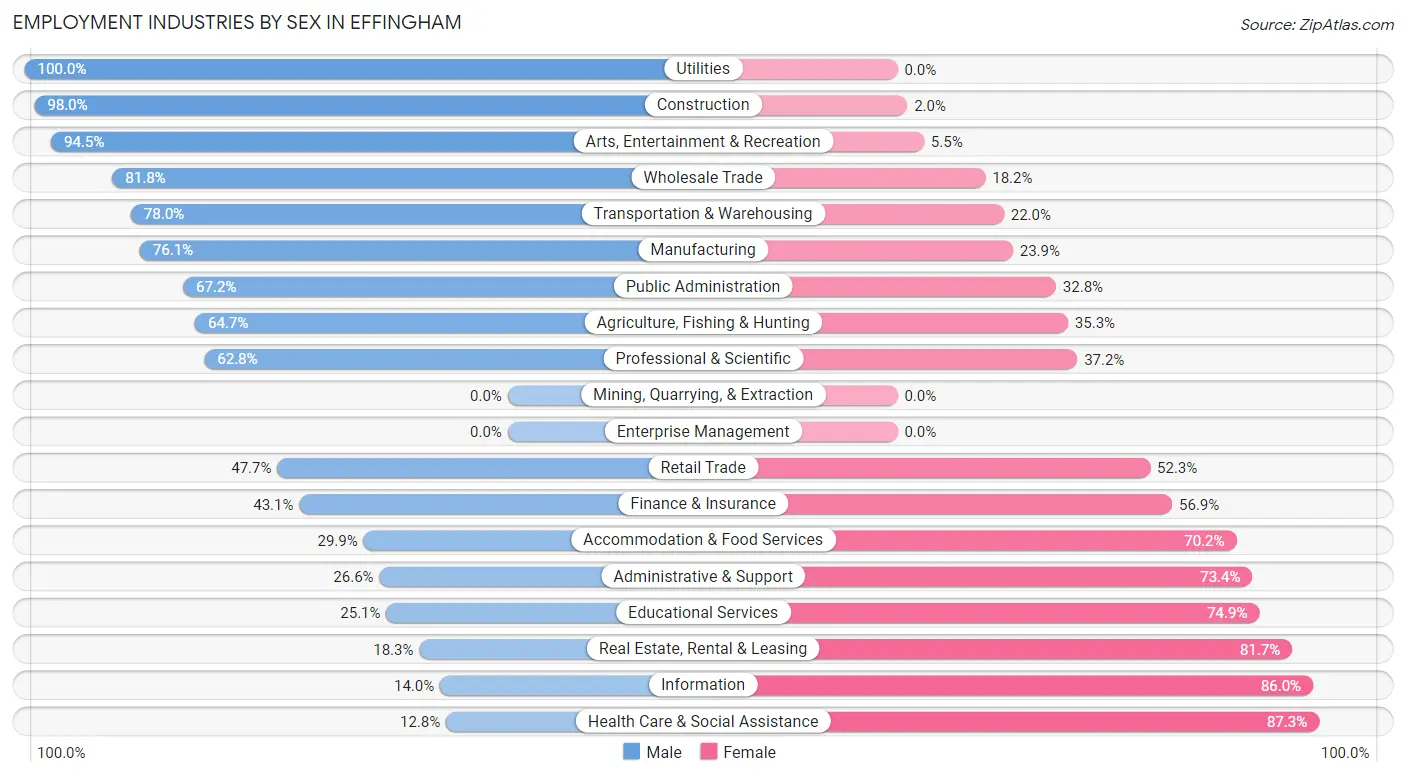
Employment Industries by Sex in Effingham
The Effingham industries that see more men than women are Utilities (100.0%), Construction (98.0%), and Arts, Entertainment & Recreation (94.5%), whereas the industries that tend to have a higher number of women are Health Care & Social Assistance (87.3%), Information (86.0%), and Real Estate, Rental & Leasing (81.7%).
| Industry | Male | Female |
| Agriculture, Fishing & Hunting | 77 (64.7%) | 42 (35.3%) |
| Mining, Quarrying, & Extraction | 0 (0.0%) | 0 (0.0%) |
| Construction | 289 (98.0%) | 6 (2.0%) |
| Manufacturing | 714 (76.1%) | 224 (23.9%) |
| Wholesale Trade | 72 (81.8%) | 16 (18.2%) |
| Retail Trade | 467 (47.7%) | 512 (52.3%) |
| Transportation & Warehousing | 124 (78.0%) | 35 (22.0%) |
| Utilities | 47 (100.0%) | 0 (0.0%) |
| Information | 7 (14.0%) | 43 (86.0%) |
| Finance & Insurance | 66 (43.1%) | 87 (56.9%) |
| Real Estate, Rental & Leasing | 26 (18.3%) | 116 (81.7%) |
| Professional & Scientific | 108 (62.8%) | 64 (37.2%) |
| Enterprise Management | 0 (0.0%) | 0 (0.0%) |
| Administrative & Support | 34 (26.6%) | 94 (73.4%) |
| Educational Services | 107 (25.1%) | 319 (74.9%) |
| Health Care & Social Assistance | 113 (12.8%) | 773 (87.3%) |
| Arts, Entertainment & Recreation | 69 (94.5%) | 4 (5.5%) |
| Accommodation & Food Services | 237 (29.8%) | 557 (70.2%) |
| Public Administration | 125 (67.2%) | 61 (32.8%) |
| Total | 2,920 (48.8%) | 3,058 (51.1%) |
Education in Effingham
School Enrollment in Effingham
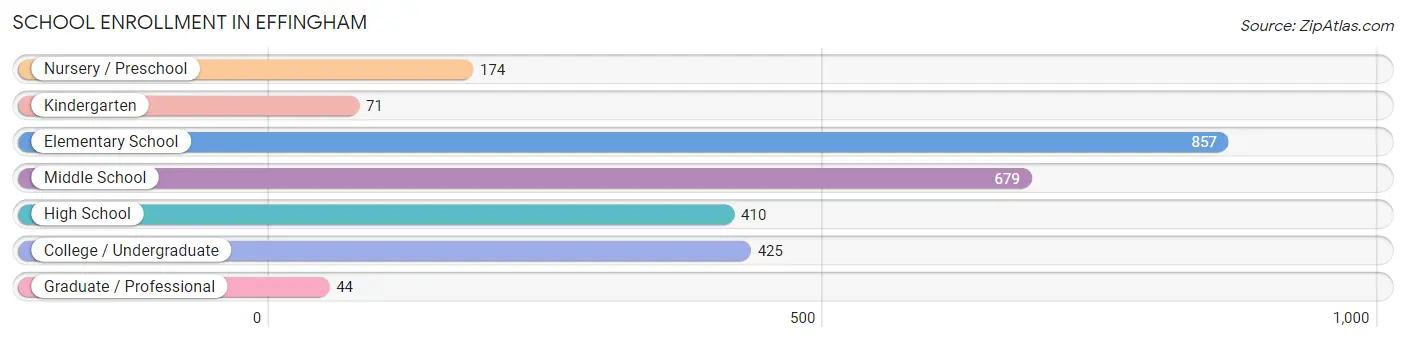
The most common levels of schooling among the 2,660 students in Effingham are elementary school (857 | 32.2%), middle school (679 | 25.5%), and college / undergraduate (425 | 16.0%).
| School Level | # Students | % Students |
| Nursery / Preschool | 174 | 6.5% |
| Kindergarten | 71 | 2.7% |
| Elementary School | 857 | 32.2% |
| Middle School | 679 | 25.5% |
| High School | 410 | 15.4% |
| College / Undergraduate | 425 | 16.0% |
| Graduate / Professional | 44 | 1.7% |
| Total | 2,660 | 100.0% |
School Enrollment by Age by Funding Source in Effingham
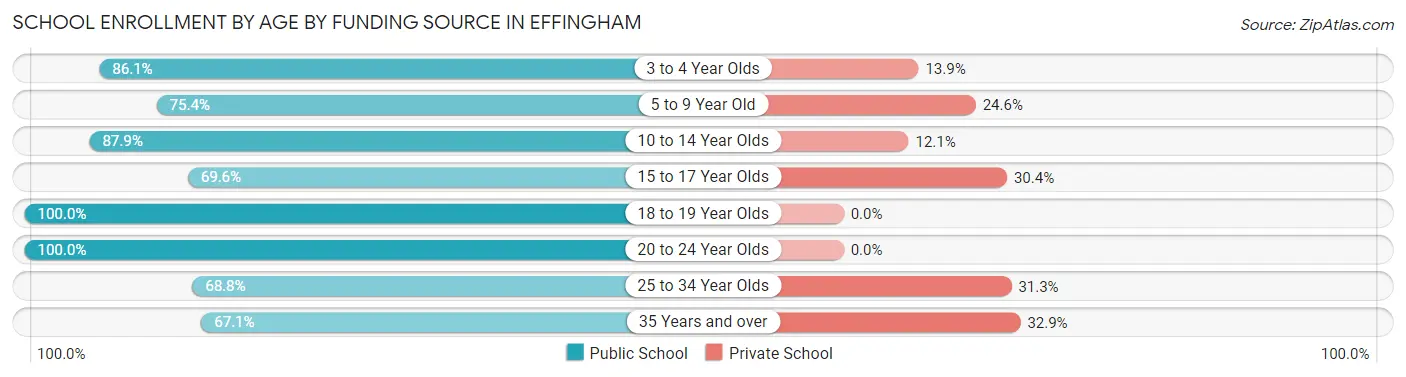
Out of a total of 2,660 students who are enrolled in schools in Effingham, 468 (17.6%) attend a private institution, while the remaining 2,192 (82.4%) are enrolled in public schools. The age group of 35 years and over has the highest likelihood of being enrolled in private schools, with 27 (32.9% in the age bracket) enrolled. Conversely, the age group of 18 to 19 year olds has the lowest likelihood of being enrolled in a private school, with 140 (100.0% in the age bracket) attending a public institution.
| Age Bracket | Public School | Private School |
| 3 to 4 Year Olds | 142 (86.1%) | 23 (13.9%) |
| 5 to 9 Year Old | 619 (75.4%) | 202 (24.6%) |
| 10 to 14 Year Olds | 756 (87.9%) | 104 (12.1%) |
| 15 to 17 Year Olds | 199 (69.6%) | 87 (30.4%) |
| 18 to 19 Year Olds | 140 (100.0%) | 0 (0.0%) |
| 20 to 24 Year Olds | 226 (100.0%) | 0 (0.0%) |
| 25 to 34 Year Olds | 55 (68.8%) | 25 (31.2%) |
| 35 Years and over | 55 (67.1%) | 27 (32.9%) |
| Total | 2,192 (82.4%) | 468 (17.6%) |
Educational Attainment by Field of Study in Effingham
Business (475 | 21.1%), science & technology (325 | 14.4%), education (295 | 13.1%), social sciences (218 | 9.7%), and psychology (162 | 7.2%) are the most common fields of study among 2,253 individuals in Effingham who have obtained a bachelor's degree or higher.
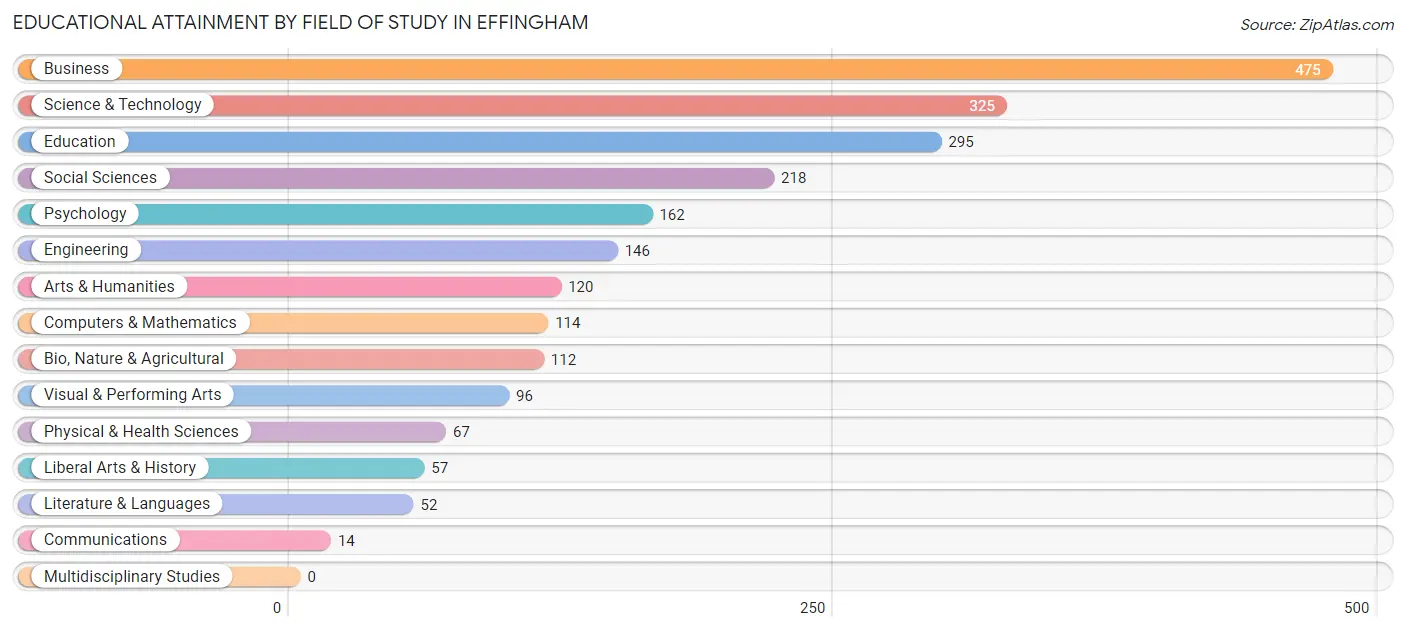
| Field of Study | # Graduates | % Graduates |
| Computers & Mathematics | 114 | 5.1% |
| Bio, Nature & Agricultural | 112 | 5.0% |
| Physical & Health Sciences | 67 | 3.0% |
| Psychology | 162 | 7.2% |
| Social Sciences | 218 | 9.7% |
| Engineering | 146 | 6.5% |
| Multidisciplinary Studies | 0 | 0.0% |
| Science & Technology | 325 | 14.4% |
| Business | 475 | 21.1% |
| Education | 295 | 13.1% |
| Literature & Languages | 52 | 2.3% |
| Liberal Arts & History | 57 | 2.5% |
| Visual & Performing Arts | 96 | 4.3% |
| Communications | 14 | 0.6% |
| Arts & Humanities | 120 | 5.3% |
| Total | 2,253 | 100.0% |
Transportation & Commute in Effingham
Vehicle Availability by Sex in Effingham
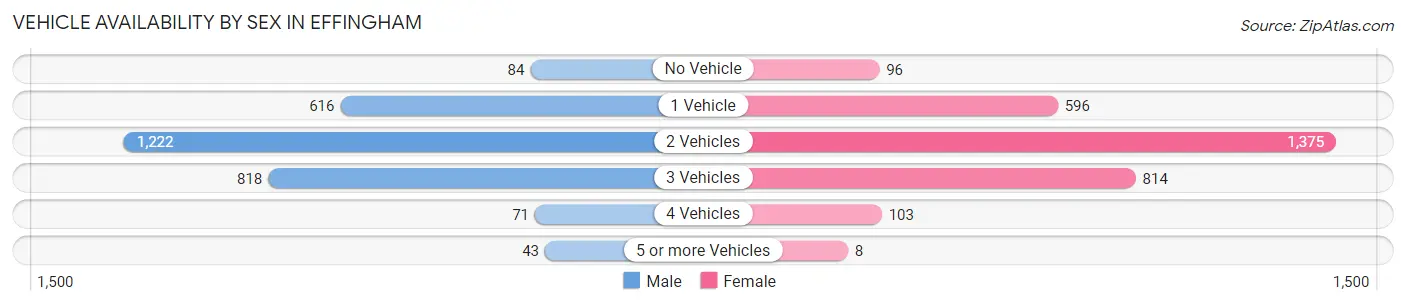
The most prevalent vehicle ownership categories in Effingham are males with 2 vehicles (1,222, accounting for 42.8%) and females with 2 vehicles (1,375, making up 40.8%).
| Vehicles Available | Male | Female |
| No Vehicle | 84 (2.9%) | 96 (3.2%) |
| 1 Vehicle | 616 (21.6%) | 596 (19.9%) |
| 2 Vehicles | 1,222 (42.8%) | 1,375 (46.0%) |
| 3 Vehicles | 818 (28.7%) | 814 (27.2%) |
| 4 Vehicles | 71 (2.5%) | 103 (3.4%) |
| 5 or more Vehicles | 43 (1.5%) | 8 (0.3%) |
| Total | 2,854 (100.0%) | 2,992 (100.0%) |
Commute Time in Effingham
The most frequently occuring commute durations in Effingham are 5 to 9 minutes (1,645 commuters, 31.6%), 10 to 14 minutes (1,410 commuters, 27.1%), and less than 5 minutes (529 commuters, 10.2%).
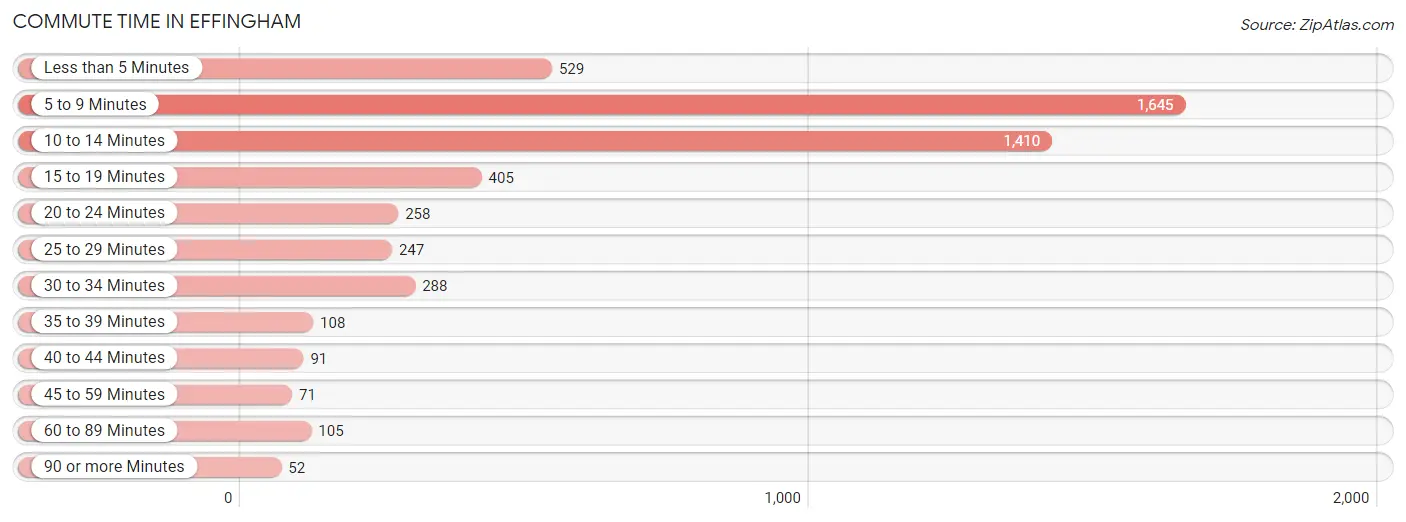
| Commute Time | # Commuters | % Commuters |
| Less than 5 Minutes | 529 | 10.2% |
| 5 to 9 Minutes | 1,645 | 31.6% |
| 10 to 14 Minutes | 1,410 | 27.1% |
| 15 to 19 Minutes | 405 | 7.8% |
| 20 to 24 Minutes | 258 | 5.0% |
| 25 to 29 Minutes | 247 | 4.7% |
| 30 to 34 Minutes | 288 | 5.5% |
| 35 to 39 Minutes | 108 | 2.1% |
| 40 to 44 Minutes | 91 | 1.8% |
| 45 to 59 Minutes | 71 | 1.4% |
| 60 to 89 Minutes | 105 | 2.0% |
| 90 or more Minutes | 52 | 1.0% |
Commute Time by Sex in Effingham
The most common commute times in Effingham are 5 to 9 minutes (766 commuters, 29.4%) for males and 5 to 9 minutes (879 commuters, 33.8%) for females.
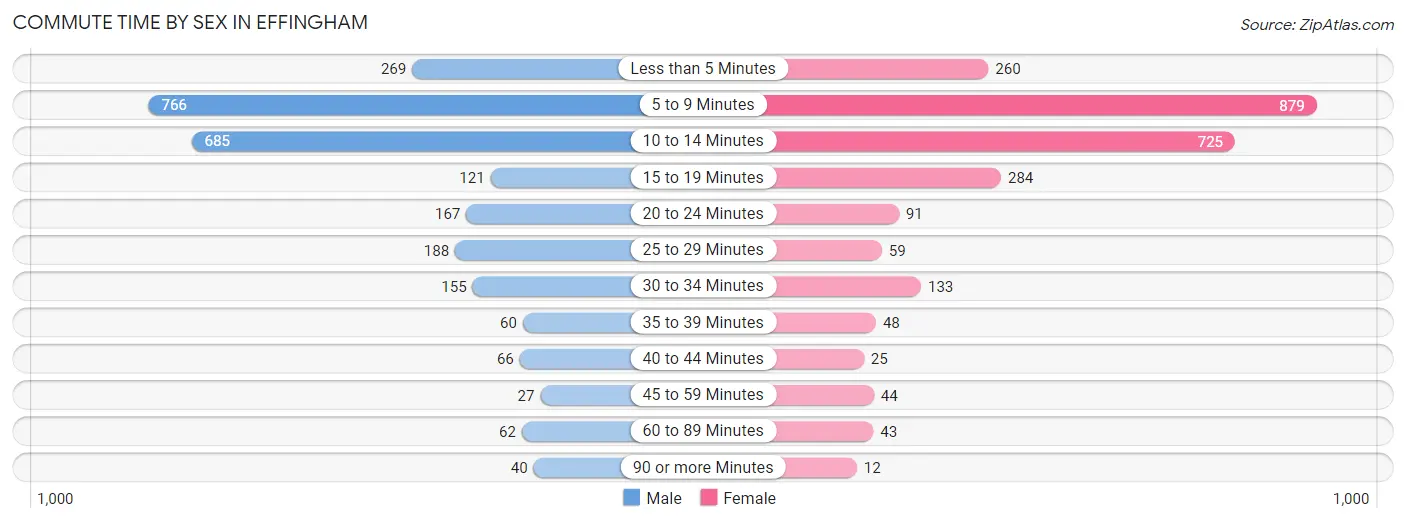
| Commute Time | Male | Female |
| Less than 5 Minutes | 269 (10.3%) | 260 (10.0%) |
| 5 to 9 Minutes | 766 (29.4%) | 879 (33.8%) |
| 10 to 14 Minutes | 685 (26.3%) | 725 (27.9%) |
| 15 to 19 Minutes | 121 (4.6%) | 284 (10.9%) |
| 20 to 24 Minutes | 167 (6.4%) | 91 (3.5%) |
| 25 to 29 Minutes | 188 (7.2%) | 59 (2.3%) |
| 30 to 34 Minutes | 155 (5.9%) | 133 (5.1%) |
| 35 to 39 Minutes | 60 (2.3%) | 48 (1.8%) |
| 40 to 44 Minutes | 66 (2.5%) | 25 (1.0%) |
| 45 to 59 Minutes | 27 (1.0%) | 44 (1.7%) |
| 60 to 89 Minutes | 62 (2.4%) | 43 (1.7%) |
| 90 or more Minutes | 40 (1.5%) | 12 (0.5%) |
Time of Departure to Work by Sex in Effingham
The most frequent times of departure to work in Effingham are 6:30 AM to 6:59 AM (557, 21.4%) for males and 7:00 AM to 7:29 AM (518, 19.9%) for females.
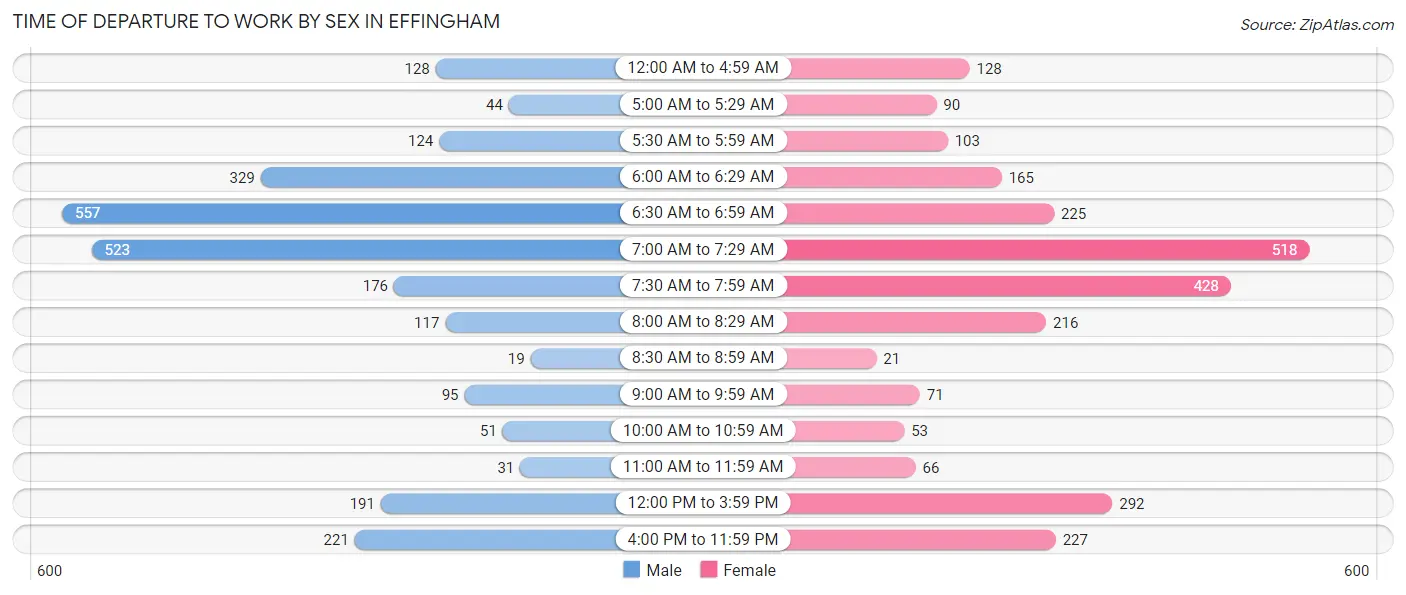
| Time of Departure | Male | Female |
| 12:00 AM to 4:59 AM | 128 (4.9%) | 128 (4.9%) |
| 5:00 AM to 5:29 AM | 44 (1.7%) | 90 (3.5%) |
| 5:30 AM to 5:59 AM | 124 (4.8%) | 103 (4.0%) |
| 6:00 AM to 6:29 AM | 329 (12.6%) | 165 (6.3%) |
| 6:30 AM to 6:59 AM | 557 (21.4%) | 225 (8.6%) |
| 7:00 AM to 7:29 AM | 523 (20.1%) | 518 (19.9%) |
| 7:30 AM to 7:59 AM | 176 (6.8%) | 428 (16.4%) |
| 8:00 AM to 8:29 AM | 117 (4.5%) | 216 (8.3%) |
| 8:30 AM to 8:59 AM | 19 (0.7%) | 21 (0.8%) |
| 9:00 AM to 9:59 AM | 95 (3.6%) | 71 (2.7%) |
| 10:00 AM to 10:59 AM | 51 (2.0%) | 53 (2.0%) |
| 11:00 AM to 11:59 AM | 31 (1.2%) | 66 (2.5%) |
| 12:00 PM to 3:59 PM | 191 (7.3%) | 292 (11.2%) |
| 4:00 PM to 11:59 PM | 221 (8.5%) | 227 (8.7%) |
| Total | 2,606 (100.0%) | 2,603 (100.0%) |
Housing Occupancy in Effingham
Occupancy by Ownership in Effingham
Of the total 5,140 dwellings in Effingham, owner-occupied units account for 3,268 (63.6%), while renter-occupied units make up 1,872 (36.4%).
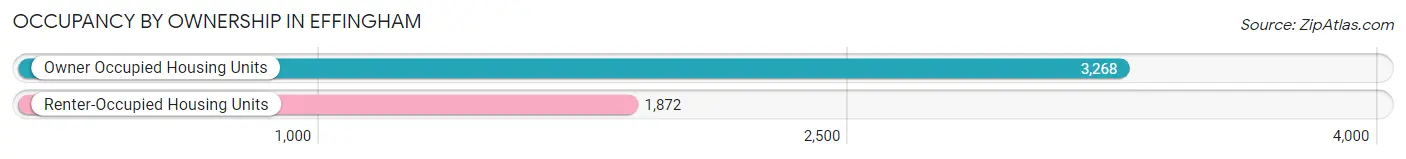
| Occupancy | # Housing Units | % Housing Units |
| Owner Occupied Housing Units | 3,268 | 63.6% |
| Renter-Occupied Housing Units | 1,872 | 36.4% |
| Total Occupied Housing Units | 5,140 | 100.0% |
Occupancy by Household Size in Effingham
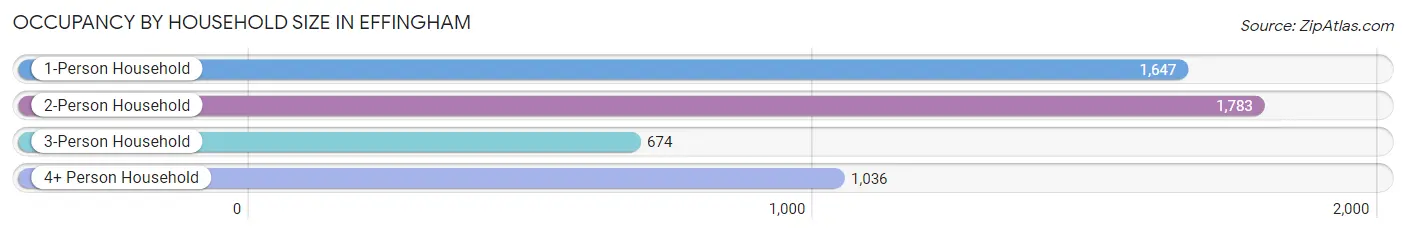
| Household Size | # Housing Units | % Housing Units |
| 1-Person Household | 1,647 | 32.0% |
| 2-Person Household | 1,783 | 34.7% |
| 3-Person Household | 674 | 13.1% |
| 4+ Person Household | 1,036 | 20.2% |
| Total Housing Units | 5,140 | 100.0% |
Occupancy by Ownership by Household Size in Effingham
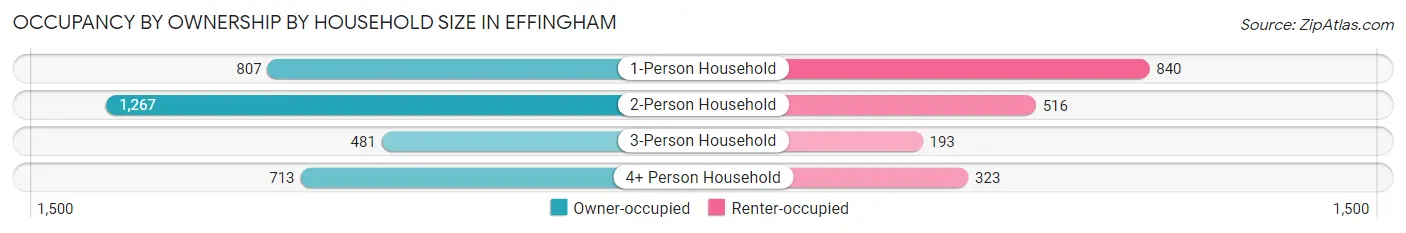
| Household Size | Owner-occupied | Renter-occupied |
| 1-Person Household | 807 (49.0%) | 840 (51.0%) |
| 2-Person Household | 1,267 (71.1%) | 516 (28.9%) |
| 3-Person Household | 481 (71.4%) | 193 (28.6%) |
| 4+ Person Household | 713 (68.8%) | 323 (31.2%) |
| Total Housing Units | 3,268 (63.6%) | 1,872 (36.4%) |
Occupancy by Educational Attainment in Effingham
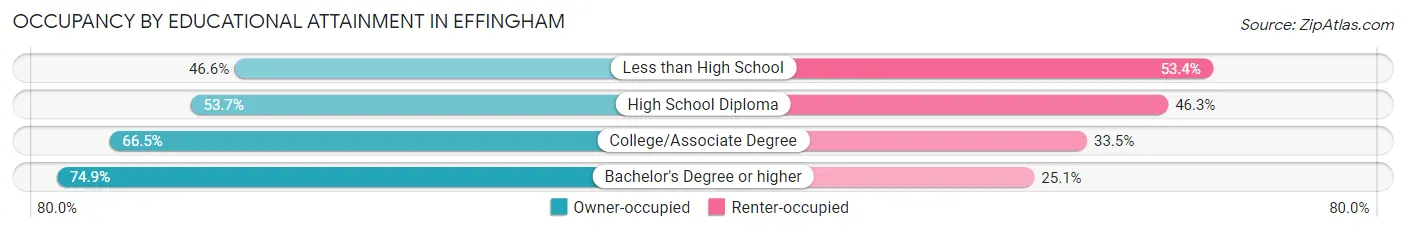
| Household Size | Owner-occupied | Renter-occupied |
| Less than High School | 152 (46.6%) | 174 (53.4%) |
| High School Diploma | 803 (53.7%) | 693 (46.3%) |
| College/Associate Degree | 1,370 (66.5%) | 689 (33.5%) |
| Bachelor's Degree or higher | 943 (74.9%) | 316 (25.1%) |
Occupancy by Age of Householder in Effingham
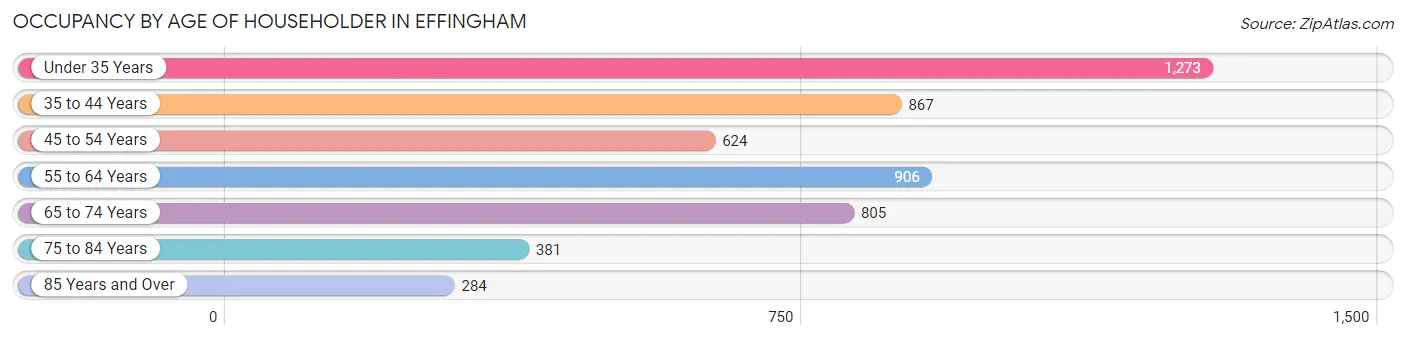
| Age Bracket | # Households | % Households |
| Under 35 Years | 1,273 | 24.8% |
| 35 to 44 Years | 867 | 16.9% |
| 45 to 54 Years | 624 | 12.1% |
| 55 to 64 Years | 906 | 17.6% |
| 65 to 74 Years | 805 | 15.7% |
| 75 to 84 Years | 381 | 7.4% |
| 85 Years and Over | 284 | 5.5% |
| Total | 5,140 | 100.0% |
Housing Finances in Effingham
Median Income by Occupancy in Effingham
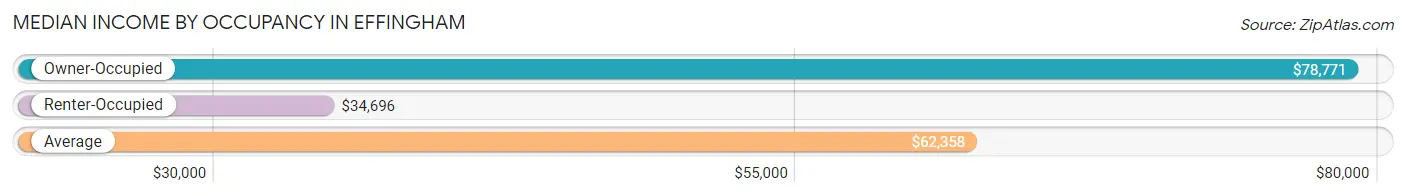
| Occupancy Type | # Households | Median Income |
| Owner-Occupied | 3,268 (63.6%) | $78,771 |
| Renter-Occupied | 1,872 (36.4%) | $34,696 |
| Average | 5,140 (100.0%) | $62,358 |
Occupancy by Householder Income Bracket in Effingham
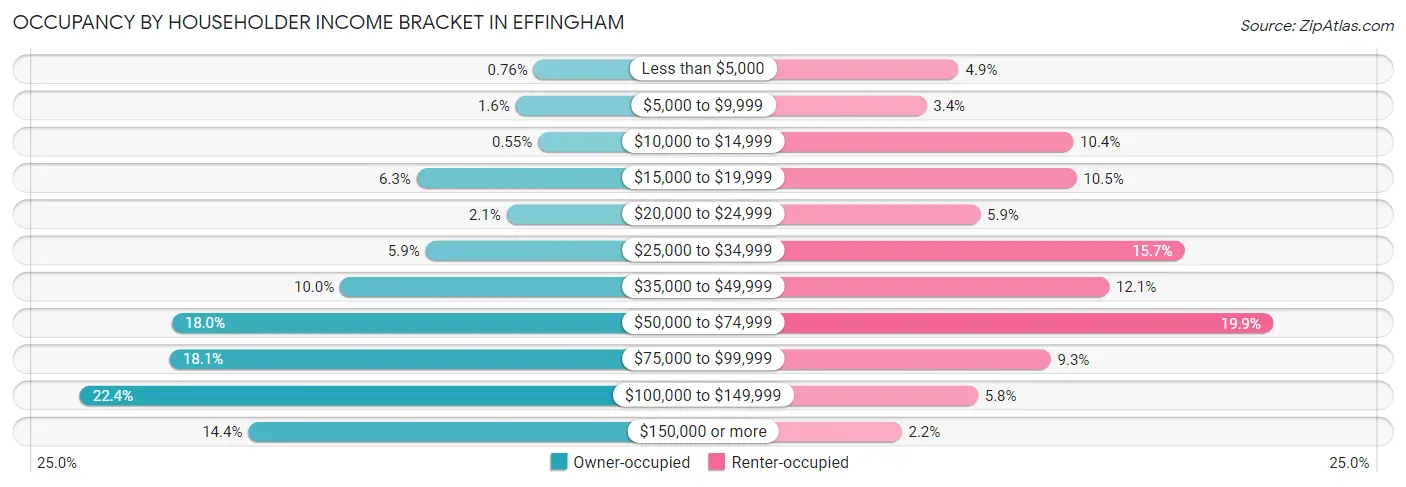
| Income Bracket | Owner-occupied | Renter-occupied |
| Less than $5,000 | 25 (0.8%) | 92 (4.9%) |
| $5,000 to $9,999 | 53 (1.6%) | 63 (3.4%) |
| $10,000 to $14,999 | 18 (0.5%) | 194 (10.4%) |
| $15,000 to $19,999 | 207 (6.3%) | 197 (10.5%) |
| $20,000 to $24,999 | 67 (2.1%) | 111 (5.9%) |
| $25,000 to $34,999 | 193 (5.9%) | 293 (15.7%) |
| $35,000 to $49,999 | 326 (10.0%) | 226 (12.1%) |
| $50,000 to $74,999 | 588 (18.0%) | 372 (19.9%) |
| $75,000 to $99,999 | 591 (18.1%) | 174 (9.3%) |
| $100,000 to $149,999 | 731 (22.4%) | 109 (5.8%) |
| $150,000 or more | 469 (14.3%) | 41 (2.2%) |
| Total | 3,268 (100.0%) | 1,872 (100.0%) |
Monthly Housing Cost Tiers in Effingham
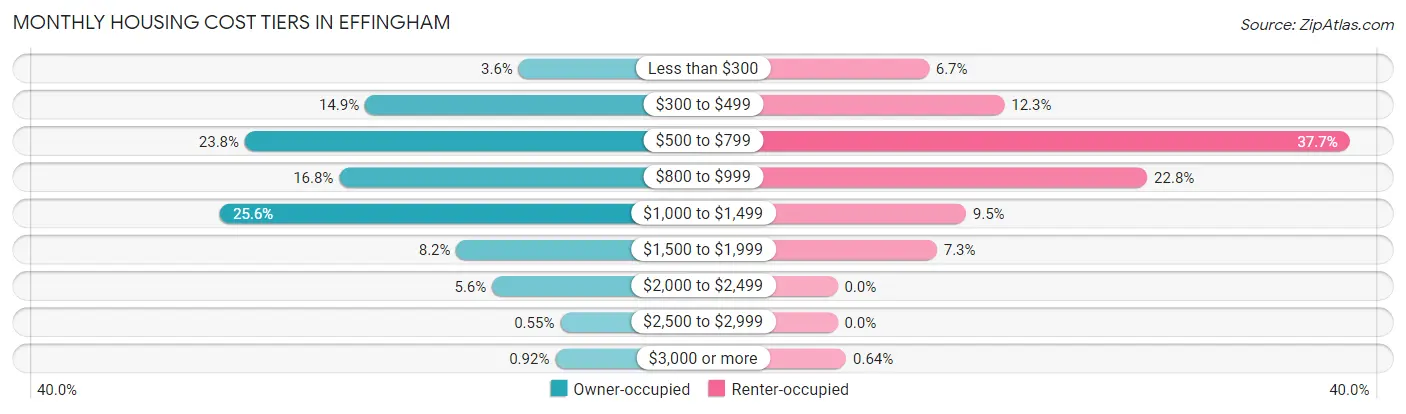
| Monthly Cost | Owner-occupied | Renter-occupied |
| Less than $300 | 118 (3.6%) | 126 (6.7%) |
| $300 to $499 | 488 (14.9%) | 230 (12.3%) |
| $500 to $799 | 777 (23.8%) | 706 (37.7%) |
| $800 to $999 | 550 (16.8%) | 427 (22.8%) |
| $1,000 to $1,499 | 837 (25.6%) | 177 (9.5%) |
| $1,500 to $1,999 | 268 (8.2%) | 137 (7.3%) |
| $2,000 to $2,499 | 182 (5.6%) | 0 (0.0%) |
| $2,500 to $2,999 | 18 (0.5%) | 0 (0.0%) |
| $3,000 or more | 30 (0.9%) | 12 (0.6%) |
| Total | 3,268 (100.0%) | 1,872 (100.0%) |
Physical Housing Characteristics in Effingham
Housing Structures in Effingham
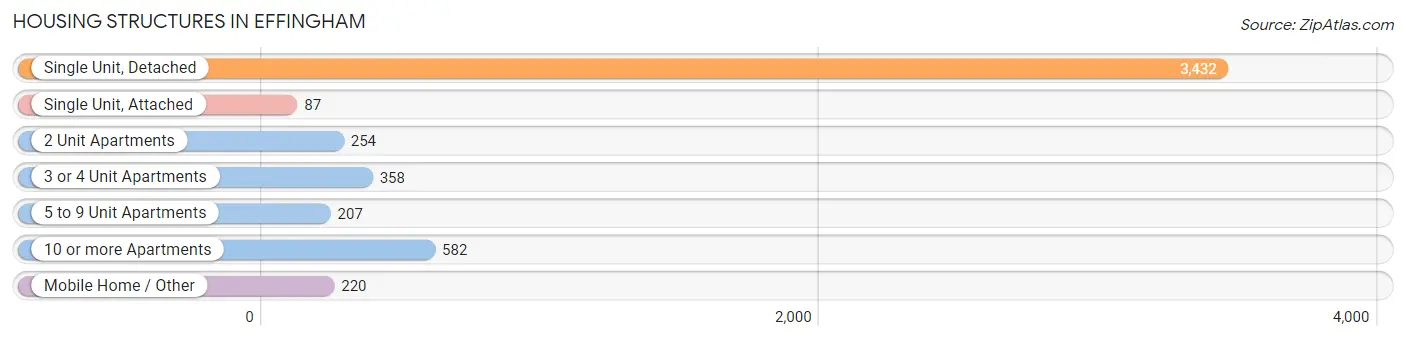
| Structure Type | # Housing Units | % Housing Units |
| Single Unit, Detached | 3,432 | 66.8% |
| Single Unit, Attached | 87 | 1.7% |
| 2 Unit Apartments | 254 | 4.9% |
| 3 or 4 Unit Apartments | 358 | 7.0% |
| 5 to 9 Unit Apartments | 207 | 4.0% |
| 10 or more Apartments | 582 | 11.3% |
| Mobile Home / Other | 220 | 4.3% |
| Total | 5,140 | 100.0% |
Housing Structures by Occupancy in Effingham
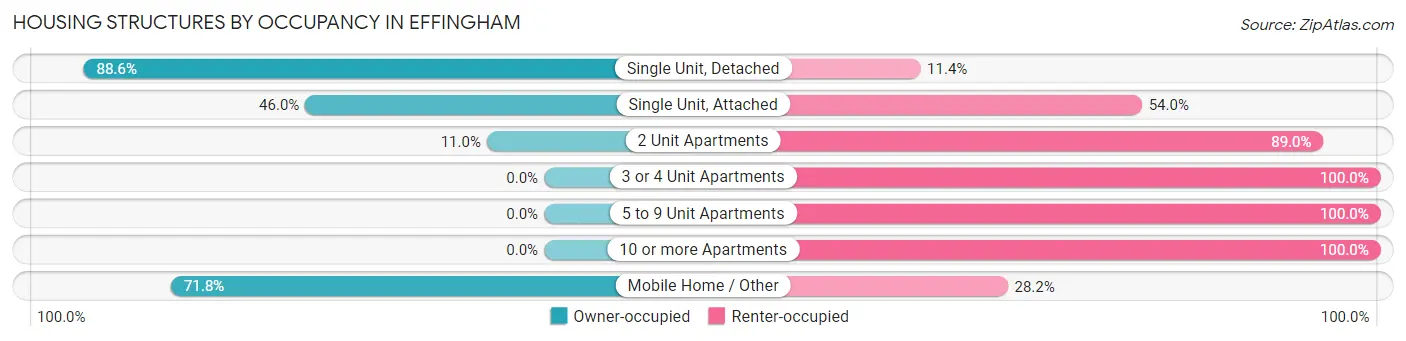
| Structure Type | Owner-occupied | Renter-occupied |
| Single Unit, Detached | 3,042 (88.6%) | 390 (11.4%) |
| Single Unit, Attached | 40 (46.0%) | 47 (54.0%) |
| 2 Unit Apartments | 28 (11.0%) | 226 (89.0%) |
| 3 or 4 Unit Apartments | 0 (0.0%) | 358 (100.0%) |
| 5 to 9 Unit Apartments | 0 (0.0%) | 207 (100.0%) |
| 10 or more Apartments | 0 (0.0%) | 582 (100.0%) |
| Mobile Home / Other | 158 (71.8%) | 62 (28.2%) |
| Total | 3,268 (63.6%) | 1,872 (36.4%) |
Housing Structures by Number of Rooms in Effingham
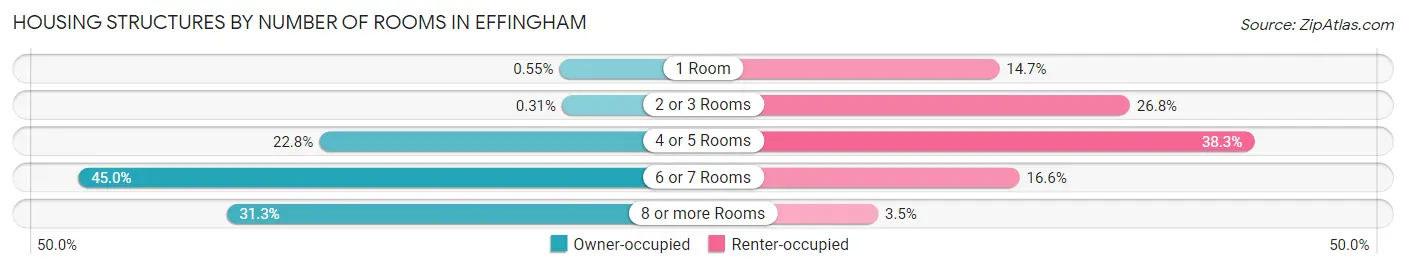
| Number of Rooms | Owner-occupied | Renter-occupied |
| 1 Room | 18 (0.5%) | 276 (14.7%) |
| 2 or 3 Rooms | 10 (0.3%) | 502 (26.8%) |
| 4 or 5 Rooms | 744 (22.8%) | 717 (38.3%) |
| 6 or 7 Rooms | 1,472 (45.0%) | 311 (16.6%) |
| 8 or more Rooms | 1,024 (31.3%) | 66 (3.5%) |
| Total | 3,268 (100.0%) | 1,872 (100.0%) |
Housing Structure by Heating Type in Effingham
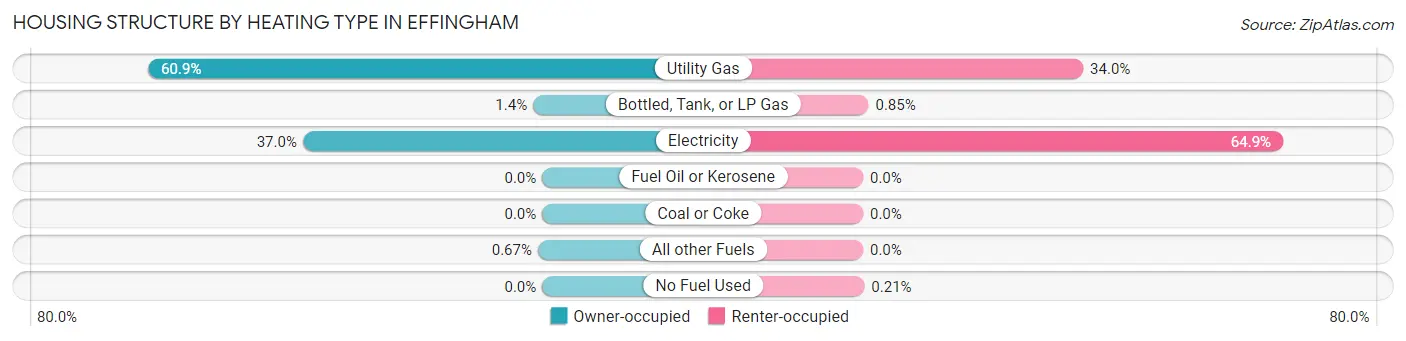
| Heating Type | Owner-occupied | Renter-occupied |
| Utility Gas | 1,991 (60.9%) | 637 (34.0%) |
| Bottled, Tank, or LP Gas | 46 (1.4%) | 16 (0.9%) |
| Electricity | 1,209 (37.0%) | 1,215 (64.9%) |
| Fuel Oil or Kerosene | 0 (0.0%) | 0 (0.0%) |
| Coal or Coke | 0 (0.0%) | 0 (0.0%) |
| All other Fuels | 22 (0.7%) | 0 (0.0%) |
| No Fuel Used | 0 (0.0%) | 4 (0.2%) |
| Total | 3,268 (100.0%) | 1,872 (100.0%) |
Household Vehicle Usage in Effingham
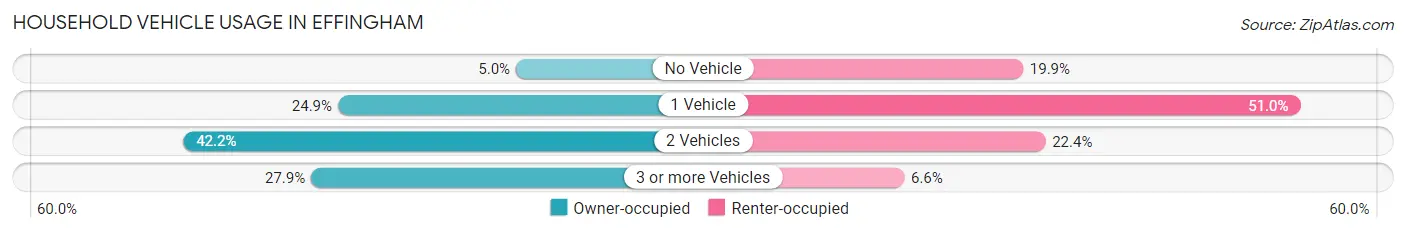
| Vehicles per Household | Owner-occupied | Renter-occupied |
| No Vehicle | 162 (5.0%) | 373 (19.9%) |
| 1 Vehicle | 814 (24.9%) | 955 (51.0%) |
| 2 Vehicles | 1,380 (42.2%) | 420 (22.4%) |
| 3 or more Vehicles | 912 (27.9%) | 124 (6.6%) |
| Total | 3,268 (100.0%) | 1,872 (100.0%) |
Real Estate & Mortgages in Effingham
Real Estate and Mortgage Overview in Effingham
| Characteristic | Without Mortgage | With Mortgage |
| Housing Units | 1,496 | 1,772 |
| Median Property Value | $150,400 | $160,300 |
| Median Household Income | $63,235 | $231 |
| Monthly Housing Costs | $541 | $30 |
| Real Estate Taxes | $2,504 | $72 |
Property Value by Mortgage Status in Effingham
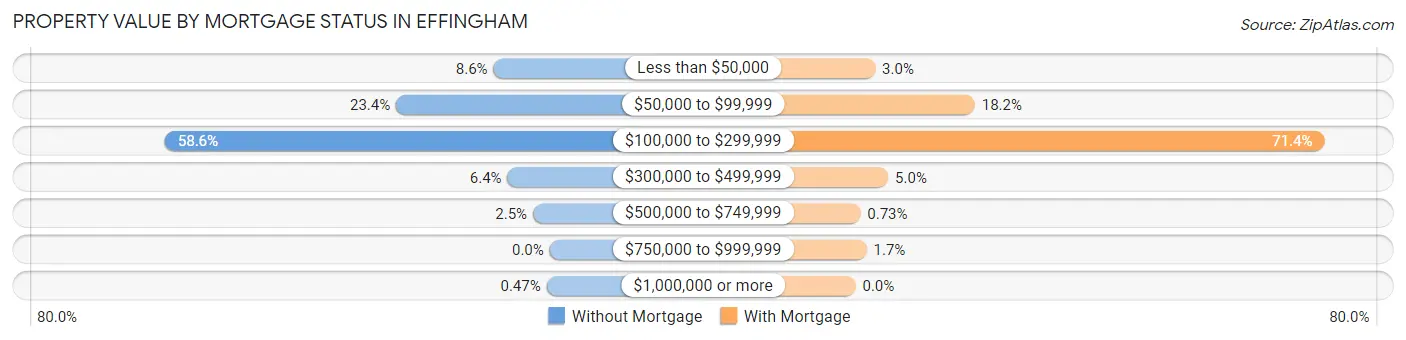
| Property Value | Without Mortgage | With Mortgage |
| Less than $50,000 | 128 (8.6%) | 53 (3.0%) |
| $50,000 to $99,999 | 350 (23.4%) | 322 (18.2%) |
| $100,000 to $299,999 | 877 (58.6%) | 1,266 (71.4%) |
| $300,000 to $499,999 | 96 (6.4%) | 88 (5.0%) |
| $500,000 to $749,999 | 38 (2.5%) | 13 (0.7%) |
| $750,000 to $999,999 | 0 (0.0%) | 30 (1.7%) |
| $1,000,000 or more | 7 (0.5%) | 0 (0.0%) |
| Total | 1,496 (100.0%) | 1,772 (100.0%) |
Household Income by Mortgage Status in Effingham
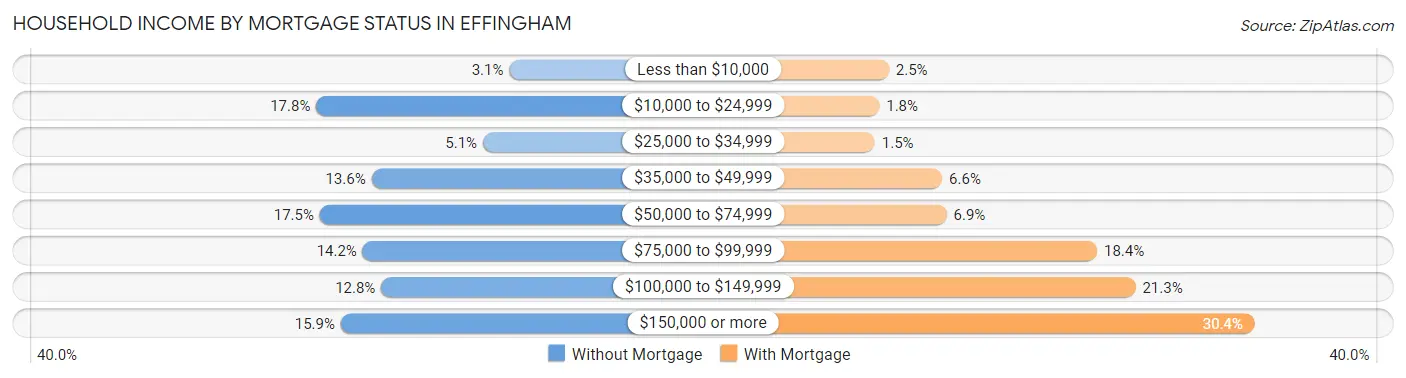
| Household Income | Without Mortgage | With Mortgage |
| Less than $10,000 | 46 (3.1%) | 45 (2.5%) |
| $10,000 to $24,999 | 266 (17.8%) | 32 (1.8%) |
| $25,000 to $34,999 | 76 (5.1%) | 26 (1.5%) |
| $35,000 to $49,999 | 203 (13.6%) | 117 (6.6%) |
| $50,000 to $74,999 | 262 (17.5%) | 123 (6.9%) |
| $75,000 to $99,999 | 213 (14.2%) | 326 (18.4%) |
| $100,000 to $149,999 | 192 (12.8%) | 378 (21.3%) |
| $150,000 or more | 238 (15.9%) | 539 (30.4%) |
| Total | 1,496 (100.0%) | 1,772 (100.0%) |
Property Value to Household Income Ratio in Effingham
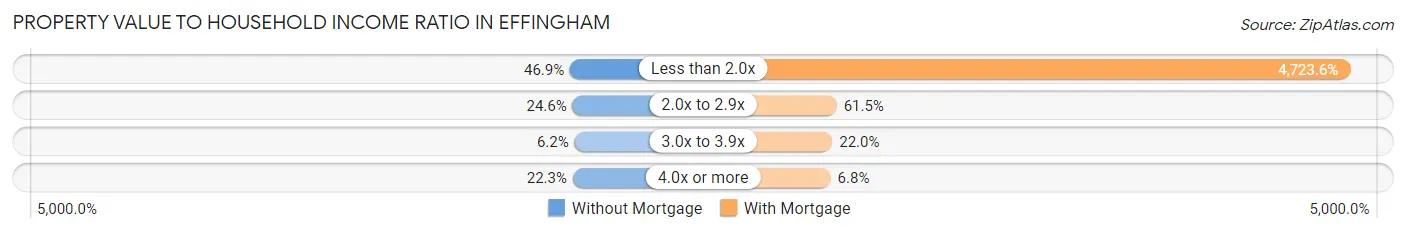
| Value-to-Income Ratio | Without Mortgage | With Mortgage |
| Less than 2.0x | 702 (46.9%) | 83,702 (4,723.6%) |
| 2.0x to 2.9x | 368 (24.6%) | 1,089 (61.5%) |
| 3.0x to 3.9x | 93 (6.2%) | 389 (22.0%) |
| 4.0x or more | 333 (22.3%) | 120 (6.8%) |
| Total | 1,496 (100.0%) | 1,772 (100.0%) |
Real Estate Taxes by Mortgage Status in Effingham
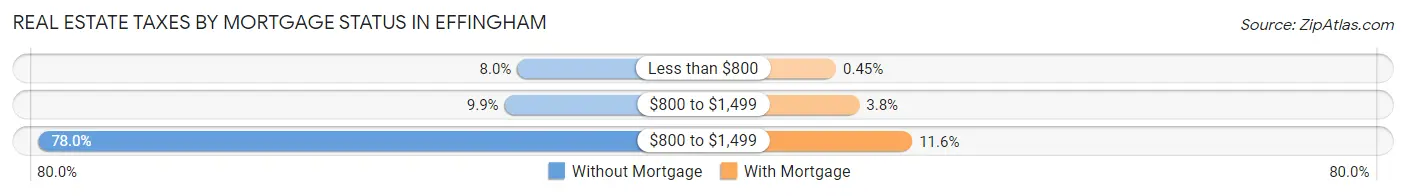
| Property Taxes | Without Mortgage | With Mortgage |
| Less than $800 | 120 (8.0%) | 8 (0.4%) |
| $800 to $1,499 | 148 (9.9%) | 68 (3.8%) |
| $800 to $1,499 | 1,167 (78.0%) | 205 (11.6%) |
| Total | 1,496 (100.0%) | 1,772 (100.0%) |
Health & Disability in Effingham
Health Insurance Coverage by Age in Effingham
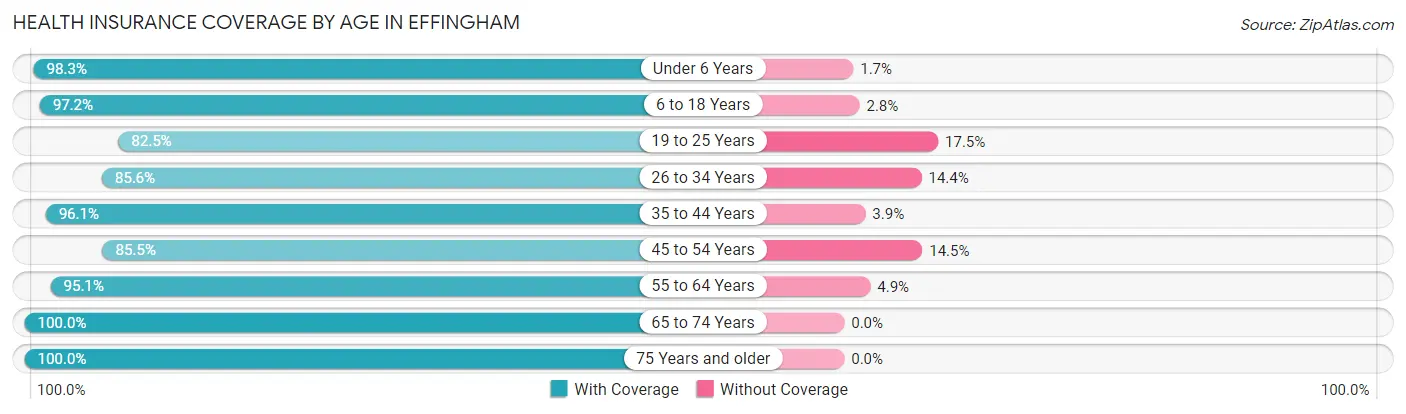
| Age Bracket | With Coverage | Without Coverage |
| Under 6 Years | 817 (98.3%) | 14 (1.7%) |
| 6 to 18 Years | 2,053 (97.2%) | 60 (2.8%) |
| 19 to 25 Years | 938 (82.5%) | 199 (17.5%) |
| 26 to 34 Years | 1,295 (85.6%) | 218 (14.4%) |
| 35 to 44 Years | 1,389 (96.1%) | 57 (3.9%) |
| 45 to 54 Years | 1,040 (85.5%) | 177 (14.5%) |
| 55 to 64 Years | 1,450 (95.1%) | 74 (4.9%) |
| 65 to 74 Years | 1,252 (100.0%) | 0 (0.0%) |
| 75 Years and older | 913 (100.0%) | 0 (0.0%) |
| Total | 11,147 (93.3%) | 799 (6.7%) |
Health Insurance Coverage by Citizenship Status in Effingham
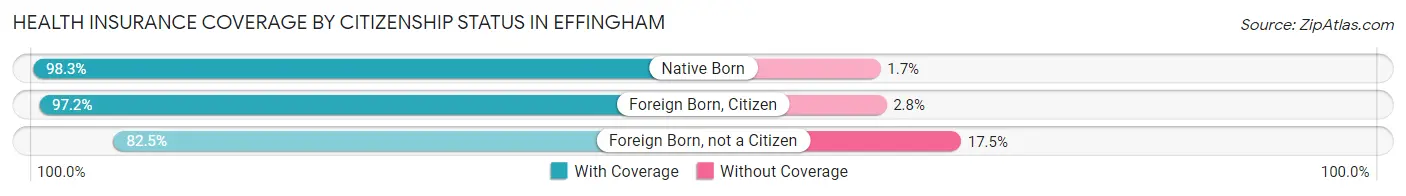
| Citizenship Status | With Coverage | Without Coverage |
| Native Born | 817 (98.3%) | 14 (1.7%) |
| Foreign Born, Citizen | 2,053 (97.2%) | 60 (2.8%) |
| Foreign Born, not a Citizen | 938 (82.5%) | 199 (17.5%) |
Health Insurance Coverage by Household Income in Effingham
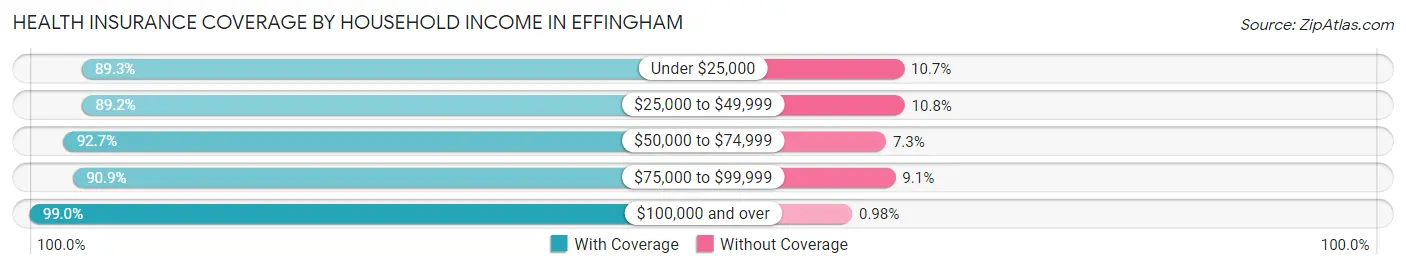
| Household Income | With Coverage | Without Coverage |
| Under $25,000 | 1,704 (89.3%) | 205 (10.7%) |
| $25,000 to $49,999 | 1,768 (89.2%) | 215 (10.8%) |
| $50,000 to $74,999 | 1,754 (92.7%) | 139 (7.3%) |
| $75,000 to $99,999 | 2,015 (90.9%) | 202 (9.1%) |
| $100,000 and over | 3,824 (99.0%) | 38 (1.0%) |
Public vs Private Health Insurance Coverage by Age in Effingham
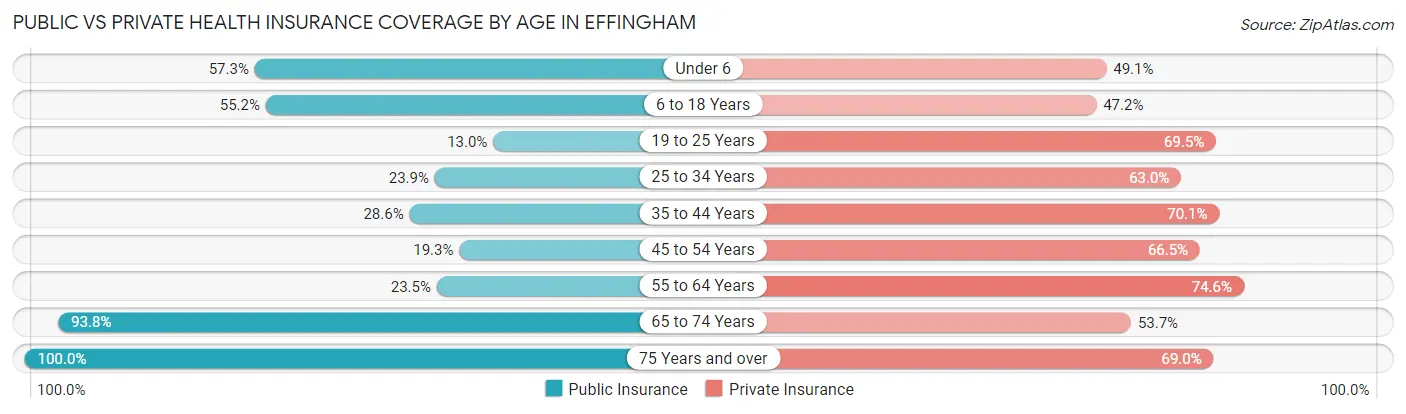
| Age Bracket | Public Insurance | Private Insurance |
| Under 6 | 476 (57.3%) | 408 (49.1%) |
| 6 to 18 Years | 1,167 (55.2%) | 998 (47.2%) |
| 19 to 25 Years | 148 (13.0%) | 790 (69.5%) |
| 25 to 34 Years | 361 (23.9%) | 953 (63.0%) |
| 35 to 44 Years | 413 (28.6%) | 1,013 (70.1%) |
| 45 to 54 Years | 235 (19.3%) | 809 (66.5%) |
| 55 to 64 Years | 358 (23.5%) | 1,137 (74.6%) |
| 65 to 74 Years | 1,174 (93.8%) | 672 (53.7%) |
| 75 Years and over | 913 (100.0%) | 630 (69.0%) |
| Total | 5,245 (43.9%) | 7,410 (62.0%) |
Disability Status by Sex by Age in Effingham
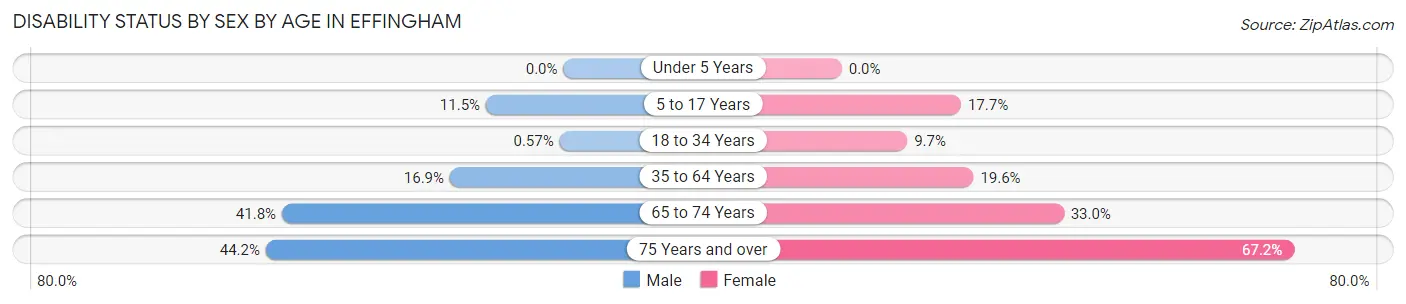
| Age Bracket | Male | Female |
| Under 5 Years | 0 (0.0%) | 0 (0.0%) |
| 5 to 17 Years | 133 (11.5%) | 166 (17.7%) |
| 18 to 34 Years | 7 (0.6%) | 152 (9.7%) |
| 35 to 64 Years | 347 (16.9%) | 416 (19.6%) |
| 65 to 74 Years | 229 (41.8%) | 232 (33.0%) |
| 75 Years and over | 137 (44.2%) | 405 (67.2%) |
Disability Class by Sex by Age in Effingham
Disability Class: Hearing Difficulty
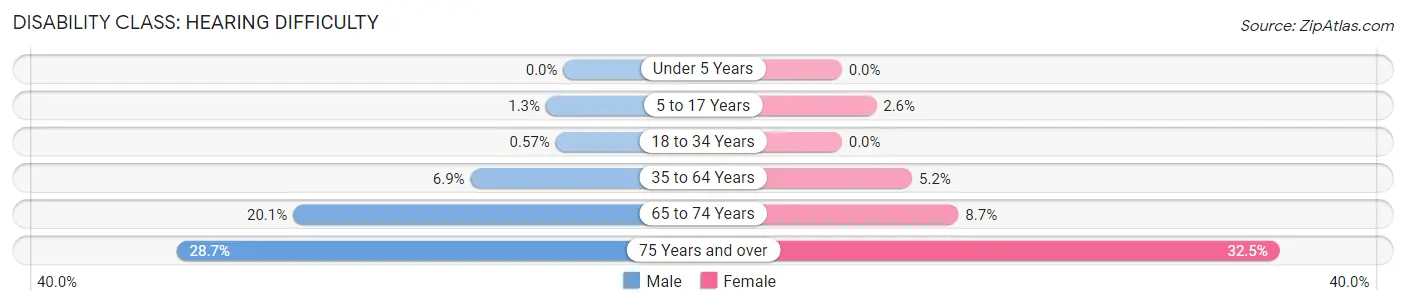
| Age Bracket | Male | Female |
| Under 5 Years | 0 (0.0%) | 0 (0.0%) |
| 5 to 17 Years | 15 (1.3%) | 24 (2.6%) |
| 18 to 34 Years | 7 (0.6%) | 0 (0.0%) |
| 35 to 64 Years | 142 (6.9%) | 111 (5.2%) |
| 65 to 74 Years | 110 (20.1%) | 61 (8.7%) |
| 75 Years and over | 89 (28.7%) | 196 (32.5%) |
Disability Class: Vision Difficulty
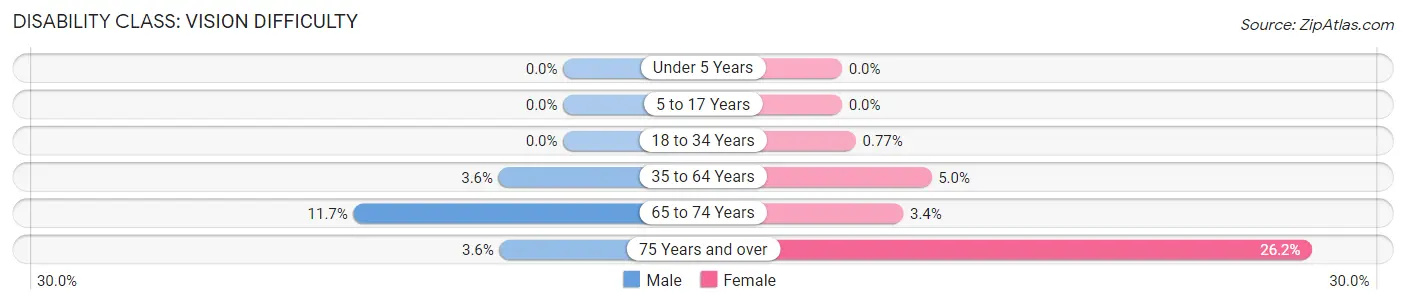
| Age Bracket | Male | Female |
| Under 5 Years | 0 (0.0%) | 0 (0.0%) |
| 5 to 17 Years | 0 (0.0%) | 0 (0.0%) |
| 18 to 34 Years | 0 (0.0%) | 12 (0.8%) |
| 35 to 64 Years | 74 (3.6%) | 106 (5.0%) |
| 65 to 74 Years | 64 (11.7%) | 24 (3.4%) |
| 75 Years and over | 11 (3.5%) | 158 (26.2%) |
Disability Class: Cognitive Difficulty
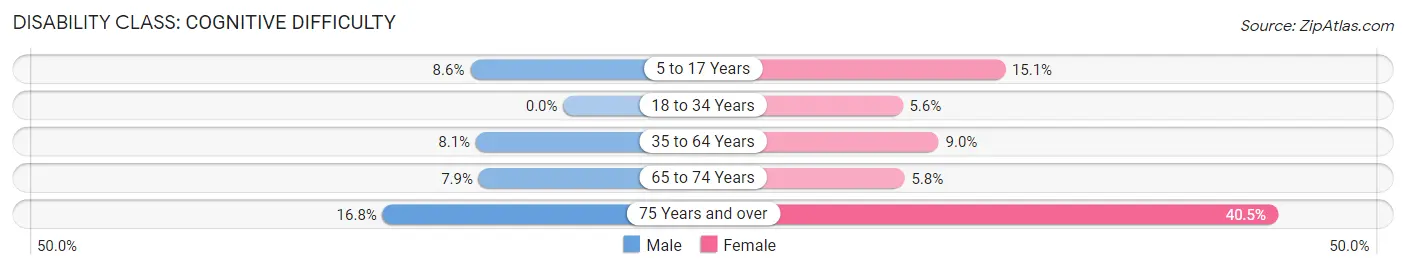
| Age Bracket | Male | Female |
| 5 to 17 Years | 100 (8.6%) | 142 (15.1%) |
| 18 to 34 Years | 0 (0.0%) | 88 (5.6%) |
| 35 to 64 Years | 167 (8.1%) | 191 (9.0%) |
| 65 to 74 Years | 43 (7.9%) | 41 (5.8%) |
| 75 Years and over | 52 (16.8%) | 244 (40.5%) |
Disability Class: Ambulatory Difficulty
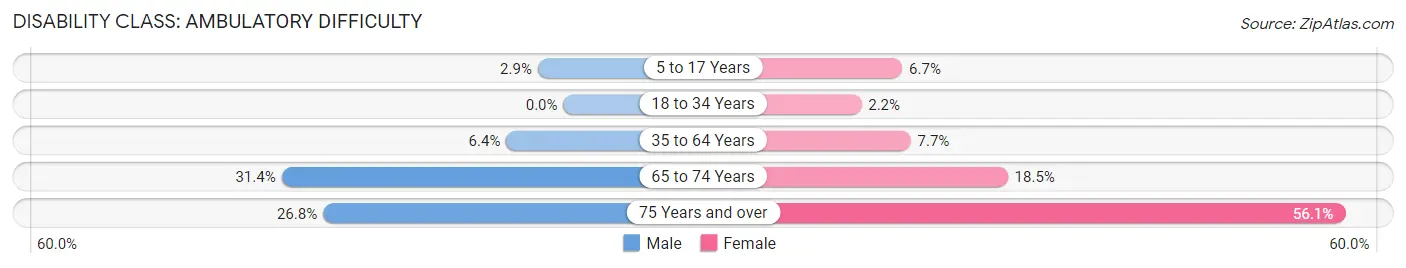
| Age Bracket | Male | Female |
| 5 to 17 Years | 33 (2.9%) | 63 (6.7%) |
| 18 to 34 Years | 0 (0.0%) | 34 (2.2%) |
| 35 to 64 Years | 131 (6.4%) | 163 (7.7%) |
| 65 to 74 Years | 172 (31.4%) | 130 (18.5%) |
| 75 Years and over | 83 (26.8%) | 338 (56.0%) |
Disability Class: Self-Care Difficulty
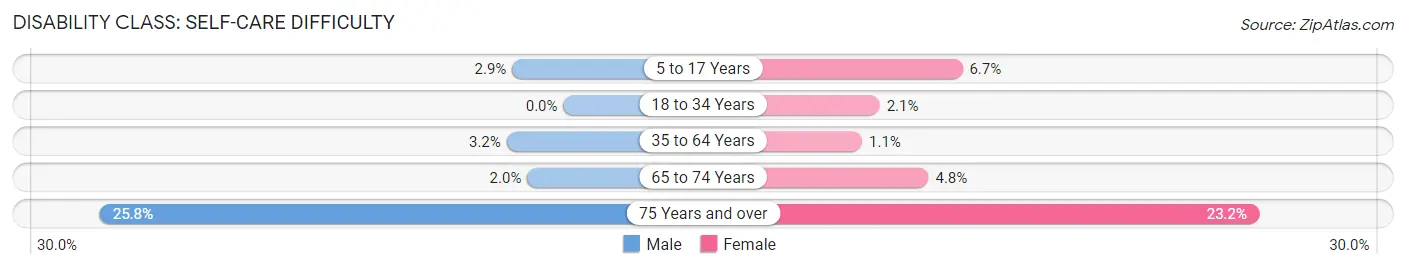
| Age Bracket | Male | Female |
| 5 to 17 Years | 33 (2.9%) | 63 (6.7%) |
| 18 to 34 Years | 0 (0.0%) | 33 (2.1%) |
| 35 to 64 Years | 65 (3.2%) | 24 (1.1%) |
| 65 to 74 Years | 11 (2.0%) | 34 (4.8%) |
| 75 Years and over | 80 (25.8%) | 140 (23.2%) |
Technology Access in Effingham
Computing Device Access in Effingham
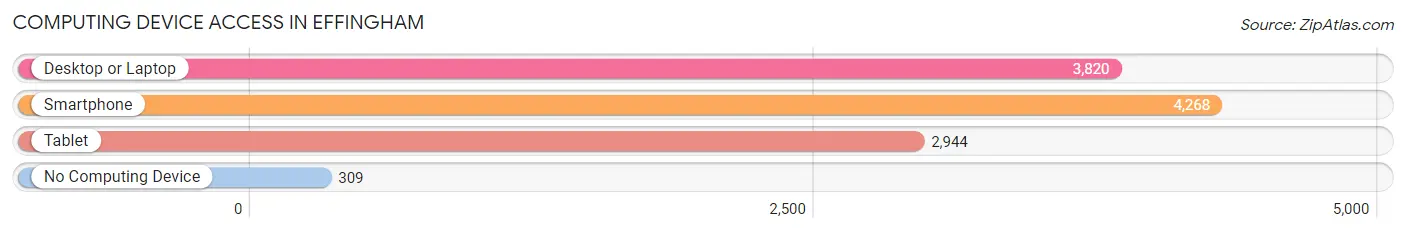
| Device Type | # Households | % Households |
| Desktop or Laptop | 3,820 | 74.3% |
| Smartphone | 4,268 | 83.0% |
| Tablet | 2,944 | 57.3% |
| No Computing Device | 309 | 6.0% |
| Total | 5,140 | 100.0% |
Internet Access in Effingham
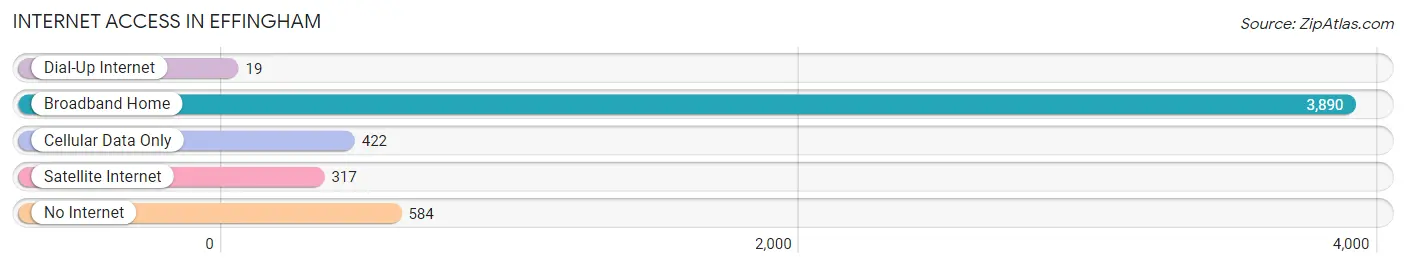
| Internet Type | # Households | % Households |
| Dial-Up Internet | 19 | 0.4% |
| Broadband Home | 3,890 | 75.7% |
| Cellular Data Only | 422 | 8.2% |
| Satellite Internet | 317 | 6.2% |
| No Internet | 584 | 11.4% |
| Total | 5,140 | 100.0% |
Effingham Summary
Effingham, Illinois is a city located in Effingham County, Illinois, United States. It is the county seat of Effingham County and is located in the Central Illinois region. The population of Effingham was 12,604 at the 2010 census.
History
Effingham was founded in 1814 by a group of settlers from the nearby town of Vandalia. The town was named after the Earl of Effingham, a British nobleman who had served as Governor of Virginia. The town was officially incorporated in 1859.
In the late 19th century, Effingham was a major railroad hub, with several railroads running through the city. The railroads brought a great deal of economic growth to the city, and it became a major center for manufacturing and agriculture.
In the early 20th century, Effingham was a major center for the oil industry. The city was home to several oil refineries and related businesses. The oil industry brought a great deal of wealth to the city, and it became a major center for commerce and industry.
Geography
Effingham is located in the Central Illinois region, in the southeastern part of Effingham County. The city is situated on the banks of the Embarras River, which flows through the city. The city is located about 60 miles south of the state capital of Springfield, and about 90 miles east of St. Louis, Missouri.
The city has a total area of 8.3 square miles, all of which is land. The city is located in a flat, open area, with no major hills or mountains. The climate is humid continental, with hot, humid summers and cold, dry winters.
Economy
Effingham has a diverse economy, with a mix of manufacturing, agriculture, and services. The city is home to several major employers, including the Effingham County Hospital, the Effingham County Courthouse, and the Effingham County Sheriff's Office.
The city is also home to several manufacturing companies, including the Effingham Manufacturing Company, which produces automotive parts, and the Effingham Tool and Die Company, which produces industrial tools and dies.
Agriculture is also an important part of the local economy. The city is home to several large farms, which produce corn, soybeans, wheat, and other crops.
Demographics
As of the 2010 census, the population of Effingham was 12,604. The racial makeup of the city was 95.2% White, 0.7% African American, 0.3% Native American, 0.7% Asian, 0.1% Pacific Islander, 1.7% from other races, and 1.2% from two or more races. Hispanic or Latino of any race were 3.3% of the population.
The median household income in Effingham was $45,945, and the median family income was $54,945. The per capita income for the city was $22,845. About 11.2% of families and 14.2% of the population were below the poverty line, including 19.2% of those under age 18 and 8.2% of those age 65 or over.
Common Questions
What is Per Capita Income in Effingham?
Per Capita income in Effingham is $33,472.
What is the Median Family Income in Effingham?
Median Family Income in Effingham is $78,326.
What is the Median Household income in Effingham?
Median Household Income in Effingham is $62,358.
What is Income or Wage Gap in Effingham?
Income or Wage Gap in Effingham is 34.0%.
Women in Effingham earn 66.0 cents for every dollar earned by a man.
What is Inequality or Gini Index in Effingham?
Inequality or Gini Index in Effingham is 0.44.
What is the Total Population of Effingham?
Total Population of Effingham is 12,244.
What is the Total Male Population of Effingham?
Total Male Population of Effingham is 5,713.
What is the Total Female Population of Effingham?
Total Female Population of Effingham is 6,531.
What is the Ratio of Males per 100 Females in Effingham?
There are 87.48 Males per 100 Females in Effingham.
What is the Ratio of Females per 100 Males in Effingham?
There are 114.32 Females per 100 Males in Effingham.
What is the Median Population Age in Effingham?
Median Population Age in Effingham is 37.1 Years.
What is the Average Family Size in Effingham
Average Family Size in Effingham is 3.0 People.
What is the Average Household Size in Effingham
Average Household Size in Effingham is 2.3 People.
How Large is the Labor Force in Effingham?
There are 6,159 People in the Labor Forcein in Effingham.
What is the Percentage of People in the Labor Force in Effingham?
64.0% of People are in the Labor Force in Effingham.
What is the Unemployment Rate in Effingham?
Unemployment Rate in Effingham is 2.9%.