Thomasboro, IL Map & Demographics
Thomasboro Map
Thomasboro Overview
$42,819
PER CAPITA INCOME
$100,500
AVG FAMILY INCOME
$60,833
AVG HOUSEHOLD INCOME
15.1%
WAGE / INCOME GAP [ % ]
84.9¢/ $1
WAGE / INCOME GAP [ $ ]
0.47
INEQUALITY / GINI INDEX
1,023
TOTAL POPULATION
488
MALE POPULATION
535
FEMALE POPULATION
91.21
MALES / 100 FEMALES
109.63
FEMALES / 100 MALES
46.3
MEDIAN AGE
2.8
AVG FAMILY SIZE
2.2
AVG HOUSEHOLD SIZE
546
LABOR FORCE [ PEOPLE ]
62.8%
PERCENT IN LABOR FORCE
4.1%
UNEMPLOYMENT RATE
Thomasboro Zip Codes
Thomasboro Area Codes
Income in Thomasboro
Income Overview in Thomasboro
Per Capita Income in Thomasboro is $42,819, while median incomes of families and households are $100,500 and $60,833 respectively.
| Characteristic | Number | Measure |
| Per Capita Income | 1,023 | $42,819 |
| Median Family Income | 294 | $100,500 |
| Mean Family Income | 294 | $120,580 |
| Median Household Income | 464 | $60,833 |
| Mean Household Income | 464 | $90,401 |
| Income Deficit | 294 | $0 |
| Wage / Income Gap (%) | 1,023 | 15.10% |
| Wage / Income Gap ($) | 1,023 | 84.90¢ per $1 |
| Gini / Inequality Index | 1,023 | 0.47 |
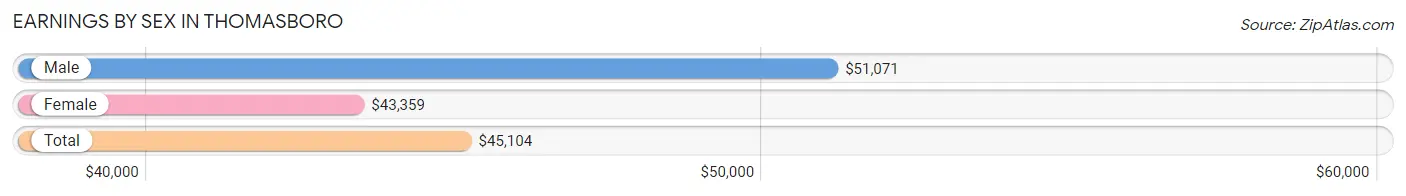
Earnings by Sex in Thomasboro
Average Earnings in Thomasboro are $45,104, $51,071 for men and $43,359 for women, a difference of 15.1%.
| Sex | Number | Average Earnings |
| Male | 304 (53.4%) | $51,071 |
| Female | 265 (46.6%) | $43,359 |
| Total | 569 (100.0%) | $45,104 |
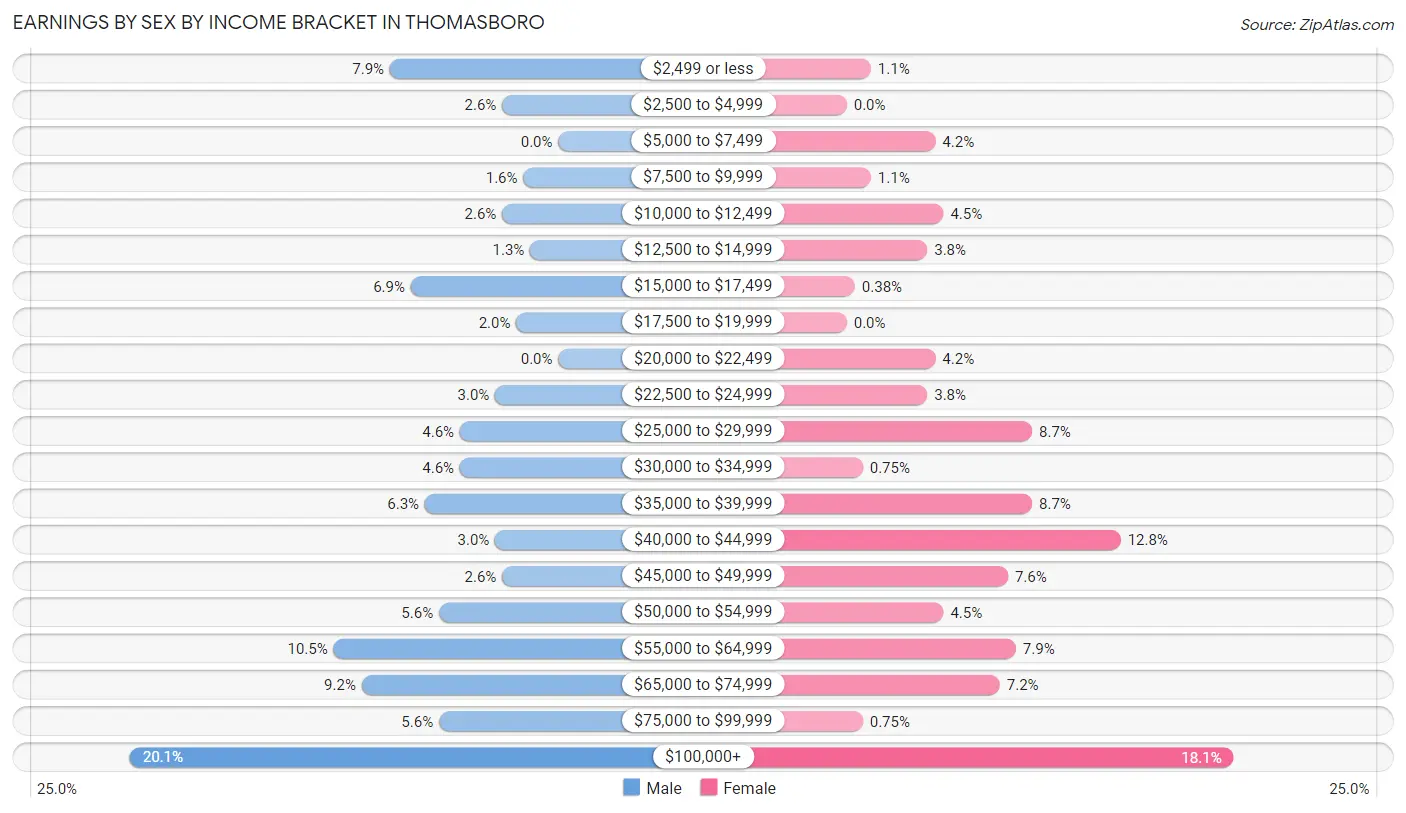
Earnings by Sex by Income Bracket in Thomasboro
The most common earnings brackets in Thomasboro are $100,000+ for men (61 | 20.1%) and $100,000+ for women (48 | 18.1%).
| Income | Male | Female |
| $2,499 or less | 24 (7.9%) | 3 (1.1%) |
| $2,500 to $4,999 | 8 (2.6%) | 0 (0.0%) |
| $5,000 to $7,499 | 0 (0.0%) | 11 (4.2%) |
| $7,500 to $9,999 | 5 (1.6%) | 3 (1.1%) |
| $10,000 to $12,499 | 8 (2.6%) | 12 (4.5%) |
| $12,500 to $14,999 | 4 (1.3%) | 10 (3.8%) |
| $15,000 to $17,499 | 21 (6.9%) | 1 (0.4%) |
| $17,500 to $19,999 | 6 (2.0%) | 0 (0.0%) |
| $20,000 to $22,499 | 0 (0.0%) | 11 (4.2%) |
| $22,500 to $24,999 | 9 (3.0%) | 10 (3.8%) |
| $25,000 to $29,999 | 14 (4.6%) | 23 (8.7%) |
| $30,000 to $34,999 | 14 (4.6%) | 2 (0.7%) |
| $35,000 to $39,999 | 19 (6.2%) | 23 (8.7%) |
| $40,000 to $44,999 | 9 (3.0%) | 34 (12.8%) |
| $45,000 to $49,999 | 8 (2.6%) | 20 (7.5%) |
| $50,000 to $54,999 | 17 (5.6%) | 12 (4.5%) |
| $55,000 to $64,999 | 32 (10.5%) | 21 (7.9%) |
| $65,000 to $74,999 | 28 (9.2%) | 19 (7.2%) |
| $75,000 to $99,999 | 17 (5.6%) | 2 (0.7%) |
| $100,000+ | 61 (20.1%) | 48 (18.1%) |
| Total | 304 (100.0%) | 265 (100.0%) |
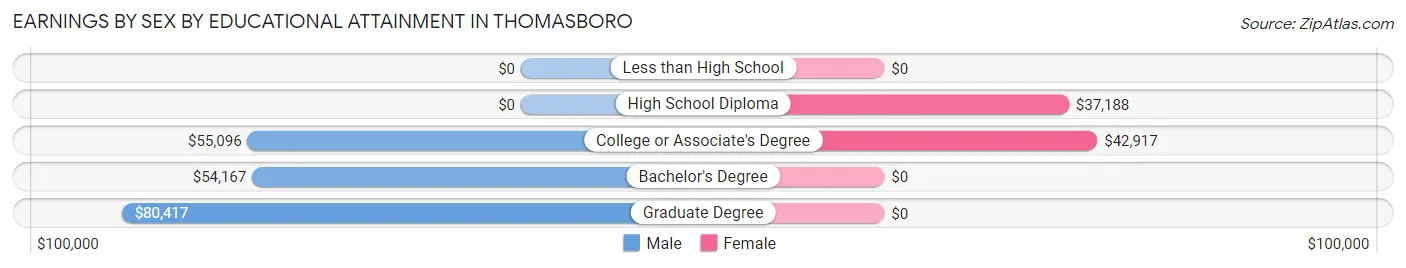
Earnings by Sex by Educational Attainment in Thomasboro
Average earnings in Thomasboro are $55,859 for men and $44,844 for women, a difference of 19.7%. Men with an educational attainment of graduate degree enjoy the highest average annual earnings of $80,417, while those with bachelor's degree education earn the least with $54,167. Women with an educational attainment of college or associate's degree earn the most with the average annual earnings of $42,917, while those with high school diploma education have the smallest earnings of $37,188.
| Educational Attainment | Male Income | Female Income |
| Less than High School | - | - |
| High School Diploma | - | - |
| College or Associate's Degree | $55,096 | $42,917 |
| Bachelor's Degree | $54,167 | $0 |
| Graduate Degree | $80,417 | $0 |
| Total | $55,859 | $44,844 |
Family Income in Thomasboro
Family Income Brackets in Thomasboro
According to the Thomasboro family income data, there are 84 families falling into the $100,000 to $149,999 income range, which is the most common income bracket and makes up 28.6% of all families. Conversely, the $10,000 to $14,999 income bracket is the least frequent group with only 3 families (1.0%) belonging to this category.
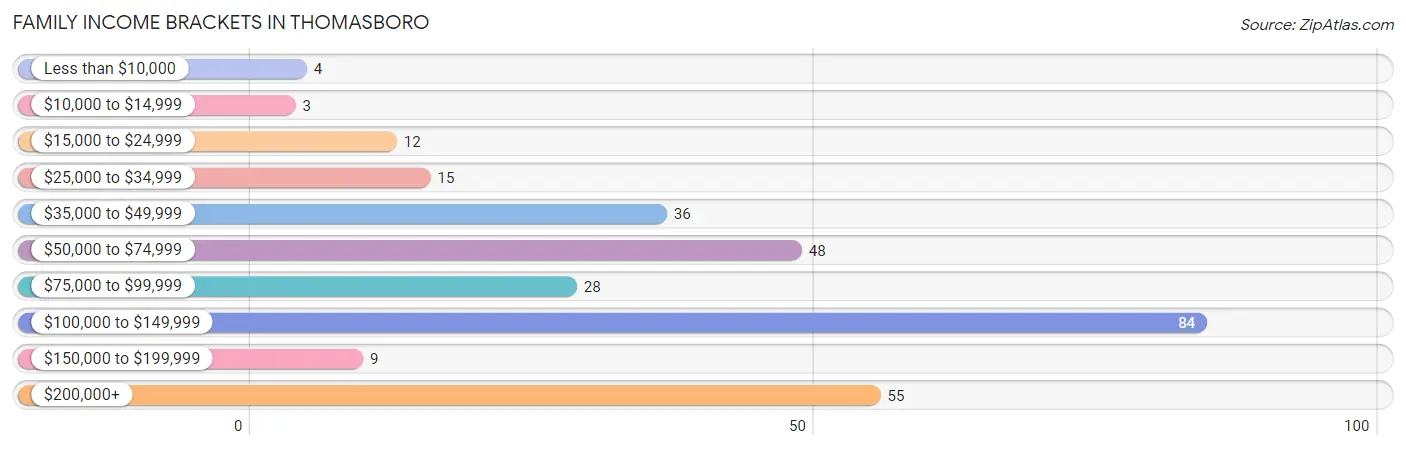
| Income Bracket | # Families | % Families |
| Less than $10,000 | 4 | 1.4% |
| $10,000 to $14,999 | 3 | 1.0% |
| $15,000 to $24,999 | 12 | 4.1% |
| $25,000 to $34,999 | 15 | 5.1% |
| $35,000 to $49,999 | 36 | 12.2% |
| $50,000 to $74,999 | 48 | 16.3% |
| $75,000 to $99,999 | 28 | 9.5% |
| $100,000 to $149,999 | 84 | 28.6% |
| $150,000 to $199,999 | 9 | 3.1% |
| $200,000+ | 55 | 18.7% |
Family Income by Famaliy Size in Thomasboro
5-person families (8 | 2.7%) account for the highest median family income in Thomasboro with $126,250 per family, while 2-person families (182 | 61.9%) have the highest median income of $51,666 per family member.
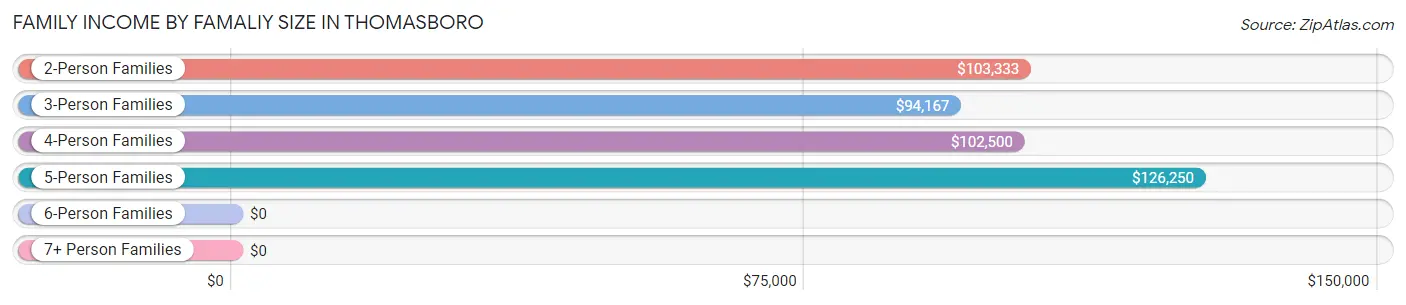
| Income Bracket | # Families | Median Income |
| 2-Person Families | 182 (61.9%) | $103,333 |
| 3-Person Families | 78 (26.5%) | $94,167 |
| 4-Person Families | 26 (8.8%) | $102,500 |
| 5-Person Families | 8 (2.7%) | $126,250 |
| 6-Person Families | 0 (0.0%) | $0 |
| 7+ Person Families | 0 (0.0%) | $0 |
| Total | 294 (100.0%) | $100,500 |
Family Income by Number of Earners in Thomasboro
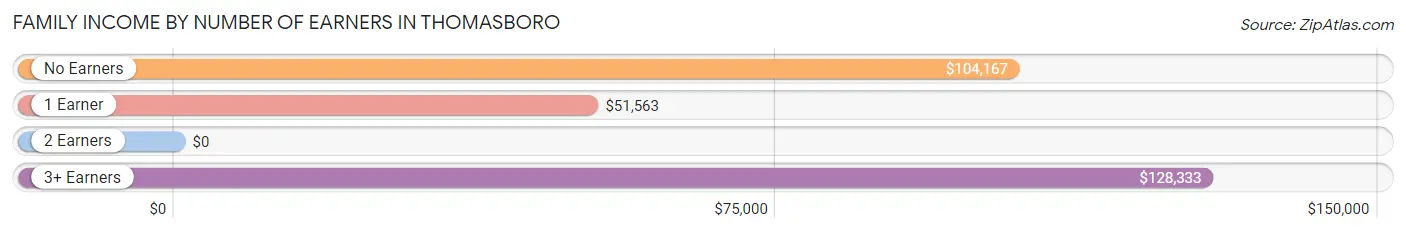
| Number of Earners | # Families | Median Income |
| No Earners | 54 (18.4%) | $104,167 |
| 1 Earner | 91 (30.9%) | $51,563 |
| 2 Earners | 119 (40.5%) | $0 |
| 3+ Earners | 30 (10.2%) | $128,333 |
| Total | 294 (100.0%) | $100,500 |
Household Income in Thomasboro
Household Income Brackets in Thomasboro
With 90 households falling in the category, the $100,000 to $149,999 income range is the most frequent in Thomasboro, accounting for 19.4% of all households. In contrast, only 9 households (1.9%) fall into the $150,000 to $199,999 income bracket, making it the least populous group.
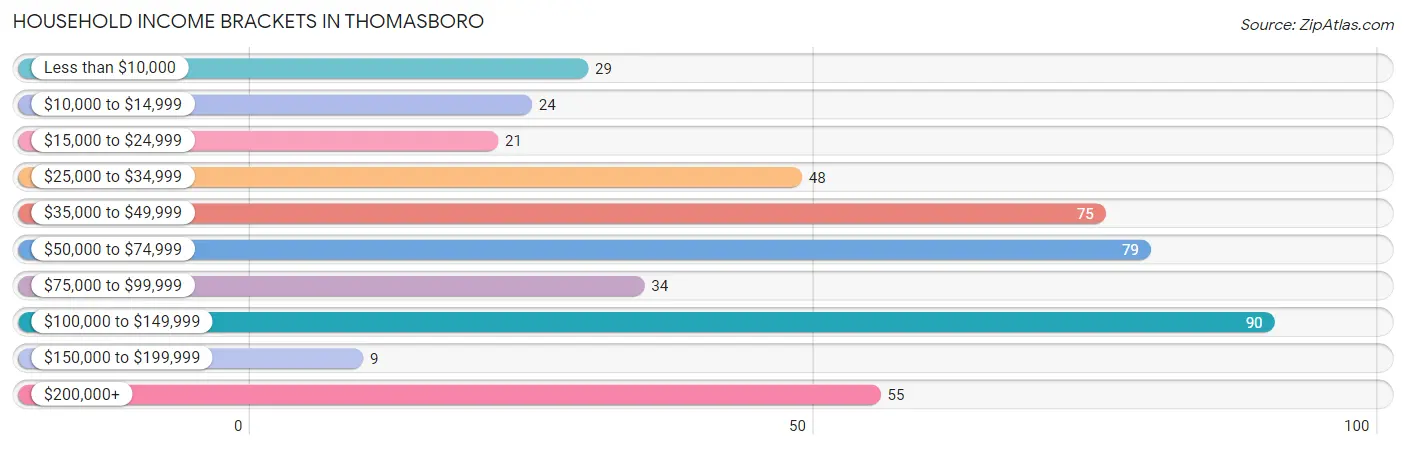
| Income Bracket | # Households | % Households |
| Less than $10,000 | 29 | 6.3% |
| $10,000 to $14,999 | 24 | 5.2% |
| $15,000 to $24,999 | 21 | 4.5% |
| $25,000 to $34,999 | 48 | 10.3% |
| $35,000 to $49,999 | 75 | 16.2% |
| $50,000 to $74,999 | 79 | 17.0% |
| $75,000 to $99,999 | 34 | 7.3% |
| $100,000 to $149,999 | 90 | 19.4% |
| $150,000 to $199,999 | 9 | 1.9% |
| $200,000+ | 55 | 11.9% |
Household Income by Householder Age in Thomasboro
The median household income in Thomasboro is $60,833, with the highest median household income of $72,917 found in the 45 to 64 years age bracket for the primary householder. A total of 187 households (40.3%) fall into this category. Meanwhile, the 15 to 24 years age bracket for the primary householder has the lowest median household income of $0, with 15 households (3.2%) in this group.
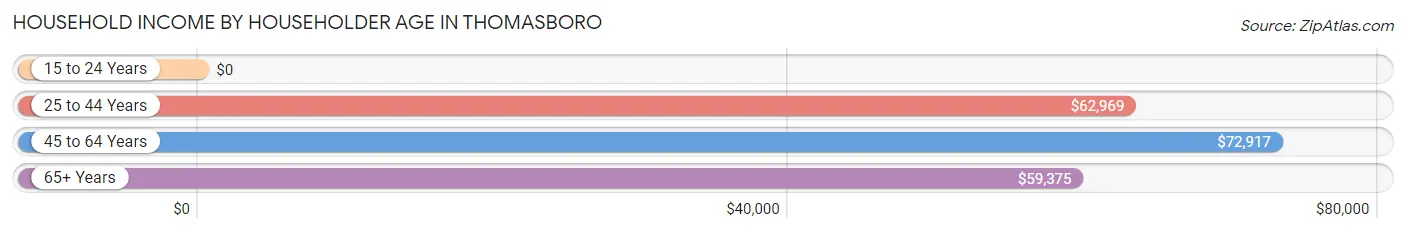
| Income Bracket | # Households | Median Income |
| 15 to 24 Years | 15 (3.2%) | $0 |
| 25 to 44 Years | 121 (26.1%) | $62,969 |
| 45 to 64 Years | 187 (40.3%) | $72,917 |
| 65+ Years | 141 (30.4%) | $59,375 |
| Total | 464 (100.0%) | $60,833 |
Poverty in Thomasboro
Income Below Poverty by Sex and Age in Thomasboro
With 8.8% poverty level for males and 12.1% for females among the residents of Thomasboro, under 5 year old males and 5 year old females are the most vulnerable to poverty, with 6 males (18.2%) and 4 females (100.0%) in their respective age groups living below the poverty level.
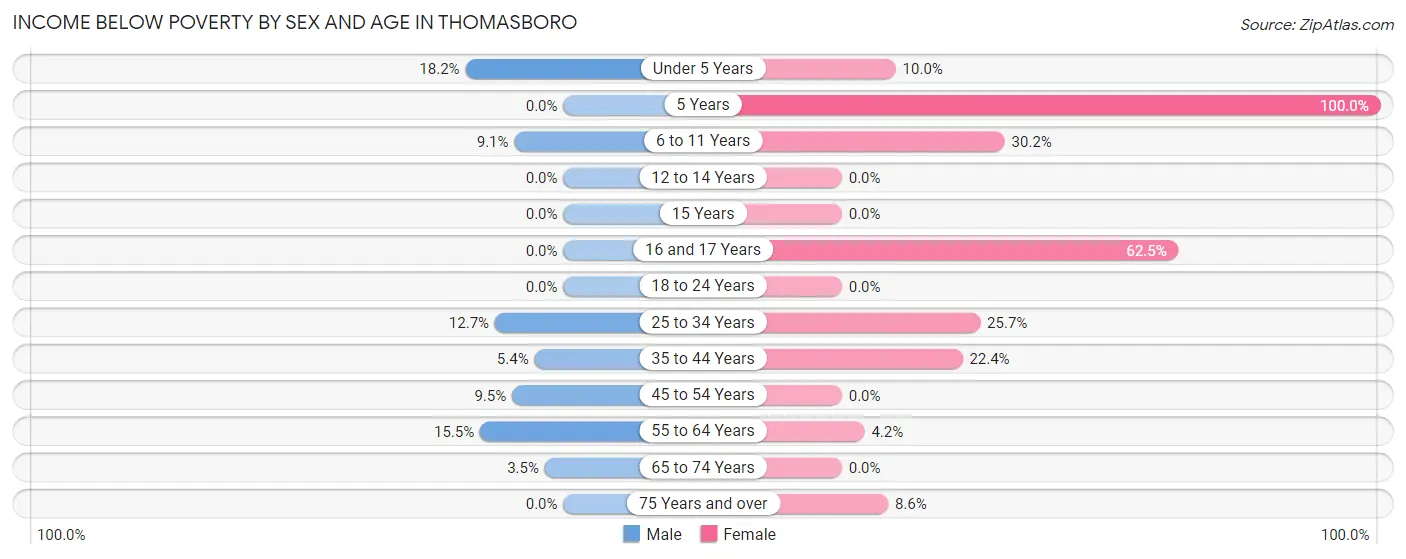
| Age Bracket | Male | Female |
| Under 5 Years | 6 (18.2%) | 2 (10.0%) |
| 5 Years | 0 (0.0%) | 4 (100.0%) |
| 6 to 11 Years | 3 (9.1%) | 13 (30.2%) |
| 12 to 14 Years | 0 (0.0%) | 0 (0.0%) |
| 15 Years | 0 (0.0%) | 0 (0.0%) |
| 16 and 17 Years | 0 (0.0%) | 5 (62.5%) |
| 18 to 24 Years | 0 (0.0%) | 0 (0.0%) |
| 25 to 34 Years | 8 (12.7%) | 19 (25.7%) |
| 35 to 44 Years | 3 (5.4%) | 15 (22.4%) |
| 45 to 54 Years | 6 (9.5%) | 0 (0.0%) |
| 55 to 64 Years | 15 (15.5%) | 4 (4.2%) |
| 65 to 74 Years | 2 (3.5%) | 0 (0.0%) |
| 75 Years and over | 0 (0.0%) | 3 (8.6%) |
| Total | 43 (8.8%) | 65 (12.1%) |
Income Above Poverty by Sex and Age in Thomasboro
According to the poverty statistics in Thomasboro, males aged 5 years and females aged 12 to 14 years are the age groups that are most secure financially, with 100.0% of males and 100.0% of females in these age groups living above the poverty line.
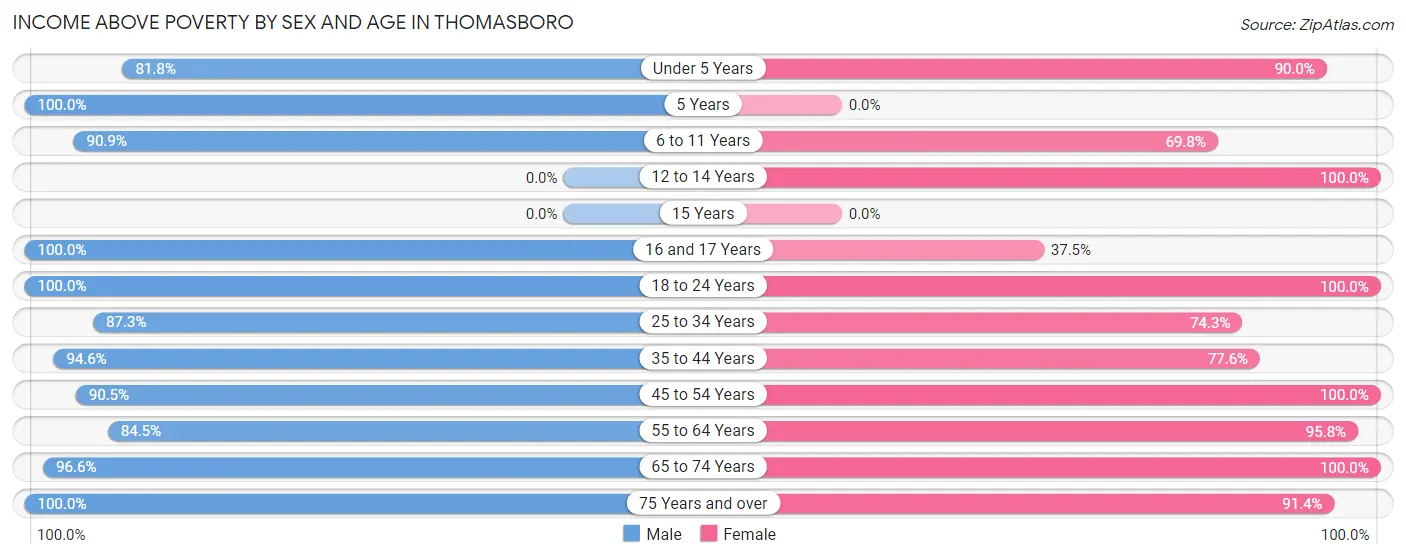
| Age Bracket | Male | Female |
| Under 5 Years | 27 (81.8%) | 18 (90.0%) |
| 5 Years | 5 (100.0%) | 0 (0.0%) |
| 6 to 11 Years | 30 (90.9%) | 30 (69.8%) |
| 12 to 14 Years | 0 (0.0%) | 15 (100.0%) |
| 15 Years | 0 (0.0%) | 0 (0.0%) |
| 16 and 17 Years | 14 (100.0%) | 3 (37.5%) |
| 18 to 24 Years | 32 (100.0%) | 28 (100.0%) |
| 25 to 34 Years | 55 (87.3%) | 55 (74.3%) |
| 35 to 44 Years | 53 (94.6%) | 52 (77.6%) |
| 45 to 54 Years | 57 (90.5%) | 66 (100.0%) |
| 55 to 64 Years | 82 (84.5%) | 91 (95.8%) |
| 65 to 74 Years | 56 (96.6%) | 80 (100.0%) |
| 75 Years and over | 34 (100.0%) | 32 (91.4%) |
| Total | 445 (91.2%) | 470 (87.8%) |
Income Below Poverty Among Married-Couple Families in Thomasboro
The poverty statistics for married-couple families in Thomasboro show that 0.9% or 2 of the total 225 families live below the poverty line. Families with 1 or 2 children have the highest poverty rate of 3.7%, comprising of 2 families. On the other hand, families with no children have the lowest poverty rate of 0.0%, which includes 0 families.
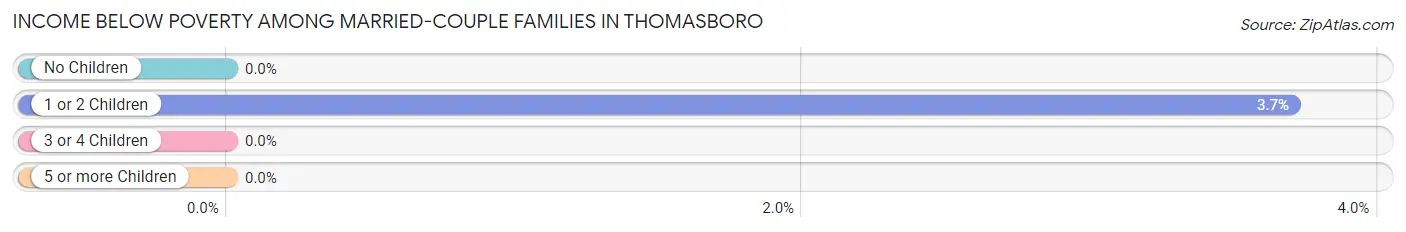
| Children | Above Poverty | Below Poverty |
| No Children | 165 (100.0%) | 0 (0.0%) |
| 1 or 2 Children | 52 (96.3%) | 2 (3.7%) |
| 3 or 4 Children | 6 (100.0%) | 0 (0.0%) |
| 5 or more Children | 0 (0.0%) | 0 (0.0%) |
| Total | 223 (99.1%) | 2 (0.9%) |
Income Below Poverty Among Single-Parent Households in Thomasboro
According to the poverty data in Thomasboro, 18.8% or 3 single-father households and 15.1% or 8 single-mother households are living below the poverty line. Among single-father households, those with 1 or 2 children have the highest poverty rate, with 3 households (50.0%) experiencing poverty. Likewise, among single-mother households, those with 3 or 4 children have the highest poverty rate, with 1 households (25.0%) falling below the poverty line.
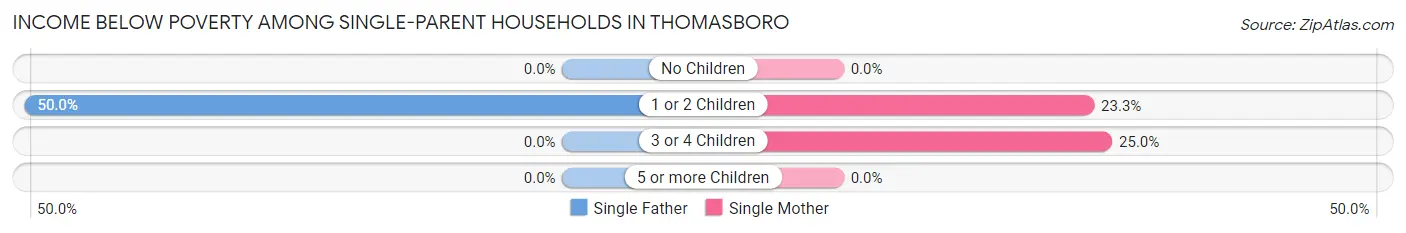
| Children | Single Father | Single Mother |
| No Children | 0 (0.0%) | 0 (0.0%) |
| 1 or 2 Children | 3 (50.0%) | 7 (23.3%) |
| 3 or 4 Children | 0 (0.0%) | 1 (25.0%) |
| 5 or more Children | 0 (0.0%) | 0 (0.0%) |
| Total | 3 (18.8%) | 8 (15.1%) |
Income Below Poverty Among Married-Couple vs Single-Parent Households in Thomasboro
The poverty data for Thomasboro shows that 2 of the married-couple family households (0.9%) and 11 of the single-parent households (15.9%) are living below the poverty level. Within the married-couple family households, those with 1 or 2 children have the highest poverty rate, with 2 households (3.7%) falling below the poverty line. Among the single-parent households, those with 1 or 2 children have the highest poverty rate, with 10 household (27.8%) living below poverty.
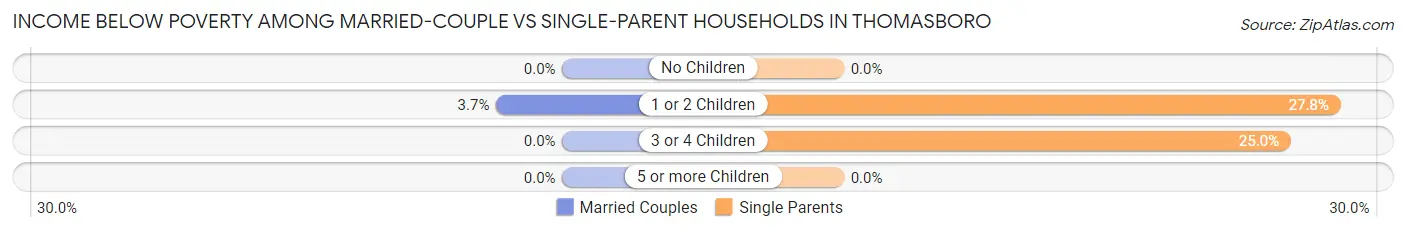
| Children | Married-Couple Families | Single-Parent Households |
| No Children | 0 (0.0%) | 0 (0.0%) |
| 1 or 2 Children | 2 (3.7%) | 10 (27.8%) |
| 3 or 4 Children | 0 (0.0%) | 1 (25.0%) |
| 5 or more Children | 0 (0.0%) | 0 (0.0%) |
| Total | 2 (0.9%) | 11 (15.9%) |
Race in Thomasboro
The most populous races in Thomasboro are White / Caucasian (919 | 89.8%), Two or more Races (54 | 5.3%), and Hispanic or Latino (50 | 4.9%).
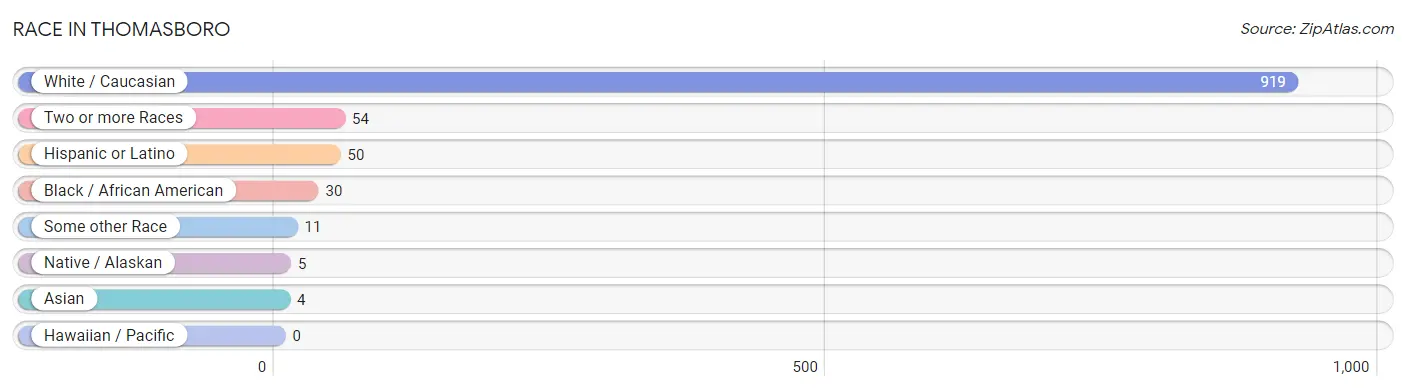
| Race | # Population | % Population |
| Asian | 4 | 0.4% |
| Black / African American | 30 | 2.9% |
| Hawaiian / Pacific | 0 | 0.0% |
| Hispanic or Latino | 50 | 4.9% |
| Native / Alaskan | 5 | 0.5% |
| White / Caucasian | 919 | 89.8% |
| Two or more Races | 54 | 5.3% |
| Some other Race | 11 | 1.1% |
| Total | 1,023 | 100.0% |
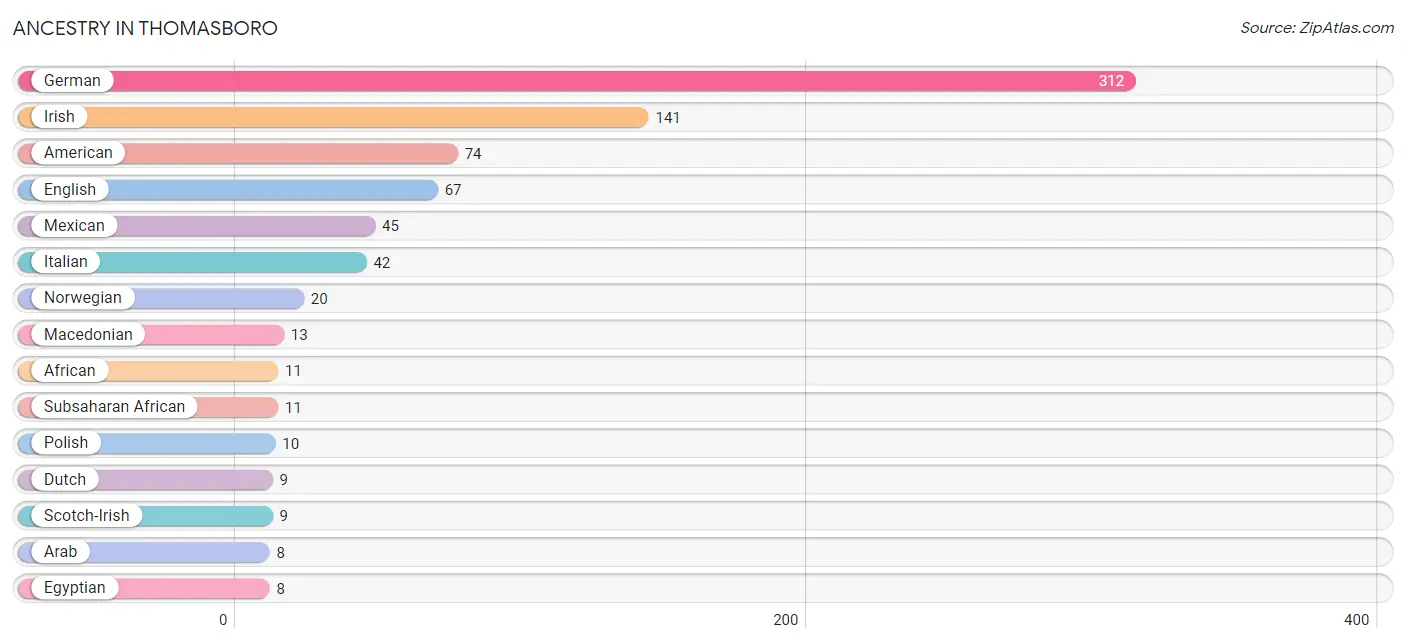
Ancestry in Thomasboro
The most populous ancestries reported in Thomasboro are German (312 | 30.5%), Irish (141 | 13.8%), American (74 | 7.2%), English (67 | 6.6%), and Mexican (45 | 4.4%), together accounting for 62.5% of all Thomasboro residents.
| Ancestry | # Population | % Population |
| African | 11 | 1.1% |
| American | 74 | 7.2% |
| Arab | 8 | 0.8% |
| Bhutanese | 5 | 0.5% |
| Brazilian | 5 | 0.5% |
| Cherokee | 3 | 0.3% |
| Czech | 5 | 0.5% |
| Dutch | 9 | 0.9% |
| Egyptian | 8 | 0.8% |
| English | 67 | 6.6% |
| French | 4 | 0.4% |
| French Canadian | 3 | 0.3% |
| German | 312 | 30.5% |
| Greek | 6 | 0.6% |
| Irish | 141 | 13.8% |
| Italian | 42 | 4.1% |
| Macedonian | 13 | 1.3% |
| Mexican | 45 | 4.4% |
| Mexican American Indian | 4 | 0.4% |
| Native Hawaiian | 5 | 0.5% |
| Norwegian | 20 | 2.0% |
| Polish | 10 | 1.0% |
| Puerto Rican | 5 | 0.5% |
| Russian | 7 | 0.7% |
| Scotch-Irish | 9 | 0.9% |
| Scottish | 3 | 0.3% |
| Slavic | 2 | 0.2% |
| Subsaharan African | 11 | 1.1% |
| Swedish | 7 | 0.7% |
| Welsh | 3 | 0.3% | View All 30 Rows |
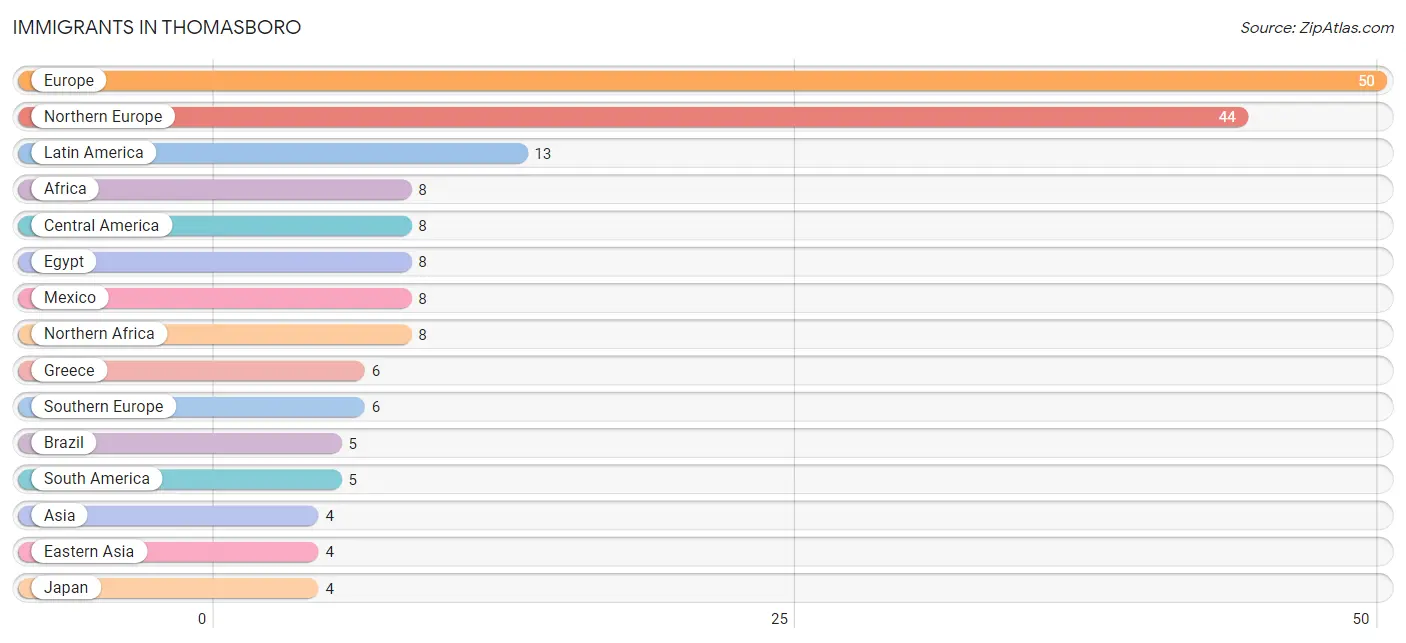
Immigrants in Thomasboro
The most numerous immigrant groups reported in Thomasboro came from Europe (50 | 4.9%), Northern Europe (44 | 4.3%), Latin America (13 | 1.3%), Africa (8 | 0.8%), and Central America (8 | 0.8%), together accounting for 12.0% of all Thomasboro residents.
| Immigration Origin | # Population | % Population |
| Africa | 8 | 0.8% |
| Asia | 4 | 0.4% |
| Brazil | 5 | 0.5% |
| Central America | 8 | 0.8% |
| Eastern Asia | 4 | 0.4% |
| Egypt | 8 | 0.8% |
| Europe | 50 | 4.9% |
| Greece | 6 | 0.6% |
| Japan | 4 | 0.4% |
| Latin America | 13 | 1.3% |
| Mexico | 8 | 0.8% |
| Northern Africa | 8 | 0.8% |
| Northern Europe | 44 | 4.3% |
| South America | 5 | 0.5% |
| Southern Europe | 6 | 0.6% | View All 15 Rows |
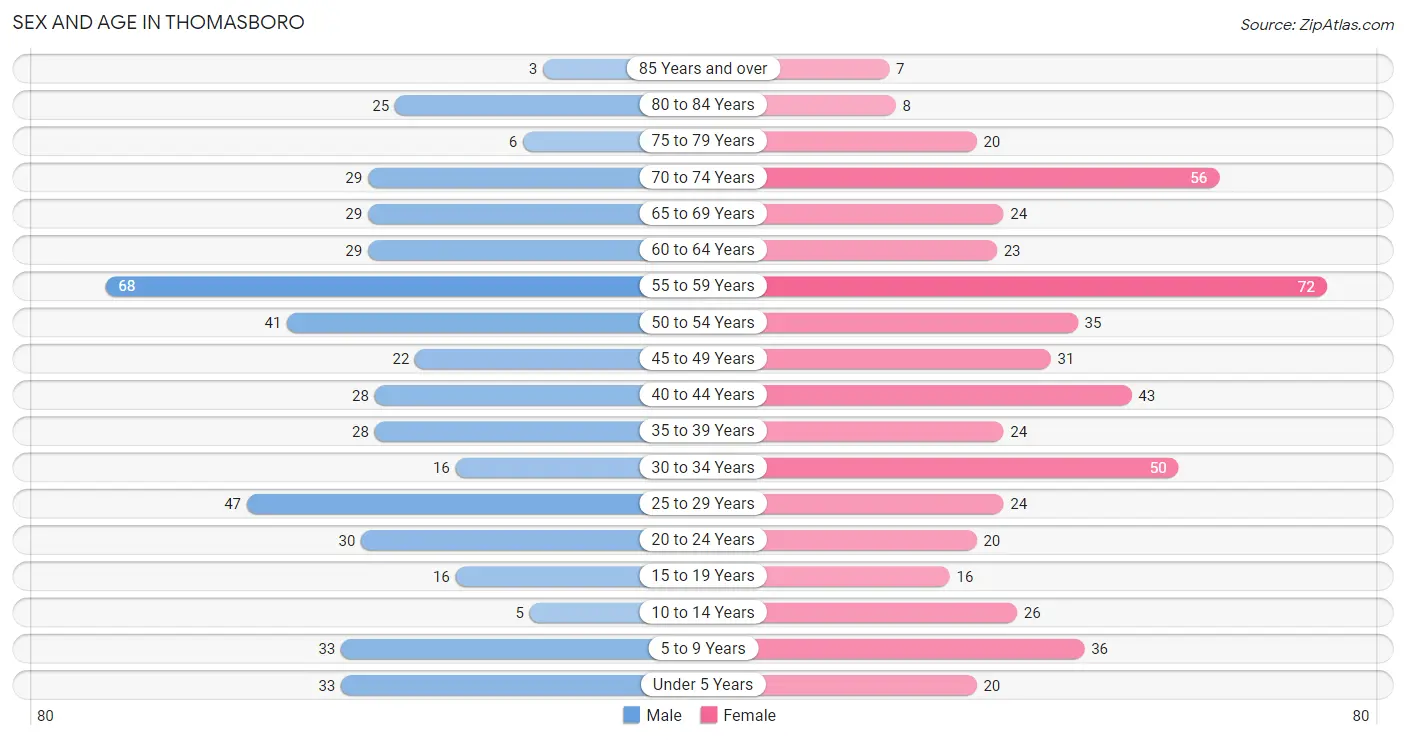
Sex and Age in Thomasboro
Sex and Age in Thomasboro
The most populous age groups in Thomasboro are 55 to 59 Years (68 | 13.9%) for men and 55 to 59 Years (72 | 13.5%) for women.
| Age Bracket | Male | Female |
| Under 5 Years | 33 (6.8%) | 20 (3.7%) |
| 5 to 9 Years | 33 (6.8%) | 36 (6.7%) |
| 10 to 14 Years | 5 (1.0%) | 26 (4.9%) |
| 15 to 19 Years | 16 (3.3%) | 16 (3.0%) |
| 20 to 24 Years | 30 (6.1%) | 20 (3.7%) |
| 25 to 29 Years | 47 (9.6%) | 24 (4.5%) |
| 30 to 34 Years | 16 (3.3%) | 50 (9.3%) |
| 35 to 39 Years | 28 (5.7%) | 24 (4.5%) |
| 40 to 44 Years | 28 (5.7%) | 43 (8.0%) |
| 45 to 49 Years | 22 (4.5%) | 31 (5.8%) |
| 50 to 54 Years | 41 (8.4%) | 35 (6.5%) |
| 55 to 59 Years | 68 (13.9%) | 72 (13.5%) |
| 60 to 64 Years | 29 (5.9%) | 23 (4.3%) |
| 65 to 69 Years | 29 (5.9%) | 24 (4.5%) |
| 70 to 74 Years | 29 (5.9%) | 56 (10.5%) |
| 75 to 79 Years | 6 (1.2%) | 20 (3.7%) |
| 80 to 84 Years | 25 (5.1%) | 8 (1.5%) |
| 85 Years and over | 3 (0.6%) | 7 (1.3%) |
| Total | 488 (100.0%) | 535 (100.0%) |
Families and Households in Thomasboro
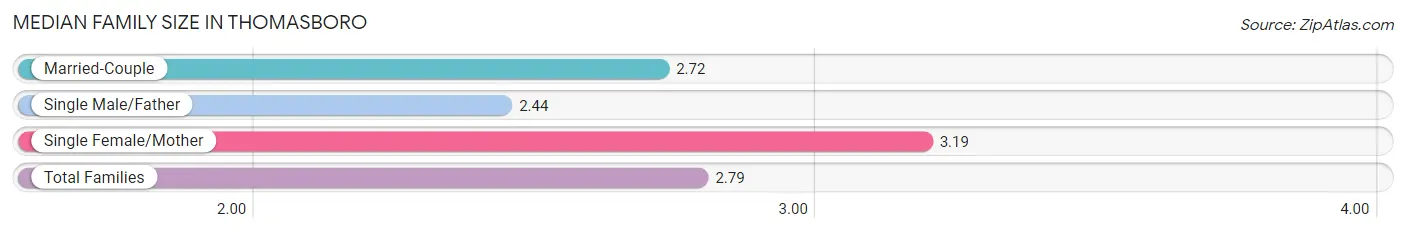
Median Family Size in Thomasboro
The median family size in Thomasboro is 2.79 persons per family, with single female/mother families (53 | 18.0%) accounting for the largest median family size of 3.19 persons per family. On the other hand, single male/father families (16 | 5.4%) represent the smallest median family size with 2.44 persons per family.
| Family Type | # Families | Family Size |
| Married-Couple | 225 (76.5%) | 2.72 |
| Single Male/Father | 16 (5.4%) | 2.44 |
| Single Female/Mother | 53 (18.0%) | 3.19 |
| Total Families | 294 (100.0%) | 2.79 |
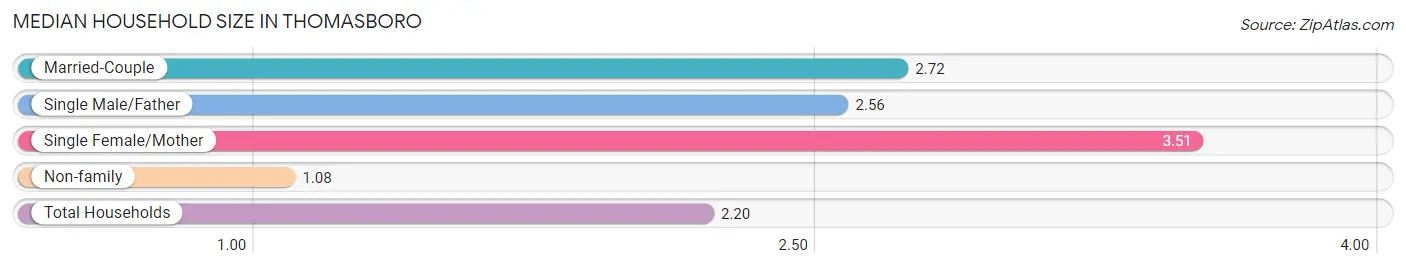
Median Household Size in Thomasboro
The median household size in Thomasboro is 2.20 persons per household, with single female/mother households (53 | 11.4%) accounting for the largest median household size of 3.51 persons per household. non-family households (170 | 36.6%) represent the smallest median household size with 1.08 persons per household.
| Household Type | # Households | Household Size |
| Married-Couple | 225 (48.5%) | 2.72 |
| Single Male/Father | 16 (3.5%) | 2.56 |
| Single Female/Mother | 53 (11.4%) | 3.51 |
| Non-family | 170 (36.6%) | 1.08 |
| Total Households | 464 (100.0%) | 2.20 |
Household Size by Marriage Status in Thomasboro
Out of a total of 464 households in Thomasboro, 294 (63.4%) are family households, while 170 (36.6%) are nonfamily households. The most numerous type of family households are 2-person households, comprising 167, and the most common type of nonfamily households are 1-person households, comprising 161.
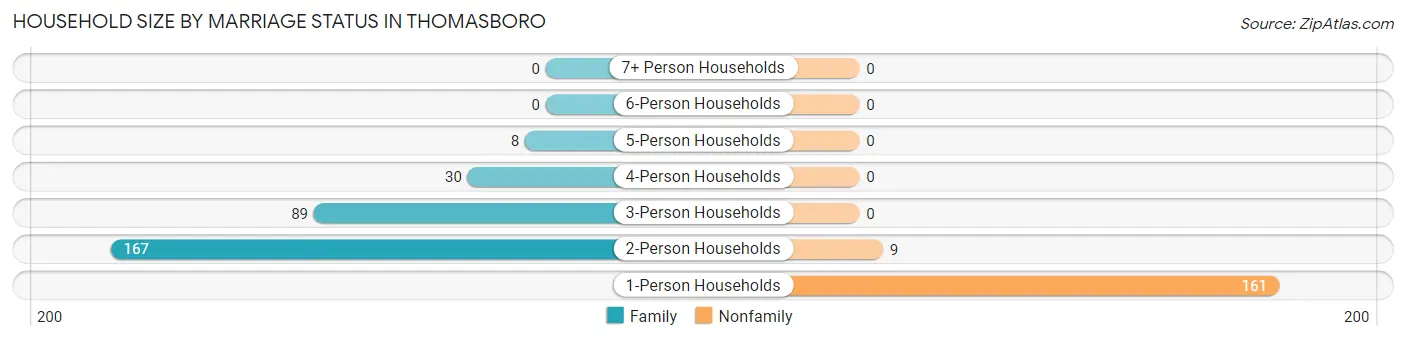
| Household Size | Family Households | Nonfamily Households |
| 1-Person Households | - | 161 (34.7%) |
| 2-Person Households | 167 (36.0%) | 9 (1.9%) |
| 3-Person Households | 89 (19.2%) | 0 (0.0%) |
| 4-Person Households | 30 (6.5%) | 0 (0.0%) |
| 5-Person Households | 8 (1.7%) | 0 (0.0%) |
| 6-Person Households | 0 (0.0%) | 0 (0.0%) |
| 7+ Person Households | 0 (0.0%) | 0 (0.0%) |
| Total | 294 (63.4%) | 170 (36.6%) |
Female Fertility in Thomasboro
Fertility by Age in Thomasboro
Average fertility rate in Thomasboro is 27.0 births per 1,000 women. Women in the age bracket of 20 to 34 years have the highest fertility rate with 64.0 births per 1,000 women. Women in the age bracket of 20 to 34 years acount for 100.0% of all women with births.
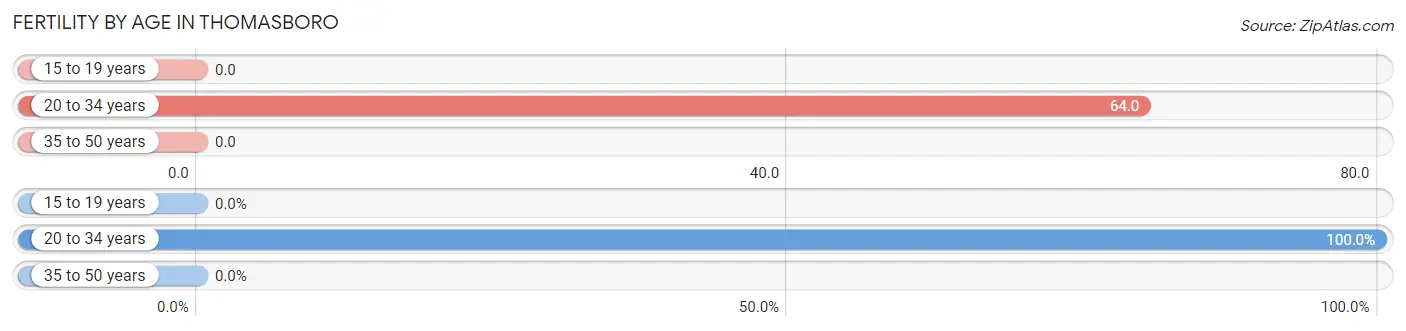
| Age Bracket | Women with Births | Births / 1,000 Women |
| 15 to 19 years | 0 (0.0%) | 0.0 |
| 20 to 34 years | 6 (100.0%) | 64.0 |
| 35 to 50 years | 0 (0.0%) | 0.0 |
| Total | 6 (100.0%) | 27.0 |
Fertility by Age by Marriage Status in Thomasboro
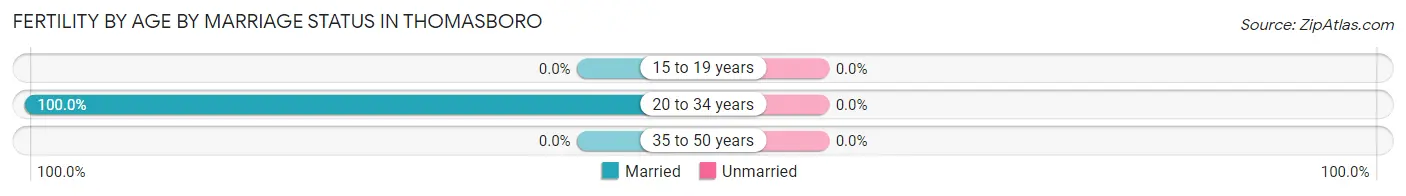
| Age Bracket | Married | Unmarried |
| 15 to 19 years | 0 (0.0%) | 0 (0.0%) |
| 20 to 34 years | 6 (100.0%) | 0 (0.0%) |
| 35 to 50 years | 0 (0.0%) | 0 (0.0%) |
| Total | 6 (100.0%) | 0 (0.0%) |
Fertility by Education in Thomasboro
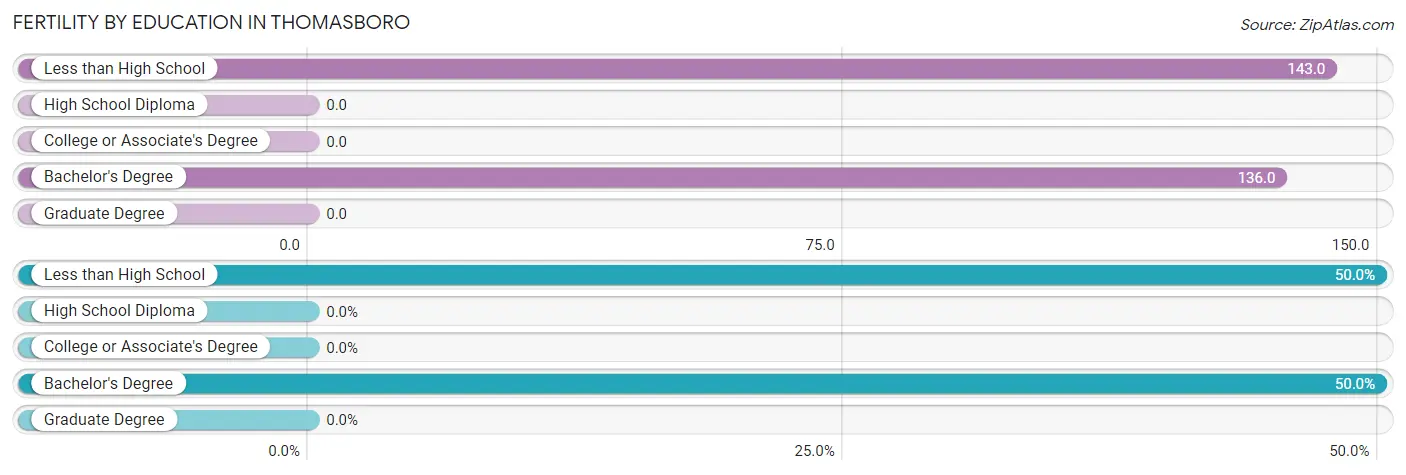
| Educational Attainment | Women with Births | Births / 1,000 Women |
| Less than High School | 3 (50.0%) | 143.0 |
| High School Diploma | 0 (0.0%) | 0.0 |
| College or Associate's Degree | 0 (0.0%) | 0.0 |
| Bachelor's Degree | 3 (50.0%) | 136.0 |
| Graduate Degree | 0 (0.0%) | 0.0 |
| Total | 6 (100.0%) | 27.0 |
Fertility by Education by Marriage Status in Thomasboro
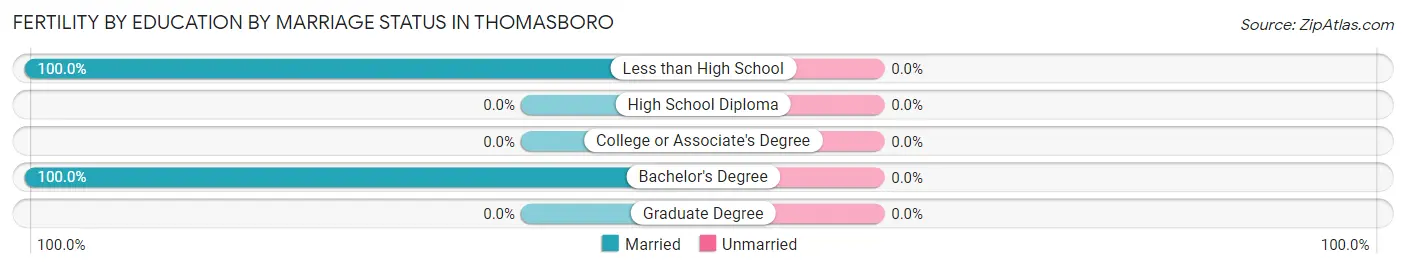
| Educational Attainment | Married | Unmarried |
| Less than High School | 3 (100.0%) | 0 (0.0%) |
| High School Diploma | 0 (0.0%) | 0 (0.0%) |
| College or Associate's Degree | 0 (0.0%) | 0 (0.0%) |
| Bachelor's Degree | 3 (100.0%) | 0 (0.0%) |
| Graduate Degree | 0 (0.0%) | 0 (0.0%) |
| Total | 6 (100.0%) | 0 (0.0%) |
Employment Characteristics in Thomasboro
Employment by Class of Employer in Thomasboro
Among the 507 employed individuals in Thomasboro, private company employees (325 | 64.1%), state government employees (118 | 23.3%), and not-for-profit organizations (21 | 4.1%) make up the most common classes of employment.
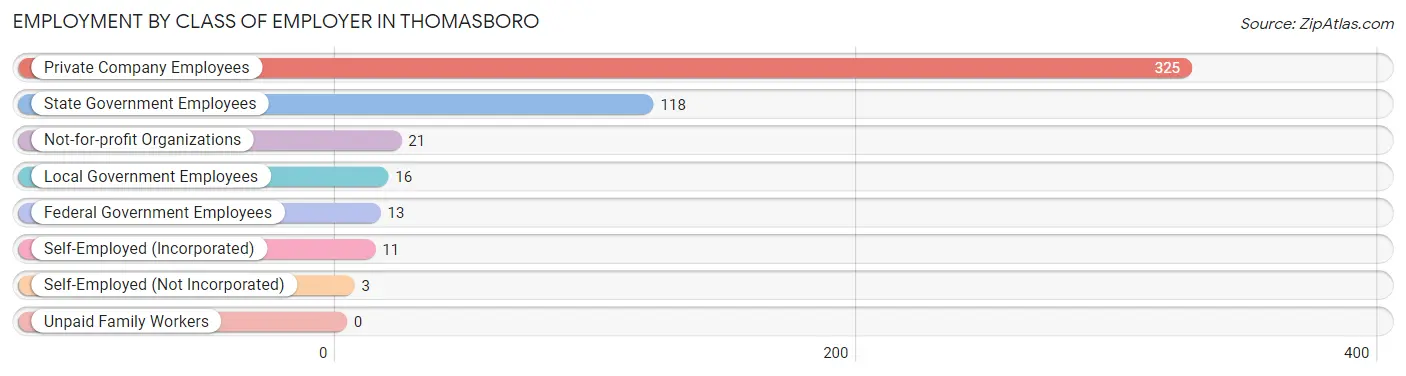
| Employer Class | # Employees | % Employees |
| Private Company Employees | 325 | 64.1% |
| Self-Employed (Incorporated) | 11 | 2.2% |
| Self-Employed (Not Incorporated) | 3 | 0.6% |
| Not-for-profit Organizations | 21 | 4.1% |
| Local Government Employees | 16 | 3.2% |
| State Government Employees | 118 | 23.3% |
| Federal Government Employees | 13 | 2.6% |
| Unpaid Family Workers | 0 | 0.0% |
| Total | 507 | 100.0% |
Employment Status by Age in Thomasboro
According to the labor force statistics for Thomasboro, out of the total population over 16 years of age (870), 62.8% or 546 individuals are in the labor force, with 4.1% or 22 of them unemployed. The age group with the highest labor force participation rate is 20 to 24 years, with 100.0% or 50 individuals in the labor force. Within the labor force, the 16 to 19 years age range has the highest percentage of unemployed individuals, with 23.1% or 3 of them being unemployed.
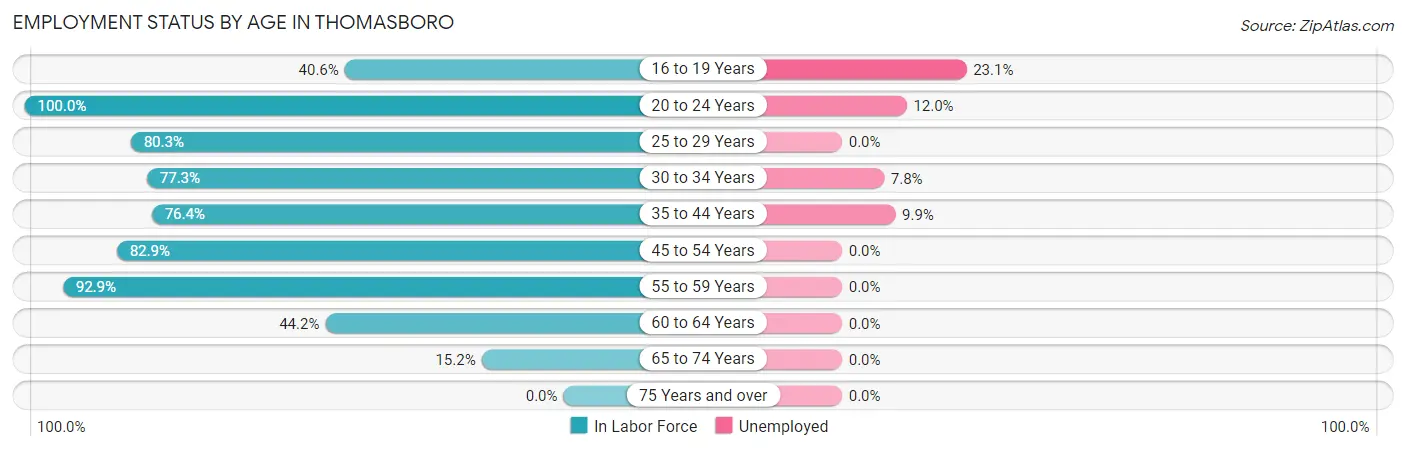
| Age Bracket | In Labor Force | Unemployed |
| 16 to 19 Years | 13 (40.6%) | 3 (23.1%) |
| 20 to 24 Years | 50 (100.0%) | 6 (12.0%) |
| 25 to 29 Years | 57 (80.3%) | 0 (0.0%) |
| 30 to 34 Years | 51 (77.3%) | 4 (7.8%) |
| 35 to 44 Years | 94 (76.4%) | 9 (9.9%) |
| 45 to 54 Years | 107 (82.9%) | 0 (0.0%) |
| 55 to 59 Years | 130 (92.9%) | 0 (0.0%) |
| 60 to 64 Years | 23 (44.2%) | 0 (0.0%) |
| 65 to 74 Years | 21 (15.2%) | 0 (0.0%) |
| 75 Years and over | 0 (0.0%) | 0 (0.0%) |
| Total | 546 (62.8%) | 22 (4.1%) |
Employment Status by Educational Attainment in Thomasboro
According to labor force statistics for Thomasboro, 79.5% of individuals (462) out of the total population between 25 and 64 years of age (581) are in the labor force, with 2.8% or 13 of them being unemployed. The group with the highest labor force participation rate are those with the educational attainment of bachelor's degree or higher, with 97.5% or 116 individuals in the labor force. Within the labor force, individuals with college / associate degree education have the highest percentage of unemployment, with 7.4% or 13 of them being unemployed.
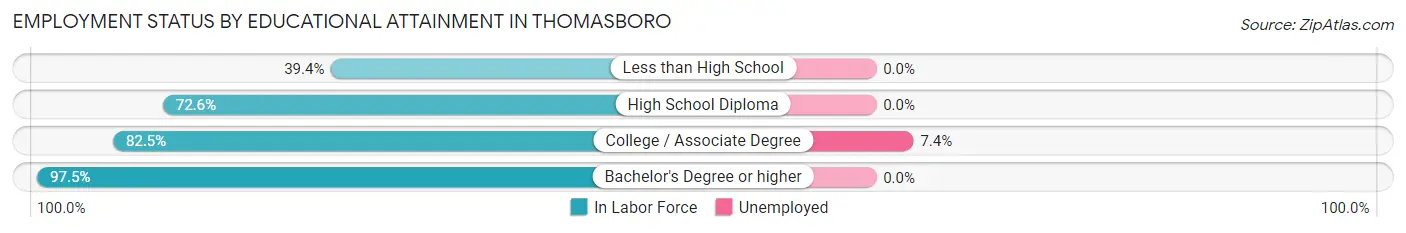
| Educational Attainment | In Labor Force | Unemployed |
| Less than High School | 13 (39.4%) | 0 (0.0%) |
| High School Diploma | 154 (72.6%) | 0 (0.0%) |
| College / Associate Degree | 179 (82.5%) | 16 (7.4%) |
| Bachelor's Degree or higher | 116 (97.5%) | 0 (0.0%) |
| Total | 462 (79.5%) | 16 (2.8%) |
Employment Occupations by Sex in Thomasboro
Management, Business, Science and Arts Occupations
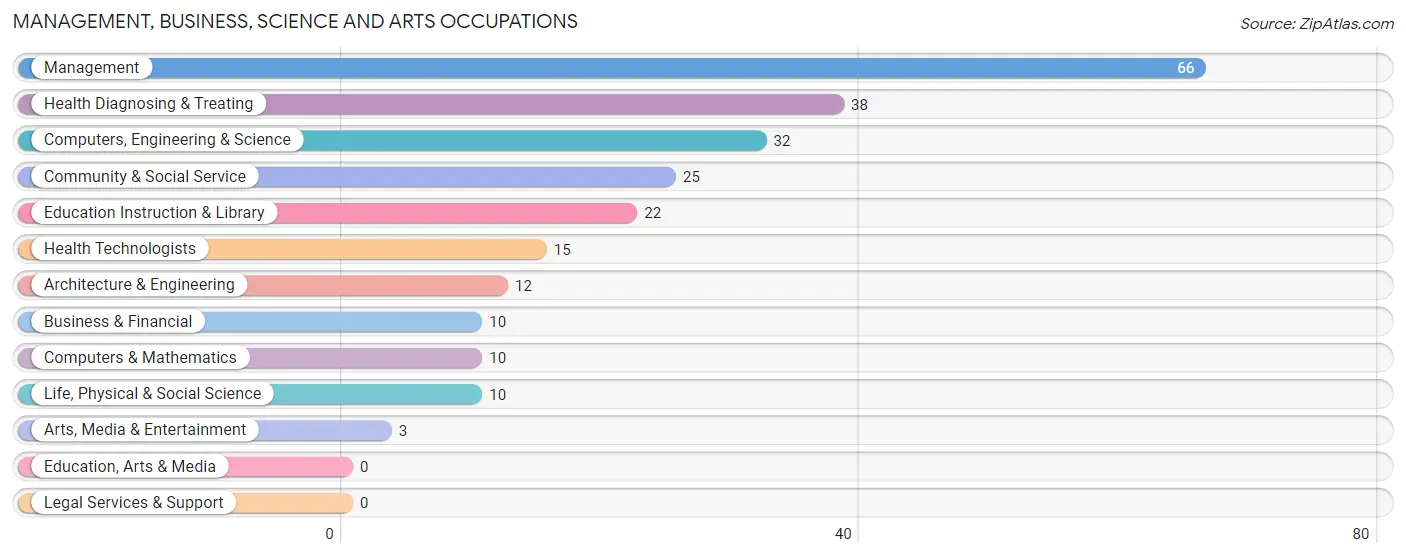
The most common Management, Business, Science and Arts occupations in Thomasboro are Management (66 | 12.7%), Health Diagnosing & Treating (38 | 7.3%), Computers, Engineering & Science (32 | 6.1%), Community & Social Service (25 | 4.8%), and Education Instruction & Library (22 | 4.2%).
Management, Business, Science and Arts Occupations by Sex
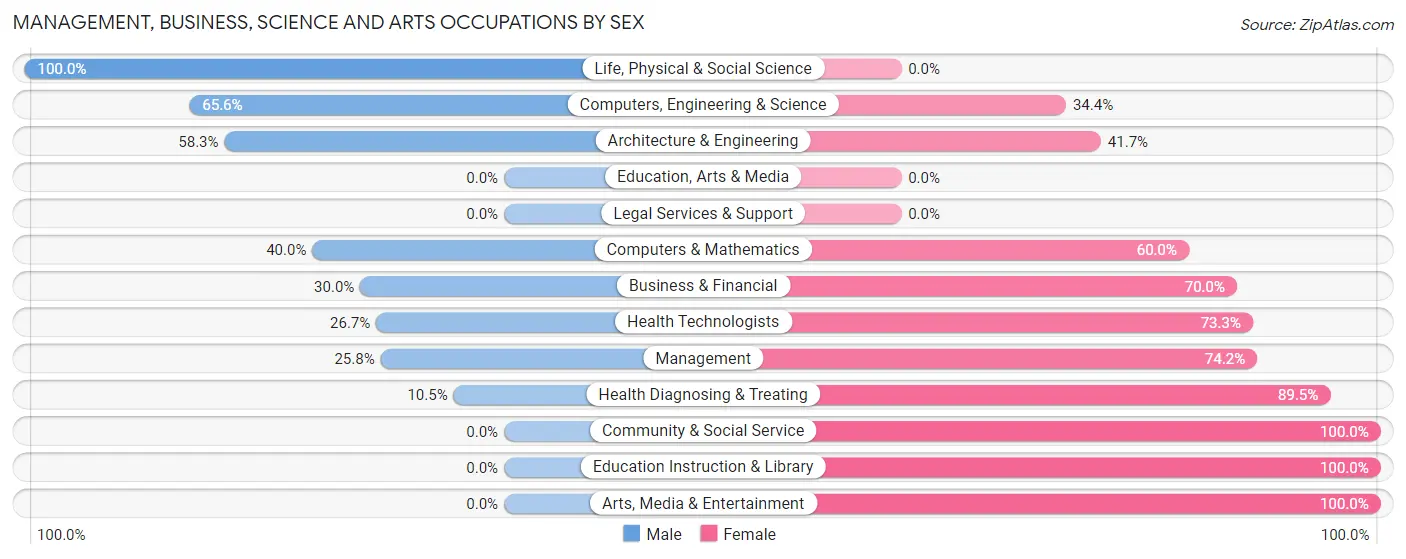
Within the Management, Business, Science and Arts occupations in Thomasboro, the most male-oriented occupations are Life, Physical & Social Science (100.0%), Computers, Engineering & Science (65.6%), and Architecture & Engineering (58.3%), while the most female-oriented occupations are Community & Social Service (100.0%), Education Instruction & Library (100.0%), and Arts, Media & Entertainment (100.0%).
| Occupation | Male | Female |
| Management | 17 (25.8%) | 49 (74.2%) |
| Business & Financial | 3 (30.0%) | 7 (70.0%) |
| Computers, Engineering & Science | 21 (65.6%) | 11 (34.4%) |
| Computers & Mathematics | 4 (40.0%) | 6 (60.0%) |
| Architecture & Engineering | 7 (58.3%) | 5 (41.7%) |
| Life, Physical & Social Science | 10 (100.0%) | 0 (0.0%) |
| Community & Social Service | 0 (0.0%) | 25 (100.0%) |
| Education, Arts & Media | 0 (0.0%) | 0 (0.0%) |
| Legal Services & Support | 0 (0.0%) | 0 (0.0%) |
| Education Instruction & Library | 0 (0.0%) | 22 (100.0%) |
| Arts, Media & Entertainment | 0 (0.0%) | 3 (100.0%) |
| Health Diagnosing & Treating | 4 (10.5%) | 34 (89.5%) |
| Health Technologists | 4 (26.7%) | 11 (73.3%) |
| Total (Category) | 45 (26.3%) | 126 (73.7%) |
| Total (Overall) | 271 (52.0%) | 250 (48.0%) |
Services Occupations
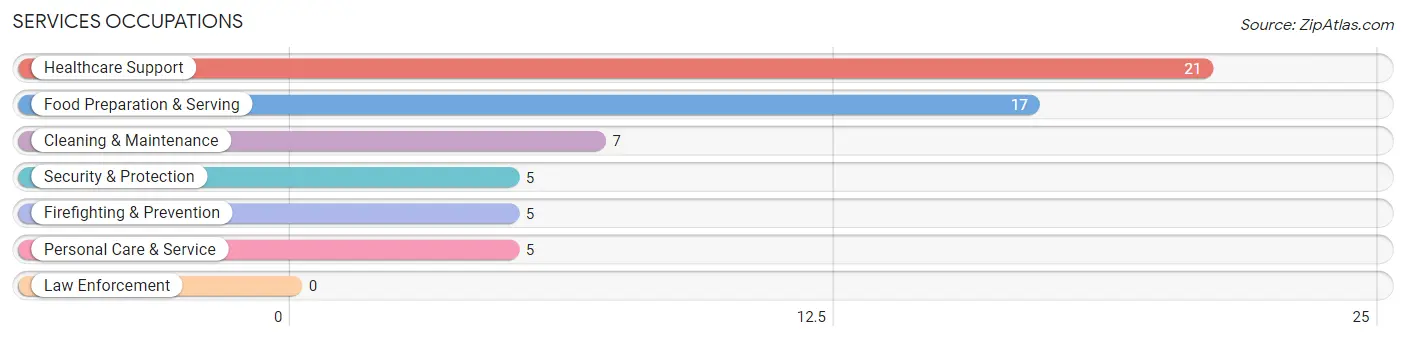
The most common Services occupations in Thomasboro are Healthcare Support (21 | 4.0%), Food Preparation & Serving (17 | 3.3%), Cleaning & Maintenance (7 | 1.3%), Security & Protection (5 | 1.0%), and Firefighting & Prevention (5 | 1.0%).
Services Occupations by Sex
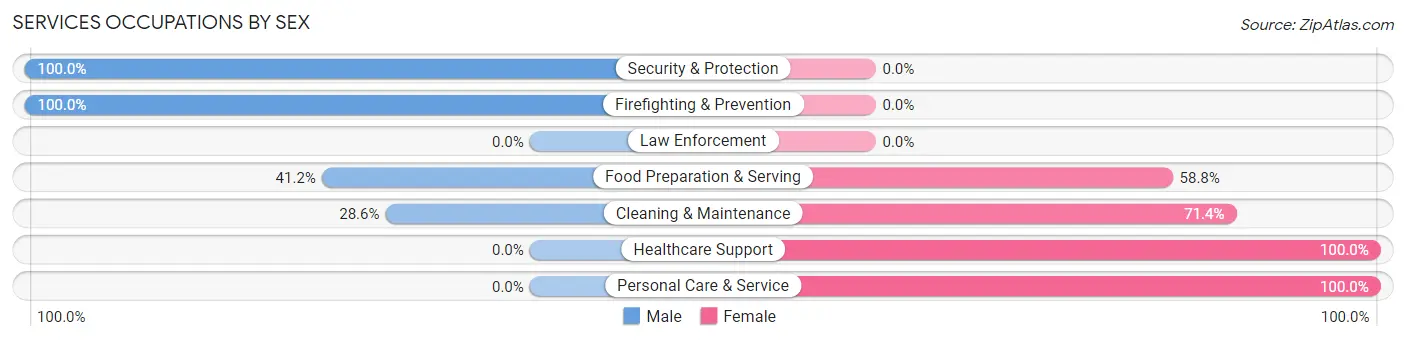
Within the Services occupations in Thomasboro, the most male-oriented occupations are Security & Protection (100.0%), Firefighting & Prevention (100.0%), and Food Preparation & Serving (41.2%), while the most female-oriented occupations are Healthcare Support (100.0%), Personal Care & Service (100.0%), and Cleaning & Maintenance (71.4%).
| Occupation | Male | Female |
| Healthcare Support | 0 (0.0%) | 21 (100.0%) |
| Security & Protection | 5 (100.0%) | 0 (0.0%) |
| Firefighting & Prevention | 5 (100.0%) | 0 (0.0%) |
| Law Enforcement | 0 (0.0%) | 0 (0.0%) |
| Food Preparation & Serving | 7 (41.2%) | 10 (58.8%) |
| Cleaning & Maintenance | 2 (28.6%) | 5 (71.4%) |
| Personal Care & Service | 0 (0.0%) | 5 (100.0%) |
| Total (Category) | 14 (25.5%) | 41 (74.6%) |
| Total (Overall) | 271 (52.0%) | 250 (48.0%) |
Sales and Office Occupations
The most common Sales and Office occupations in Thomasboro are Sales & Related (73 | 14.0%), and Office & Administration (51 | 9.8%).
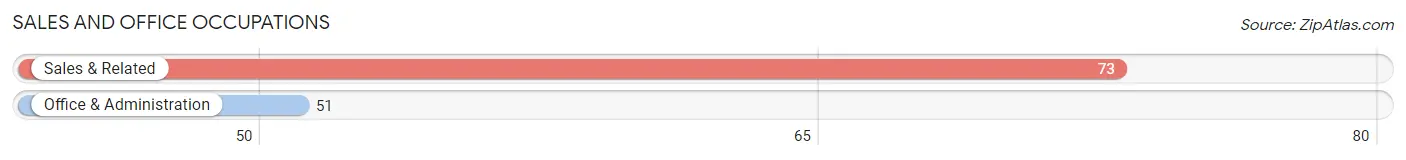
Sales and Office Occupations by Sex
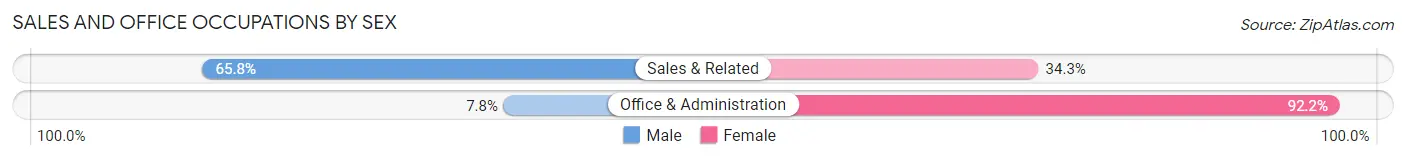
| Occupation | Male | Female |
| Sales & Related | 48 (65.7%) | 25 (34.3%) |
| Office & Administration | 4 (7.8%) | 47 (92.2%) |
| Total (Category) | 52 (41.9%) | 72 (58.1%) |
| Total (Overall) | 271 (52.0%) | 250 (48.0%) |
Natural Resources, Construction and Maintenance Occupations
The most common Natural Resources, Construction and Maintenance occupations in Thomasboro are Installation, Maintenance & Repair (64 | 12.3%), and Construction & Extraction (38 | 7.3%).
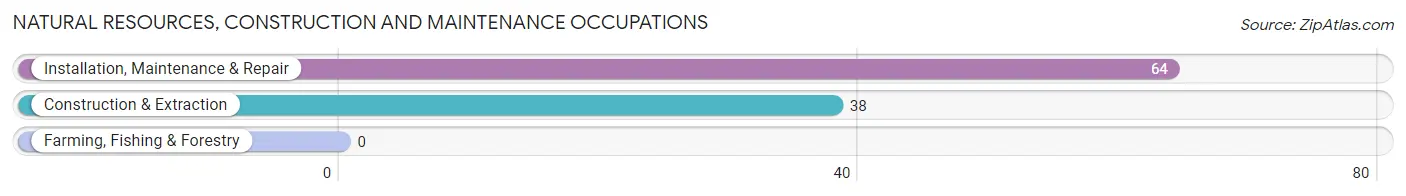
Natural Resources, Construction and Maintenance Occupations by Sex
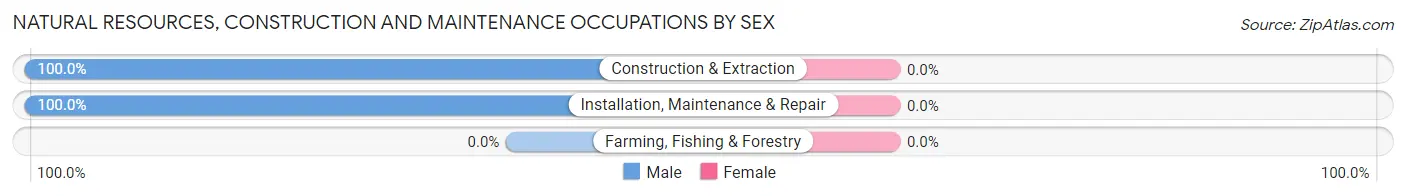
| Occupation | Male | Female |
| Farming, Fishing & Forestry | 0 (0.0%) | 0 (0.0%) |
| Construction & Extraction | 38 (100.0%) | 0 (0.0%) |
| Installation, Maintenance & Repair | 64 (100.0%) | 0 (0.0%) |
| Total (Category) | 102 (100.0%) | 0 (0.0%) |
| Total (Overall) | 271 (52.0%) | 250 (48.0%) |
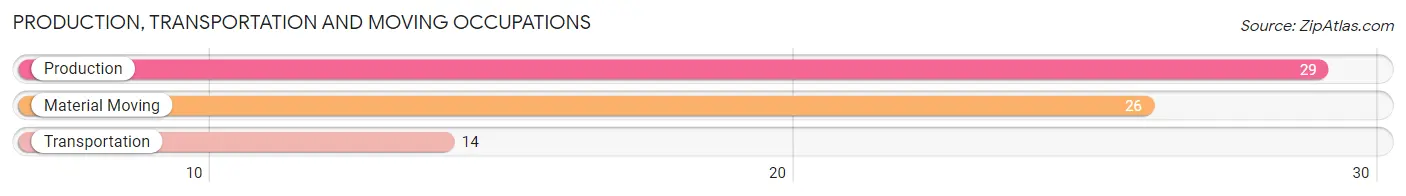
Production, Transportation and Moving Occupations
The most common Production, Transportation and Moving occupations in Thomasboro are Production (29 | 5.6%), Material Moving (26 | 5.0%), and Transportation (14 | 2.7%).
Production, Transportation and Moving Occupations by Sex
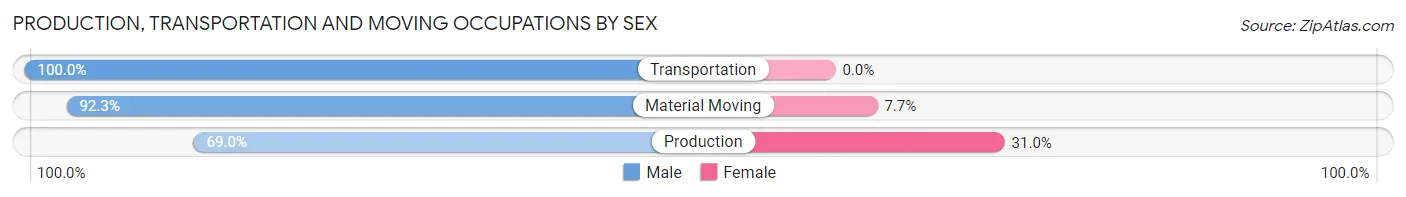
| Occupation | Male | Female |
| Production | 20 (69.0%) | 9 (31.0%) |
| Transportation | 14 (100.0%) | 0 (0.0%) |
| Material Moving | 24 (92.3%) | 2 (7.7%) |
| Total (Category) | 58 (84.1%) | 11 (15.9%) |
| Total (Overall) | 271 (52.0%) | 250 (48.0%) |
Employment Industries by Sex in Thomasboro
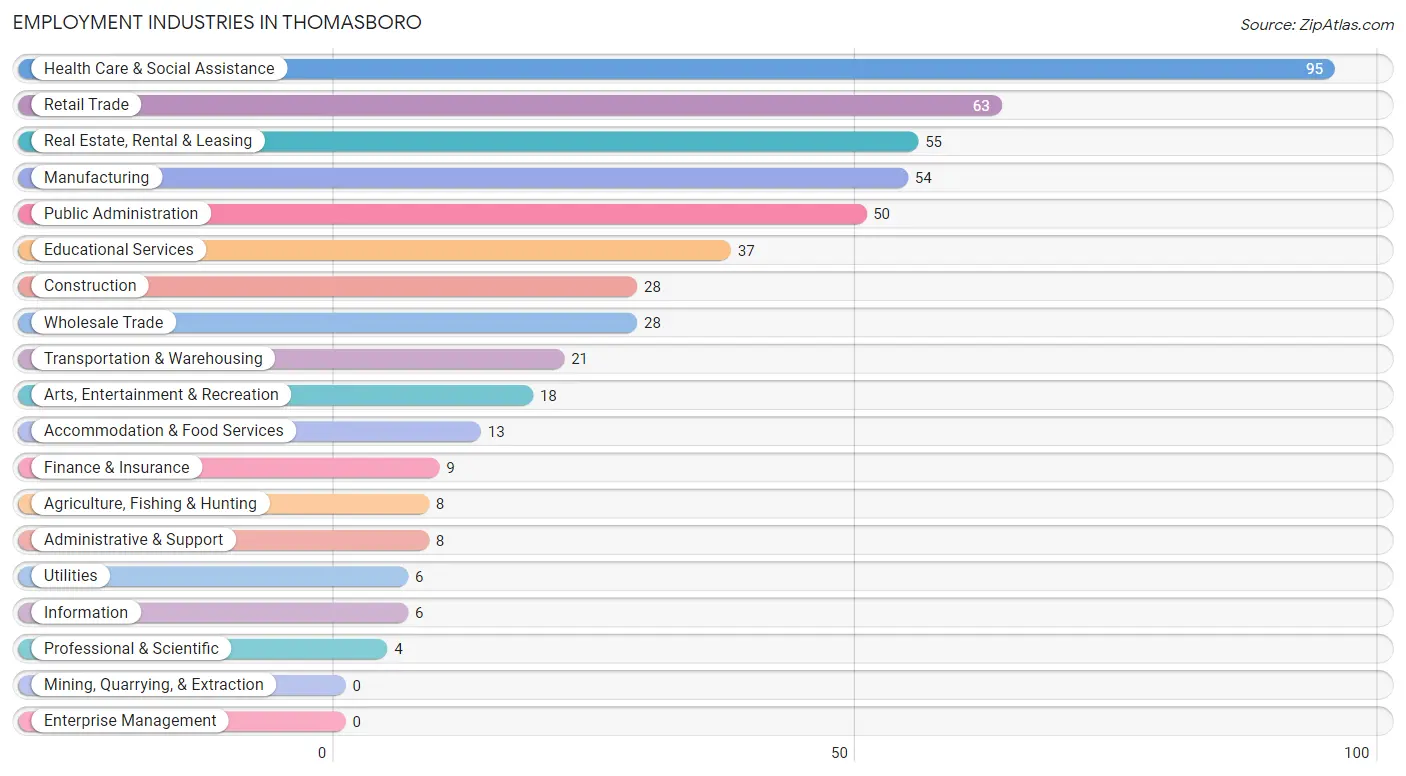
Employment Industries in Thomasboro
The major employment industries in Thomasboro include Health Care & Social Assistance (95 | 18.2%), Retail Trade (63 | 12.1%), Real Estate, Rental & Leasing (55 | 10.6%), Manufacturing (54 | 10.4%), and Public Administration (50 | 9.6%).
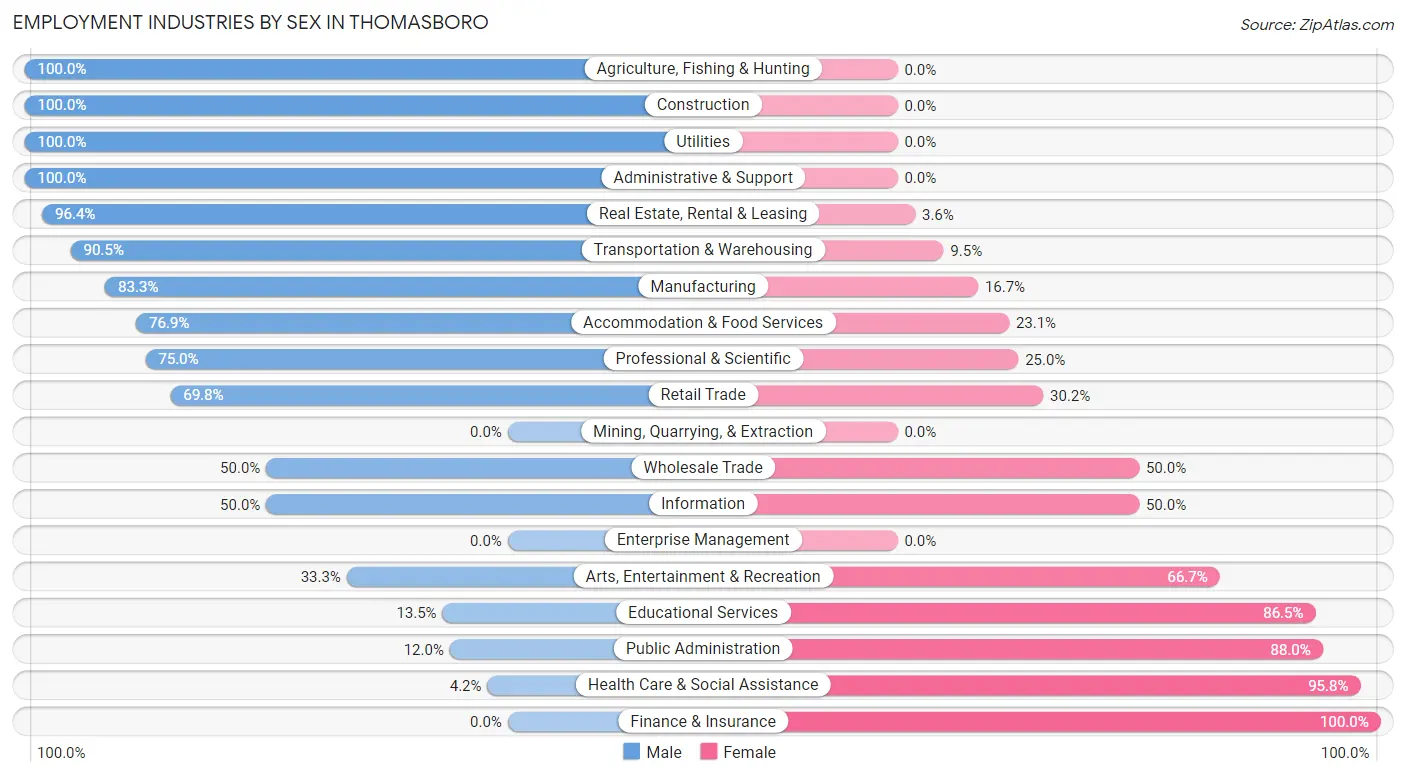
Employment Industries by Sex in Thomasboro
The Thomasboro industries that see more men than women are Agriculture, Fishing & Hunting (100.0%), Construction (100.0%), and Utilities (100.0%), whereas the industries that tend to have a higher number of women are Finance & Insurance (100.0%), Health Care & Social Assistance (95.8%), and Public Administration (88.0%).
| Industry | Male | Female |
| Agriculture, Fishing & Hunting | 8 (100.0%) | 0 (0.0%) |
| Mining, Quarrying, & Extraction | 0 (0.0%) | 0 (0.0%) |
| Construction | 28 (100.0%) | 0 (0.0%) |
| Manufacturing | 45 (83.3%) | 9 (16.7%) |
| Wholesale Trade | 14 (50.0%) | 14 (50.0%) |
| Retail Trade | 44 (69.8%) | 19 (30.2%) |
| Transportation & Warehousing | 19 (90.5%) | 2 (9.5%) |
| Utilities | 6 (100.0%) | 0 (0.0%) |
| Information | 3 (50.0%) | 3 (50.0%) |
| Finance & Insurance | 0 (0.0%) | 9 (100.0%) |
| Real Estate, Rental & Leasing | 53 (96.4%) | 2 (3.6%) |
| Professional & Scientific | 3 (75.0%) | 1 (25.0%) |
| Enterprise Management | 0 (0.0%) | 0 (0.0%) |
| Administrative & Support | 8 (100.0%) | 0 (0.0%) |
| Educational Services | 5 (13.5%) | 32 (86.5%) |
| Health Care & Social Assistance | 4 (4.2%) | 91 (95.8%) |
| Arts, Entertainment & Recreation | 6 (33.3%) | 12 (66.7%) |
| Accommodation & Food Services | 10 (76.9%) | 3 (23.1%) |
| Public Administration | 6 (12.0%) | 44 (88.0%) |
| Total | 271 (52.0%) | 250 (48.0%) |
Education in Thomasboro
School Enrollment in Thomasboro
The most common levels of schooling among the 189 students in Thomasboro are elementary school (52 | 27.5%), college / undergraduate (45 | 23.8%), and middle school (36 | 19.1%).
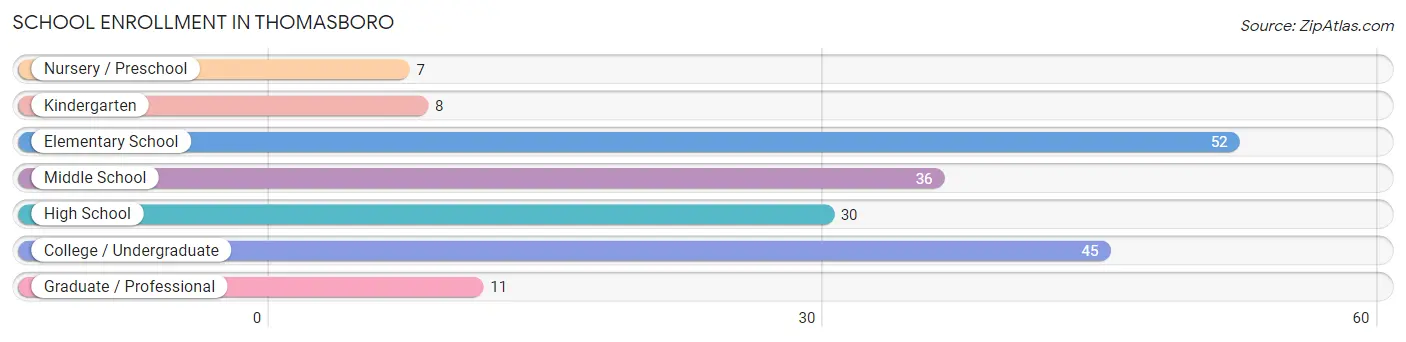
| School Level | # Students | % Students |
| Nursery / Preschool | 7 | 3.7% |
| Kindergarten | 8 | 4.2% |
| Elementary School | 52 | 27.5% |
| Middle School | 36 | 19.1% |
| High School | 30 | 15.9% |
| College / Undergraduate | 45 | 23.8% |
| Graduate / Professional | 11 | 5.8% |
| Total | 189 | 100.0% |
School Enrollment by Age by Funding Source in Thomasboro
Out of a total of 189 students who are enrolled in schools in Thomasboro, 39 (20.6%) attend a private institution, while the remaining 150 (79.4%) are enrolled in public schools. The age group of 3 to 4 year olds has the highest likelihood of being enrolled in private schools, with 5 (71.4% in the age bracket) enrolled. Conversely, the age group of 15 to 17 year olds has the lowest likelihood of being enrolled in a private school, with 22 (100.0% in the age bracket) attending a public institution.
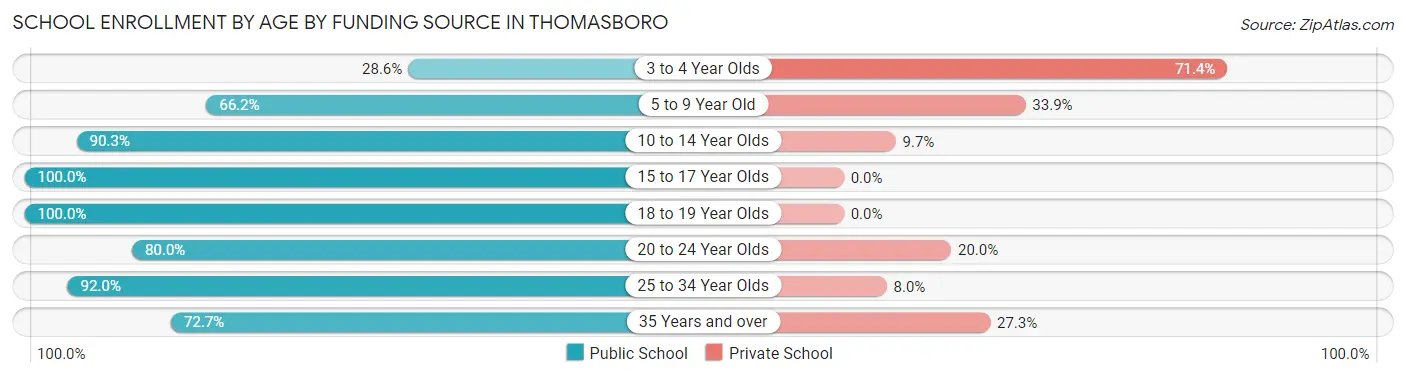
| Age Bracket | Public School | Private School |
| 3 to 4 Year Olds | 2 (28.6%) | 5 (71.4%) |
| 5 to 9 Year Old | 43 (66.1%) | 22 (33.9%) |
| 10 to 14 Year Olds | 28 (90.3%) | 3 (9.7%) |
| 15 to 17 Year Olds | 22 (100.0%) | 0 (0.0%) |
| 18 to 19 Year Olds | 8 (100.0%) | 0 (0.0%) |
| 20 to 24 Year Olds | 16 (80.0%) | 4 (20.0%) |
| 25 to 34 Year Olds | 23 (92.0%) | 2 (8.0%) |
| 35 Years and over | 8 (72.7%) | 3 (27.3%) |
| Total | 150 (79.4%) | 39 (20.6%) |
Educational Attainment by Field of Study in Thomasboro
Business (47 | 29.0%), bio, nature & agricultural (24 | 14.8%), science & technology (18 | 11.1%), engineering (17 | 10.5%), and education (13 | 8.0%) are the most common fields of study among 162 individuals in Thomasboro who have obtained a bachelor's degree or higher.
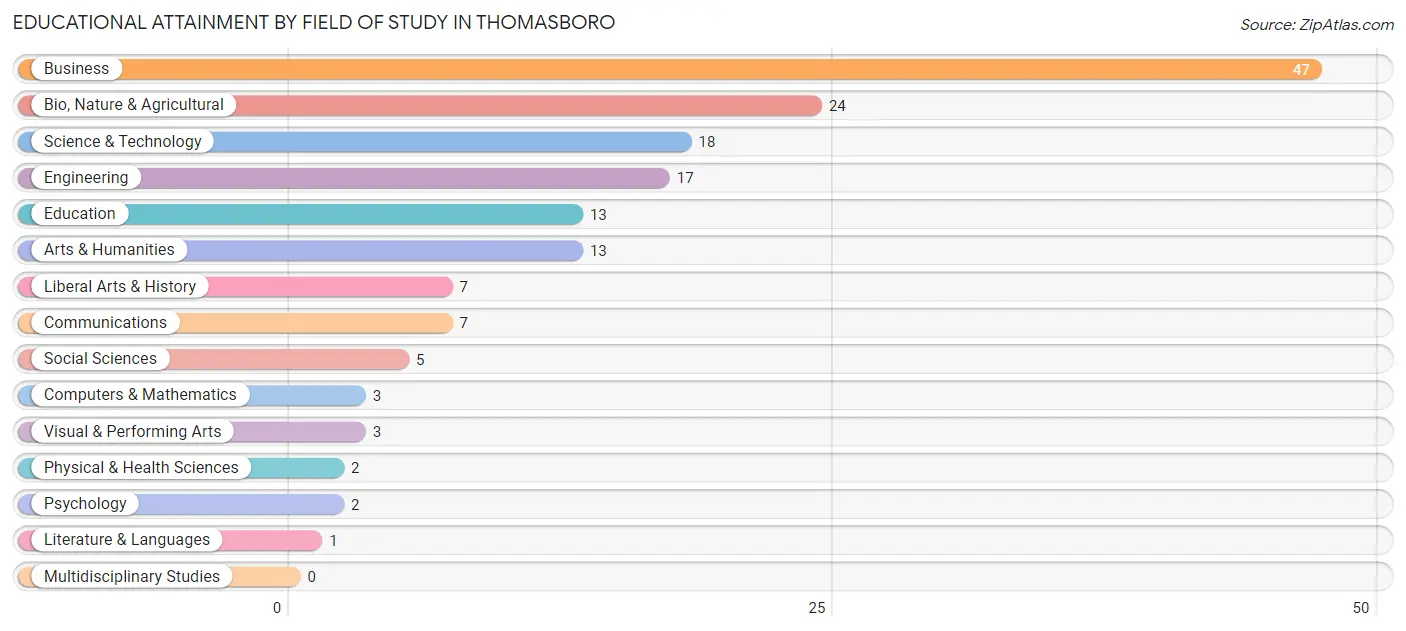
| Field of Study | # Graduates | % Graduates |
| Computers & Mathematics | 3 | 1.8% |
| Bio, Nature & Agricultural | 24 | 14.8% |
| Physical & Health Sciences | 2 | 1.2% |
| Psychology | 2 | 1.2% |
| Social Sciences | 5 | 3.1% |
| Engineering | 17 | 10.5% |
| Multidisciplinary Studies | 0 | 0.0% |
| Science & Technology | 18 | 11.1% |
| Business | 47 | 29.0% |
| Education | 13 | 8.0% |
| Literature & Languages | 1 | 0.6% |
| Liberal Arts & History | 7 | 4.3% |
| Visual & Performing Arts | 3 | 1.8% |
| Communications | 7 | 4.3% |
| Arts & Humanities | 13 | 8.0% |
| Total | 162 | 100.0% |
Transportation & Commute in Thomasboro
Vehicle Availability by Sex in Thomasboro
The most prevalent vehicle ownership categories in Thomasboro are males with 2 vehicles (127, accounting for 48.5%) and females with 2 vehicles (121, making up 51.8%).
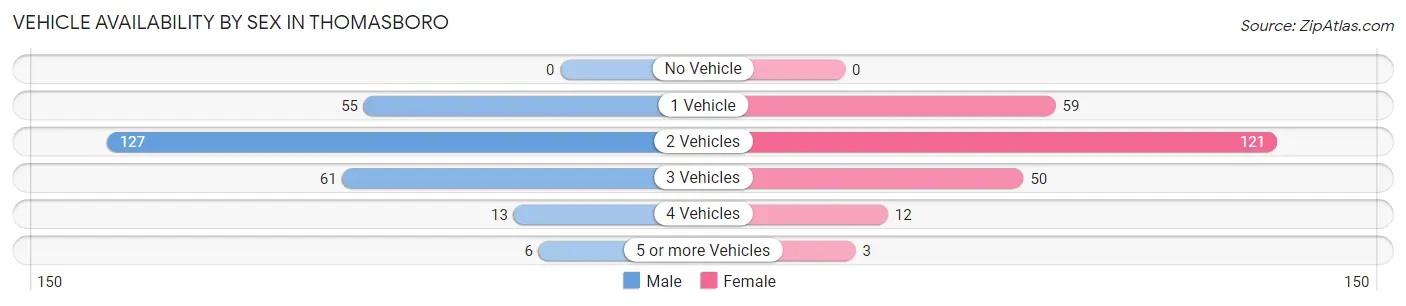
| Vehicles Available | Male | Female |
| No Vehicle | 0 (0.0%) | 0 (0.0%) |
| 1 Vehicle | 55 (21.0%) | 59 (24.1%) |
| 2 Vehicles | 127 (48.5%) | 121 (49.4%) |
| 3 Vehicles | 61 (23.3%) | 50 (20.4%) |
| 4 Vehicles | 13 (5.0%) | 12 (4.9%) |
| 5 or more Vehicles | 6 (2.3%) | 3 (1.2%) |
| Total | 262 (100.0%) | 245 (100.0%) |
Commute Time in Thomasboro
The most frequently occuring commute durations in Thomasboro are 15 to 19 minutes (153 commuters, 31.0%), 20 to 24 minutes (104 commuters, 21.0%), and 30 to 34 minutes (97 commuters, 19.6%).
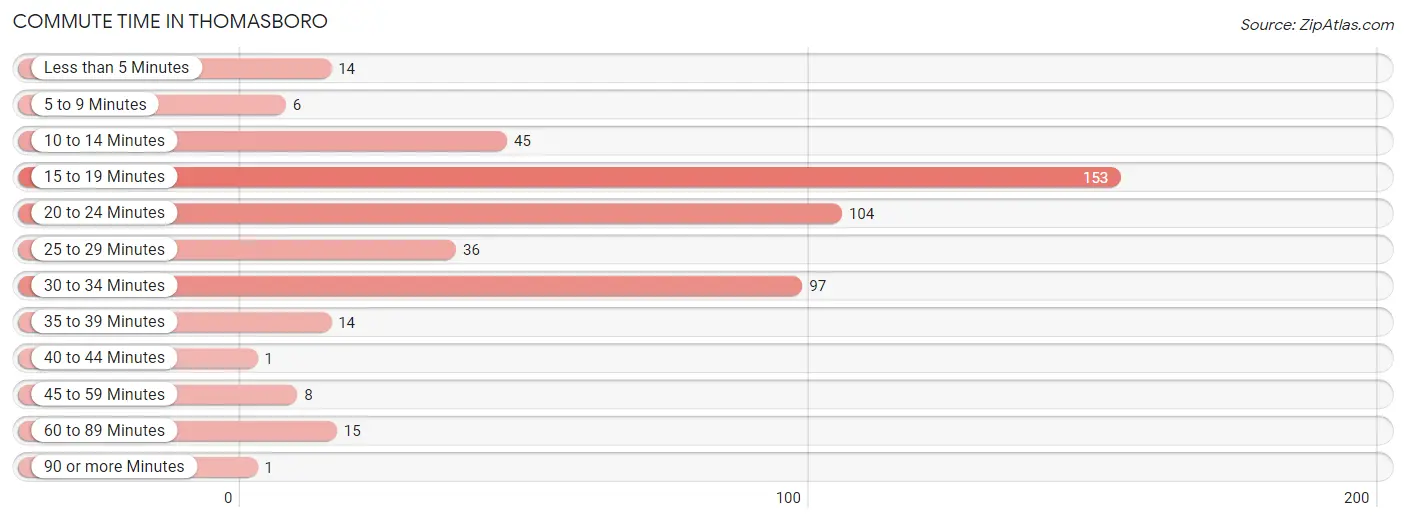
| Commute Time | # Commuters | % Commuters |
| Less than 5 Minutes | 14 | 2.8% |
| 5 to 9 Minutes | 6 | 1.2% |
| 10 to 14 Minutes | 45 | 9.1% |
| 15 to 19 Minutes | 153 | 31.0% |
| 20 to 24 Minutes | 104 | 21.0% |
| 25 to 29 Minutes | 36 | 7.3% |
| 30 to 34 Minutes | 97 | 19.6% |
| 35 to 39 Minutes | 14 | 2.8% |
| 40 to 44 Minutes | 1 | 0.2% |
| 45 to 59 Minutes | 8 | 1.6% |
| 60 to 89 Minutes | 15 | 3.0% |
| 90 or more Minutes | 1 | 0.2% |
Commute Time by Sex in Thomasboro
The most common commute times in Thomasboro are 15 to 19 minutes (124 commuters, 47.9%) for males and 30 to 34 minutes (81 commuters, 34.5%) for females.
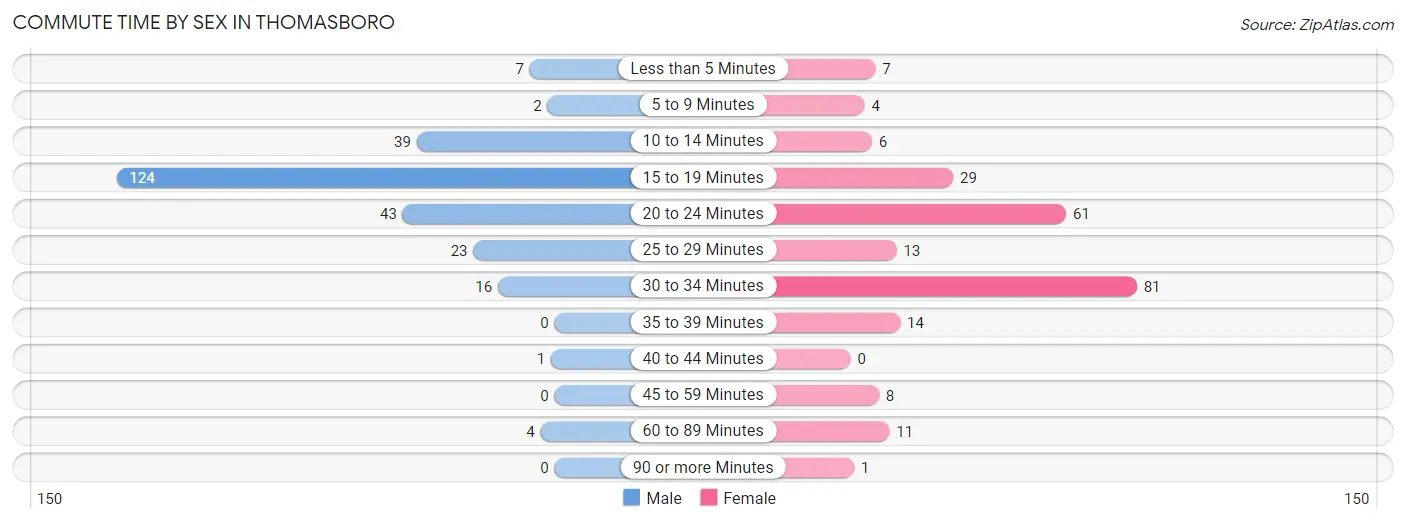
| Commute Time | Male | Female |
| Less than 5 Minutes | 7 (2.7%) | 7 (3.0%) |
| 5 to 9 Minutes | 2 (0.8%) | 4 (1.7%) |
| 10 to 14 Minutes | 39 (15.1%) | 6 (2.5%) |
| 15 to 19 Minutes | 124 (47.9%) | 29 (12.3%) |
| 20 to 24 Minutes | 43 (16.6%) | 61 (26.0%) |
| 25 to 29 Minutes | 23 (8.9%) | 13 (5.5%) |
| 30 to 34 Minutes | 16 (6.2%) | 81 (34.5%) |
| 35 to 39 Minutes | 0 (0.0%) | 14 (6.0%) |
| 40 to 44 Minutes | 1 (0.4%) | 0 (0.0%) |
| 45 to 59 Minutes | 0 (0.0%) | 8 (3.4%) |
| 60 to 89 Minutes | 4 (1.5%) | 11 (4.7%) |
| 90 or more Minutes | 0 (0.0%) | 1 (0.4%) |
Time of Departure to Work by Sex in Thomasboro
The most frequent times of departure to work in Thomasboro are 6:30 AM to 6:59 AM (109, 42.1%) for males and 7:00 AM to 7:29 AM (93, 39.6%) for females.
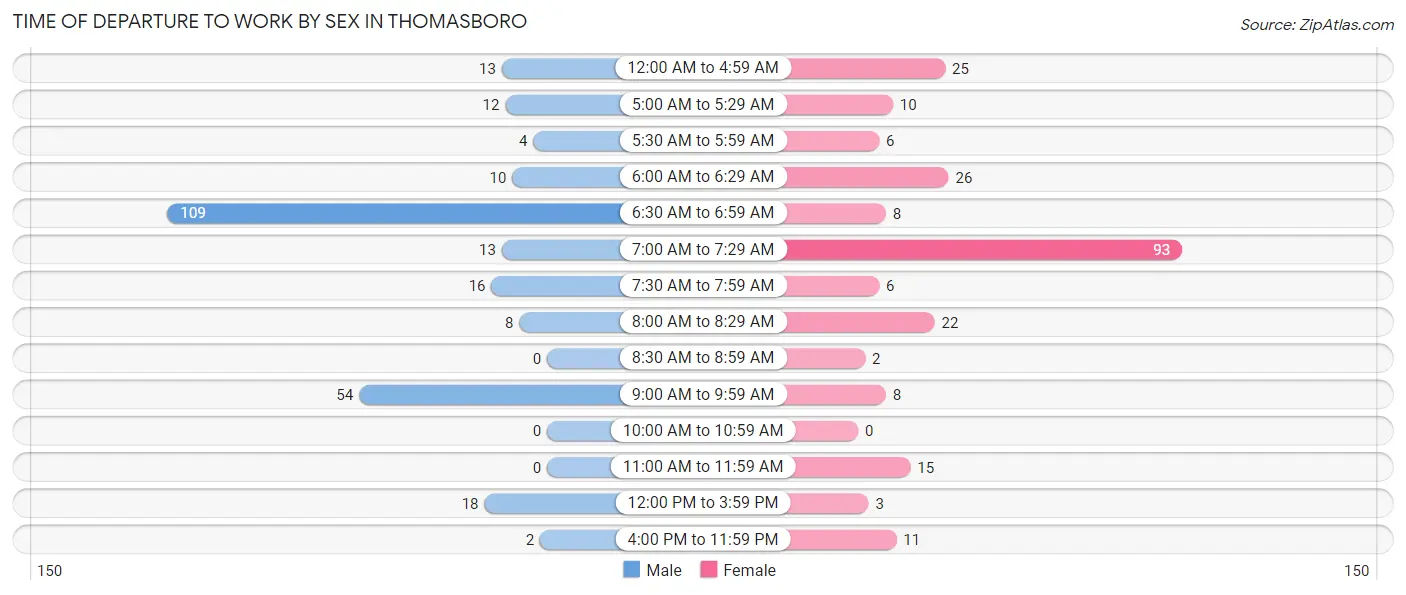
| Time of Departure | Male | Female |
| 12:00 AM to 4:59 AM | 13 (5.0%) | 25 (10.6%) |
| 5:00 AM to 5:29 AM | 12 (4.6%) | 10 (4.3%) |
| 5:30 AM to 5:59 AM | 4 (1.5%) | 6 (2.5%) |
| 6:00 AM to 6:29 AM | 10 (3.9%) | 26 (11.1%) |
| 6:30 AM to 6:59 AM | 109 (42.1%) | 8 (3.4%) |
| 7:00 AM to 7:29 AM | 13 (5.0%) | 93 (39.6%) |
| 7:30 AM to 7:59 AM | 16 (6.2%) | 6 (2.5%) |
| 8:00 AM to 8:29 AM | 8 (3.1%) | 22 (9.4%) |
| 8:30 AM to 8:59 AM | 0 (0.0%) | 2 (0.9%) |
| 9:00 AM to 9:59 AM | 54 (20.8%) | 8 (3.4%) |
| 10:00 AM to 10:59 AM | 0 (0.0%) | 0 (0.0%) |
| 11:00 AM to 11:59 AM | 0 (0.0%) | 15 (6.4%) |
| 12:00 PM to 3:59 PM | 18 (7.0%) | 3 (1.3%) |
| 4:00 PM to 11:59 PM | 2 (0.8%) | 11 (4.7%) |
| Total | 259 (100.0%) | 235 (100.0%) |
Housing Occupancy in Thomasboro
Occupancy by Ownership in Thomasboro
Of the total 464 dwellings in Thomasboro, owner-occupied units account for 366 (78.9%), while renter-occupied units make up 98 (21.1%).
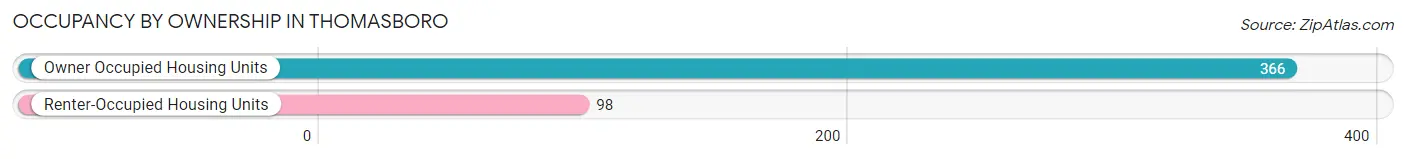
| Occupancy | # Housing Units | % Housing Units |
| Owner Occupied Housing Units | 366 | 78.9% |
| Renter-Occupied Housing Units | 98 | 21.1% |
| Total Occupied Housing Units | 464 | 100.0% |
Occupancy by Household Size in Thomasboro
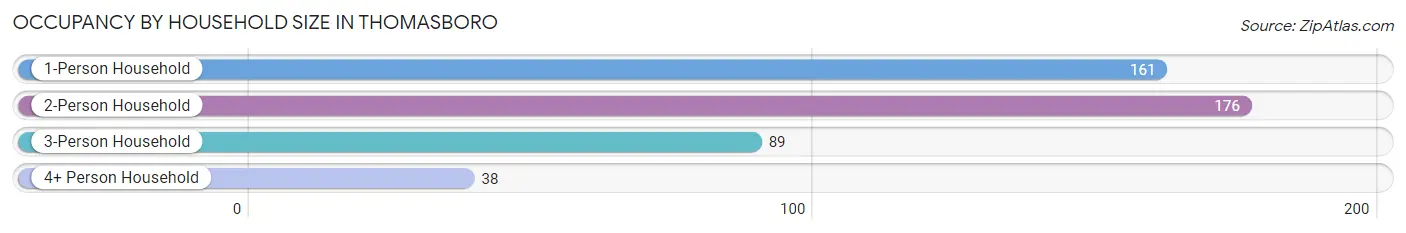
| Household Size | # Housing Units | % Housing Units |
| 1-Person Household | 161 | 34.7% |
| 2-Person Household | 176 | 37.9% |
| 3-Person Household | 89 | 19.2% |
| 4+ Person Household | 38 | 8.2% |
| Total Housing Units | 464 | 100.0% |
Occupancy by Ownership by Household Size in Thomasboro
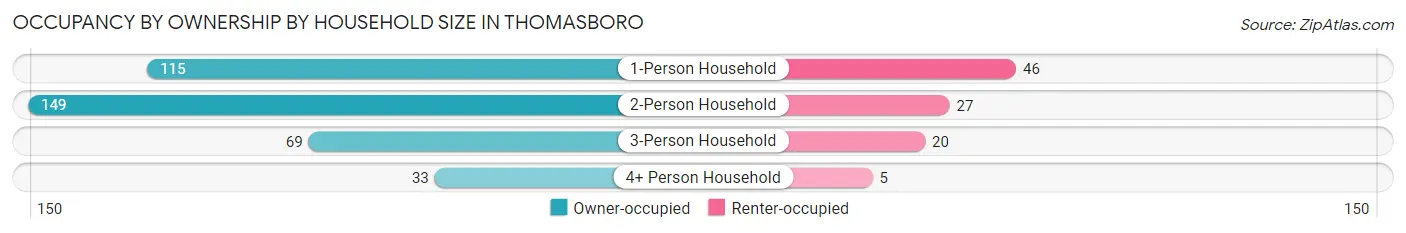
| Household Size | Owner-occupied | Renter-occupied |
| 1-Person Household | 115 (71.4%) | 46 (28.6%) |
| 2-Person Household | 149 (84.7%) | 27 (15.3%) |
| 3-Person Household | 69 (77.5%) | 20 (22.5%) |
| 4+ Person Household | 33 (86.8%) | 5 (13.2%) |
| Total Housing Units | 366 (78.9%) | 98 (21.1%) |
Occupancy by Educational Attainment in Thomasboro
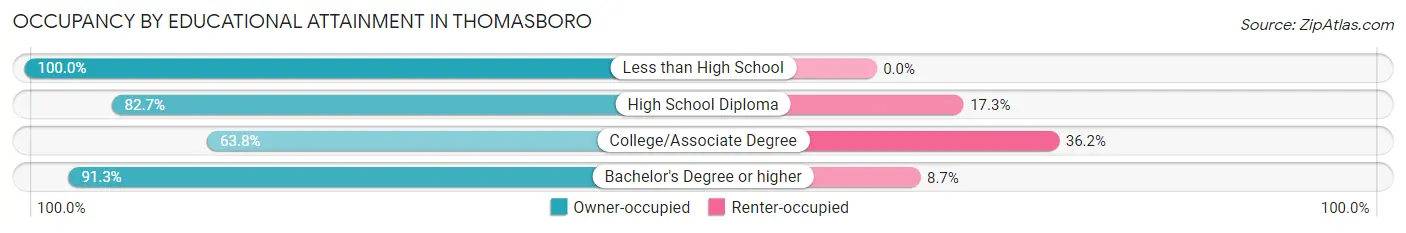
| Household Size | Owner-occupied | Renter-occupied |
| Less than High School | 18 (100.0%) | 0 (0.0%) |
| High School Diploma | 139 (82.7%) | 29 (17.3%) |
| College/Associate Degree | 104 (63.8%) | 59 (36.2%) |
| Bachelor's Degree or higher | 105 (91.3%) | 10 (8.7%) |
Occupancy by Age of Householder in Thomasboro
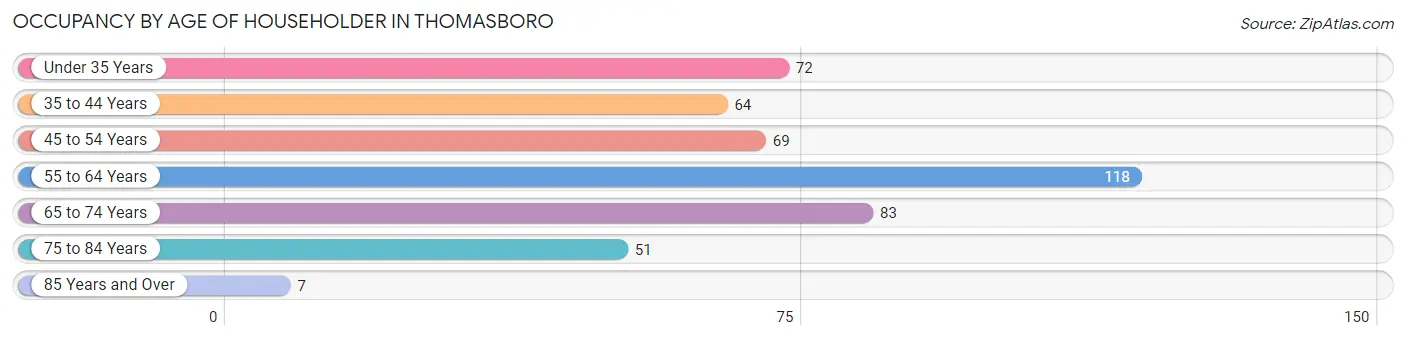
| Age Bracket | # Households | % Households |
| Under 35 Years | 72 | 15.5% |
| 35 to 44 Years | 64 | 13.8% |
| 45 to 54 Years | 69 | 14.9% |
| 55 to 64 Years | 118 | 25.4% |
| 65 to 74 Years | 83 | 17.9% |
| 75 to 84 Years | 51 | 11.0% |
| 85 Years and Over | 7 | 1.5% |
| Total | 464 | 100.0% |
Housing Finances in Thomasboro
Median Income by Occupancy in Thomasboro
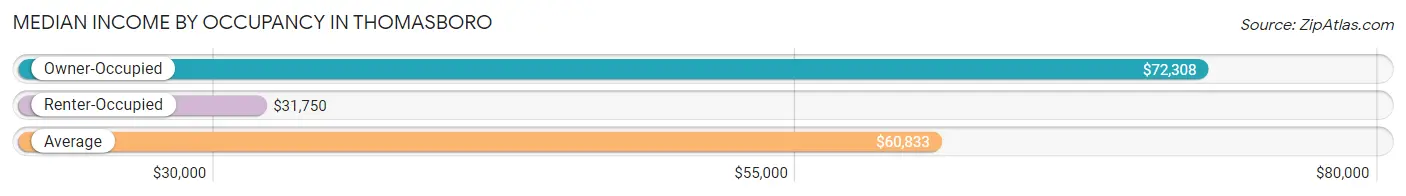
| Occupancy Type | # Households | Median Income |
| Owner-Occupied | 366 (78.9%) | $72,308 |
| Renter-Occupied | 98 (21.1%) | $31,750 |
| Average | 464 (100.0%) | $60,833 |
Occupancy by Householder Income Bracket in Thomasboro
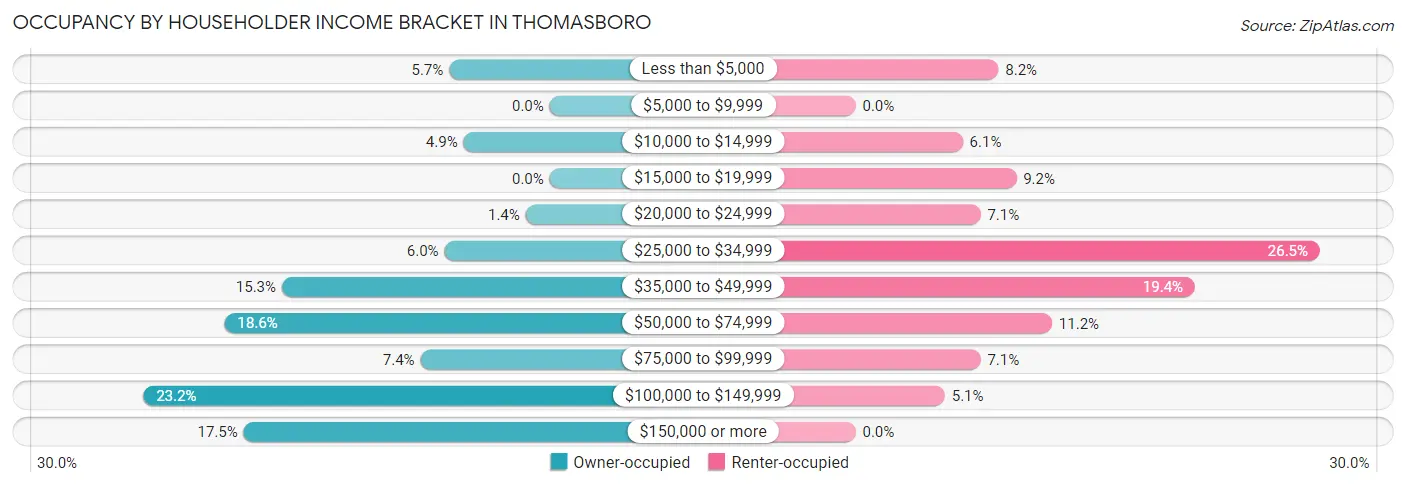
| Income Bracket | Owner-occupied | Renter-occupied |
| Less than $5,000 | 21 (5.7%) | 8 (8.2%) |
| $5,000 to $9,999 | 0 (0.0%) | 0 (0.0%) |
| $10,000 to $14,999 | 18 (4.9%) | 6 (6.1%) |
| $15,000 to $19,999 | 0 (0.0%) | 9 (9.2%) |
| $20,000 to $24,999 | 5 (1.4%) | 7 (7.1%) |
| $25,000 to $34,999 | 22 (6.0%) | 26 (26.5%) |
| $35,000 to $49,999 | 56 (15.3%) | 19 (19.4%) |
| $50,000 to $74,999 | 68 (18.6%) | 11 (11.2%) |
| $75,000 to $99,999 | 27 (7.4%) | 7 (7.1%) |
| $100,000 to $149,999 | 85 (23.2%) | 5 (5.1%) |
| $150,000 or more | 64 (17.5%) | 0 (0.0%) |
| Total | 366 (100.0%) | 98 (100.0%) |
Monthly Housing Cost Tiers in Thomasboro
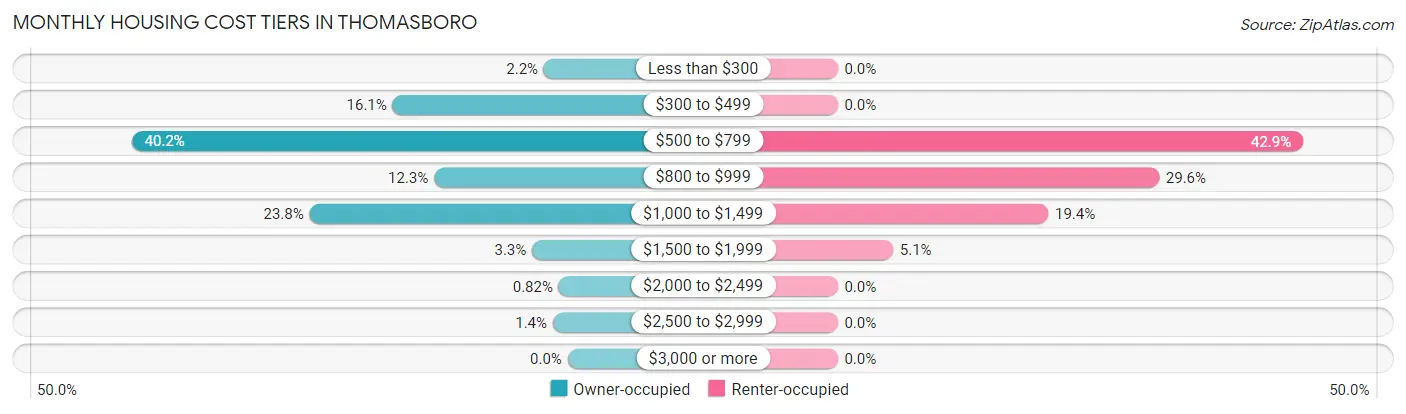
| Monthly Cost | Owner-occupied | Renter-occupied |
| Less than $300 | 8 (2.2%) | 0 (0.0%) |
| $300 to $499 | 59 (16.1%) | 0 (0.0%) |
| $500 to $799 | 147 (40.2%) | 42 (42.9%) |
| $800 to $999 | 45 (12.3%) | 29 (29.6%) |
| $1,000 to $1,499 | 87 (23.8%) | 19 (19.4%) |
| $1,500 to $1,999 | 12 (3.3%) | 5 (5.1%) |
| $2,000 to $2,499 | 3 (0.8%) | 0 (0.0%) |
| $2,500 to $2,999 | 5 (1.4%) | 0 (0.0%) |
| $3,000 or more | 0 (0.0%) | 0 (0.0%) |
| Total | 366 (100.0%) | 98 (100.0%) |
Physical Housing Characteristics in Thomasboro
Housing Structures in Thomasboro
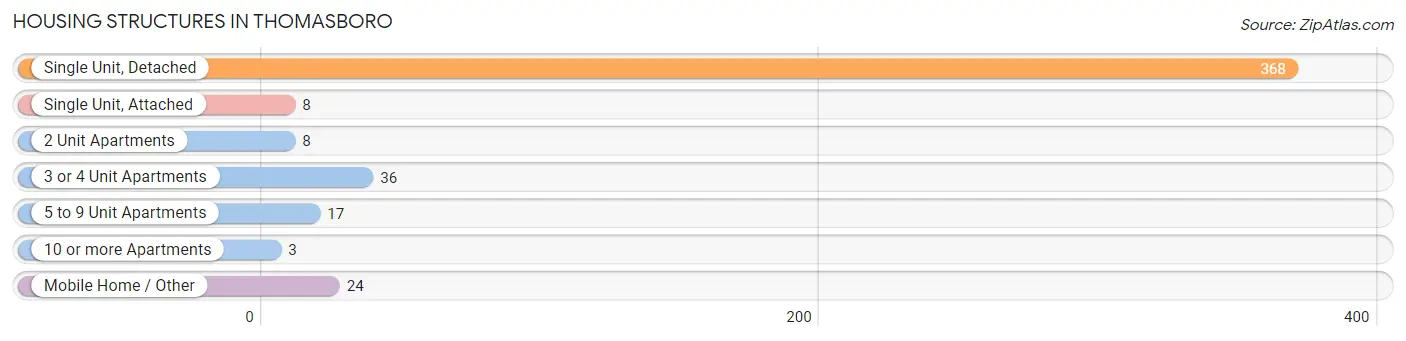
| Structure Type | # Housing Units | % Housing Units |
| Single Unit, Detached | 368 | 79.3% |
| Single Unit, Attached | 8 | 1.7% |
| 2 Unit Apartments | 8 | 1.7% |
| 3 or 4 Unit Apartments | 36 | 7.8% |
| 5 to 9 Unit Apartments | 17 | 3.7% |
| 10 or more Apartments | 3 | 0.6% |
| Mobile Home / Other | 24 | 5.2% |
| Total | 464 | 100.0% |
Housing Structures by Occupancy in Thomasboro
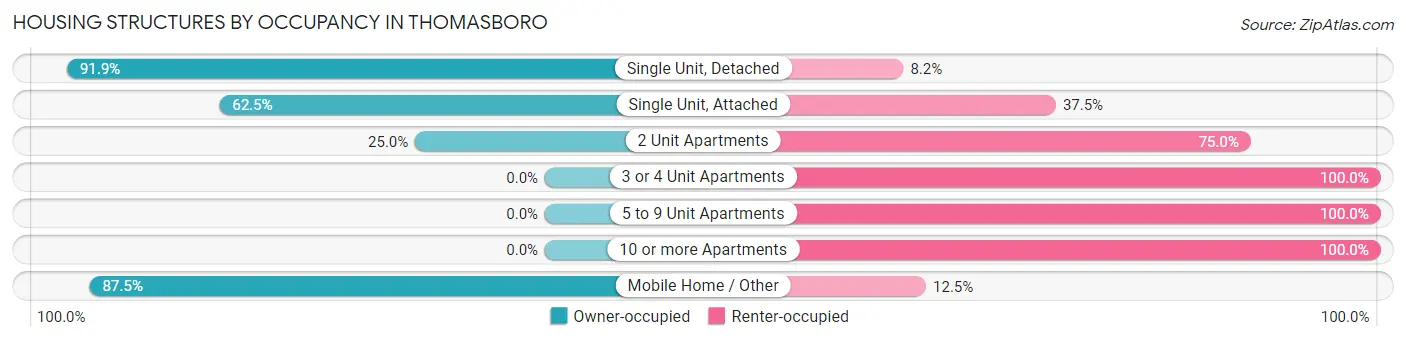
| Structure Type | Owner-occupied | Renter-occupied |
| Single Unit, Detached | 338 (91.8%) | 30 (8.2%) |
| Single Unit, Attached | 5 (62.5%) | 3 (37.5%) |
| 2 Unit Apartments | 2 (25.0%) | 6 (75.0%) |
| 3 or 4 Unit Apartments | 0 (0.0%) | 36 (100.0%) |
| 5 to 9 Unit Apartments | 0 (0.0%) | 17 (100.0%) |
| 10 or more Apartments | 0 (0.0%) | 3 (100.0%) |
| Mobile Home / Other | 21 (87.5%) | 3 (12.5%) |
| Total | 366 (78.9%) | 98 (21.1%) |
Housing Structures by Number of Rooms in Thomasboro
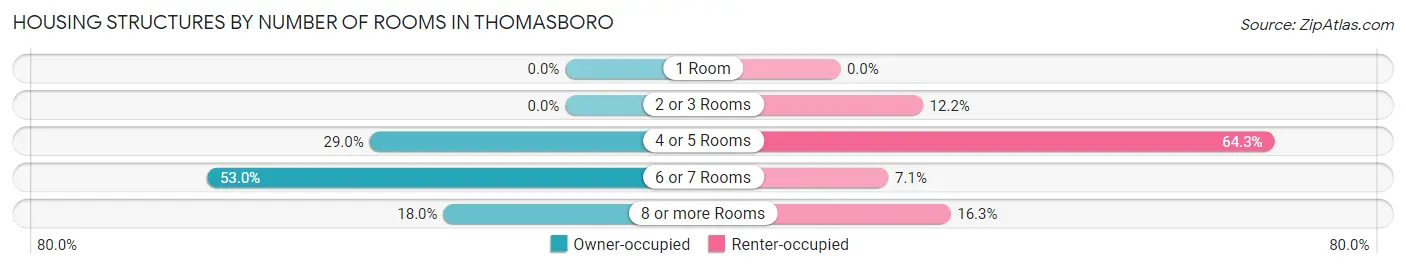
| Number of Rooms | Owner-occupied | Renter-occupied |
| 1 Room | 0 (0.0%) | 0 (0.0%) |
| 2 or 3 Rooms | 0 (0.0%) | 12 (12.2%) |
| 4 or 5 Rooms | 106 (29.0%) | 63 (64.3%) |
| 6 or 7 Rooms | 194 (53.0%) | 7 (7.1%) |
| 8 or more Rooms | 66 (18.0%) | 16 (16.3%) |
| Total | 366 (100.0%) | 98 (100.0%) |
Housing Structure by Heating Type in Thomasboro
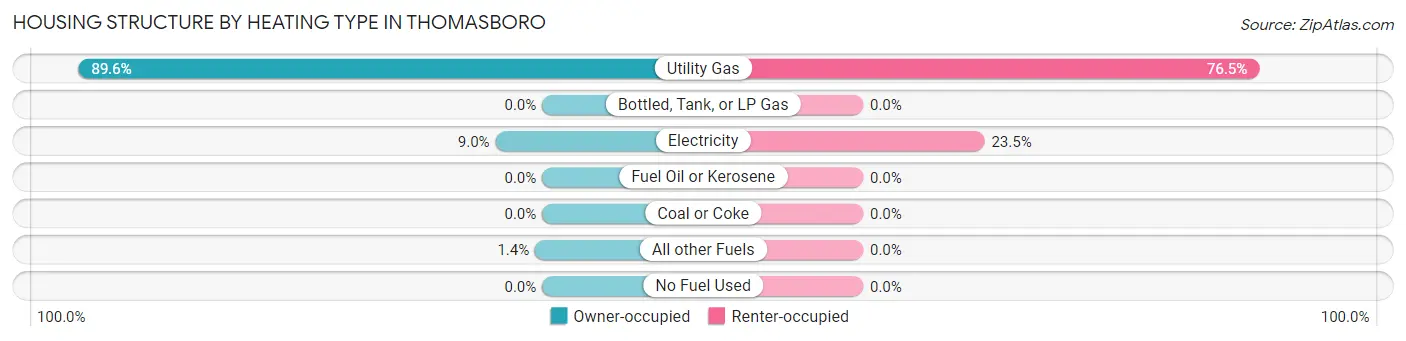
| Heating Type | Owner-occupied | Renter-occupied |
| Utility Gas | 328 (89.6%) | 75 (76.5%) |
| Bottled, Tank, or LP Gas | 0 (0.0%) | 0 (0.0%) |
| Electricity | 33 (9.0%) | 23 (23.5%) |
| Fuel Oil or Kerosene | 0 (0.0%) | 0 (0.0%) |
| Coal or Coke | 0 (0.0%) | 0 (0.0%) |
| All other Fuels | 5 (1.4%) | 0 (0.0%) |
| No Fuel Used | 0 (0.0%) | 0 (0.0%) |
| Total | 366 (100.0%) | 98 (100.0%) |
Household Vehicle Usage in Thomasboro
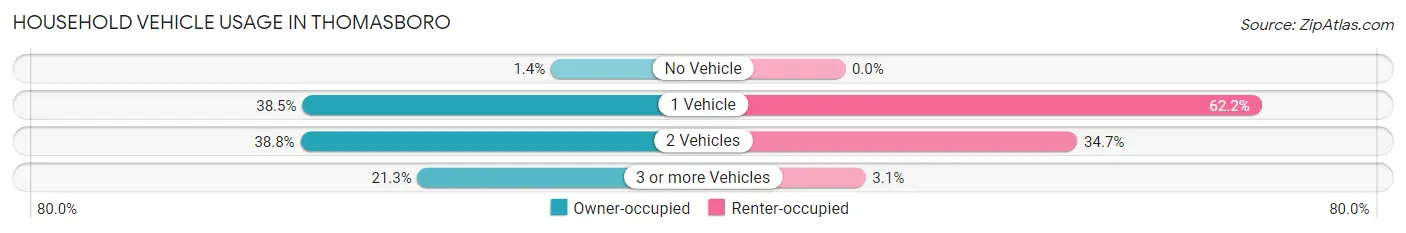
| Vehicles per Household | Owner-occupied | Renter-occupied |
| No Vehicle | 5 (1.4%) | 0 (0.0%) |
| 1 Vehicle | 141 (38.5%) | 61 (62.2%) |
| 2 Vehicles | 142 (38.8%) | 34 (34.7%) |
| 3 or more Vehicles | 78 (21.3%) | 3 (3.1%) |
| Total | 366 (100.0%) | 98 (100.0%) |
Real Estate & Mortgages in Thomasboro
Real Estate and Mortgage Overview in Thomasboro
| Characteristic | Without Mortgage | With Mortgage |
| Housing Units | 143 | 223 |
| Median Property Value | $105,600 | $110,200 |
| Median Household Income | $51,563 | $51 |
| Monthly Housing Costs | $520 | $0 |
| Real Estate Taxes | $1,856 | $7 |
Property Value by Mortgage Status in Thomasboro
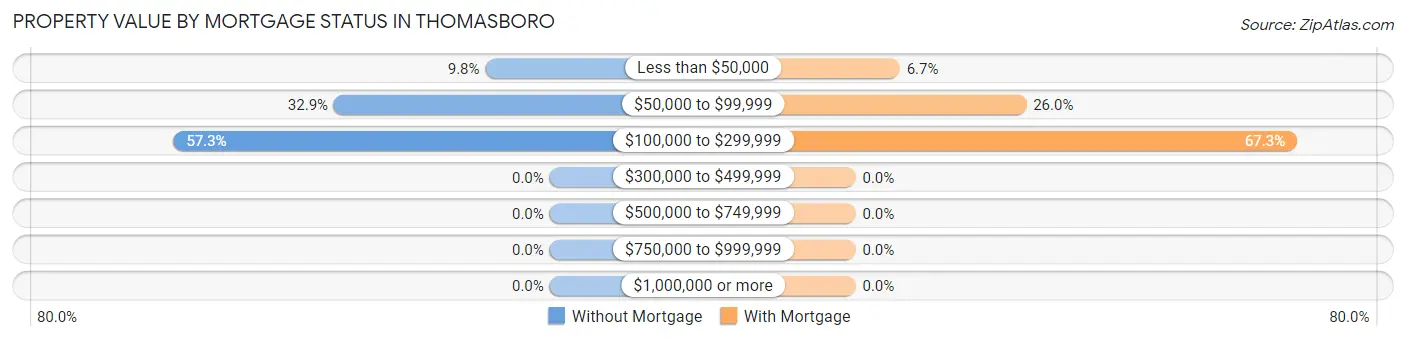
| Property Value | Without Mortgage | With Mortgage |
| Less than $50,000 | 14 (9.8%) | 15 (6.7%) |
| $50,000 to $99,999 | 47 (32.9%) | 58 (26.0%) |
| $100,000 to $299,999 | 82 (57.3%) | 150 (67.3%) |
| $300,000 to $499,999 | 0 (0.0%) | 0 (0.0%) |
| $500,000 to $749,999 | 0 (0.0%) | 0 (0.0%) |
| $750,000 to $999,999 | 0 (0.0%) | 0 (0.0%) |
| $1,000,000 or more | 0 (0.0%) | 0 (0.0%) |
| Total | 143 (100.0%) | 223 (100.0%) |
Household Income by Mortgage Status in Thomasboro
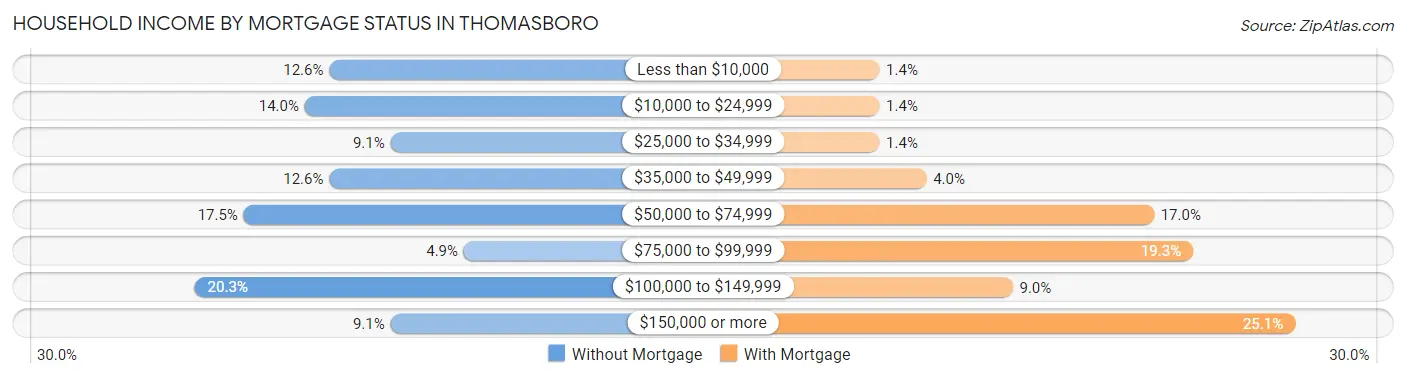
| Household Income | Without Mortgage | With Mortgage |
| Less than $10,000 | 18 (12.6%) | 3 (1.3%) |
| $10,000 to $24,999 | 20 (14.0%) | 3 (1.3%) |
| $25,000 to $34,999 | 13 (9.1%) | 3 (1.3%) |
| $35,000 to $49,999 | 18 (12.6%) | 9 (4.0%) |
| $50,000 to $74,999 | 25 (17.5%) | 38 (17.0%) |
| $75,000 to $99,999 | 7 (4.9%) | 43 (19.3%) |
| $100,000 to $149,999 | 29 (20.3%) | 20 (9.0%) |
| $150,000 or more | 13 (9.1%) | 56 (25.1%) |
| Total | 143 (100.0%) | 223 (100.0%) |
Property Value to Household Income Ratio in Thomasboro
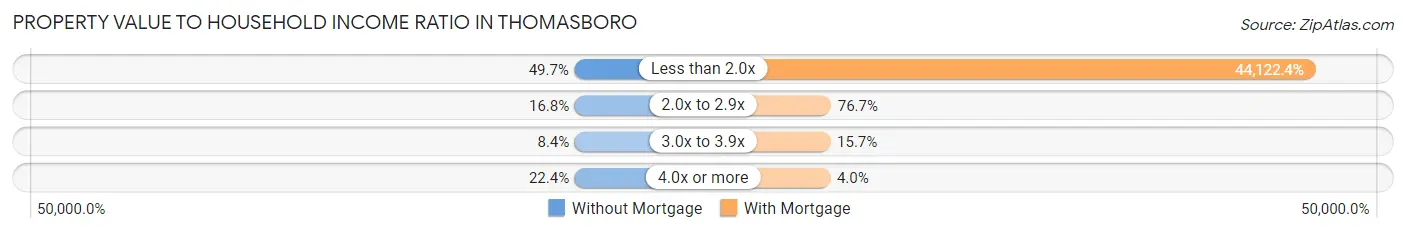
| Value-to-Income Ratio | Without Mortgage | With Mortgage |
| Less than 2.0x | 71 (49.6%) | 98,393 (44,122.4%) |
| 2.0x to 2.9x | 24 (16.8%) | 171 (76.7%) |
| 3.0x to 3.9x | 12 (8.4%) | 35 (15.7%) |
| 4.0x or more | 32 (22.4%) | 9 (4.0%) |
| Total | 143 (100.0%) | 223 (100.0%) |
Real Estate Taxes by Mortgage Status in Thomasboro
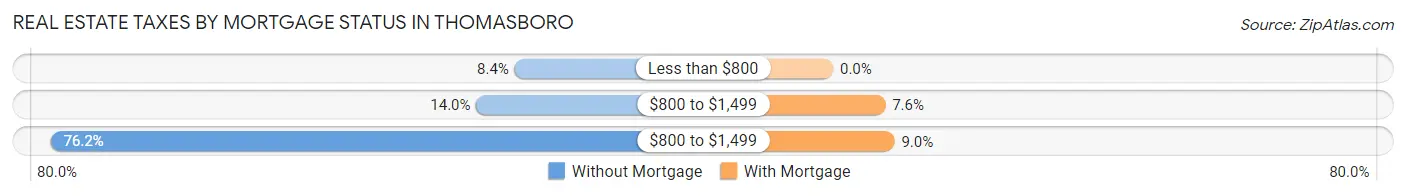
| Property Taxes | Without Mortgage | With Mortgage |
| Less than $800 | 12 (8.4%) | 0 (0.0%) |
| $800 to $1,499 | 20 (14.0%) | 17 (7.6%) |
| $800 to $1,499 | 109 (76.2%) | 20 (9.0%) |
| Total | 143 (100.0%) | 223 (100.0%) |
Health & Disability in Thomasboro
Health Insurance Coverage by Age in Thomasboro
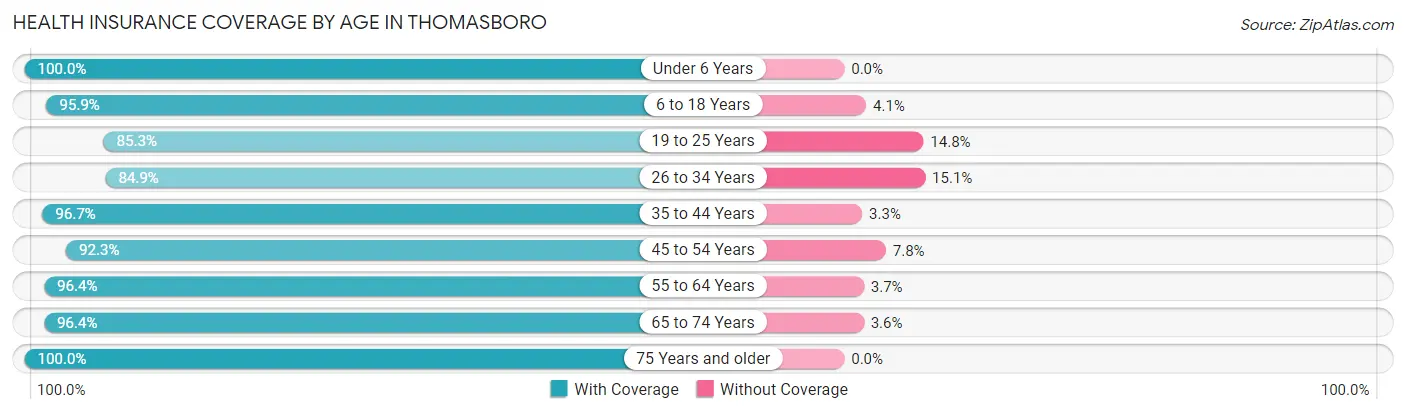
| Age Bracket | With Coverage | Without Coverage |
| Under 6 Years | 62 (100.0%) | 0 (0.0%) |
| 6 to 18 Years | 118 (95.9%) | 5 (4.1%) |
| 19 to 25 Years | 52 (85.3%) | 9 (14.7%) |
| 26 to 34 Years | 107 (84.9%) | 19 (15.1%) |
| 35 to 44 Years | 116 (96.7%) | 4 (3.3%) |
| 45 to 54 Years | 119 (92.2%) | 10 (7.7%) |
| 55 to 64 Years | 185 (96.4%) | 7 (3.6%) |
| 65 to 74 Years | 133 (96.4%) | 5 (3.6%) |
| 75 Years and older | 69 (100.0%) | 0 (0.0%) |
| Total | 961 (94.2%) | 59 (5.8%) |
Health Insurance Coverage by Citizenship Status in Thomasboro
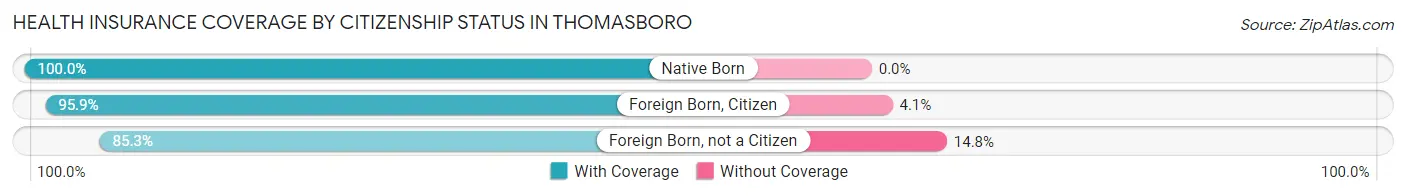
| Citizenship Status | With Coverage | Without Coverage |
| Native Born | 62 (100.0%) | 0 (0.0%) |
| Foreign Born, Citizen | 118 (95.9%) | 5 (4.1%) |
| Foreign Born, not a Citizen | 52 (85.3%) | 9 (14.7%) |
Health Insurance Coverage by Household Income in Thomasboro
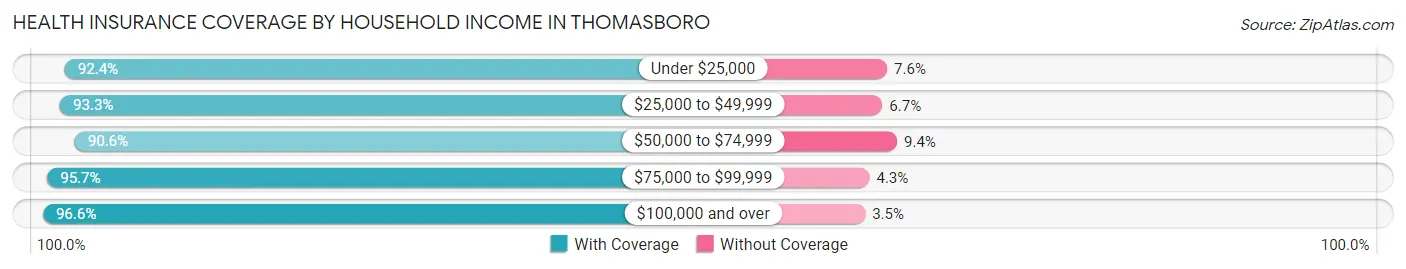
| Household Income | With Coverage | Without Coverage |
| Under $25,000 | 110 (92.4%) | 9 (7.6%) |
| $25,000 to $49,999 | 196 (93.3%) | 14 (6.7%) |
| $50,000 to $74,999 | 173 (90.6%) | 18 (9.4%) |
| $75,000 to $99,999 | 90 (95.7%) | 4 (4.3%) |
| $100,000 and over | 392 (96.6%) | 14 (3.5%) |
Public vs Private Health Insurance Coverage by Age in Thomasboro
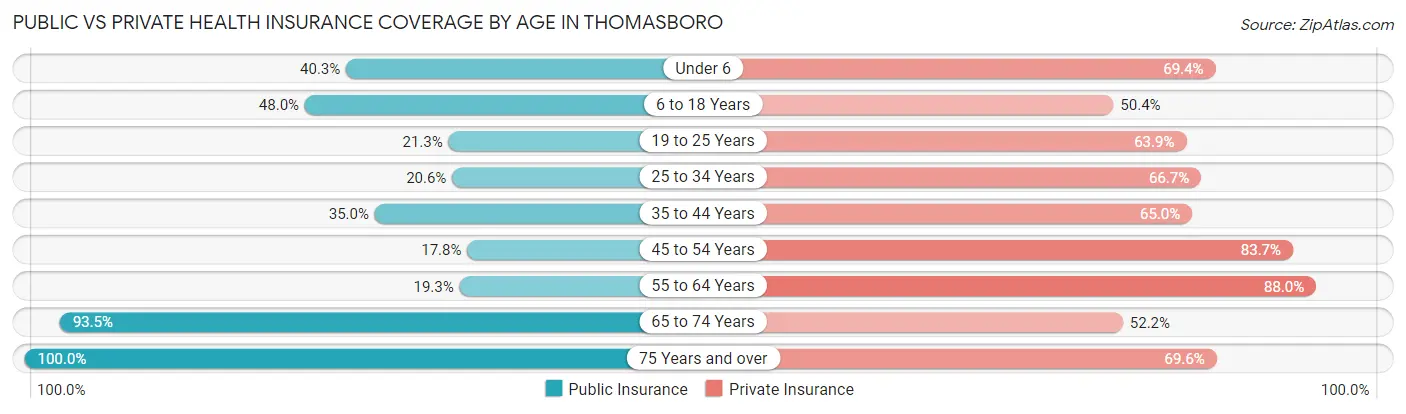
| Age Bracket | Public Insurance | Private Insurance |
| Under 6 | 25 (40.3%) | 43 (69.4%) |
| 6 to 18 Years | 59 (48.0%) | 62 (50.4%) |
| 19 to 25 Years | 13 (21.3%) | 39 (63.9%) |
| 25 to 34 Years | 26 (20.6%) | 84 (66.7%) |
| 35 to 44 Years | 42 (35.0%) | 78 (65.0%) |
| 45 to 54 Years | 23 (17.8%) | 108 (83.7%) |
| 55 to 64 Years | 37 (19.3%) | 169 (88.0%) |
| 65 to 74 Years | 129 (93.5%) | 72 (52.2%) |
| 75 Years and over | 69 (100.0%) | 48 (69.6%) |
| Total | 423 (41.5%) | 703 (68.9%) |
Disability Status by Sex by Age in Thomasboro
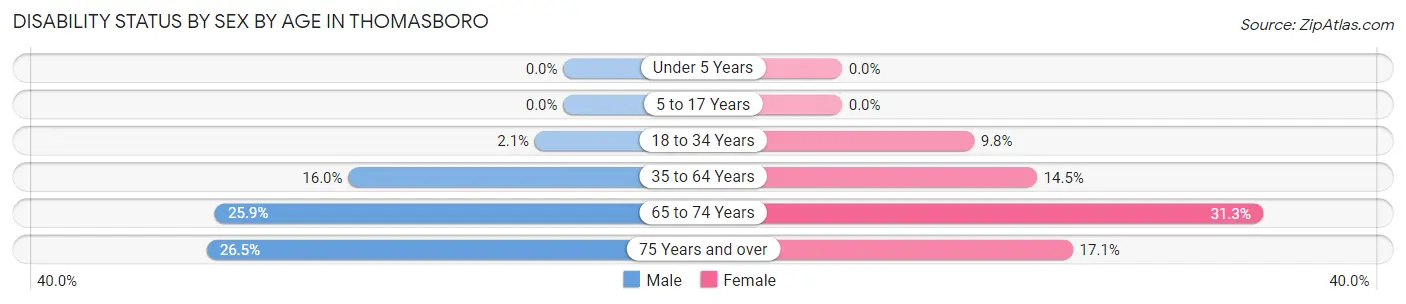
| Age Bracket | Male | Female |
| Under 5 Years | 0 (0.0%) | 0 (0.0%) |
| 5 to 17 Years | 0 (0.0%) | 0 (0.0%) |
| 18 to 34 Years | 2 (2.1%) | 10 (9.8%) |
| 35 to 64 Years | 34 (16.0%) | 33 (14.5%) |
| 65 to 74 Years | 15 (25.9%) | 25 (31.2%) |
| 75 Years and over | 9 (26.5%) | 6 (17.1%) |
Disability Class by Sex by Age in Thomasboro
Disability Class: Hearing Difficulty
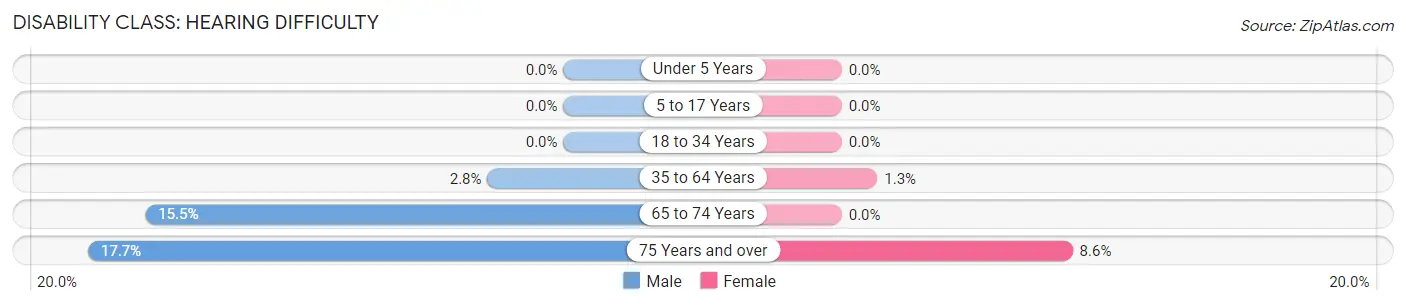
| Age Bracket | Male | Female |
| Under 5 Years | 0 (0.0%) | 0 (0.0%) |
| 5 to 17 Years | 0 (0.0%) | 0 (0.0%) |
| 18 to 34 Years | 0 (0.0%) | 0 (0.0%) |
| 35 to 64 Years | 6 (2.8%) | 3 (1.3%) |
| 65 to 74 Years | 9 (15.5%) | 0 (0.0%) |
| 75 Years and over | 6 (17.6%) | 3 (8.6%) |
Disability Class: Vision Difficulty
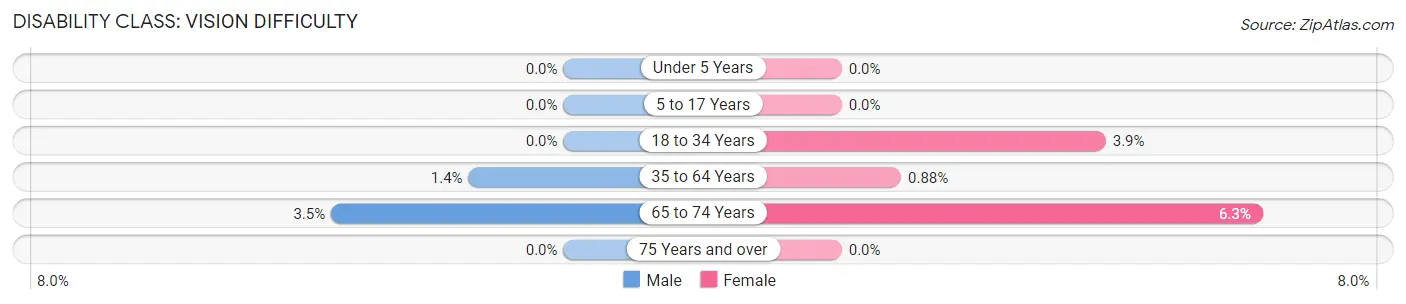
| Age Bracket | Male | Female |
| Under 5 Years | 0 (0.0%) | 0 (0.0%) |
| 5 to 17 Years | 0 (0.0%) | 0 (0.0%) |
| 18 to 34 Years | 0 (0.0%) | 4 (3.9%) |
| 35 to 64 Years | 3 (1.4%) | 2 (0.9%) |
| 65 to 74 Years | 2 (3.5%) | 5 (6.2%) |
| 75 Years and over | 0 (0.0%) | 0 (0.0%) |
Disability Class: Cognitive Difficulty
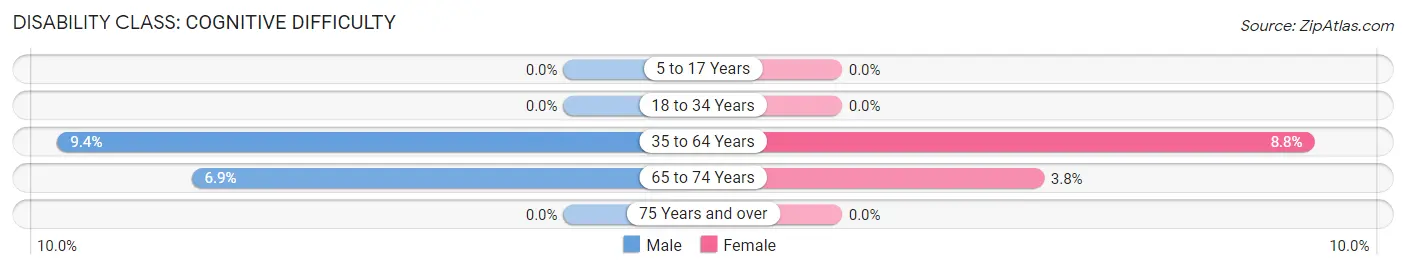
| Age Bracket | Male | Female |
| 5 to 17 Years | 0 (0.0%) | 0 (0.0%) |
| 18 to 34 Years | 0 (0.0%) | 0 (0.0%) |
| 35 to 64 Years | 20 (9.4%) | 20 (8.8%) |
| 65 to 74 Years | 4 (6.9%) | 3 (3.7%) |
| 75 Years and over | 0 (0.0%) | 0 (0.0%) |
Disability Class: Ambulatory Difficulty
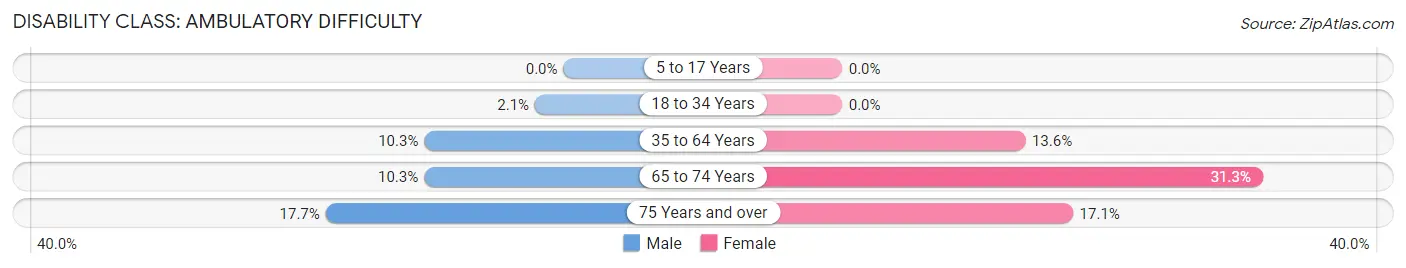
| Age Bracket | Male | Female |
| 5 to 17 Years | 0 (0.0%) | 0 (0.0%) |
| 18 to 34 Years | 2 (2.1%) | 0 (0.0%) |
| 35 to 64 Years | 22 (10.3%) | 31 (13.6%) |
| 65 to 74 Years | 6 (10.3%) | 25 (31.2%) |
| 75 Years and over | 6 (17.6%) | 6 (17.1%) |
Disability Class: Self-Care Difficulty
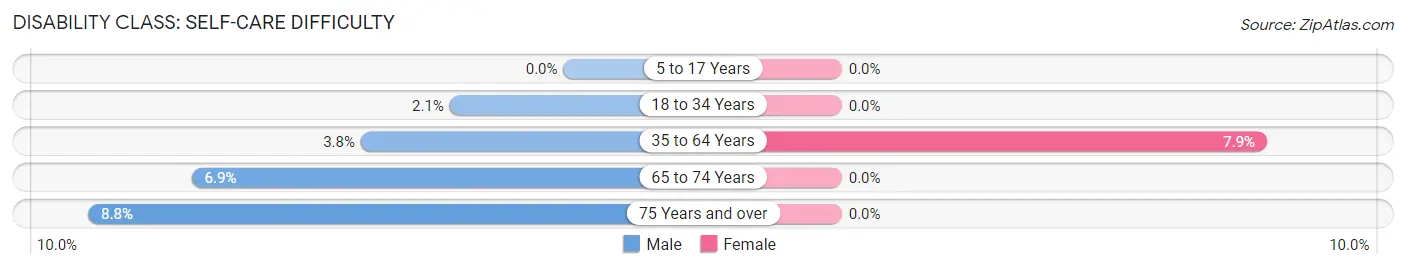
| Age Bracket | Male | Female |
| 5 to 17 Years | 0 (0.0%) | 0 (0.0%) |
| 18 to 34 Years | 2 (2.1%) | 0 (0.0%) |
| 35 to 64 Years | 8 (3.8%) | 18 (7.9%) |
| 65 to 74 Years | 4 (6.9%) | 0 (0.0%) |
| 75 Years and over | 3 (8.8%) | 0 (0.0%) |
Technology Access in Thomasboro
Computing Device Access in Thomasboro
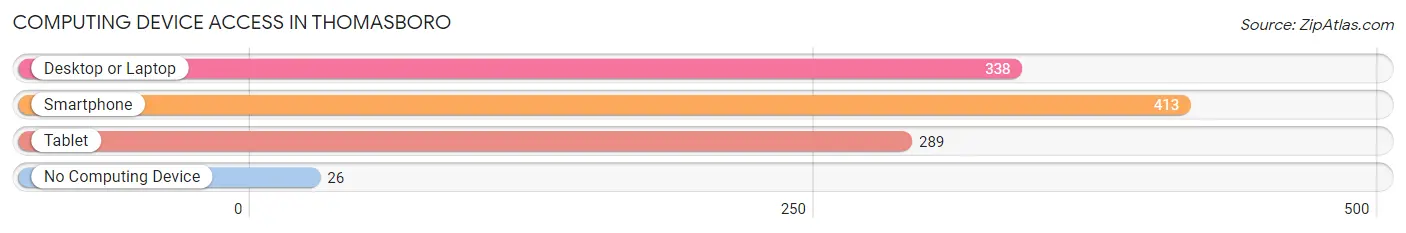
| Device Type | # Households | % Households |
| Desktop or Laptop | 338 | 72.8% |
| Smartphone | 413 | 89.0% |
| Tablet | 289 | 62.3% |
| No Computing Device | 26 | 5.6% |
| Total | 464 | 100.0% |
Internet Access in Thomasboro
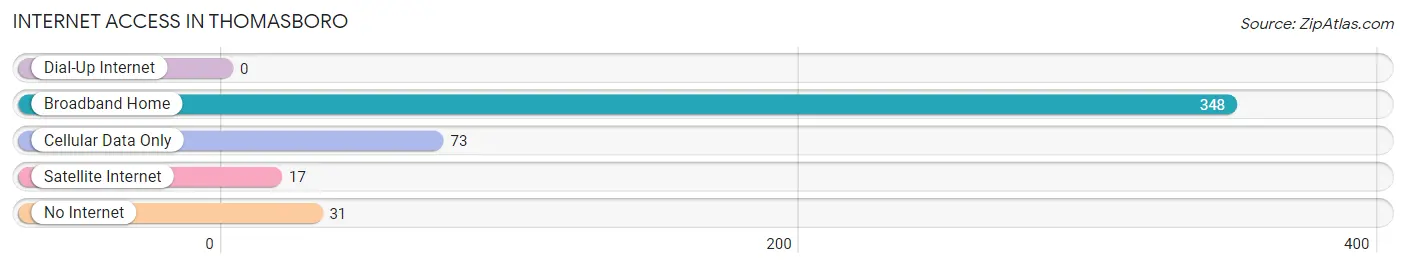
| Internet Type | # Households | % Households |
| Dial-Up Internet | 0 | 0.0% |
| Broadband Home | 348 | 75.0% |
| Cellular Data Only | 73 | 15.7% |
| Satellite Internet | 17 | 3.7% |
| No Internet | 31 | 6.7% |
| Total | 464 | 100.0% |
Thomasboro Summary
History
Thomasboro is a small village located in Champaign County, Illinois. It was founded in 1871 by William Thomas, a former slave who had escaped from Kentucky. Thomasboro was originally known as Thomas Station, and was the first African-American settlement in Champaign County. The village was incorporated in 1887 and was named after its founder.
Thomasboro was a thriving community in the late 19th and early 20th centuries. It was home to a variety of businesses, including a hotel, a general store, a blacksmith shop, a barber shop, a livery stable, and a post office. The village also had a school, a church, and a cemetery.
In the early 20th century, Thomasboro began to decline. The Great Depression and the Dust Bowl caused many of the businesses to close, and the population began to dwindle. By the 1950s, the village was nearly abandoned.
In the late 20th century, Thomasboro began to experience a revival. The village was designated as a historic district in 1989, and many of the original buildings were restored. Today, Thomasboro is a small but vibrant community with a population of about 500.
Geography
Thomasboro is located in the eastern part of Champaign County, Illinois. It is situated on the banks of the Embarras River, about 10 miles south of the city of Champaign. The village is surrounded by rolling hills and farmland.
The climate in Thomasboro is typical of the Midwest, with hot summers and cold winters. The average temperature in July is 79°F, and the average temperature in January is 24°F. The average annual precipitation is about 37 inches.
Economy
The economy of Thomasboro is largely based on agriculture. The village is surrounded by farmland, and many of the residents are employed in the agricultural industry. Other industries in the area include manufacturing, retail, and tourism.
The village also has a few small businesses, including a restaurant, a barber shop, and a general store. There is also a post office in the village.
Demographics
As of the 2010 census, the population of Thomasboro was 498. The racial makeup of the village was 97.2% White, 0.8% African American, 0.2% Native American, 0.2% Asian, and 1.6% from other races. The median household income was $45,000, and the median age was 40.
Thomasboro is a small but diverse community. The village is home to a variety of cultures and religions, including Christianity, Judaism, and Islam. The village also has a strong sense of community, and many of the residents are involved in local organizations and events.
Common Questions
What is Per Capita Income in Thomasboro?
Per Capita income in Thomasboro is $42,819.
What is the Median Family Income in Thomasboro?
Median Family Income in Thomasboro is $100,500.
What is the Median Household income in Thomasboro?
Median Household Income in Thomasboro is $60,833.
What is Income or Wage Gap in Thomasboro?
Income or Wage Gap in Thomasboro is 15.1%.
Women in Thomasboro earn 84.9 cents for every dollar earned by a man.
What is Inequality or Gini Index in Thomasboro?
Inequality or Gini Index in Thomasboro is 0.47.
What is the Total Population of Thomasboro?
Total Population of Thomasboro is 1,023.
What is the Total Male Population of Thomasboro?
Total Male Population of Thomasboro is 488.
What is the Total Female Population of Thomasboro?
Total Female Population of Thomasboro is 535.
What is the Ratio of Males per 100 Females in Thomasboro?
There are 91.21 Males per 100 Females in Thomasboro.
What is the Ratio of Females per 100 Males in Thomasboro?
There are 109.63 Females per 100 Males in Thomasboro.
What is the Median Population Age in Thomasboro?
Median Population Age in Thomasboro is 46.3 Years.
What is the Average Family Size in Thomasboro
Average Family Size in Thomasboro is 2.8 People.
What is the Average Household Size in Thomasboro
Average Household Size in Thomasboro is 2.2 People.
How Large is the Labor Force in Thomasboro?
There are 546 People in the Labor Forcein in Thomasboro.
What is the Percentage of People in the Labor Force in Thomasboro?
62.8% of People are in the Labor Force in Thomasboro.
What is the Unemployment Rate in Thomasboro?
Unemployment Rate in Thomasboro is 4.1%.