Fox Lake, IL Map & Demographics
Fox Lake Map
Fox Lake Overview
$42,676
PER CAPITA INCOME
$102,104
AVG FAMILY INCOME
$65,528
AVG HOUSEHOLD INCOME
20.6%
WAGE / INCOME GAP [ % ]
79.4¢/ $1
WAGE / INCOME GAP [ $ ]
0.46
INEQUALITY / GINI INDEX
10,798
TOTAL POPULATION
4,983
MALE POPULATION
5,815
FEMALE POPULATION
85.69
MALES / 100 FEMALES
116.70
FEMALES / 100 MALES
47.3
MEDIAN AGE
2.8
AVG FAMILY SIZE
2.1
AVG HOUSEHOLD SIZE
5,823
LABOR FORCE [ PEOPLE ]
62.2%
PERCENT IN LABOR FORCE
3.3%
UNEMPLOYMENT RATE
Fox Lake Zip Codes
Income in Fox Lake
Income Overview in Fox Lake
Per Capita Income in Fox Lake is $42,676, while median incomes of families and households are $102,104 and $65,528 respectively.
| Characteristic | Number | Measure |
| Per Capita Income | 10,798 | $42,676 |
| Median Family Income | 2,757 | $102,104 |
| Mean Family Income | 2,757 | $110,992 |
| Median Household Income | 5,191 | $65,528 |
| Mean Household Income | 5,191 | $87,021 |
| Income Deficit | 2,757 | $0 |
| Wage / Income Gap (%) | 10,798 | 20.60% |
| Wage / Income Gap ($) | 10,798 | 79.40¢ per $1 |
| Gini / Inequality Index | 10,798 | 0.46 |
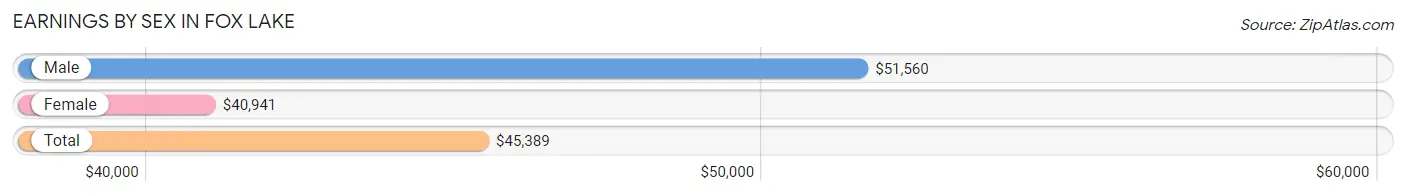
Earnings by Sex in Fox Lake
Average Earnings in Fox Lake are $45,389, $51,560 for men and $40,941 for women, a difference of 20.6%.
| Sex | Number | Average Earnings |
| Male | 2,818 (46.0%) | $51,560 |
| Female | 3,313 (54.0%) | $40,941 |
| Total | 6,131 (100.0%) | $45,389 |
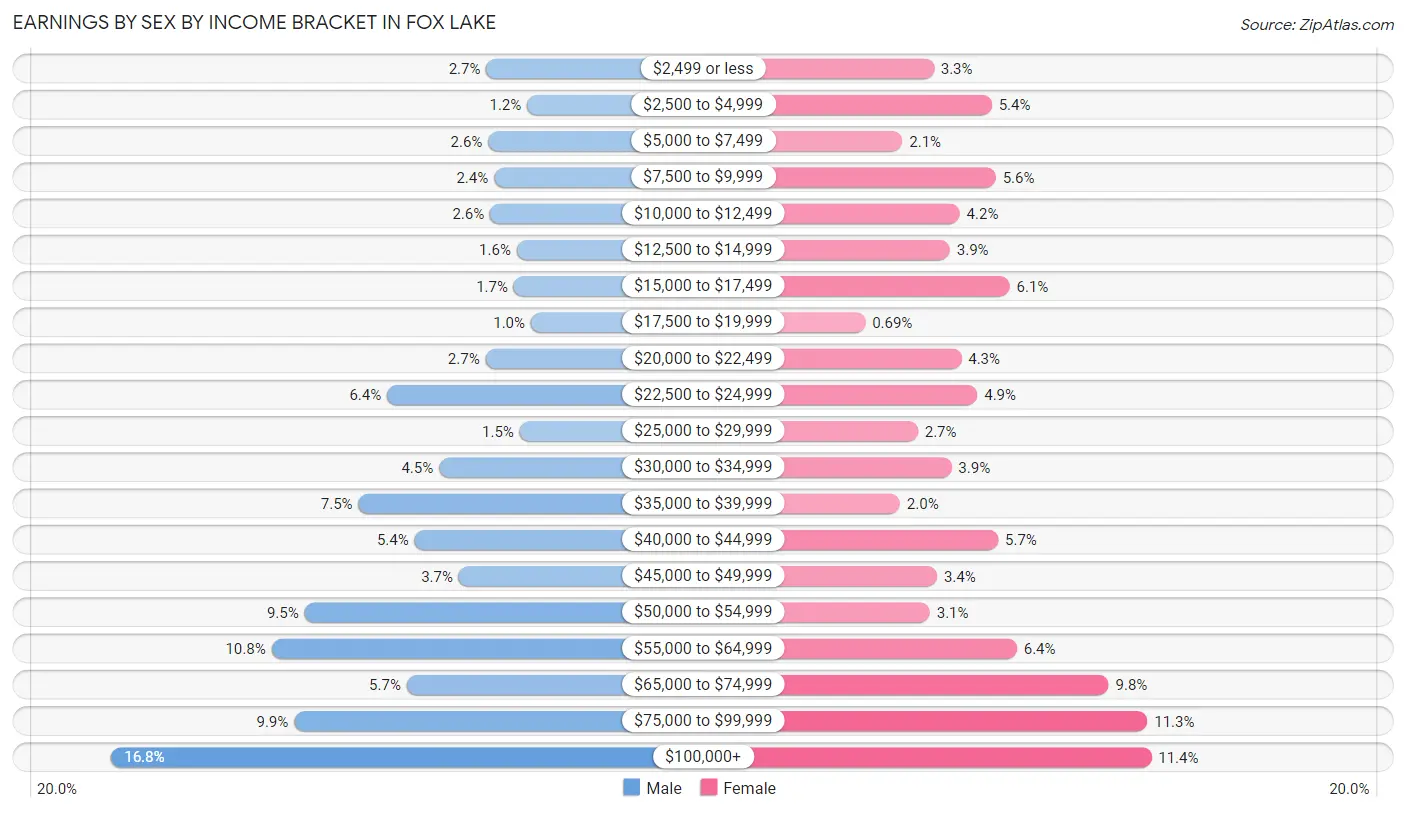
Earnings by Sex by Income Bracket in Fox Lake
The most common earnings brackets in Fox Lake are $100,000+ for men (472 | 16.8%) and $100,000+ for women (378 | 11.4%).
| Income | Male | Female |
| $2,499 or less | 76 (2.7%) | 108 (3.3%) |
| $2,500 to $4,999 | 33 (1.2%) | 180 (5.4%) |
| $5,000 to $7,499 | 74 (2.6%) | 69 (2.1%) |
| $7,500 to $9,999 | 68 (2.4%) | 185 (5.6%) |
| $10,000 to $12,499 | 72 (2.6%) | 140 (4.2%) |
| $12,500 to $14,999 | 44 (1.6%) | 128 (3.9%) |
| $15,000 to $17,499 | 47 (1.7%) | 202 (6.1%) |
| $17,500 to $19,999 | 29 (1.0%) | 23 (0.7%) |
| $20,000 to $22,499 | 77 (2.7%) | 142 (4.3%) |
| $22,500 to $24,999 | 181 (6.4%) | 162 (4.9%) |
| $25,000 to $29,999 | 41 (1.5%) | 88 (2.7%) |
| $30,000 to $34,999 | 126 (4.5%) | 130 (3.9%) |
| $35,000 to $39,999 | 211 (7.5%) | 66 (2.0%) |
| $40,000 to $44,999 | 152 (5.4%) | 188 (5.7%) |
| $45,000 to $49,999 | 105 (3.7%) | 112 (3.4%) |
| $50,000 to $54,999 | 268 (9.5%) | 103 (3.1%) |
| $55,000 to $64,999 | 303 (10.7%) | 211 (6.4%) |
| $65,000 to $74,999 | 160 (5.7%) | 325 (9.8%) |
| $75,000 to $99,999 | 279 (9.9%) | 373 (11.3%) |
| $100,000+ | 472 (16.8%) | 378 (11.4%) |
| Total | 2,818 (100.0%) | 3,313 (100.0%) |
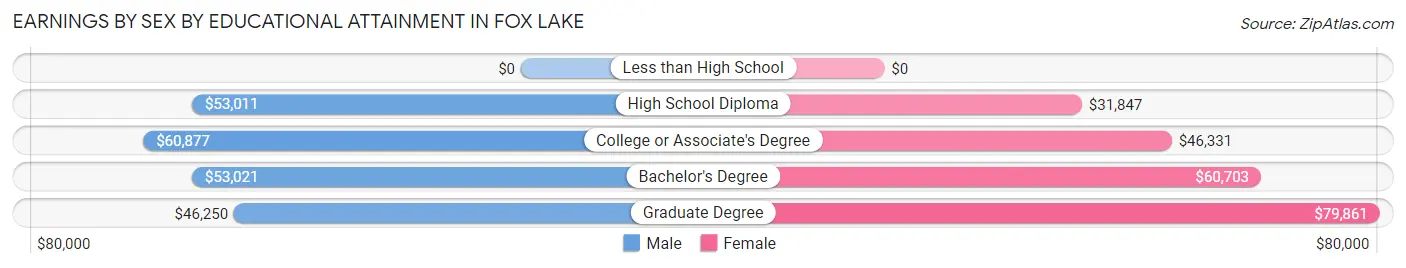
Earnings by Sex by Educational Attainment in Fox Lake
Average earnings in Fox Lake are $54,583 for men and $47,331 for women, a difference of 13.3%. Men with an educational attainment of college or associate's degree enjoy the highest average annual earnings of $60,877, while those with graduate degree education earn the least with $46,250. Women with an educational attainment of graduate degree earn the most with the average annual earnings of $79,861, while those with high school diploma education have the smallest earnings of $31,847.
| Educational Attainment | Male Income | Female Income |
| Less than High School | - | - |
| High School Diploma | $53,011 | $31,847 |
| College or Associate's Degree | $60,877 | $46,331 |
| Bachelor's Degree | $53,021 | $60,703 |
| Graduate Degree | $46,250 | $79,861 |
| Total | $54,583 | $47,331 |
Family Income in Fox Lake
Family Income Brackets in Fox Lake
According to the Fox Lake family income data, there are 822 families falling into the $100,000 to $149,999 income range, which is the most common income bracket and makes up 29.8% of all families. Conversely, the less than $10,000 income bracket is the least frequent group with only 36 families (1.3%) belonging to this category.
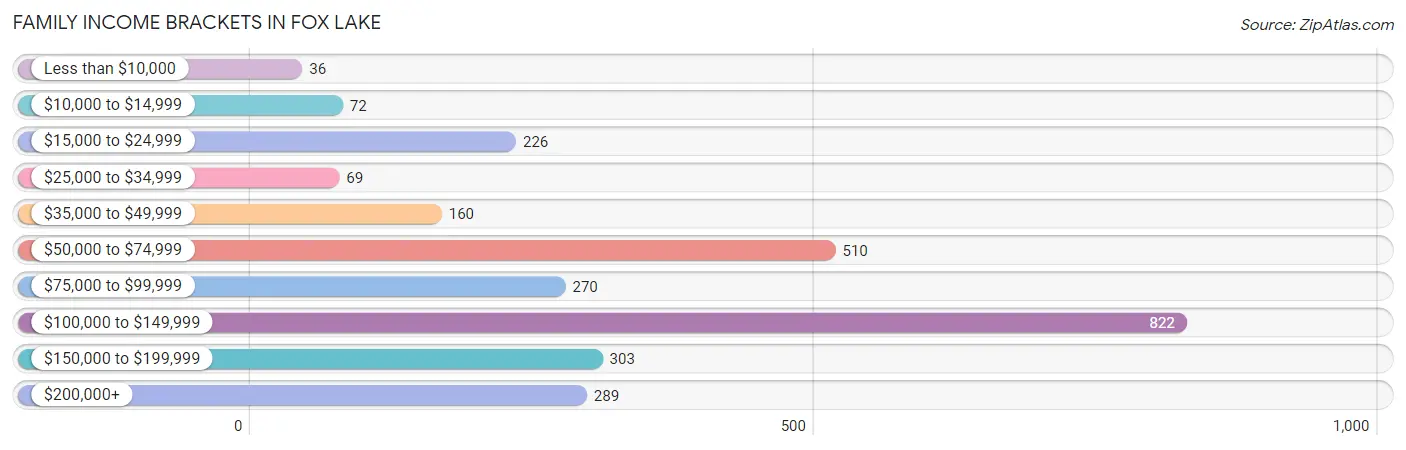
| Income Bracket | # Families | % Families |
| Less than $10,000 | 36 | 1.3% |
| $10,000 to $14,999 | 72 | 2.6% |
| $15,000 to $24,999 | 226 | 8.2% |
| $25,000 to $34,999 | 69 | 2.5% |
| $35,000 to $49,999 | 160 | 5.8% |
| $50,000 to $74,999 | 510 | 18.5% |
| $75,000 to $99,999 | 270 | 9.8% |
| $100,000 to $149,999 | 822 | 29.8% |
| $150,000 to $199,999 | 303 | 11.0% |
| $200,000+ | 289 | 10.5% |
Family Income by Famaliy Size in Fox Lake
6-person families (60 | 2.2%) account for the highest median family income in Fox Lake with $159,167 per family, while 2-person families (1,761 | 63.9%) have the highest median income of $45,062 per family member.
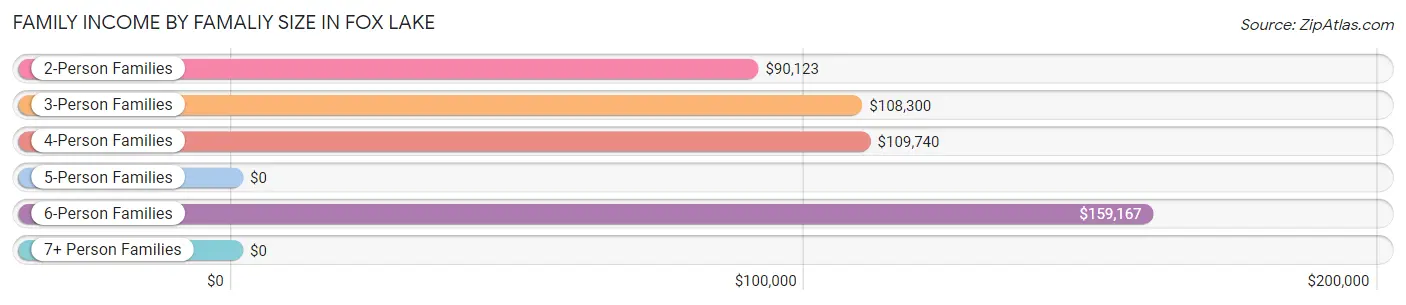
| Income Bracket | # Families | Median Income |
| 2-Person Families | 1,761 (63.9%) | $90,123 |
| 3-Person Families | 438 (15.9%) | $108,300 |
| 4-Person Families | 333 (12.1%) | $109,740 |
| 5-Person Families | 165 (6.0%) | $0 |
| 6-Person Families | 60 (2.2%) | $159,167 |
| 7+ Person Families | 0 (0.0%) | $0 |
| Total | 2,757 (100.0%) | $102,104 |
Family Income by Number of Earners in Fox Lake
The median family income in Fox Lake is $102,104, with families comprising 3+ earners (291) having the highest median family income of $149,494, while families with no earners (483) have the lowest median family income of $44,583, accounting for 10.5% and 17.5% of families, respectively.
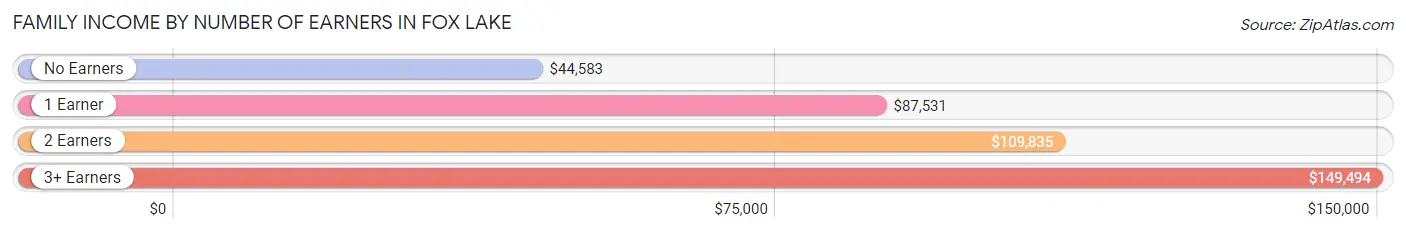
| Number of Earners | # Families | Median Income |
| No Earners | 483 (17.5%) | $44,583 |
| 1 Earner | 807 (29.3%) | $87,531 |
| 2 Earners | 1,176 (42.7%) | $109,835 |
| 3+ Earners | 291 (10.5%) | $149,494 |
| Total | 2,757 (100.0%) | $102,104 |
Household Income in Fox Lake
Household Income Brackets in Fox Lake
With 1,080 households falling in the category, the $100,000 to $149,999 income range is the most frequent in Fox Lake, accounting for 20.8% of all households. In contrast, only 208 households (4.0%) fall into the $10,000 to $14,999 income bracket, making it the least populous group.
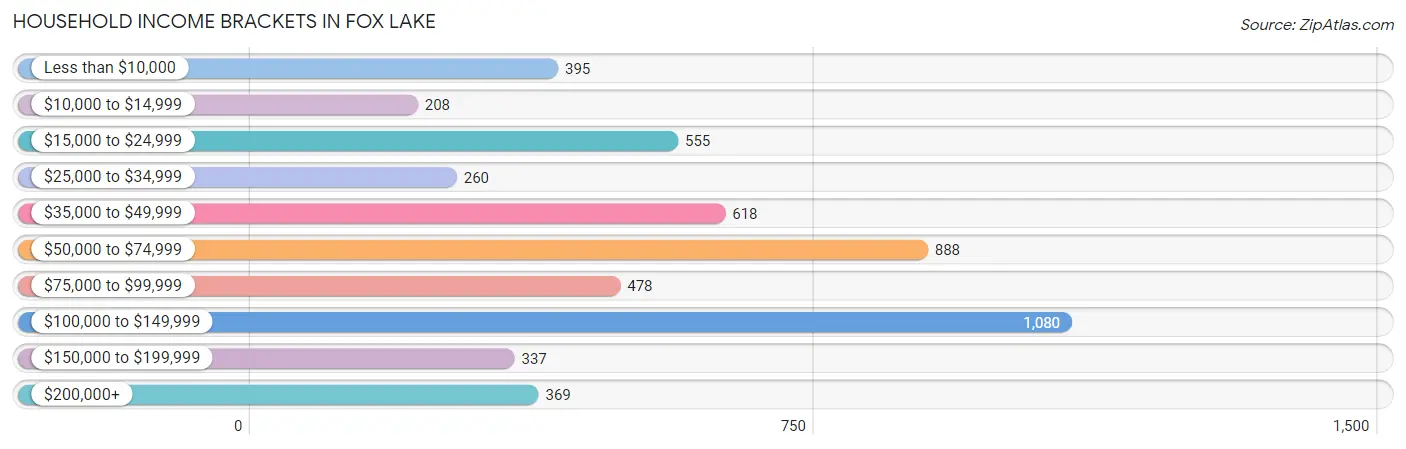
| Income Bracket | # Households | % Households |
| Less than $10,000 | 395 | 7.6% |
| $10,000 to $14,999 | 208 | 4.0% |
| $15,000 to $24,999 | 555 | 10.7% |
| $25,000 to $34,999 | 260 | 5.0% |
| $35,000 to $49,999 | 618 | 11.9% |
| $50,000 to $74,999 | 888 | 17.1% |
| $75,000 to $99,999 | 478 | 9.2% |
| $100,000 to $149,999 | 1,080 | 20.8% |
| $150,000 to $199,999 | 337 | 6.5% |
| $200,000+ | 369 | 7.1% |
Household Income by Householder Age in Fox Lake
The median household income in Fox Lake is $65,528, with the highest median household income of $100,469 found in the 25 to 44 years age bracket for the primary householder. A total of 1,270 households (24.5%) fall into this category. Meanwhile, the 15 to 24 years age bracket for the primary householder has the lowest median household income of $22,606, with 174 households (3.4%) in this group.
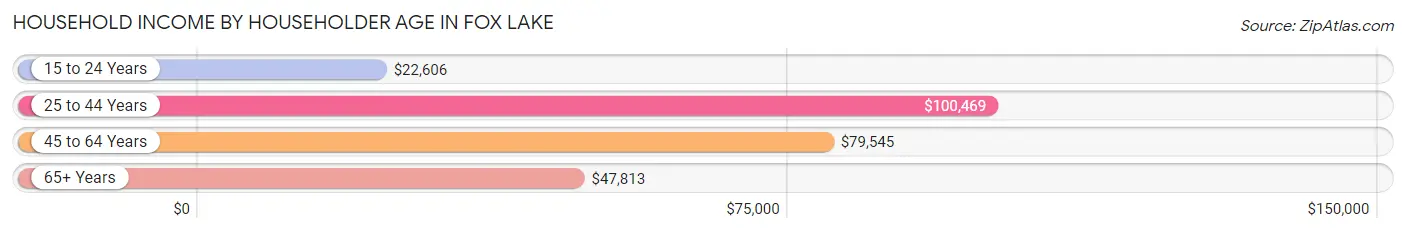
| Income Bracket | # Households | Median Income |
| 15 to 24 Years | 174 (3.4%) | $22,606 |
| 25 to 44 Years | 1,270 (24.5%) | $100,469 |
| 45 to 64 Years | 2,062 (39.7%) | $79,545 |
| 65+ Years | 1,685 (32.5%) | $47,813 |
| Total | 5,191 (100.0%) | $65,528 |
Poverty in Fox Lake
Income Below Poverty by Sex and Age in Fox Lake
With 7.6% poverty level for males and 19.2% for females among the residents of Fox Lake, 12 to 14 year old males and 6 to 11 year old females are the most vulnerable to poverty, with 89 males (39.2%) and 118 females (50.2%) in their respective age groups living below the poverty level.
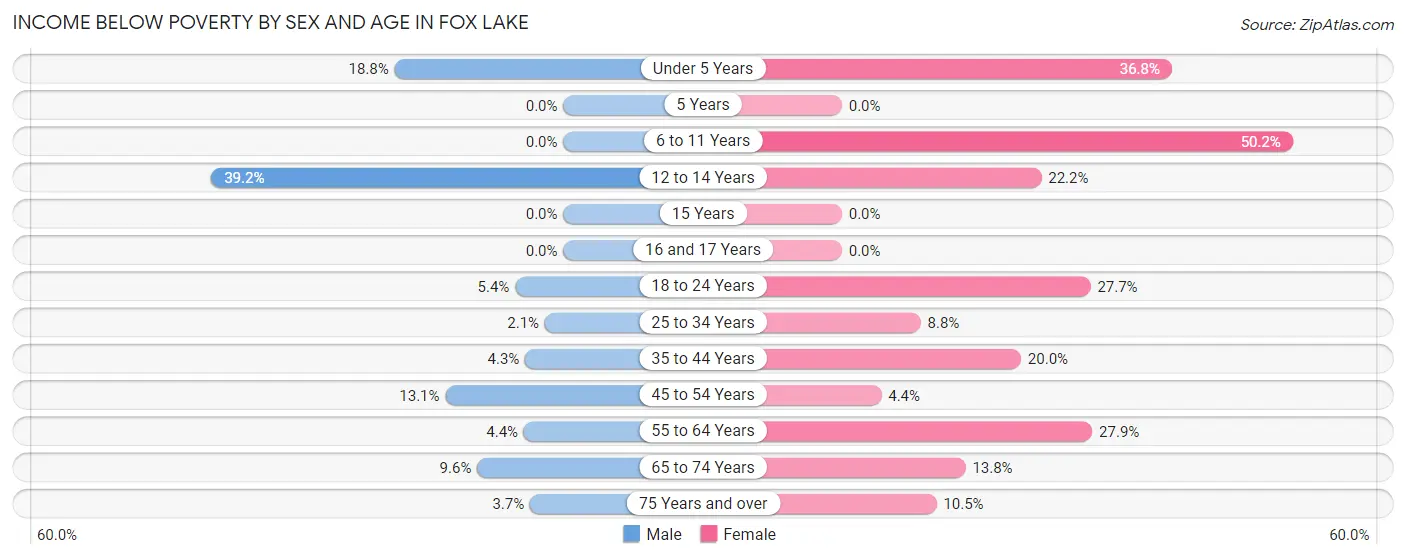
| Age Bracket | Male | Female |
| Under 5 Years | 22 (18.8%) | 140 (36.7%) |
| 5 Years | 0 (0.0%) | 0 (0.0%) |
| 6 to 11 Years | 0 (0.0%) | 118 (50.2%) |
| 12 to 14 Years | 89 (39.2%) | 22 (22.2%) |
| 15 Years | 0 (0.0%) | 0 (0.0%) |
| 16 and 17 Years | 0 (0.0%) | 0 (0.0%) |
| 18 to 24 Years | 20 (5.4%) | 139 (27.7%) |
| 25 to 34 Years | 16 (2.1%) | 41 (8.8%) |
| 35 to 44 Years | 24 (4.3%) | 167 (20.0%) |
| 45 to 54 Years | 90 (13.1%) | 31 (4.4%) |
| 55 to 64 Years | 30 (4.4%) | 283 (27.9%) |
| 65 to 74 Years | 65 (9.6%) | 111 (13.8%) |
| 75 Years and over | 17 (3.7%) | 60 (10.5%) |
| Total | 373 (7.6%) | 1,112 (19.2%) |
Income Above Poverty by Sex and Age in Fox Lake
According to the poverty statistics in Fox Lake, males aged 5 years and females aged 5 years are the age groups that are most secure financially, with 100.0% of males and 100.0% of females in these age groups living above the poverty line.
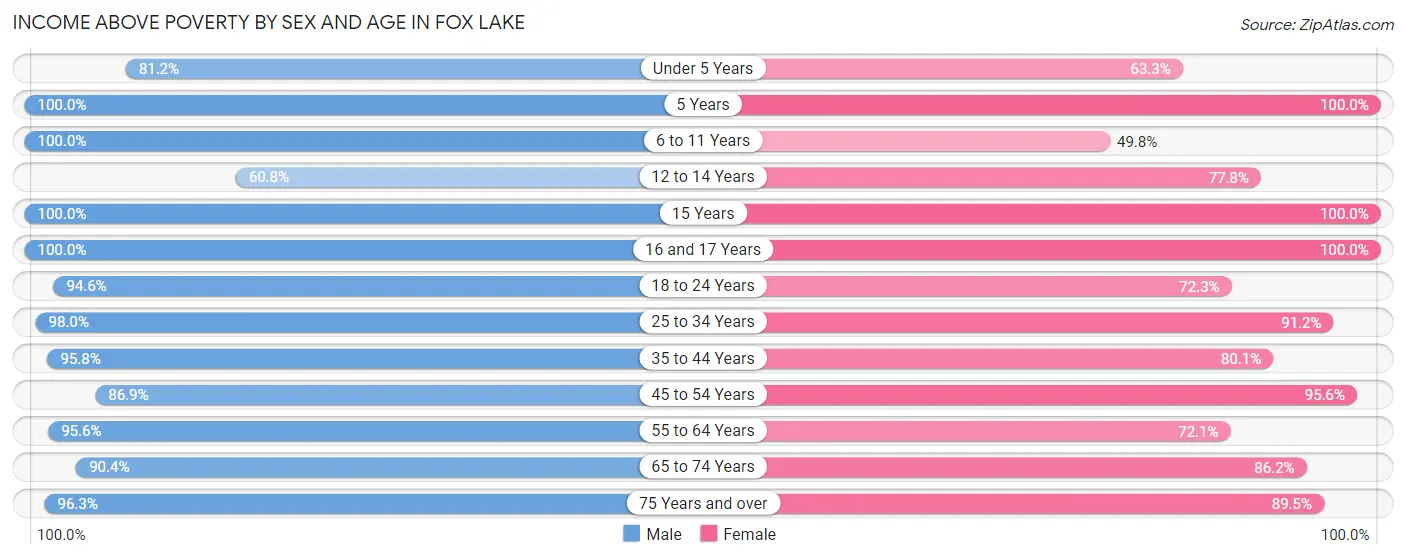
| Age Bracket | Male | Female |
| Under 5 Years | 95 (81.2%) | 241 (63.2%) |
| 5 Years | 11 (100.0%) | 20 (100.0%) |
| 6 to 11 Years | 281 (100.0%) | 117 (49.8%) |
| 12 to 14 Years | 138 (60.8%) | 77 (77.8%) |
| 15 Years | 4 (100.0%) | 23 (100.0%) |
| 16 and 17 Years | 61 (100.0%) | 128 (100.0%) |
| 18 to 24 Years | 353 (94.6%) | 363 (72.3%) |
| 25 to 34 Years | 765 (98.0%) | 426 (91.2%) |
| 35 to 44 Years | 541 (95.8%) | 670 (80.0%) |
| 45 to 54 Years | 595 (86.9%) | 673 (95.6%) |
| 55 to 64 Years | 653 (95.6%) | 732 (72.1%) |
| 65 to 74 Years | 613 (90.4%) | 695 (86.2%) |
| 75 Years and over | 441 (96.3%) | 509 (89.5%) |
| Total | 4,551 (92.4%) | 4,674 (80.8%) |
Income Below Poverty Among Married-Couple Families in Fox Lake
The poverty statistics for married-couple families in Fox Lake show that 3.0% or 61 of the total 2,010 families live below the poverty line. Families with 1 or 2 children have the highest poverty rate of 10.2%, comprising of 47 families. On the other hand, families with 3 or 4 children have the lowest poverty rate of 0.0%, which includes 0 families.
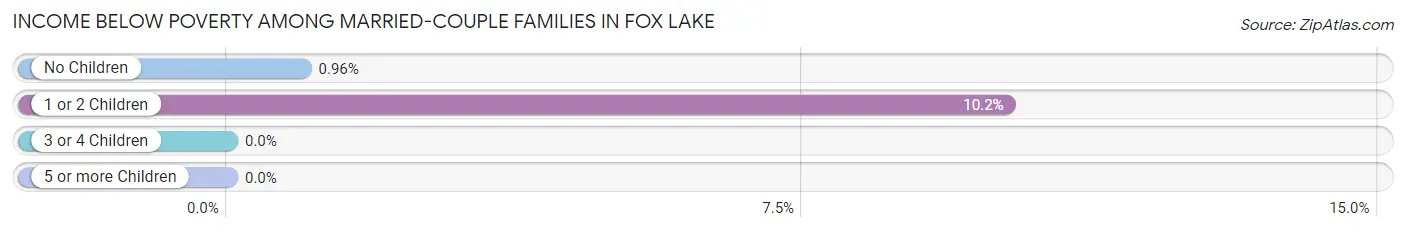
| Children | Above Poverty | Below Poverty |
| No Children | 1,438 (99.0%) | 14 (1.0%) |
| 1 or 2 Children | 416 (89.8%) | 47 (10.2%) |
| 3 or 4 Children | 95 (100.0%) | 0 (0.0%) |
| 5 or more Children | 0 (0.0%) | 0 (0.0%) |
| Total | 1,949 (97.0%) | 61 (3.0%) |
Income Below Poverty Among Single-Parent Households in Fox Lake
According to the poverty data in Fox Lake, 27.1% or 33 single-father households and 22.1% or 138 single-mother households are living below the poverty line. Among single-father households, those with no children have the highest poverty rate, with 15 households (100.0%) experiencing poverty. Likewise, among single-mother households, those with 3 or 4 children have the highest poverty rate, with 17 households (100.0%) falling below the poverty line.
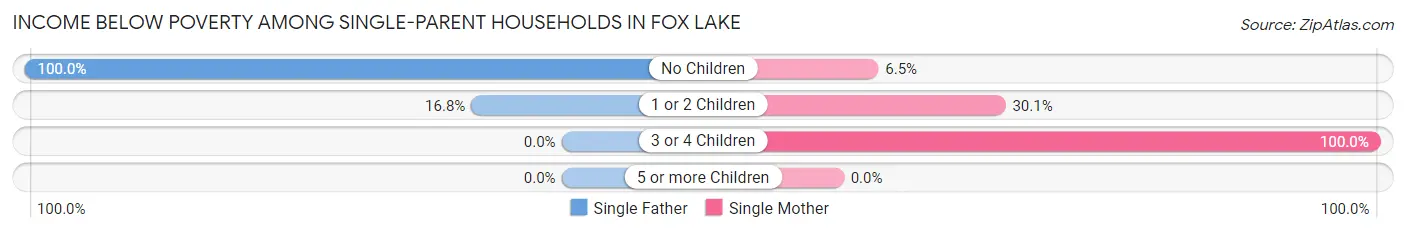
| Children | Single Father | Single Mother |
| No Children | 15 (100.0%) | 17 (6.5%) |
| 1 or 2 Children | 18 (16.8%) | 104 (30.1%) |
| 3 or 4 Children | 0 (0.0%) | 17 (100.0%) |
| 5 or more Children | 0 (0.0%) | 0 (0.0%) |
| Total | 33 (27.1%) | 138 (22.1%) |
Income Below Poverty Among Married-Couple vs Single-Parent Households in Fox Lake
The poverty data for Fox Lake shows that 61 of the married-couple family households (3.0%) and 171 of the single-parent households (22.9%) are living below the poverty level. Within the married-couple family households, those with 1 or 2 children have the highest poverty rate, with 47 households (10.2%) falling below the poverty line. Among the single-parent households, those with 3 or 4 children have the highest poverty rate, with 17 household (100.0%) living below poverty.
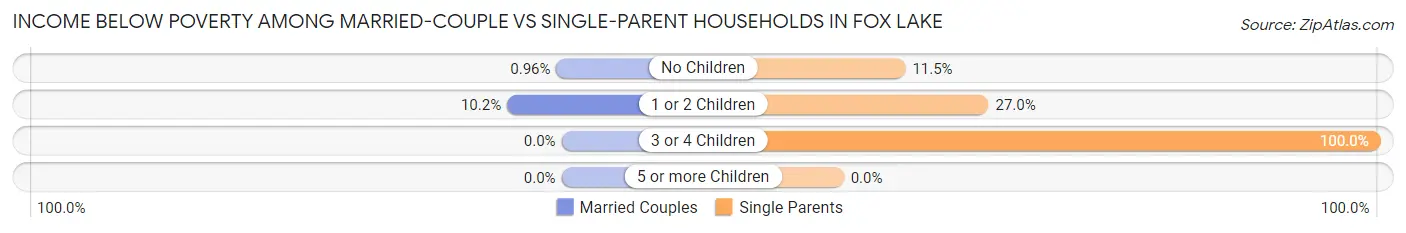
| Children | Married-Couple Families | Single-Parent Households |
| No Children | 14 (1.0%) | 32 (11.5%) |
| 1 or 2 Children | 47 (10.2%) | 122 (27.0%) |
| 3 or 4 Children | 0 (0.0%) | 17 (100.0%) |
| 5 or more Children | 0 (0.0%) | 0 (0.0%) |
| Total | 61 (3.0%) | 171 (22.9%) |
Race in Fox Lake
The most populous races in Fox Lake are White / Caucasian (9,034 | 83.7%), Hispanic or Latino (1,611 | 14.9%), and Two or more Races (1,117 | 10.3%).
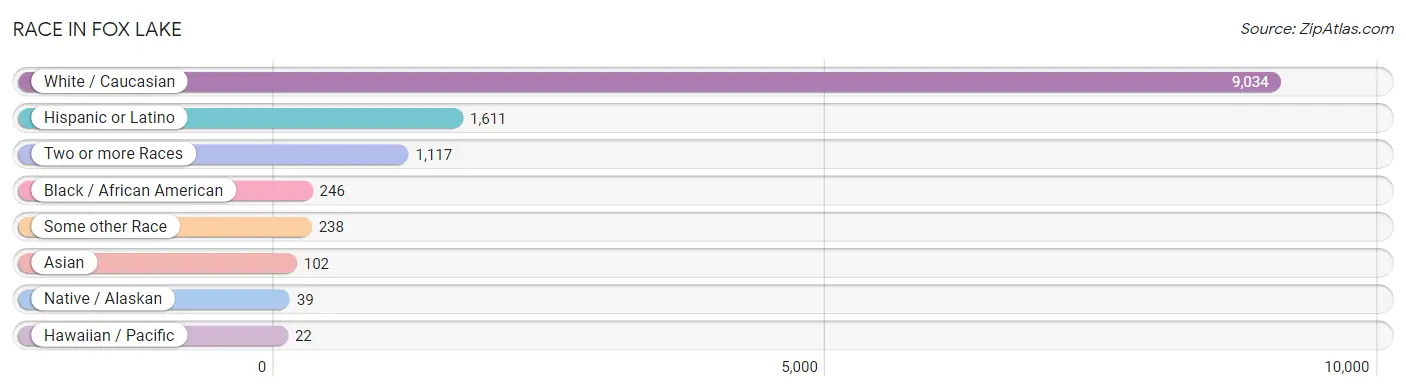
| Race | # Population | % Population |
| Asian | 102 | 0.9% |
| Black / African American | 246 | 2.3% |
| Hawaiian / Pacific | 22 | 0.2% |
| Hispanic or Latino | 1,611 | 14.9% |
| Native / Alaskan | 39 | 0.4% |
| White / Caucasian | 9,034 | 83.7% |
| Two or more Races | 1,117 | 10.3% |
| Some other Race | 238 | 2.2% |
| Total | 10,798 | 100.0% |
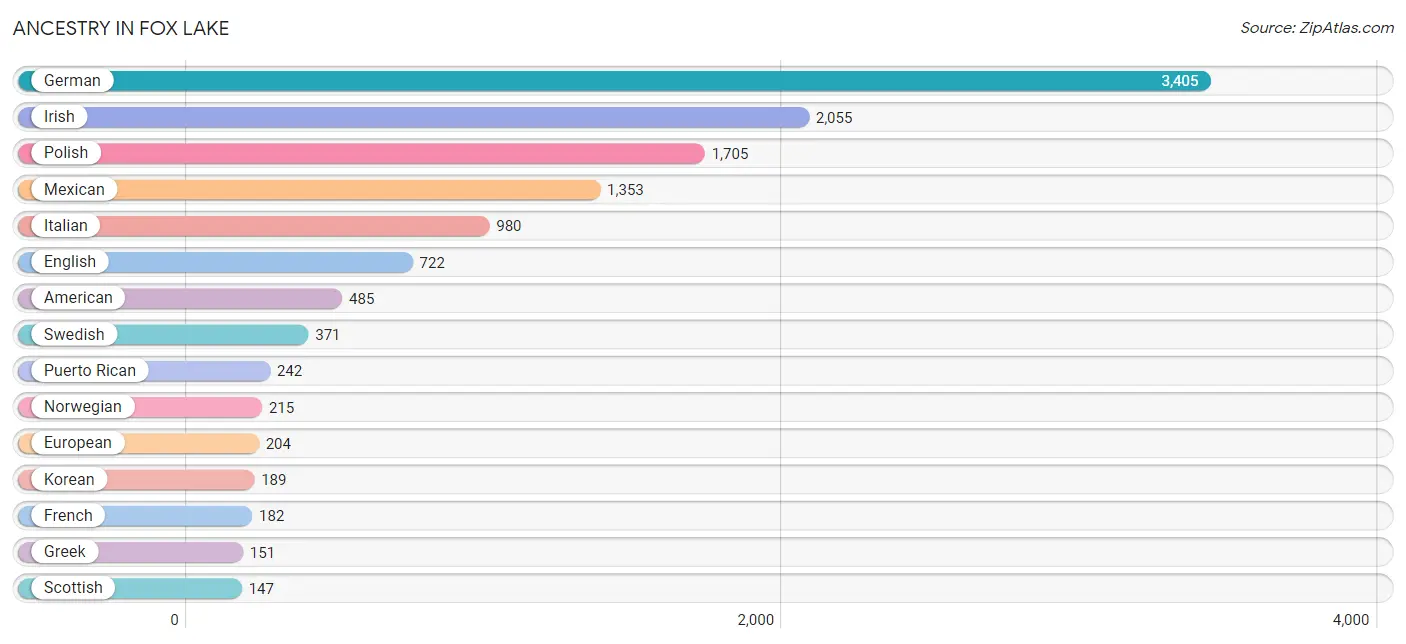
Ancestry in Fox Lake
The most populous ancestries reported in Fox Lake are German (3,405 | 31.5%), Irish (2,055 | 19.0%), Polish (1,705 | 15.8%), Mexican (1,353 | 12.5%), and Italian (980 | 9.1%), together accounting for 88.0% of all Fox Lake residents.
| Ancestry | # Population | % Population |
| American | 485 | 4.5% |
| Arab | 10 | 0.1% |
| Australian | 16 | 0.2% |
| Austrian | 37 | 0.3% |
| Bhutanese | 37 | 0.3% |
| Brazilian | 42 | 0.4% |
| British | 26 | 0.2% |
| Canadian | 43 | 0.4% |
| Cherokee | 37 | 0.3% |
| Croatian | 52 | 0.5% |
| Cuban | 16 | 0.2% |
| Czech | 129 | 1.2% |
| Danish | 37 | 0.3% |
| Dutch | 105 | 1.0% |
| Eastern European | 23 | 0.2% |
| English | 722 | 6.7% |
| Estonian | 16 | 0.2% |
| European | 204 | 1.9% |
| Finnish | 40 | 0.4% |
| French | 182 | 1.7% |
| French Canadian | 21 | 0.2% |
| German | 3,405 | 31.5% |
| Greek | 151 | 1.4% |
| Hungarian | 104 | 1.0% |
| Irish | 2,055 | 19.0% |
| Italian | 980 | 9.1% |
| Korean | 189 | 1.8% |
| Lebanese | 10 | 0.1% |
| Lithuanian | 29 | 0.3% |
| Mexican | 1,353 | 12.5% |
| Mexican American Indian | 39 | 0.4% |
| Native Hawaiian | 53 | 0.5% |
| Nigerian | 61 | 0.6% |
| Norwegian | 215 | 2.0% |
| Polish | 1,705 | 15.8% |
| Puerto Rican | 242 | 2.2% |
| Romanian | 95 | 0.9% |
| Russian | 67 | 0.6% |
| Scotch-Irish | 74 | 0.7% |
| Scottish | 147 | 1.4% |
| Slovak | 31 | 0.3% |
| Subsaharan African | 61 | 0.6% |
| Swedish | 371 | 3.4% |
| Swiss | 16 | 0.2% |
| Ukrainian | 29 | 0.3% | View All 45 Rows |
Immigrants in Fox Lake
The most numerous immigrant groups reported in Fox Lake came from Latin America (347 | 3.2%), Europe (344 | 3.2%), Eastern Europe (305 | 2.8%), Central America (289 | 2.7%), and Mexico (289 | 2.7%), together accounting for 14.6% of all Fox Lake residents.
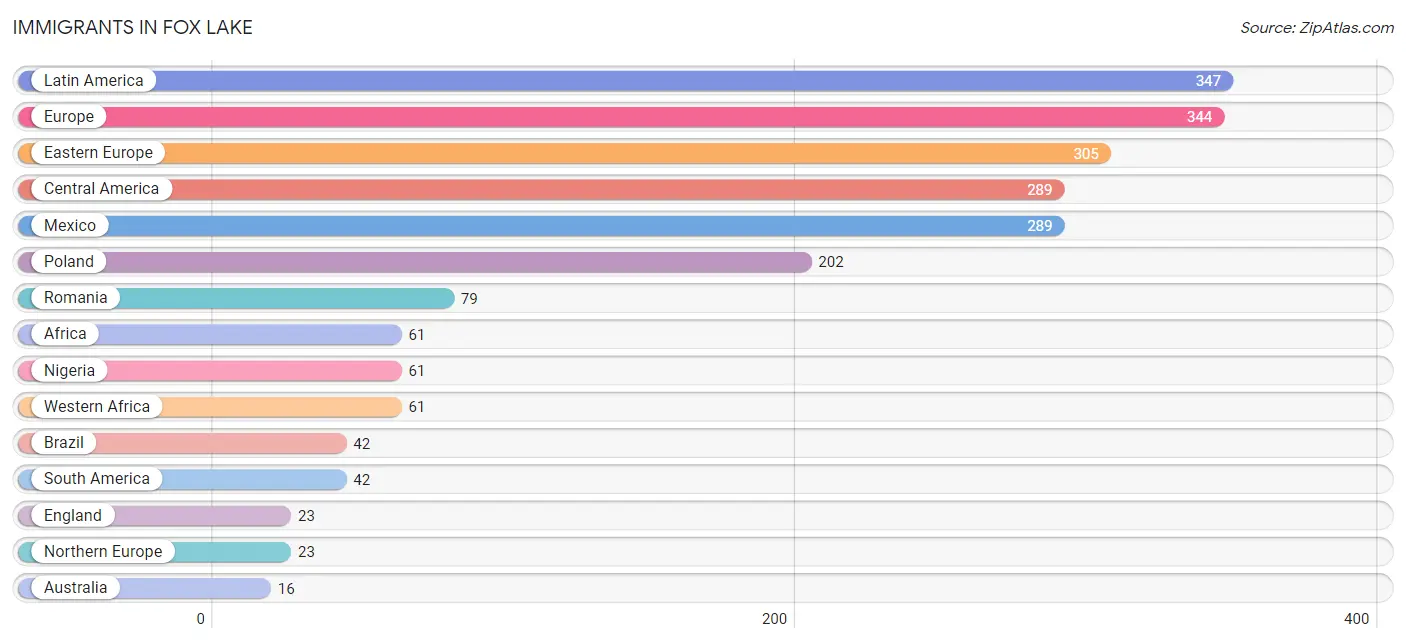
| Immigration Origin | # Population | % Population |
| Africa | 61 | 0.6% |
| Asia | 11 | 0.1% |
| Australia | 16 | 0.2% |
| Austria | 16 | 0.2% |
| Brazil | 42 | 0.4% |
| Caribbean | 16 | 0.2% |
| Central America | 289 | 2.7% |
| Cuba | 16 | 0.2% |
| Czechoslovakia | 14 | 0.1% |
| Eastern Europe | 305 | 2.8% |
| England | 23 | 0.2% |
| Europe | 344 | 3.2% |
| Latin America | 347 | 3.2% |
| Mexico | 289 | 2.7% |
| Nigeria | 61 | 0.6% |
| Northern Europe | 23 | 0.2% |
| Oceania | 16 | 0.2% |
| Philippines | 11 | 0.1% |
| Poland | 202 | 1.9% |
| Romania | 79 | 0.7% |
| Russia | 10 | 0.1% |
| South America | 42 | 0.4% |
| South Eastern Asia | 11 | 0.1% |
| Western Africa | 61 | 0.6% |
| Western Europe | 16 | 0.2% | View All 25 Rows |
Sex and Age in Fox Lake
Sex and Age in Fox Lake
The most populous age groups in Fox Lake are 25 to 29 Years (568 | 11.4%) for men and 55 to 59 Years (708 | 12.2%) for women.
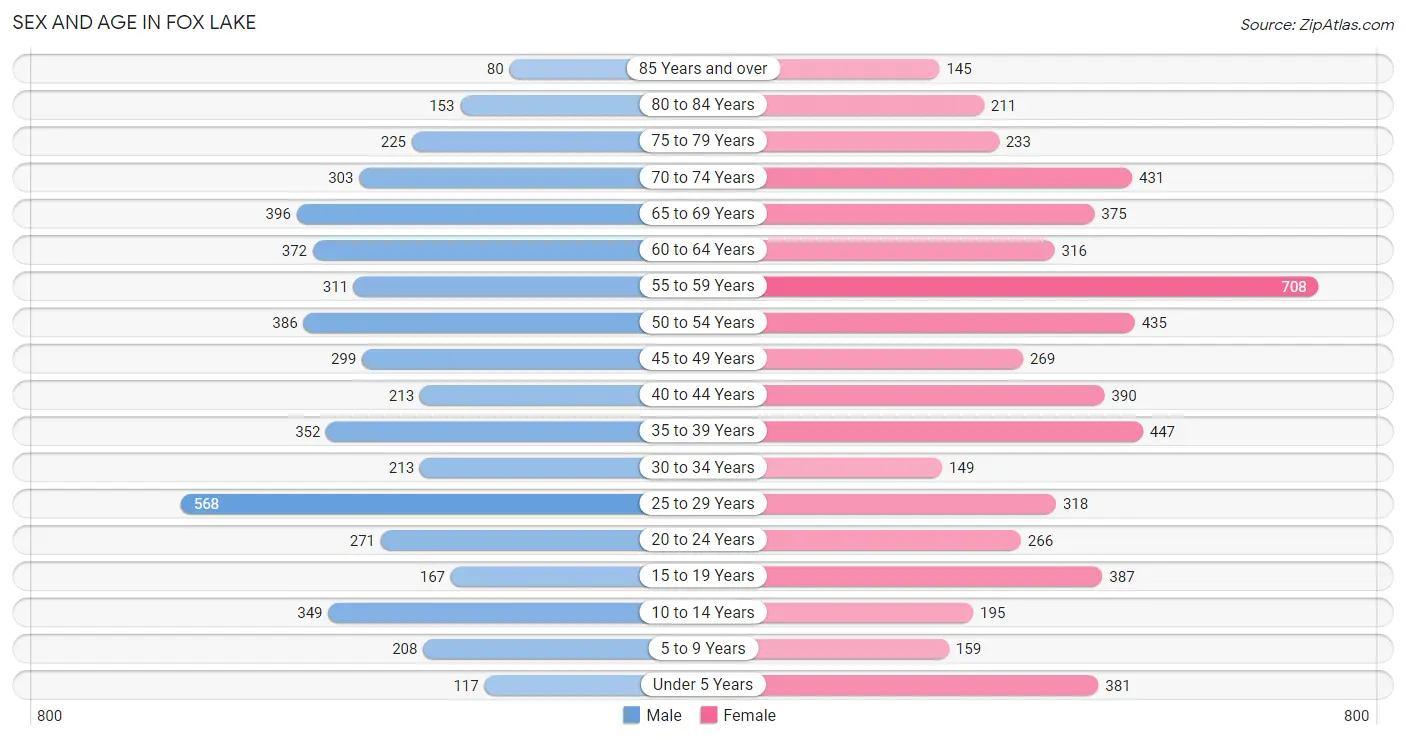
| Age Bracket | Male | Female |
| Under 5 Years | 117 (2.4%) | 381 (6.6%) |
| 5 to 9 Years | 208 (4.2%) | 159 (2.7%) |
| 10 to 14 Years | 349 (7.0%) | 195 (3.4%) |
| 15 to 19 Years | 167 (3.4%) | 387 (6.7%) |
| 20 to 24 Years | 271 (5.4%) | 266 (4.6%) |
| 25 to 29 Years | 568 (11.4%) | 318 (5.5%) |
| 30 to 34 Years | 213 (4.3%) | 149 (2.6%) |
| 35 to 39 Years | 352 (7.1%) | 447 (7.7%) |
| 40 to 44 Years | 213 (4.3%) | 390 (6.7%) |
| 45 to 49 Years | 299 (6.0%) | 269 (4.6%) |
| 50 to 54 Years | 386 (7.7%) | 435 (7.5%) |
| 55 to 59 Years | 311 (6.2%) | 708 (12.2%) |
| 60 to 64 Years | 372 (7.5%) | 316 (5.4%) |
| 65 to 69 Years | 396 (8.0%) | 375 (6.5%) |
| 70 to 74 Years | 303 (6.1%) | 431 (7.4%) |
| 75 to 79 Years | 225 (4.5%) | 233 (4.0%) |
| 80 to 84 Years | 153 (3.1%) | 211 (3.6%) |
| 85 Years and over | 80 (1.6%) | 145 (2.5%) |
| Total | 4,983 (100.0%) | 5,815 (100.0%) |
Families and Households in Fox Lake
Median Family Size in Fox Lake
The median family size in Fox Lake is 2.75 persons per family, with married-couple families (2,010 | 72.9%) accounting for the largest median family size of 2.8 persons per family. On the other hand, single male/father families (122 | 4.4%) represent the smallest median family size with 2.45 persons per family.
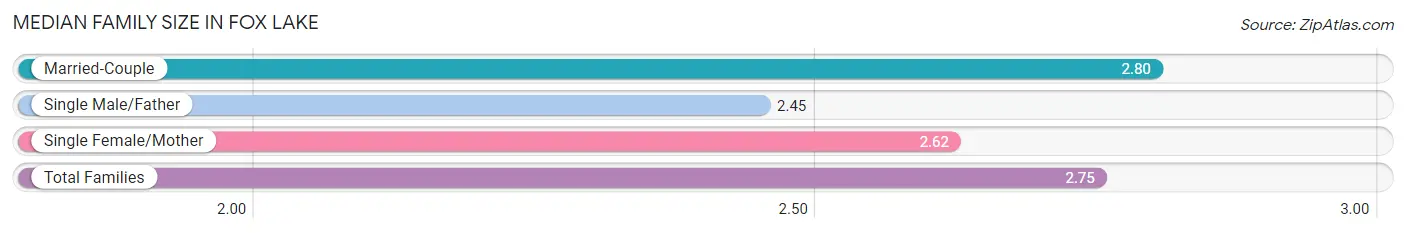
| Family Type | # Families | Family Size |
| Married-Couple | 2,010 (72.9%) | 2.80 |
| Single Male/Father | 122 (4.4%) | 2.45 |
| Single Female/Mother | 625 (22.7%) | 2.62 |
| Total Families | 2,757 (100.0%) | 2.75 |
Median Household Size in Fox Lake
The median household size in Fox Lake is 2.07 persons per household, with single male/father households (122 | 2.4%) accounting for the largest median household size of 3.57 persons per household. non-family households (2,434 | 46.9%) represent the smallest median household size with 1.17 persons per household.
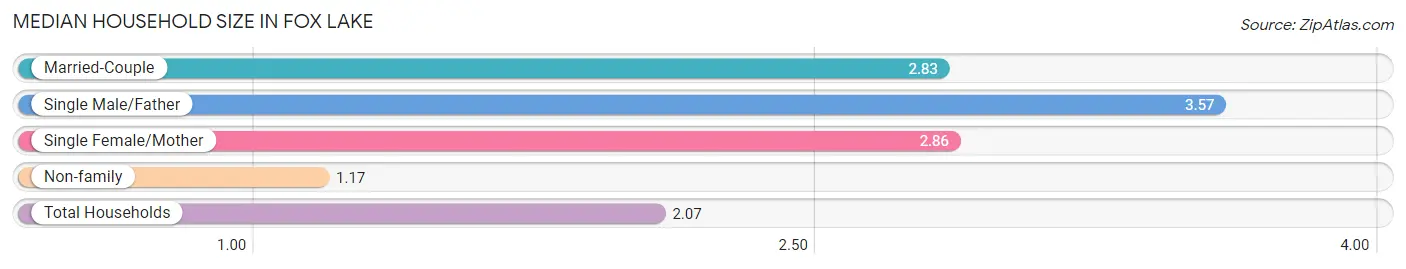
| Household Type | # Households | Household Size |
| Married-Couple | 2,010 (38.7%) | 2.83 |
| Single Male/Father | 122 (2.4%) | 3.57 |
| Single Female/Mother | 625 (12.0%) | 2.86 |
| Non-family | 2,434 (46.9%) | 1.17 |
| Total Households | 5,191 (100.0%) | 2.07 |
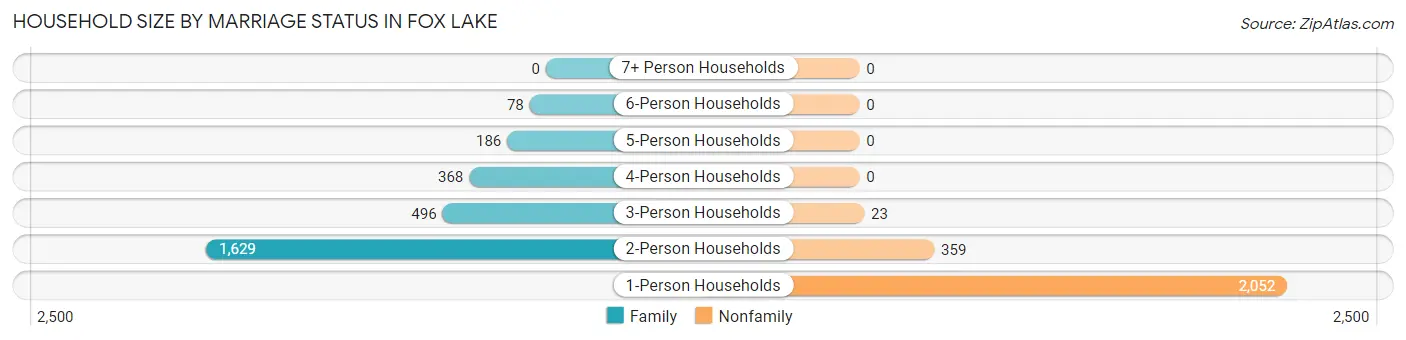
Household Size by Marriage Status in Fox Lake
Out of a total of 5,191 households in Fox Lake, 2,757 (53.1%) are family households, while 2,434 (46.9%) are nonfamily households. The most numerous type of family households are 2-person households, comprising 1,629, and the most common type of nonfamily households are 1-person households, comprising 2,052.
| Household Size | Family Households | Nonfamily Households |
| 1-Person Households | - | 2,052 (39.5%) |
| 2-Person Households | 1,629 (31.4%) | 359 (6.9%) |
| 3-Person Households | 496 (9.6%) | 23 (0.4%) |
| 4-Person Households | 368 (7.1%) | 0 (0.0%) |
| 5-Person Households | 186 (3.6%) | 0 (0.0%) |
| 6-Person Households | 78 (1.5%) | 0 (0.0%) |
| 7+ Person Households | 0 (0.0%) | 0 (0.0%) |
| Total | 2,757 (53.1%) | 2,434 (46.9%) |
Female Fertility in Fox Lake
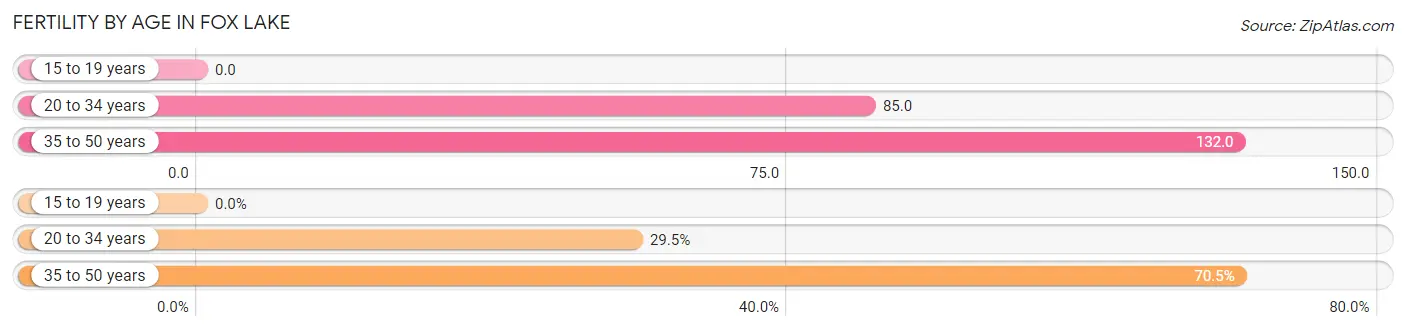
Fertility by Age in Fox Lake
Average fertility rate in Fox Lake is 94.0 births per 1,000 women. Women in the age bracket of 35 to 50 years have the highest fertility rate with 132.0 births per 1,000 women. Women in the age bracket of 35 to 50 years acount for 70.5% of all women with births.
| Age Bracket | Women with Births | Births / 1,000 Women |
| 15 to 19 years | 0 (0.0%) | 0.0 |
| 20 to 34 years | 62 (29.5%) | 85.0 |
| 35 to 50 years | 148 (70.5%) | 132.0 |
| Total | 210 (100.0%) | 94.0 |
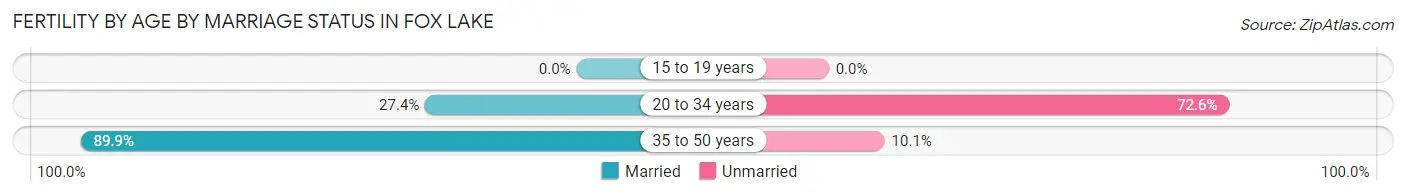
Fertility by Age by Marriage Status in Fox Lake
71.4% of women with births (210) in Fox Lake are married. The highest percentage of unmarried women with births falls into 20 to 34 years age bracket with 72.6% of them unmarried at the time of birth, while the lowest percentage of unmarried women with births belong to 35 to 50 years age bracket with 10.1% of them unmarried.
| Age Bracket | Married | Unmarried |
| 15 to 19 years | 0 (0.0%) | 0 (0.0%) |
| 20 to 34 years | 17 (27.4%) | 45 (72.6%) |
| 35 to 50 years | 133 (89.9%) | 15 (10.1%) |
| Total | 150 (71.4%) | 60 (28.6%) |
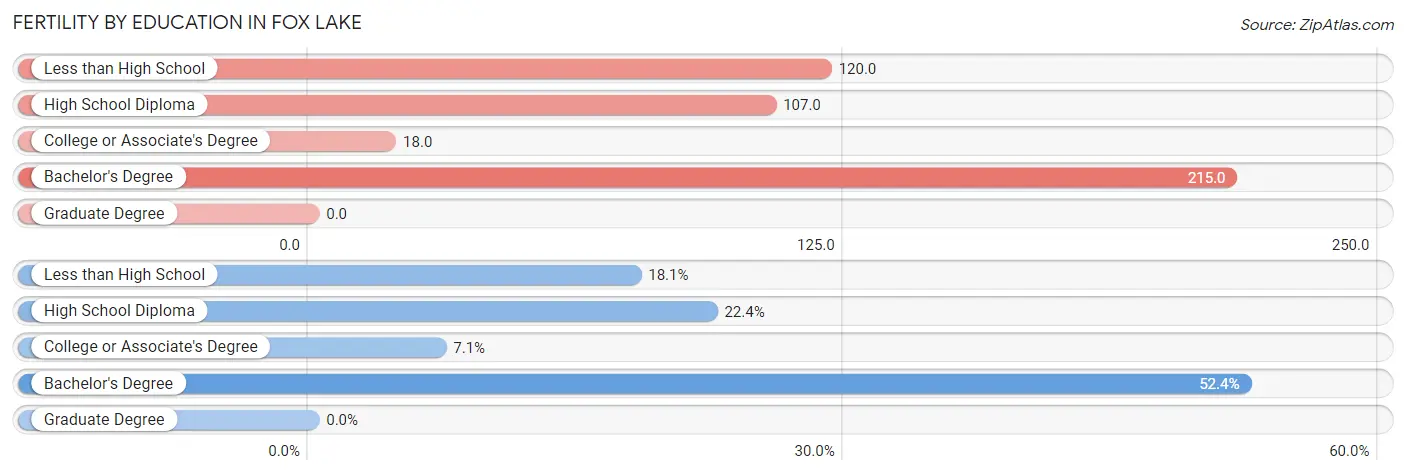
Fertility by Education in Fox Lake
| Educational Attainment | Women with Births | Births / 1,000 Women |
| Less than High School | 38 (18.1%) | 120.0 |
| High School Diploma | 47 (22.4%) | 107.0 |
| College or Associate's Degree | 15 (7.1%) | 18.0 |
| Bachelor's Degree | 110 (52.4%) | 215.0 |
| Graduate Degree | 0 (0.0%) | 0.0 |
| Total | 210 (100.0%) | 94.0 |
Fertility by Education by Marriage Status in Fox Lake
28.6% of women with births in Fox Lake are unmarried. Women with the educational attainment of less than high school are most likely to be married with 100.0% of them married at childbirth, while women with the educational attainment of college or associate's degree are least likely to be married with 100.0% of them unmarried at childbirth.
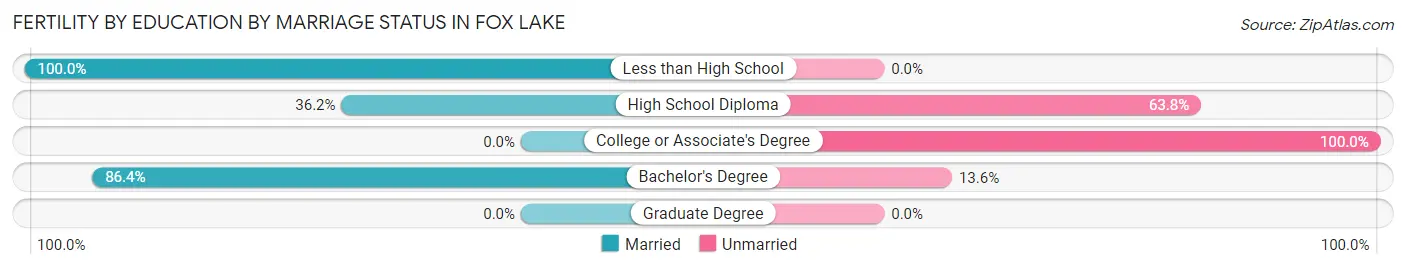
| Educational Attainment | Married | Unmarried |
| Less than High School | 38 (100.0%) | 0 (0.0%) |
| High School Diploma | 17 (36.2%) | 30 (63.8%) |
| College or Associate's Degree | 0 (0.0%) | 15 (100.0%) |
| Bachelor's Degree | 95 (86.4%) | 15 (13.6%) |
| Graduate Degree | 0 (0.0%) | 0 (0.0%) |
| Total | 150 (71.4%) | 60 (28.6%) |
Employment Characteristics in Fox Lake
Employment by Class of Employer in Fox Lake
Among the 5,462 employed individuals in Fox Lake, private company employees (4,309 | 78.9%), local government employees (384 | 7.0%), and not-for-profit organizations (376 | 6.9%) make up the most common classes of employment.
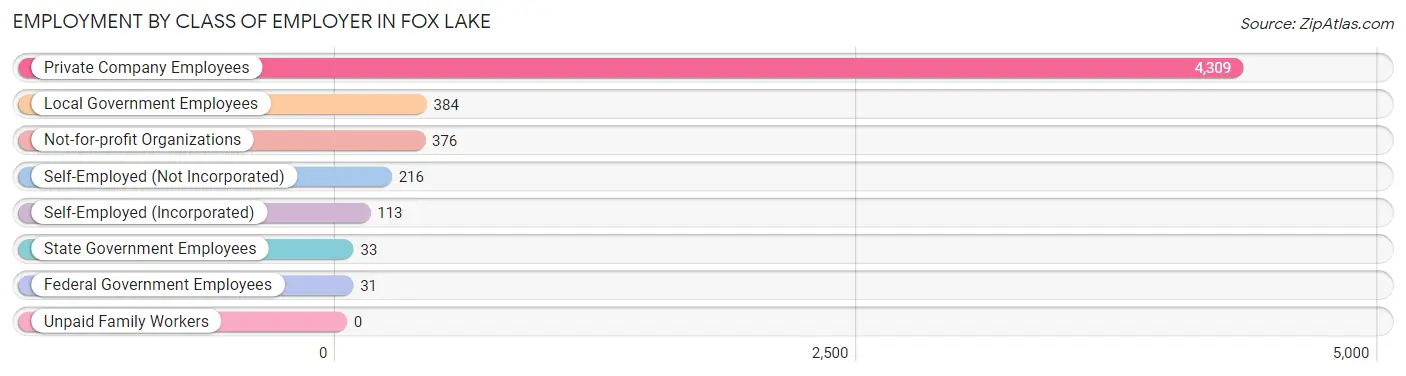
| Employer Class | # Employees | % Employees |
| Private Company Employees | 4,309 | 78.9% |
| Self-Employed (Incorporated) | 113 | 2.1% |
| Self-Employed (Not Incorporated) | 216 | 4.0% |
| Not-for-profit Organizations | 376 | 6.9% |
| Local Government Employees | 384 | 7.0% |
| State Government Employees | 33 | 0.6% |
| Federal Government Employees | 31 | 0.6% |
| Unpaid Family Workers | 0 | 0.0% |
| Total | 5,462 | 100.0% |
Employment Status by Age in Fox Lake
According to the labor force statistics for Fox Lake, out of the total population over 16 years of age (9,362), 62.2% or 5,823 individuals are in the labor force, with 3.3% or 192 of them unemployed. The age group with the highest labor force participation rate is 35 to 44 years, with 92.4% or 1,295 individuals in the labor force. Within the labor force, the 75 years and over age range has the highest percentage of unemployed individuals, with 21.4% or 9 of them being unemployed.
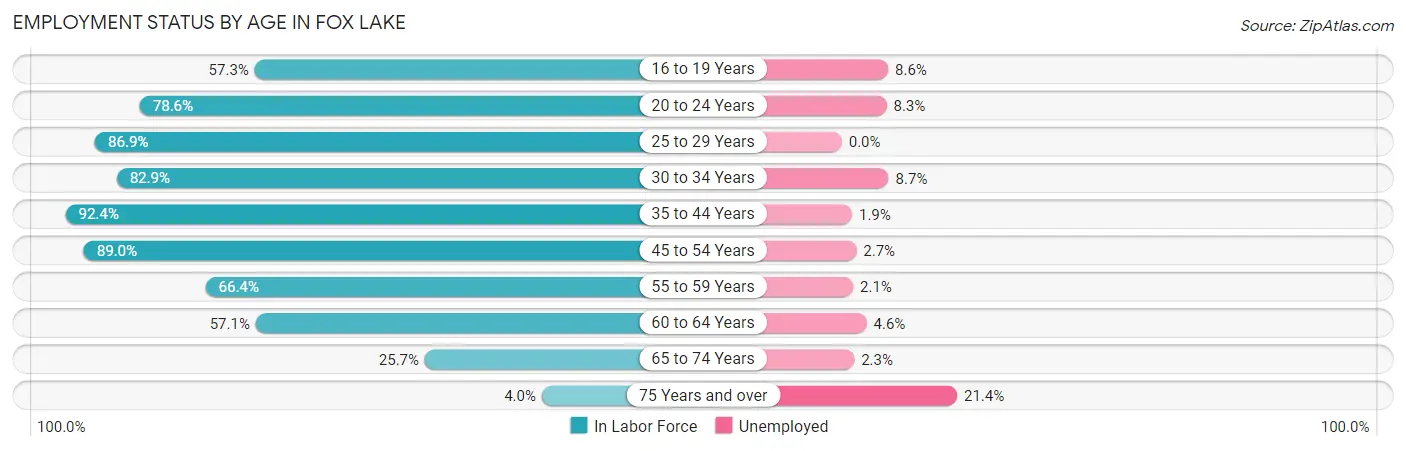
| Age Bracket | In Labor Force | Unemployed |
| 16 to 19 Years | 302 (57.3%) | 26 (8.6%) |
| 20 to 24 Years | 422 (78.6%) | 35 (8.3%) |
| 25 to 29 Years | 770 (86.9%) | 0 (0.0%) |
| 30 to 34 Years | 300 (82.9%) | 26 (8.7%) |
| 35 to 44 Years | 1,295 (92.4%) | 25 (1.9%) |
| 45 to 54 Years | 1,236 (89.0%) | 33 (2.7%) |
| 55 to 59 Years | 677 (66.4%) | 14 (2.1%) |
| 60 to 64 Years | 393 (57.1%) | 18 (4.6%) |
| 65 to 74 Years | 387 (25.7%) | 9 (2.3%) |
| 75 Years and over | 42 (4.0%) | 9 (21.4%) |
| Total | 5,823 (62.2%) | 192 (3.3%) |
Employment Status by Educational Attainment in Fox Lake
According to labor force statistics for Fox Lake, 81.3% of individuals (4,671) out of the total population between 25 and 64 years of age (5,746) are in the labor force, with 2.5% or 117 of them being unemployed. The group with the highest labor force participation rate are those with the educational attainment of bachelor's degree or higher, with 94.4% or 1,445 individuals in the labor force. Within the labor force, individuals with less than high school education have the highest percentage of unemployment, with 4.9% or 18 of them being unemployed.
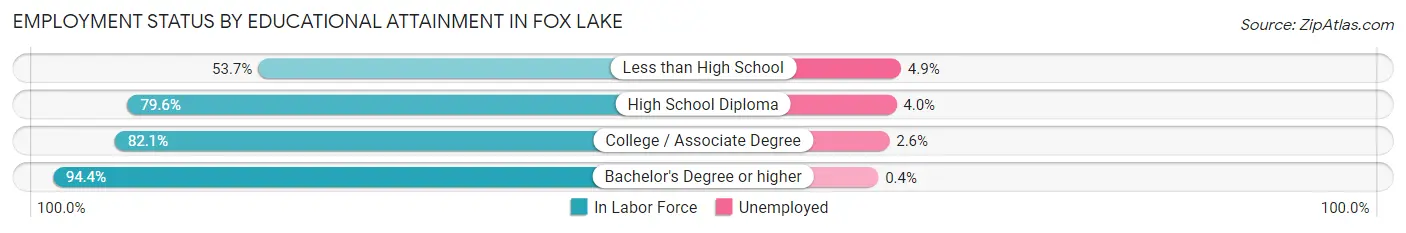
| Educational Attainment | In Labor Force | Unemployed |
| Less than High School | 370 (53.7%) | 34 (4.9%) |
| High School Diploma | 1,212 (79.6%) | 61 (4.0%) |
| College / Associate Degree | 1,645 (82.1%) | 52 (2.6%) |
| Bachelor's Degree or higher | 1,445 (94.4%) | 6 (0.4%) |
| Total | 4,671 (81.3%) | 144 (2.5%) |
Employment Occupations by Sex in Fox Lake
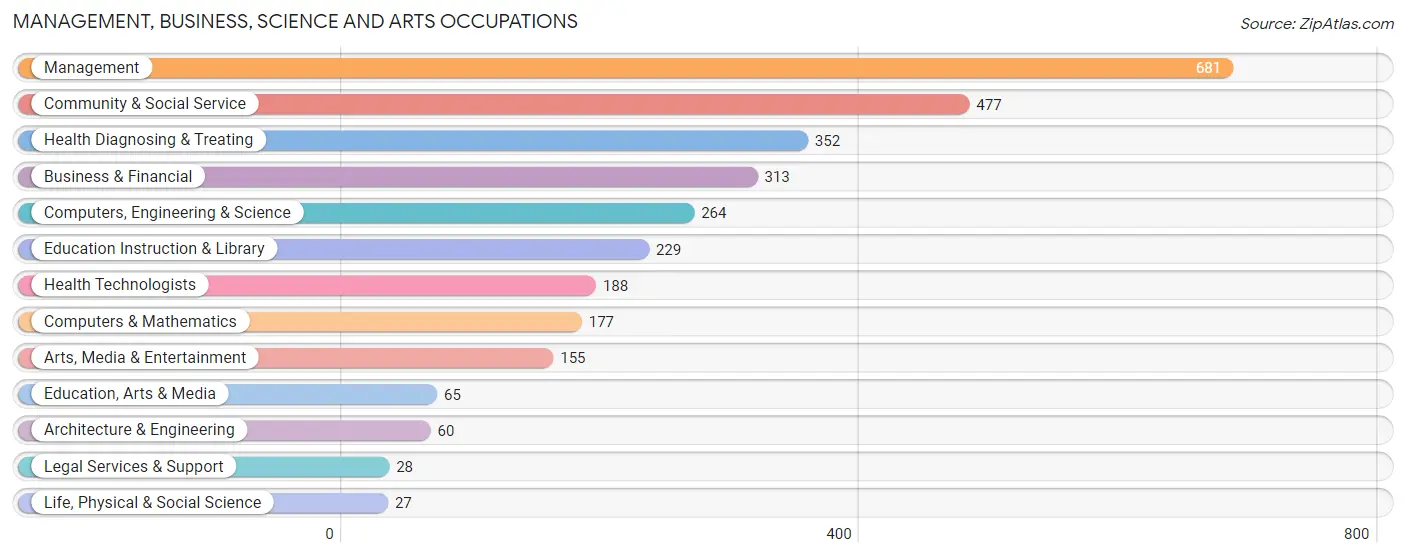
Management, Business, Science and Arts Occupations
The most common Management, Business, Science and Arts occupations in Fox Lake are Management (681 | 12.1%), Community & Social Service (477 | 8.5%), Health Diagnosing & Treating (352 | 6.2%), Business & Financial (313 | 5.6%), and Computers, Engineering & Science (264 | 4.7%).
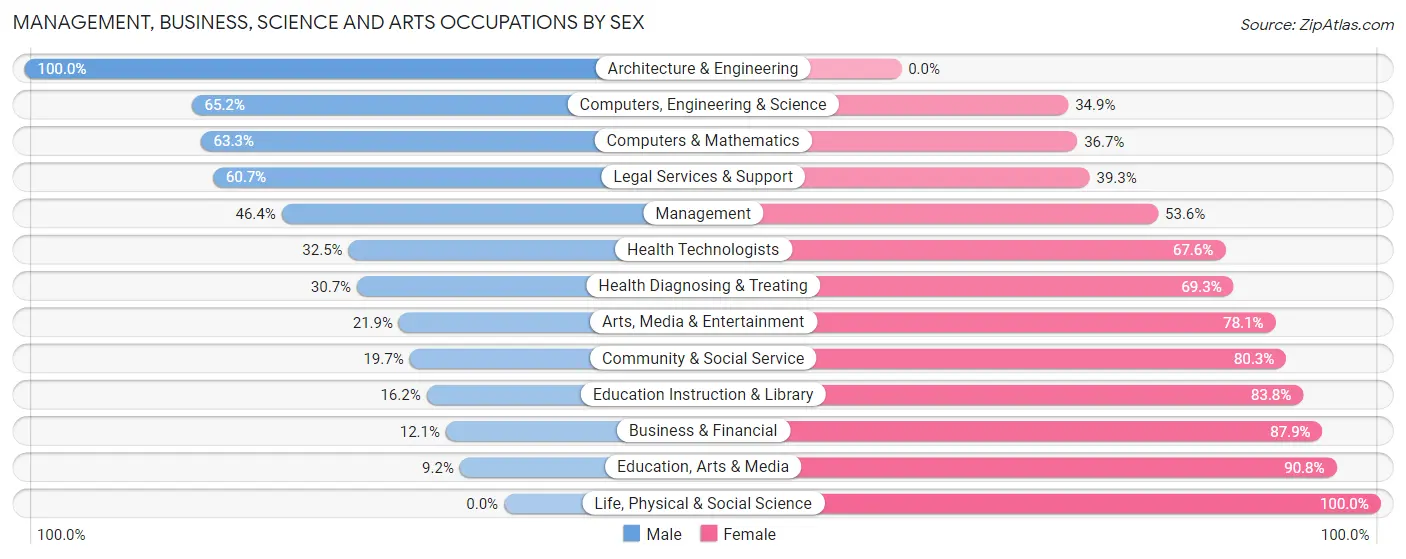
Management, Business, Science and Arts Occupations by Sex
Within the Management, Business, Science and Arts occupations in Fox Lake, the most male-oriented occupations are Architecture & Engineering (100.0%), Computers, Engineering & Science (65.1%), and Computers & Mathematics (63.3%), while the most female-oriented occupations are Life, Physical & Social Science (100.0%), Education, Arts & Media (90.8%), and Business & Financial (87.9%).
| Occupation | Male | Female |
| Management | 316 (46.4%) | 365 (53.6%) |
| Business & Financial | 38 (12.1%) | 275 (87.9%) |
| Computers, Engineering & Science | 172 (65.1%) | 92 (34.8%) |
| Computers & Mathematics | 112 (63.3%) | 65 (36.7%) |
| Architecture & Engineering | 60 (100.0%) | 0 (0.0%) |
| Life, Physical & Social Science | 0 (0.0%) | 27 (100.0%) |
| Community & Social Service | 94 (19.7%) | 383 (80.3%) |
| Education, Arts & Media | 6 (9.2%) | 59 (90.8%) |
| Legal Services & Support | 17 (60.7%) | 11 (39.3%) |
| Education Instruction & Library | 37 (16.2%) | 192 (83.8%) |
| Arts, Media & Entertainment | 34 (21.9%) | 121 (78.1%) |
| Health Diagnosing & Treating | 108 (30.7%) | 244 (69.3%) |
| Health Technologists | 61 (32.5%) | 127 (67.5%) |
| Total (Category) | 728 (34.9%) | 1,359 (65.1%) |
| Total (Overall) | 2,608 (46.3%) | 3,023 (53.7%) |
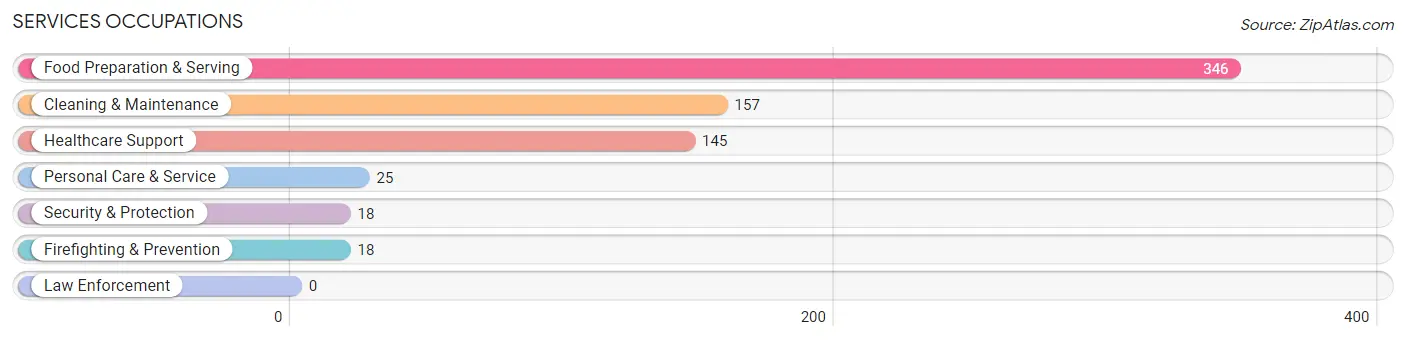
Services Occupations
The most common Services occupations in Fox Lake are Food Preparation & Serving (346 | 6.1%), Cleaning & Maintenance (157 | 2.8%), Healthcare Support (145 | 2.6%), Personal Care & Service (25 | 0.4%), and Security & Protection (18 | 0.3%).
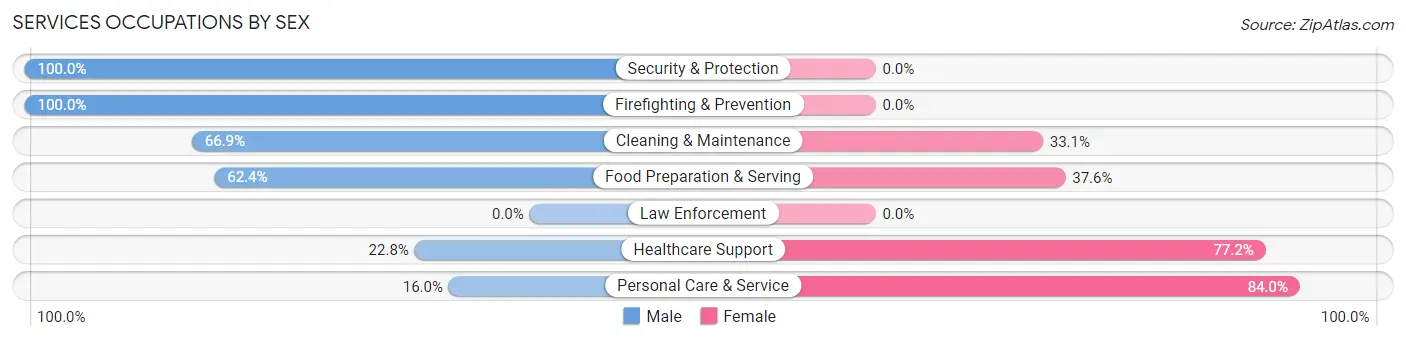
Services Occupations by Sex
Within the Services occupations in Fox Lake, the most male-oriented occupations are Security & Protection (100.0%), Firefighting & Prevention (100.0%), and Cleaning & Maintenance (66.9%), while the most female-oriented occupations are Personal Care & Service (84.0%), Healthcare Support (77.2%), and Food Preparation & Serving (37.6%).
| Occupation | Male | Female |
| Healthcare Support | 33 (22.8%) | 112 (77.2%) |
| Security & Protection | 18 (100.0%) | 0 (0.0%) |
| Firefighting & Prevention | 18 (100.0%) | 0 (0.0%) |
| Law Enforcement | 0 (0.0%) | 0 (0.0%) |
| Food Preparation & Serving | 216 (62.4%) | 130 (37.6%) |
| Cleaning & Maintenance | 105 (66.9%) | 52 (33.1%) |
| Personal Care & Service | 4 (16.0%) | 21 (84.0%) |
| Total (Category) | 376 (54.4%) | 315 (45.6%) |
| Total (Overall) | 2,608 (46.3%) | 3,023 (53.7%) |
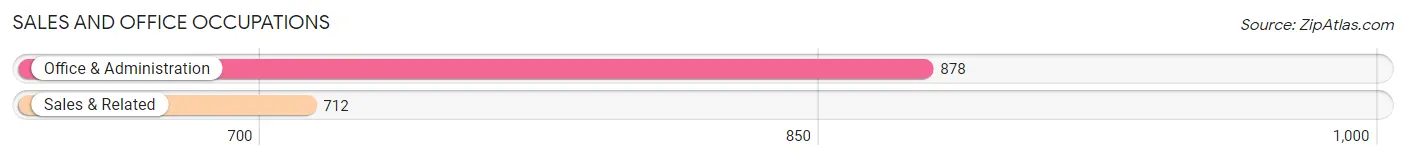
Sales and Office Occupations
The most common Sales and Office occupations in Fox Lake are Office & Administration (878 | 15.6%), and Sales & Related (712 | 12.6%).
Sales and Office Occupations by Sex
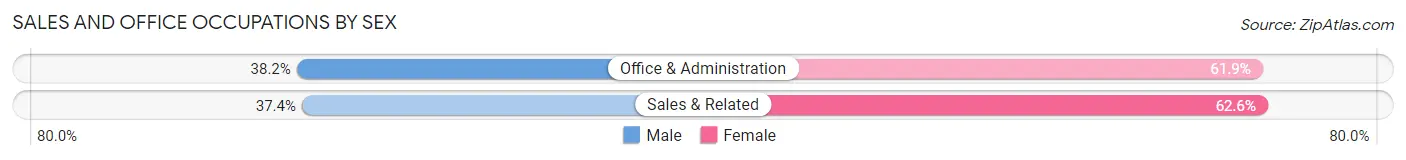
| Occupation | Male | Female |
| Sales & Related | 266 (37.4%) | 446 (62.6%) |
| Office & Administration | 335 (38.2%) | 543 (61.9%) |
| Total (Category) | 601 (37.8%) | 989 (62.2%) |
| Total (Overall) | 2,608 (46.3%) | 3,023 (53.7%) |
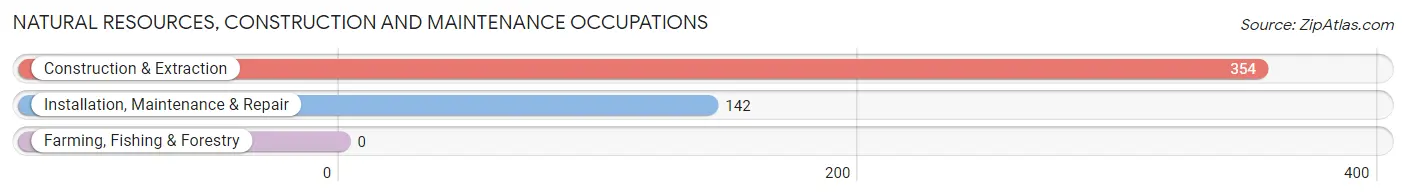
Natural Resources, Construction and Maintenance Occupations
The most common Natural Resources, Construction and Maintenance occupations in Fox Lake are Construction & Extraction (354 | 6.3%), and Installation, Maintenance & Repair (142 | 2.5%).
Natural Resources, Construction and Maintenance Occupations by Sex
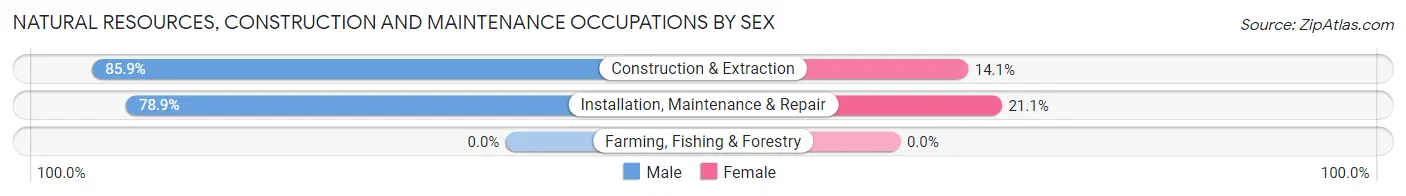
| Occupation | Male | Female |
| Farming, Fishing & Forestry | 0 (0.0%) | 0 (0.0%) |
| Construction & Extraction | 304 (85.9%) | 50 (14.1%) |
| Installation, Maintenance & Repair | 112 (78.9%) | 30 (21.1%) |
| Total (Category) | 416 (83.9%) | 80 (16.1%) |
| Total (Overall) | 2,608 (46.3%) | 3,023 (53.7%) |
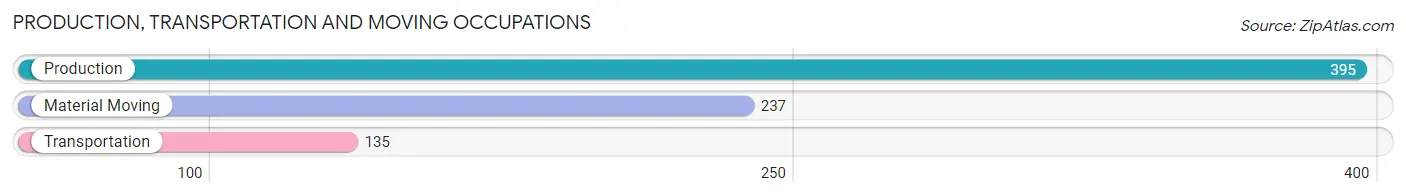
Production, Transportation and Moving Occupations
The most common Production, Transportation and Moving occupations in Fox Lake are Production (395 | 7.0%), Material Moving (237 | 4.2%), and Transportation (135 | 2.4%).
Production, Transportation and Moving Occupations by Sex
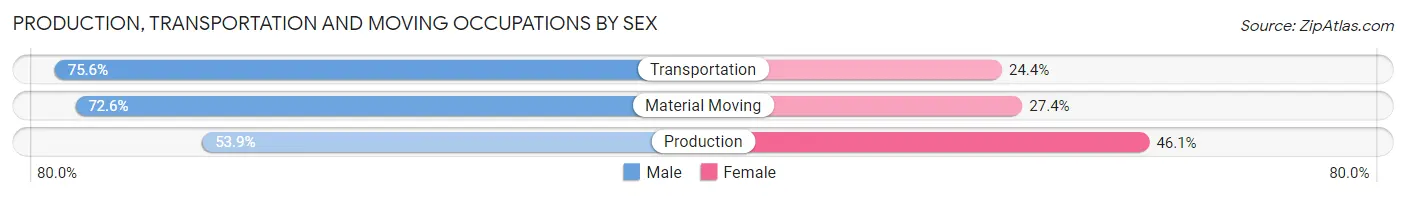
| Occupation | Male | Female |
| Production | 213 (53.9%) | 182 (46.1%) |
| Transportation | 102 (75.6%) | 33 (24.4%) |
| Material Moving | 172 (72.6%) | 65 (27.4%) |
| Total (Category) | 487 (63.5%) | 280 (36.5%) |
| Total (Overall) | 2,608 (46.3%) | 3,023 (53.7%) |
Employment Industries by Sex in Fox Lake
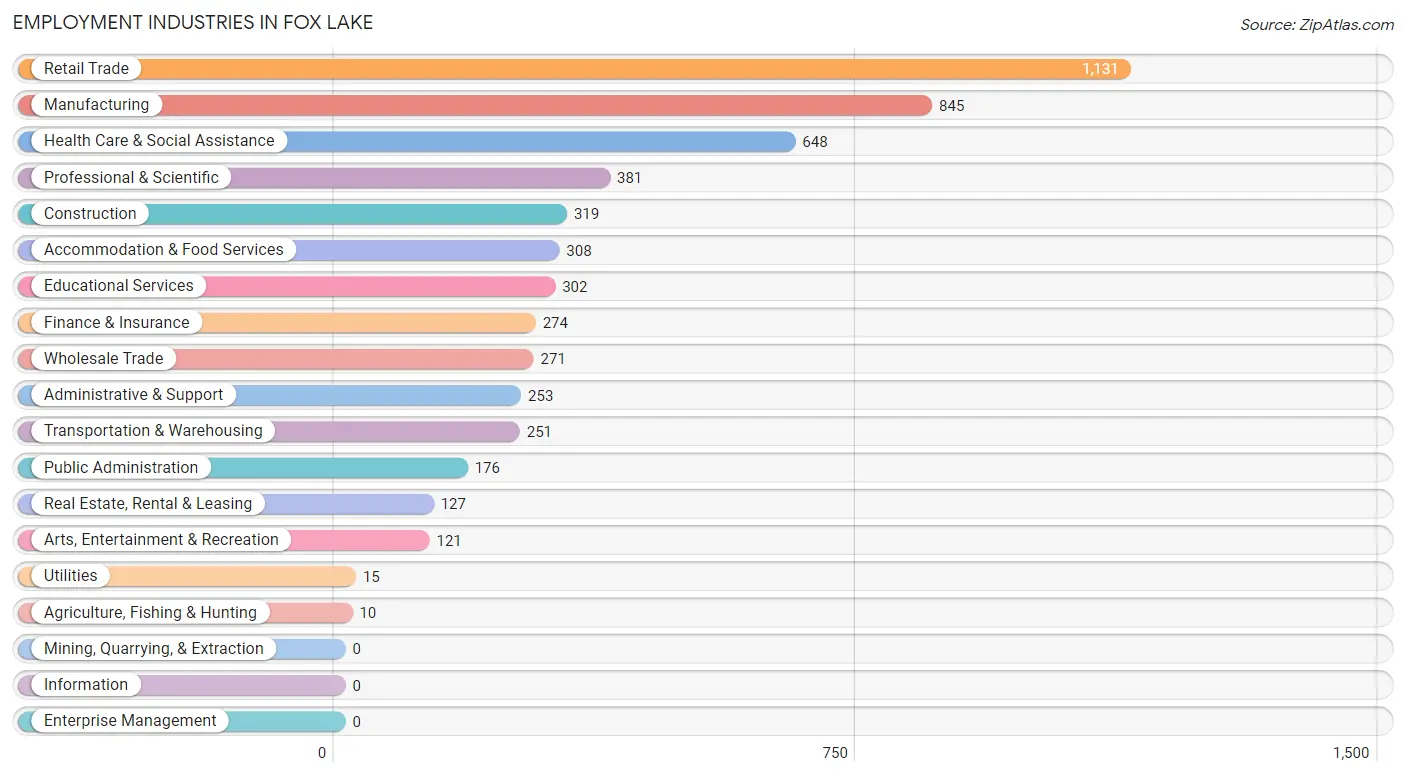
Employment Industries in Fox Lake
The major employment industries in Fox Lake include Retail Trade (1,131 | 20.1%), Manufacturing (845 | 15.0%), Health Care & Social Assistance (648 | 11.5%), Professional & Scientific (381 | 6.8%), and Construction (319 | 5.7%).
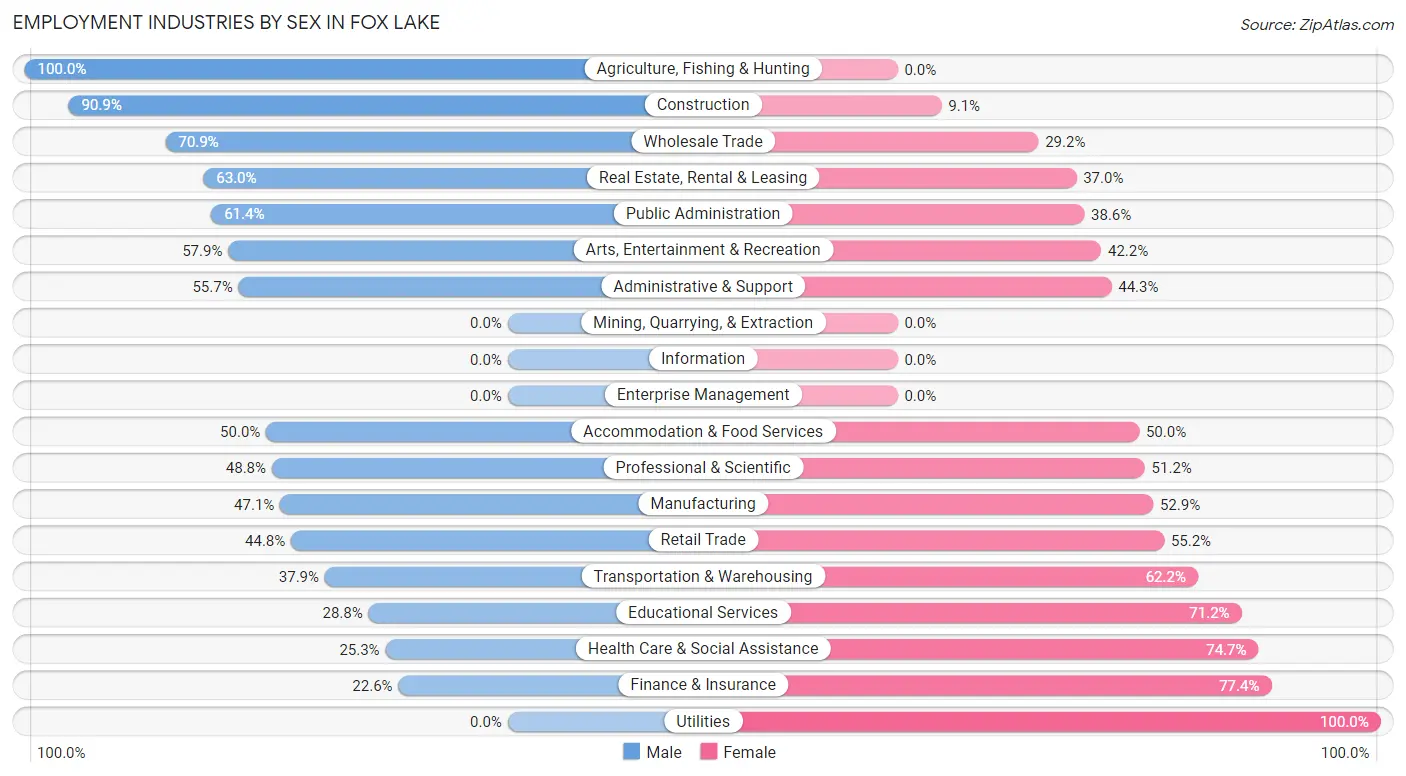
Employment Industries by Sex in Fox Lake
The Fox Lake industries that see more men than women are Agriculture, Fishing & Hunting (100.0%), Construction (90.9%), and Wholesale Trade (70.9%), whereas the industries that tend to have a higher number of women are Utilities (100.0%), Finance & Insurance (77.4%), and Health Care & Social Assistance (74.7%).
| Industry | Male | Female |
| Agriculture, Fishing & Hunting | 10 (100.0%) | 0 (0.0%) |
| Mining, Quarrying, & Extraction | 0 (0.0%) | 0 (0.0%) |
| Construction | 290 (90.9%) | 29 (9.1%) |
| Manufacturing | 398 (47.1%) | 447 (52.9%) |
| Wholesale Trade | 192 (70.9%) | 79 (29.1%) |
| Retail Trade | 507 (44.8%) | 624 (55.2%) |
| Transportation & Warehousing | 95 (37.9%) | 156 (62.2%) |
| Utilities | 0 (0.0%) | 15 (100.0%) |
| Information | 0 (0.0%) | 0 (0.0%) |
| Finance & Insurance | 62 (22.6%) | 212 (77.4%) |
| Real Estate, Rental & Leasing | 80 (63.0%) | 47 (37.0%) |
| Professional & Scientific | 186 (48.8%) | 195 (51.2%) |
| Enterprise Management | 0 (0.0%) | 0 (0.0%) |
| Administrative & Support | 141 (55.7%) | 112 (44.3%) |
| Educational Services | 87 (28.8%) | 215 (71.2%) |
| Health Care & Social Assistance | 164 (25.3%) | 484 (74.7%) |
| Arts, Entertainment & Recreation | 70 (57.9%) | 51 (42.1%) |
| Accommodation & Food Services | 154 (50.0%) | 154 (50.0%) |
| Public Administration | 108 (61.4%) | 68 (38.6%) |
| Total | 2,608 (46.3%) | 3,023 (53.7%) |
Education in Fox Lake
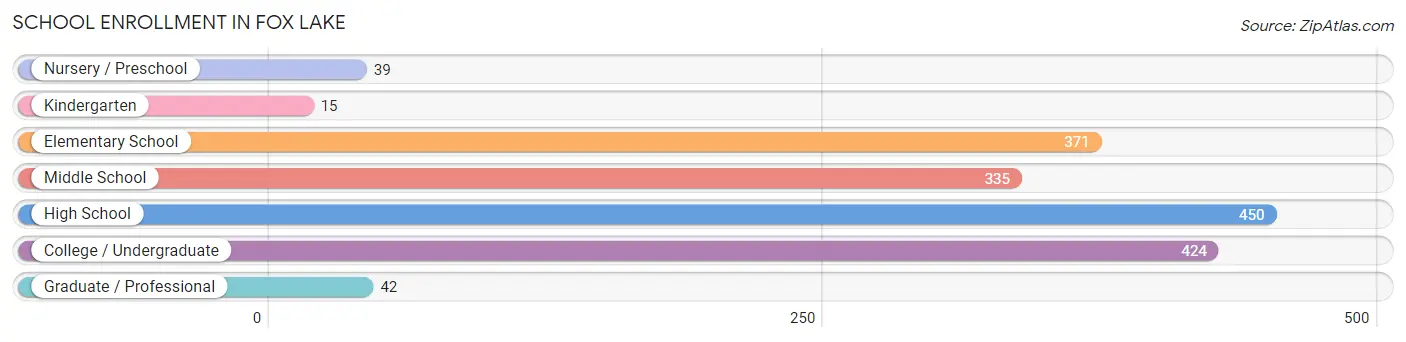
School Enrollment in Fox Lake
The most common levels of schooling among the 1,676 students in Fox Lake are high school (450 | 26.9%), college / undergraduate (424 | 25.3%), and elementary school (371 | 22.1%).
| School Level | # Students | % Students |
| Nursery / Preschool | 39 | 2.3% |
| Kindergarten | 15 | 0.9% |
| Elementary School | 371 | 22.1% |
| Middle School | 335 | 20.0% |
| High School | 450 | 26.9% |
| College / Undergraduate | 424 | 25.3% |
| Graduate / Professional | 42 | 2.5% |
| Total | 1,676 | 100.0% |
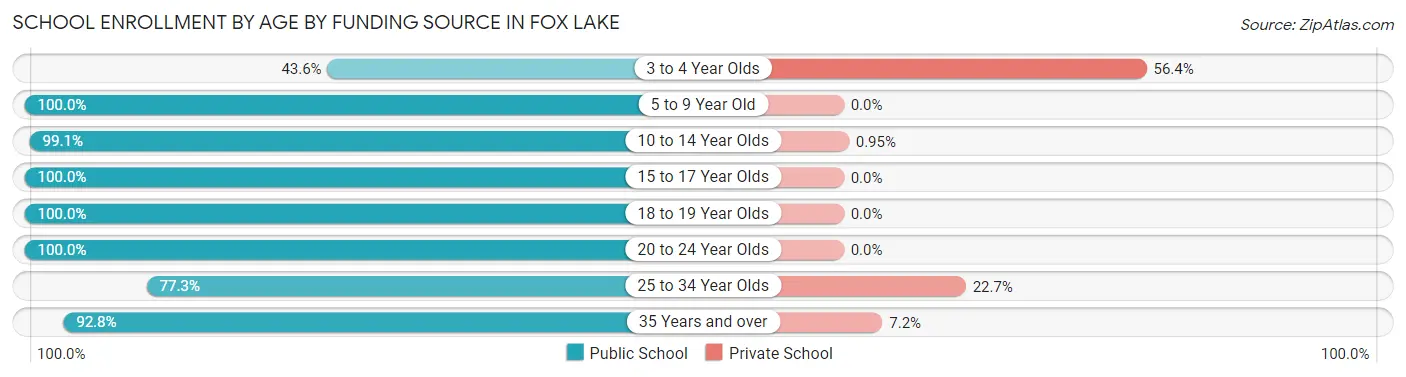
School Enrollment by Age by Funding Source in Fox Lake
Out of a total of 1,676 students who are enrolled in schools in Fox Lake, 60 (3.6%) attend a private institution, while the remaining 1,616 (96.4%) are enrolled in public schools. The age group of 3 to 4 year olds has the highest likelihood of being enrolled in private schools, with 22 (56.4% in the age bracket) enrolled. Conversely, the age group of 5 to 9 year old has the lowest likelihood of being enrolled in a private school, with 345 (100.0% in the age bracket) attending a public institution.
| Age Bracket | Public School | Private School |
| 3 to 4 Year Olds | 17 (43.6%) | 22 (56.4%) |
| 5 to 9 Year Old | 345 (100.0%) | 0 (0.0%) |
| 10 to 14 Year Olds | 521 (99.1%) | 5 (0.9%) |
| 15 to 17 Year Olds | 216 (100.0%) | 0 (0.0%) |
| 18 to 19 Year Olds | 157 (100.0%) | 0 (0.0%) |
| 20 to 24 Year Olds | 172 (100.0%) | 0 (0.0%) |
| 25 to 34 Year Olds | 85 (77.3%) | 25 (22.7%) |
| 35 Years and over | 103 (92.8%) | 8 (7.2%) |
| Total | 1,616 (96.4%) | 60 (3.6%) |
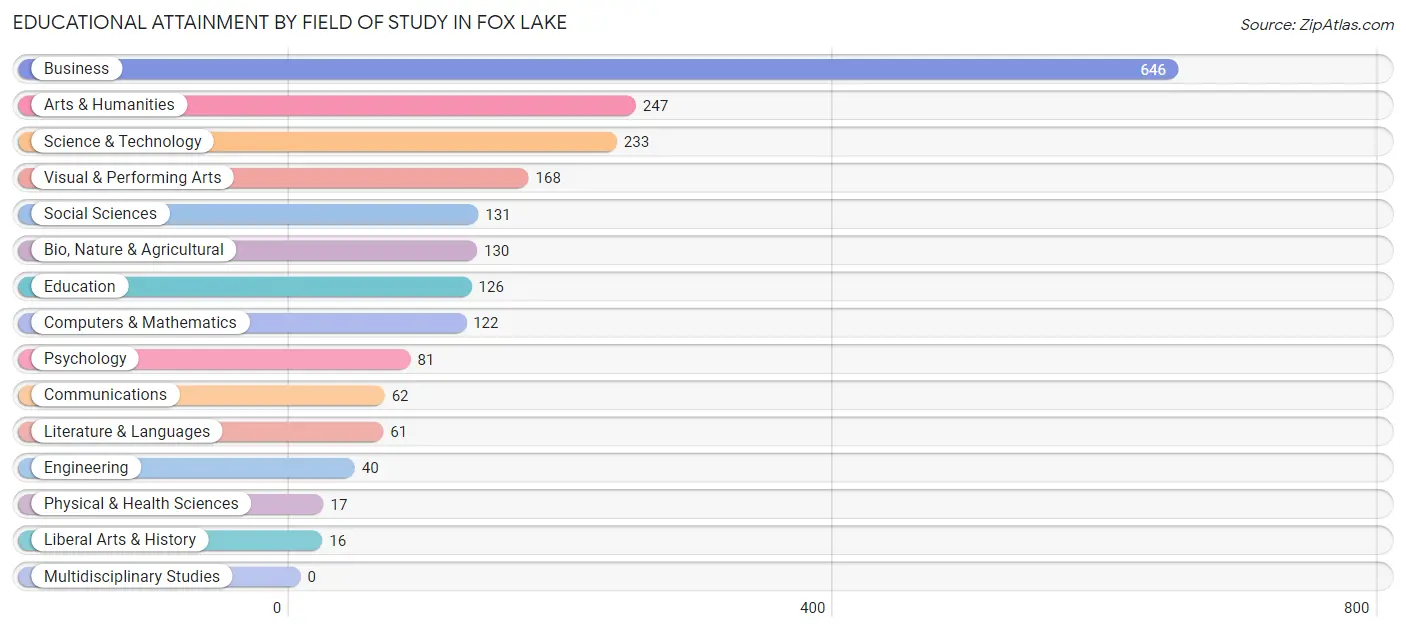
Educational Attainment by Field of Study in Fox Lake
Business (646 | 31.1%), arts & humanities (247 | 11.9%), science & technology (233 | 11.2%), visual & performing arts (168 | 8.1%), and social sciences (131 | 6.3%) are the most common fields of study among 2,080 individuals in Fox Lake who have obtained a bachelor's degree or higher.
| Field of Study | # Graduates | % Graduates |
| Computers & Mathematics | 122 | 5.9% |
| Bio, Nature & Agricultural | 130 | 6.2% |
| Physical & Health Sciences | 17 | 0.8% |
| Psychology | 81 | 3.9% |
| Social Sciences | 131 | 6.3% |
| Engineering | 40 | 1.9% |
| Multidisciplinary Studies | 0 | 0.0% |
| Science & Technology | 233 | 11.2% |
| Business | 646 | 31.1% |
| Education | 126 | 6.1% |
| Literature & Languages | 61 | 2.9% |
| Liberal Arts & History | 16 | 0.8% |
| Visual & Performing Arts | 168 | 8.1% |
| Communications | 62 | 3.0% |
| Arts & Humanities | 247 | 11.9% |
| Total | 2,080 | 100.0% |
Transportation & Commute in Fox Lake
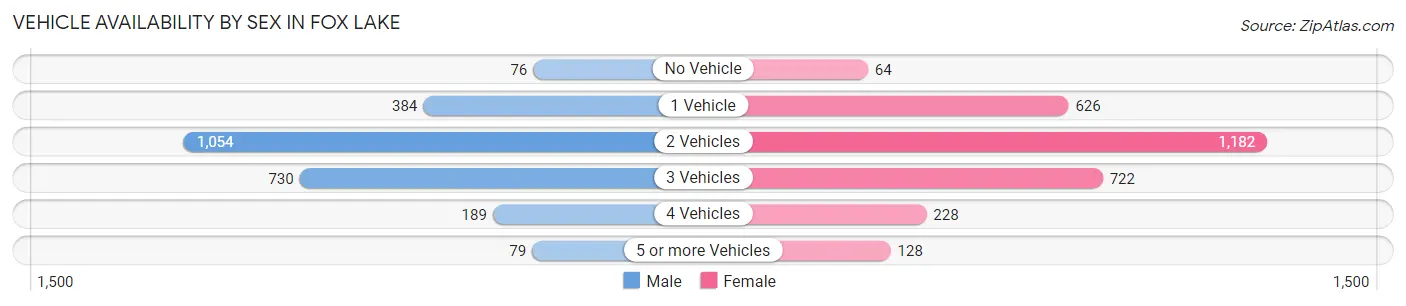
Vehicle Availability by Sex in Fox Lake
The most prevalent vehicle ownership categories in Fox Lake are males with 2 vehicles (1,054, accounting for 42.0%) and females with 2 vehicles (1,182, making up 35.7%).
| Vehicles Available | Male | Female |
| No Vehicle | 76 (3.0%) | 64 (2.2%) |
| 1 Vehicle | 384 (15.3%) | 626 (21.2%) |
| 2 Vehicles | 1,054 (42.0%) | 1,182 (40.1%) |
| 3 Vehicles | 730 (29.1%) | 722 (24.5%) |
| 4 Vehicles | 189 (7.5%) | 228 (7.7%) |
| 5 or more Vehicles | 79 (3.1%) | 128 (4.3%) |
| Total | 2,512 (100.0%) | 2,950 (100.0%) |
Commute Time in Fox Lake
The most frequently occuring commute durations in Fox Lake are 45 to 59 minutes (985 commuters, 20.0%), 30 to 34 minutes (729 commuters, 14.8%), and 60 to 89 minutes (636 commuters, 12.9%).
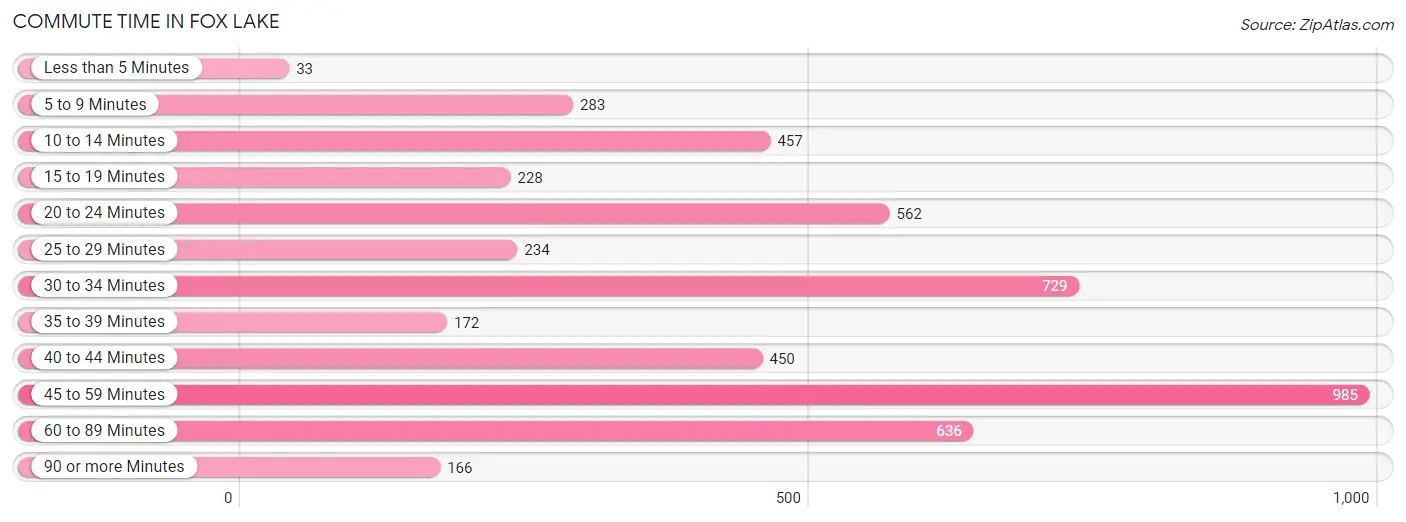
| Commute Time | # Commuters | % Commuters |
| Less than 5 Minutes | 33 | 0.7% |
| 5 to 9 Minutes | 283 | 5.7% |
| 10 to 14 Minutes | 457 | 9.3% |
| 15 to 19 Minutes | 228 | 4.6% |
| 20 to 24 Minutes | 562 | 11.4% |
| 25 to 29 Minutes | 234 | 4.7% |
| 30 to 34 Minutes | 729 | 14.8% |
| 35 to 39 Minutes | 172 | 3.5% |
| 40 to 44 Minutes | 450 | 9.1% |
| 45 to 59 Minutes | 985 | 20.0% |
| 60 to 89 Minutes | 636 | 12.9% |
| 90 or more Minutes | 166 | 3.4% |
Commute Time by Sex in Fox Lake
The most common commute times in Fox Lake are 45 to 59 minutes (524 commuters, 23.1%) for males and 45 to 59 minutes (461 commuters, 17.3%) for females.
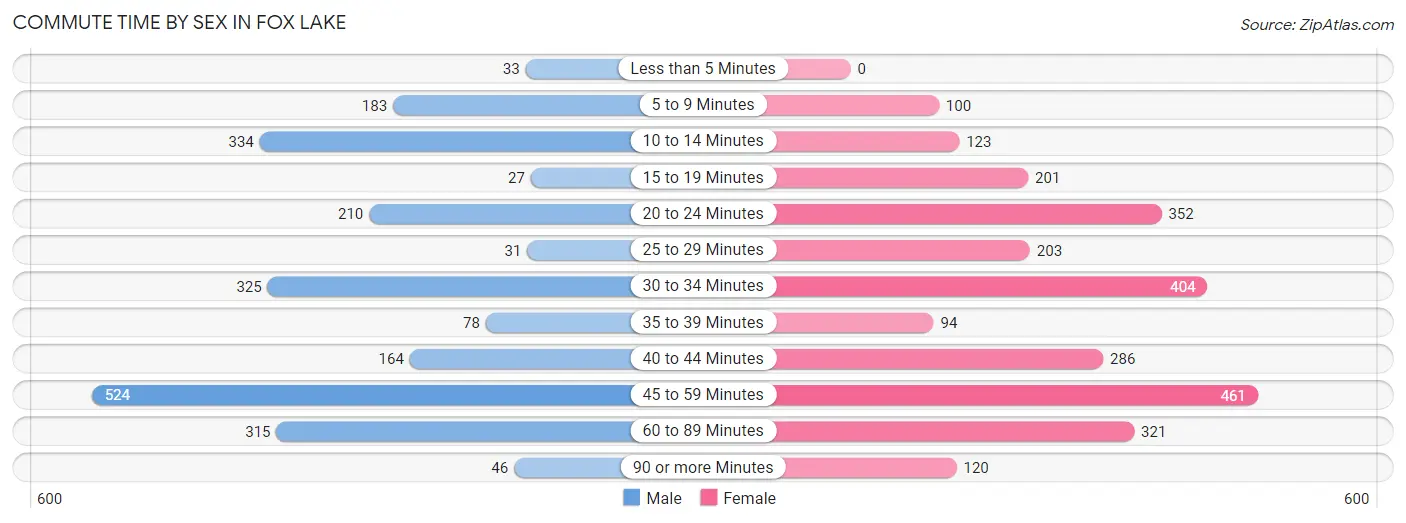
| Commute Time | Male | Female |
| Less than 5 Minutes | 33 (1.5%) | 0 (0.0%) |
| 5 to 9 Minutes | 183 (8.1%) | 100 (3.7%) |
| 10 to 14 Minutes | 334 (14.7%) | 123 (4.6%) |
| 15 to 19 Minutes | 27 (1.2%) | 201 (7.5%) |
| 20 to 24 Minutes | 210 (9.2%) | 352 (13.2%) |
| 25 to 29 Minutes | 31 (1.4%) | 203 (7.6%) |
| 30 to 34 Minutes | 325 (14.3%) | 404 (15.2%) |
| 35 to 39 Minutes | 78 (3.4%) | 94 (3.5%) |
| 40 to 44 Minutes | 164 (7.2%) | 286 (10.7%) |
| 45 to 59 Minutes | 524 (23.1%) | 461 (17.3%) |
| 60 to 89 Minutes | 315 (13.9%) | 321 (12.0%) |
| 90 or more Minutes | 46 (2.0%) | 120 (4.5%) |
Time of Departure to Work by Sex in Fox Lake
The most frequent times of departure to work in Fox Lake are 6:00 AM to 6:29 AM (310, 13.7%) for males and 7:00 AM to 7:29 AM (505, 19.0%) for females.
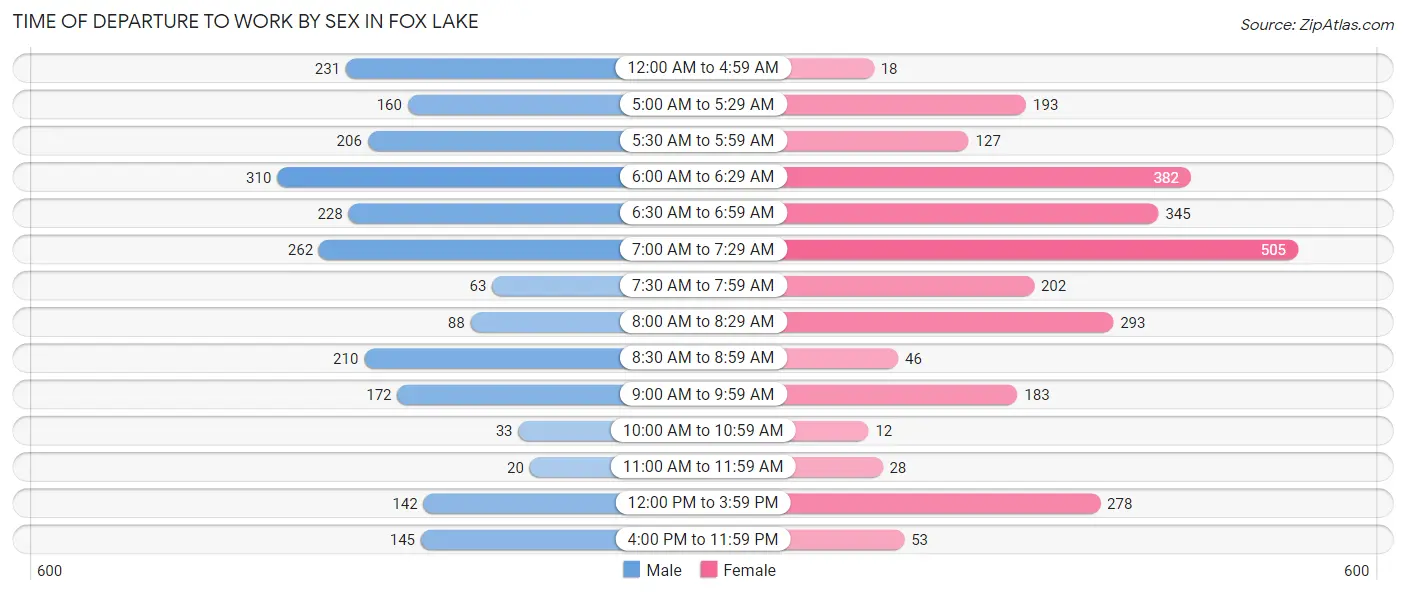
| Time of Departure | Male | Female |
| 12:00 AM to 4:59 AM | 231 (10.2%) | 18 (0.7%) |
| 5:00 AM to 5:29 AM | 160 (7.0%) | 193 (7.2%) |
| 5:30 AM to 5:59 AM | 206 (9.1%) | 127 (4.8%) |
| 6:00 AM to 6:29 AM | 310 (13.7%) | 382 (14.3%) |
| 6:30 AM to 6:59 AM | 228 (10.0%) | 345 (13.0%) |
| 7:00 AM to 7:29 AM | 262 (11.5%) | 505 (19.0%) |
| 7:30 AM to 7:59 AM | 63 (2.8%) | 202 (7.6%) |
| 8:00 AM to 8:29 AM | 88 (3.9%) | 293 (11.0%) |
| 8:30 AM to 8:59 AM | 210 (9.2%) | 46 (1.7%) |
| 9:00 AM to 9:59 AM | 172 (7.6%) | 183 (6.9%) |
| 10:00 AM to 10:59 AM | 33 (1.5%) | 12 (0.4%) |
| 11:00 AM to 11:59 AM | 20 (0.9%) | 28 (1.1%) |
| 12:00 PM to 3:59 PM | 142 (6.3%) | 278 (10.4%) |
| 4:00 PM to 11:59 PM | 145 (6.4%) | 53 (2.0%) |
| Total | 2,270 (100.0%) | 2,665 (100.0%) |
Housing Occupancy in Fox Lake
Occupancy by Ownership in Fox Lake
Of the total 5,191 dwellings in Fox Lake, owner-occupied units account for 3,605 (69.5%), while renter-occupied units make up 1,586 (30.5%).
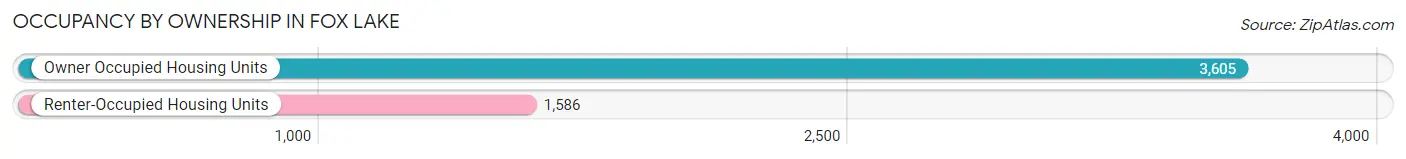
| Occupancy | # Housing Units | % Housing Units |
| Owner Occupied Housing Units | 3,605 | 69.5% |
| Renter-Occupied Housing Units | 1,586 | 30.5% |
| Total Occupied Housing Units | 5,191 | 100.0% |
Occupancy by Household Size in Fox Lake
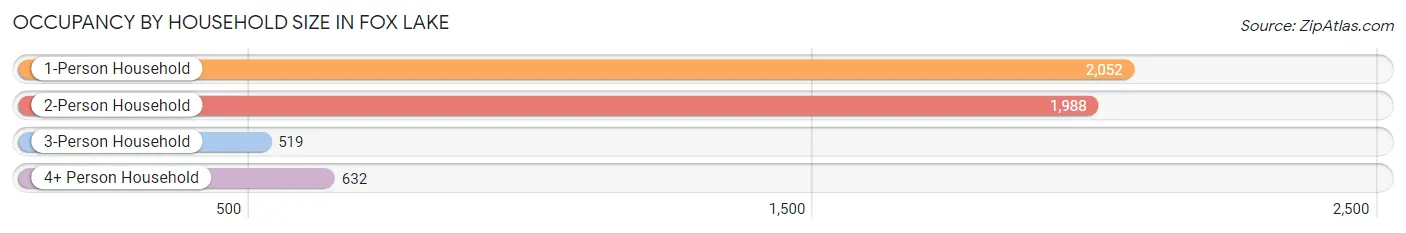
| Household Size | # Housing Units | % Housing Units |
| 1-Person Household | 2,052 | 39.5% |
| 2-Person Household | 1,988 | 38.3% |
| 3-Person Household | 519 | 10.0% |
| 4+ Person Household | 632 | 12.2% |
| Total Housing Units | 5,191 | 100.0% |
Occupancy by Ownership by Household Size in Fox Lake
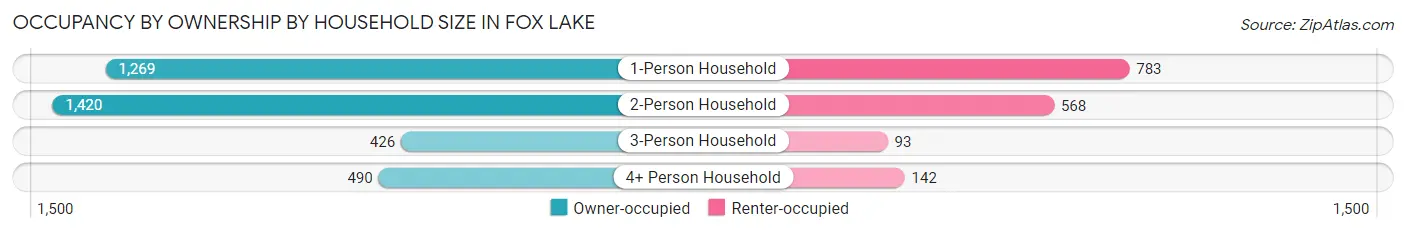
| Household Size | Owner-occupied | Renter-occupied |
| 1-Person Household | 1,269 (61.8%) | 783 (38.2%) |
| 2-Person Household | 1,420 (71.4%) | 568 (28.6%) |
| 3-Person Household | 426 (82.1%) | 93 (17.9%) |
| 4+ Person Household | 490 (77.5%) | 142 (22.5%) |
| Total Housing Units | 3,605 (69.5%) | 1,586 (30.5%) |
Occupancy by Educational Attainment in Fox Lake
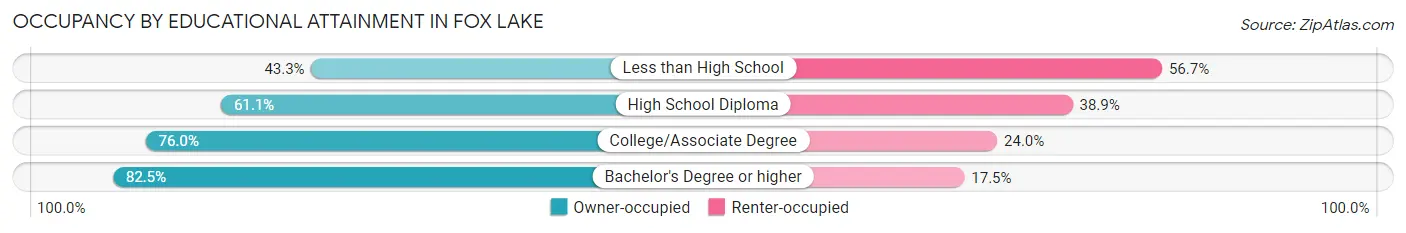
| Household Size | Owner-occupied | Renter-occupied |
| Less than High School | 237 (43.3%) | 310 (56.7%) |
| High School Diploma | 988 (61.1%) | 630 (38.9%) |
| College/Associate Degree | 1,366 (76.0%) | 431 (24.0%) |
| Bachelor's Degree or higher | 1,014 (82.5%) | 215 (17.5%) |
Occupancy by Age of Householder in Fox Lake
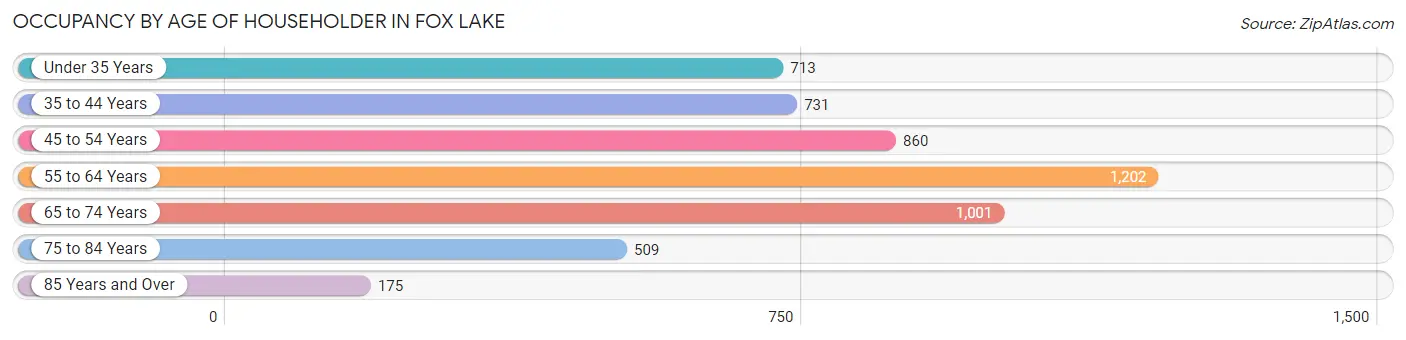
| Age Bracket | # Households | % Households |
| Under 35 Years | 713 | 13.7% |
| 35 to 44 Years | 731 | 14.1% |
| 45 to 54 Years | 860 | 16.6% |
| 55 to 64 Years | 1,202 | 23.2% |
| 65 to 74 Years | 1,001 | 19.3% |
| 75 to 84 Years | 509 | 9.8% |
| 85 Years and Over | 175 | 3.4% |
| Total | 5,191 | 100.0% |
Housing Finances in Fox Lake
Median Income by Occupancy in Fox Lake
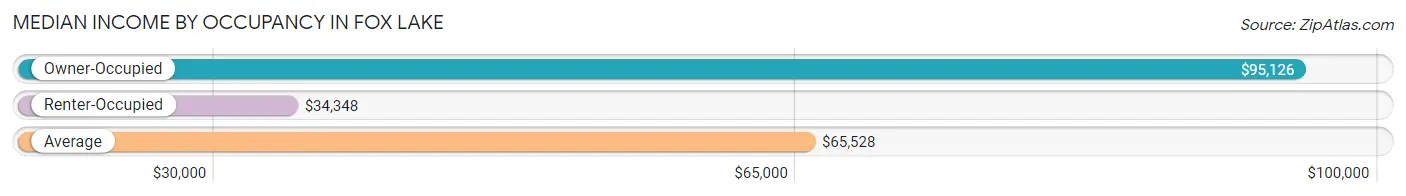
| Occupancy Type | # Households | Median Income |
| Owner-Occupied | 3,605 (69.5%) | $95,126 |
| Renter-Occupied | 1,586 (30.5%) | $34,348 |
| Average | 5,191 (100.0%) | $65,528 |
Occupancy by Householder Income Bracket in Fox Lake
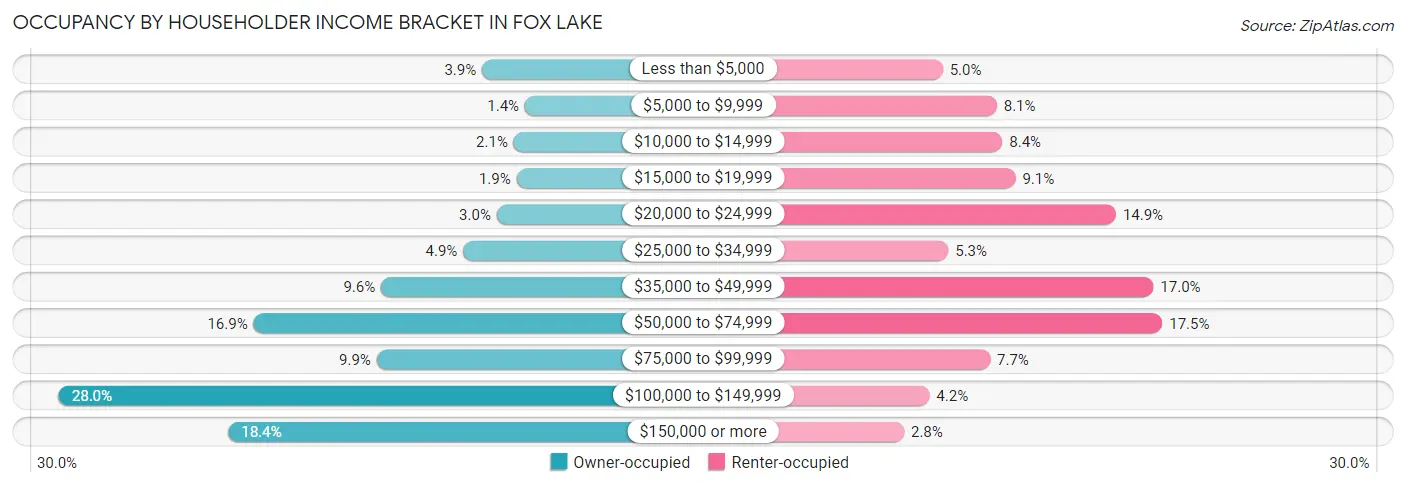
| Income Bracket | Owner-occupied | Renter-occupied |
| Less than $5,000 | 139 (3.9%) | 79 (5.0%) |
| $5,000 to $9,999 | 51 (1.4%) | 128 (8.1%) |
| $10,000 to $14,999 | 74 (2.1%) | 133 (8.4%) |
| $15,000 to $19,999 | 68 (1.9%) | 145 (9.1%) |
| $20,000 to $24,999 | 109 (3.0%) | 236 (14.9%) |
| $25,000 to $34,999 | 178 (4.9%) | 84 (5.3%) |
| $35,000 to $49,999 | 347 (9.6%) | 270 (17.0%) |
| $50,000 to $74,999 | 610 (16.9%) | 278 (17.5%) |
| $75,000 to $99,999 | 356 (9.9%) | 122 (7.7%) |
| $100,000 to $149,999 | 1,011 (28.0%) | 67 (4.2%) |
| $150,000 or more | 662 (18.4%) | 44 (2.8%) |
| Total | 3,605 (100.0%) | 1,586 (100.0%) |
Monthly Housing Cost Tiers in Fox Lake
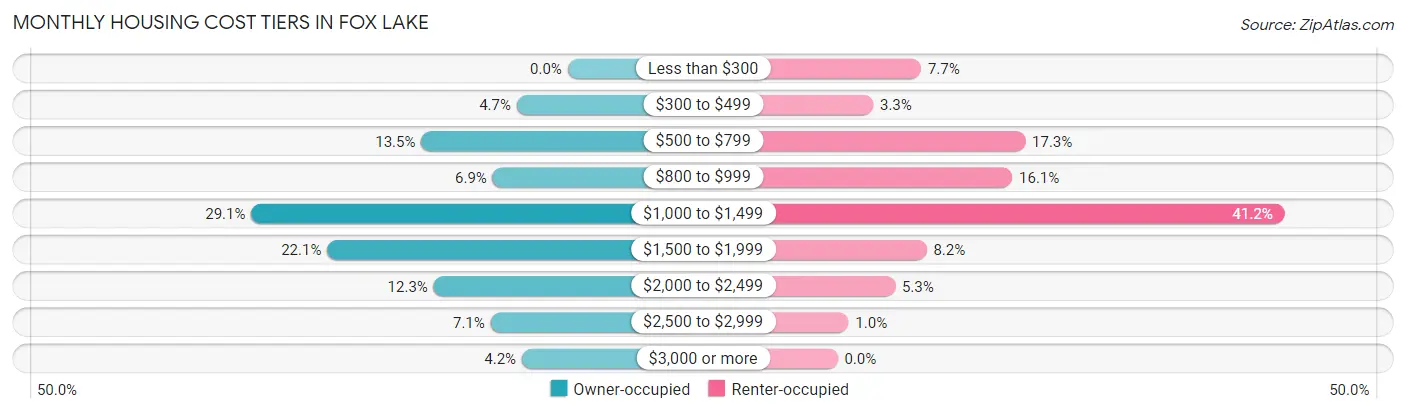
| Monthly Cost | Owner-occupied | Renter-occupied |
| Less than $300 | 0 (0.0%) | 122 (7.7%) |
| $300 to $499 | 169 (4.7%) | 52 (3.3%) |
| $500 to $799 | 486 (13.5%) | 274 (17.3%) |
| $800 to $999 | 249 (6.9%) | 255 (16.1%) |
| $1,000 to $1,499 | 1,050 (29.1%) | 653 (41.2%) |
| $1,500 to $1,999 | 798 (22.1%) | 130 (8.2%) |
| $2,000 to $2,499 | 445 (12.3%) | 84 (5.3%) |
| $2,500 to $2,999 | 256 (7.1%) | 16 (1.0%) |
| $3,000 or more | 152 (4.2%) | 0 (0.0%) |
| Total | 3,605 (100.0%) | 1,586 (100.0%) |
Physical Housing Characteristics in Fox Lake
Housing Structures in Fox Lake
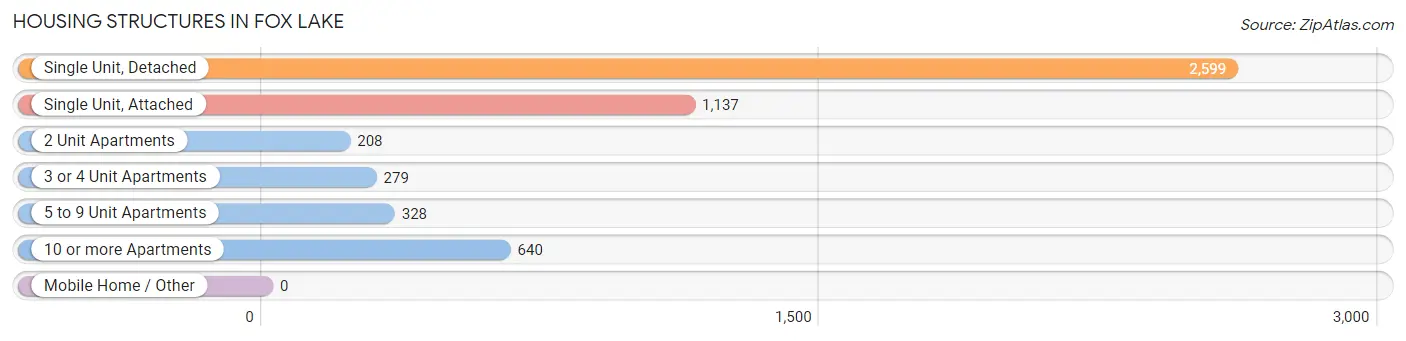
| Structure Type | # Housing Units | % Housing Units |
| Single Unit, Detached | 2,599 | 50.1% |
| Single Unit, Attached | 1,137 | 21.9% |
| 2 Unit Apartments | 208 | 4.0% |
| 3 or 4 Unit Apartments | 279 | 5.4% |
| 5 to 9 Unit Apartments | 328 | 6.3% |
| 10 or more Apartments | 640 | 12.3% |
| Mobile Home / Other | 0 | 0.0% |
| Total | 5,191 | 100.0% |
Housing Structures by Occupancy in Fox Lake
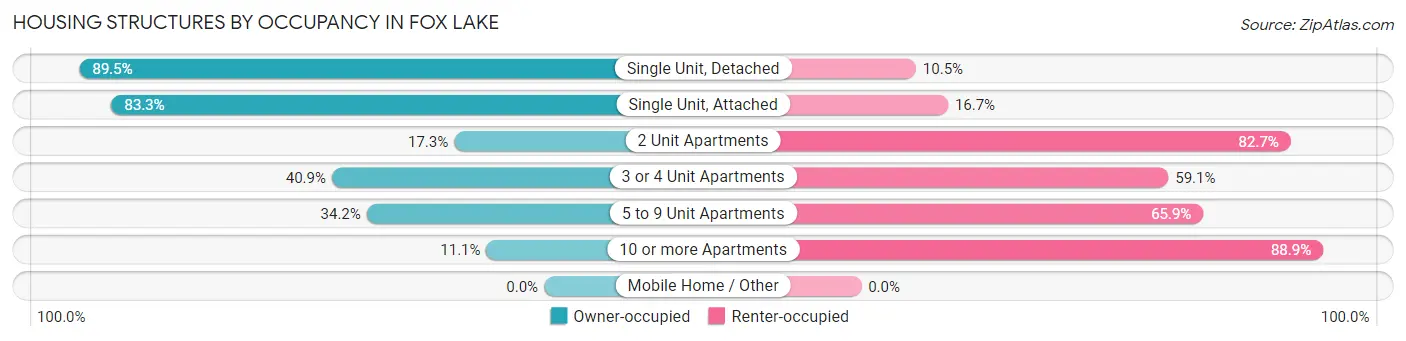
| Structure Type | Owner-occupied | Renter-occupied |
| Single Unit, Detached | 2,325 (89.5%) | 274 (10.5%) |
| Single Unit, Attached | 947 (83.3%) | 190 (16.7%) |
| 2 Unit Apartments | 36 (17.3%) | 172 (82.7%) |
| 3 or 4 Unit Apartments | 114 (40.9%) | 165 (59.1%) |
| 5 to 9 Unit Apartments | 112 (34.2%) | 216 (65.8%) |
| 10 or more Apartments | 71 (11.1%) | 569 (88.9%) |
| Mobile Home / Other | 0 (0.0%) | 0 (0.0%) |
| Total | 3,605 (69.5%) | 1,586 (30.5%) |
Housing Structures by Number of Rooms in Fox Lake
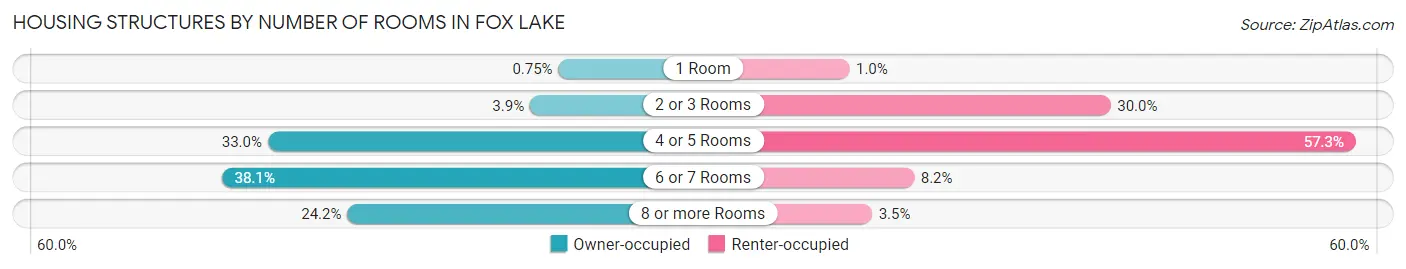
| Number of Rooms | Owner-occupied | Renter-occupied |
| 1 Room | 27 (0.7%) | 16 (1.0%) |
| 2 or 3 Rooms | 141 (3.9%) | 476 (30.0%) |
| 4 or 5 Rooms | 1,190 (33.0%) | 908 (57.3%) |
| 6 or 7 Rooms | 1,375 (38.1%) | 130 (8.2%) |
| 8 or more Rooms | 872 (24.2%) | 56 (3.5%) |
| Total | 3,605 (100.0%) | 1,586 (100.0%) |
Housing Structure by Heating Type in Fox Lake
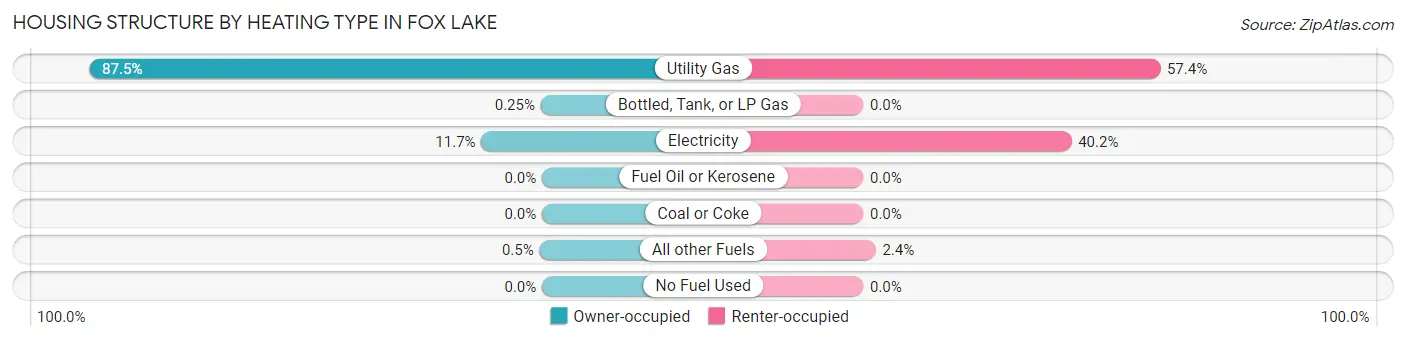
| Heating Type | Owner-occupied | Renter-occupied |
| Utility Gas | 3,155 (87.5%) | 910 (57.4%) |
| Bottled, Tank, or LP Gas | 9 (0.3%) | 0 (0.0%) |
| Electricity | 423 (11.7%) | 638 (40.2%) |
| Fuel Oil or Kerosene | 0 (0.0%) | 0 (0.0%) |
| Coal or Coke | 0 (0.0%) | 0 (0.0%) |
| All other Fuels | 18 (0.5%) | 38 (2.4%) |
| No Fuel Used | 0 (0.0%) | 0 (0.0%) |
| Total | 3,605 (100.0%) | 1,586 (100.0%) |
Household Vehicle Usage in Fox Lake
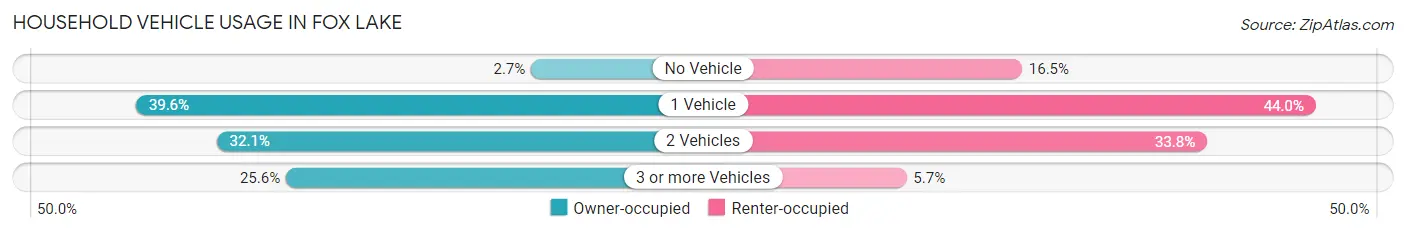
| Vehicles per Household | Owner-occupied | Renter-occupied |
| No Vehicle | 98 (2.7%) | 262 (16.5%) |
| 1 Vehicle | 1,428 (39.6%) | 697 (44.0%) |
| 2 Vehicles | 1,156 (32.1%) | 536 (33.8%) |
| 3 or more Vehicles | 923 (25.6%) | 91 (5.7%) |
| Total | 3,605 (100.0%) | 1,586 (100.0%) |
Real Estate & Mortgages in Fox Lake
Real Estate and Mortgage Overview in Fox Lake
| Characteristic | Without Mortgage | With Mortgage |
| Housing Units | 1,302 | 2,303 |
| Median Property Value | $217,500 | $207,600 |
| Median Household Income | $55,143 | $485 |
| Monthly Housing Costs | $809 | $152 |
| Real Estate Taxes | $4,729 | $15 |
Property Value by Mortgage Status in Fox Lake
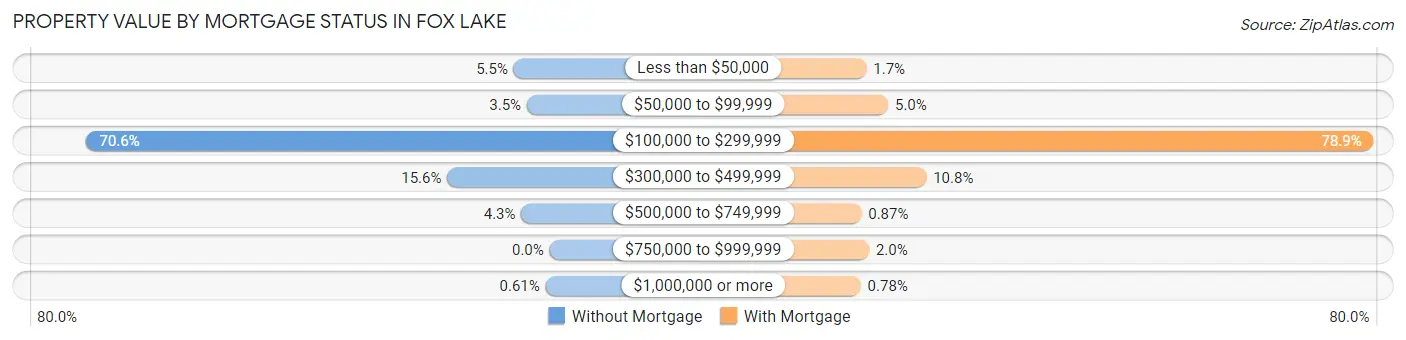
| Property Value | Without Mortgage | With Mortgage |
| Less than $50,000 | 71 (5.4%) | 38 (1.7%) |
| $50,000 to $99,999 | 45 (3.5%) | 114 (5.0%) |
| $100,000 to $299,999 | 919 (70.6%) | 1,818 (78.9%) |
| $300,000 to $499,999 | 203 (15.6%) | 248 (10.8%) |
| $500,000 to $749,999 | 56 (4.3%) | 20 (0.9%) |
| $750,000 to $999,999 | 0 (0.0%) | 47 (2.0%) |
| $1,000,000 or more | 8 (0.6%) | 18 (0.8%) |
| Total | 1,302 (100.0%) | 2,303 (100.0%) |
Household Income by Mortgage Status in Fox Lake
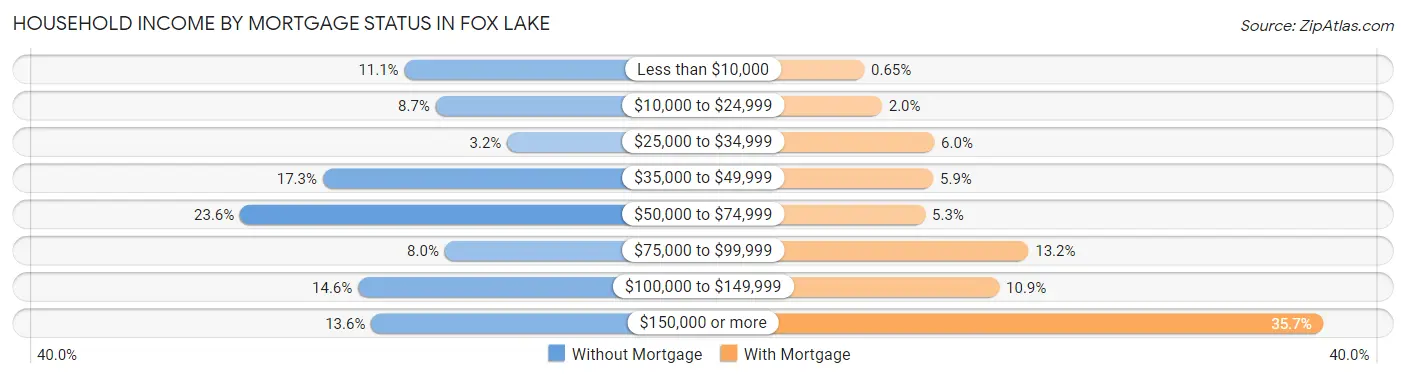
| Household Income | Without Mortgage | With Mortgage |
| Less than $10,000 | 144 (11.1%) | 15 (0.6%) |
| $10,000 to $24,999 | 113 (8.7%) | 46 (2.0%) |
| $25,000 to $34,999 | 42 (3.2%) | 138 (6.0%) |
| $35,000 to $49,999 | 225 (17.3%) | 136 (5.9%) |
| $50,000 to $74,999 | 307 (23.6%) | 122 (5.3%) |
| $75,000 to $99,999 | 104 (8.0%) | 303 (13.2%) |
| $100,000 to $149,999 | 190 (14.6%) | 252 (10.9%) |
| $150,000 or more | 177 (13.6%) | 821 (35.6%) |
| Total | 1,302 (100.0%) | 2,303 (100.0%) |
Property Value to Household Income Ratio in Fox Lake
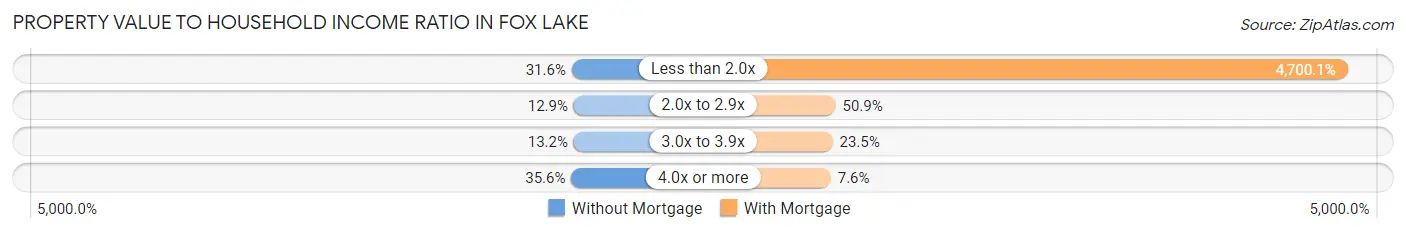
| Value-to-Income Ratio | Without Mortgage | With Mortgage |
| Less than 2.0x | 411 (31.6%) | 108,243 (4,700.1%) |
| 2.0x to 2.9x | 168 (12.9%) | 1,171 (50.8%) |
| 3.0x to 3.9x | 172 (13.2%) | 541 (23.5%) |
| 4.0x or more | 464 (35.6%) | 176 (7.6%) |
| Total | 1,302 (100.0%) | 2,303 (100.0%) |
Real Estate Taxes by Mortgage Status in Fox Lake
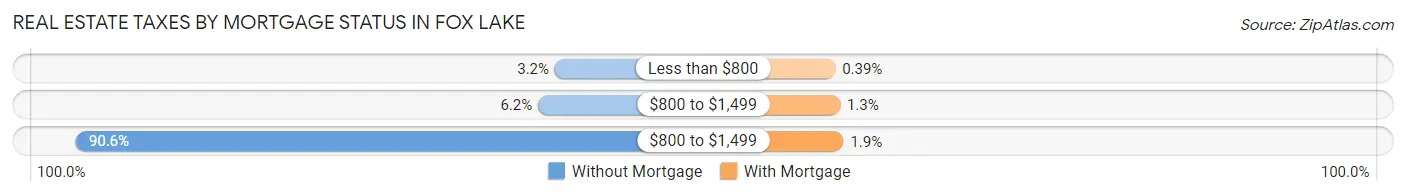
| Property Taxes | Without Mortgage | With Mortgage |
| Less than $800 | 41 (3.2%) | 9 (0.4%) |
| $800 to $1,499 | 81 (6.2%) | 29 (1.3%) |
| $800 to $1,499 | 1,180 (90.6%) | 44 (1.9%) |
| Total | 1,302 (100.0%) | 2,303 (100.0%) |
Health & Disability in Fox Lake
Health Insurance Coverage by Age in Fox Lake
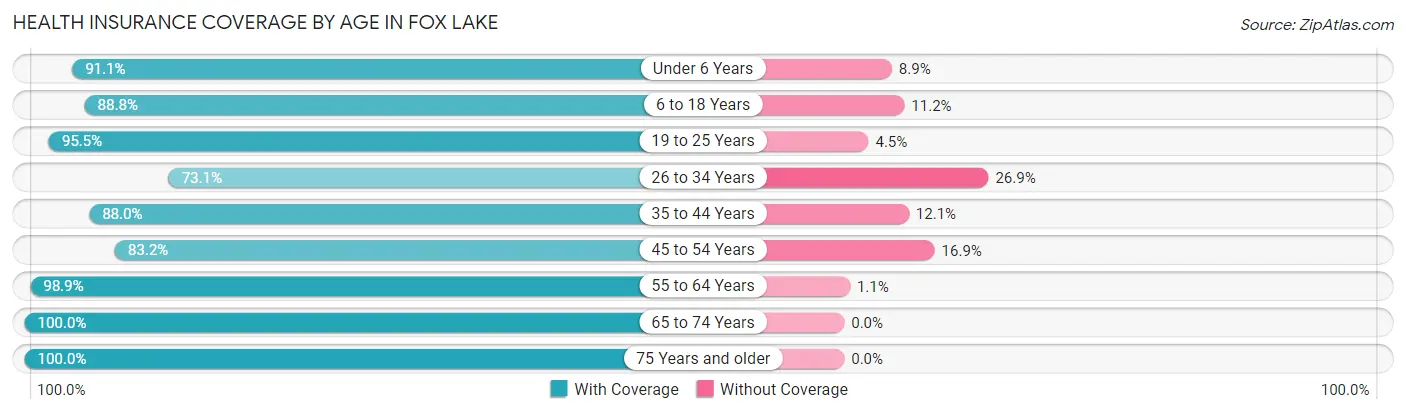
| Age Bracket | With Coverage | Without Coverage |
| Under 6 Years | 482 (91.1%) | 47 (8.9%) |
| 6 to 18 Years | 1,180 (88.8%) | 149 (11.2%) |
| 19 to 25 Years | 782 (95.5%) | 37 (4.5%) |
| 26 to 34 Years | 783 (73.1%) | 288 (26.9%) |
| 35 to 44 Years | 1,233 (87.9%) | 169 (12.0%) |
| 45 to 54 Years | 1,155 (83.2%) | 234 (16.9%) |
| 55 to 64 Years | 1,680 (98.9%) | 18 (1.1%) |
| 65 to 74 Years | 1,484 (100.0%) | 0 (0.0%) |
| 75 Years and older | 1,027 (100.0%) | 0 (0.0%) |
| Total | 9,806 (91.2%) | 942 (8.8%) |
Health Insurance Coverage by Citizenship Status in Fox Lake
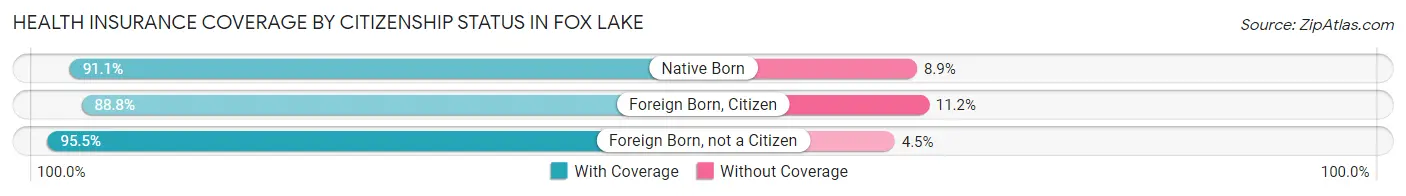
| Citizenship Status | With Coverage | Without Coverage |
| Native Born | 482 (91.1%) | 47 (8.9%) |
| Foreign Born, Citizen | 1,180 (88.8%) | 149 (11.2%) |
| Foreign Born, not a Citizen | 782 (95.5%) | 37 (4.5%) |
Health Insurance Coverage by Household Income in Fox Lake
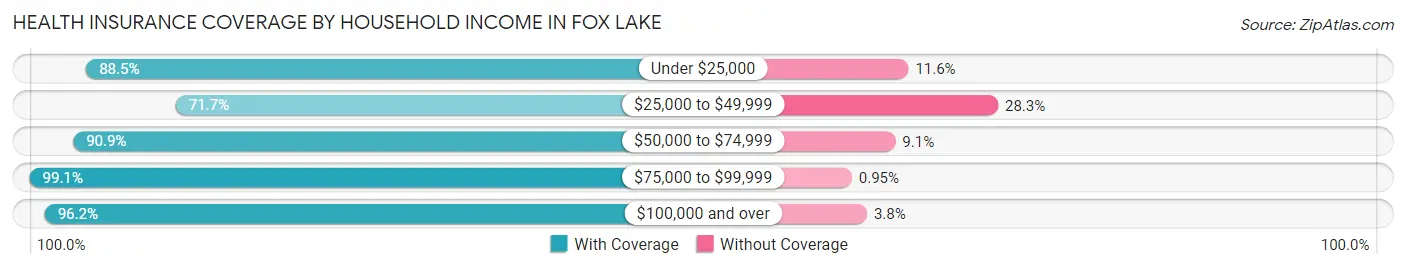
| Household Income | With Coverage | Without Coverage |
| Under $25,000 | 1,417 (88.4%) | 185 (11.6%) |
| $25,000 to $49,999 | 986 (71.7%) | 390 (28.3%) |
| $50,000 to $74,999 | 1,707 (90.9%) | 171 (9.1%) |
| $75,000 to $99,999 | 942 (99.1%) | 9 (0.9%) |
| $100,000 and over | 4,754 (96.2%) | 187 (3.8%) |
Public vs Private Health Insurance Coverage by Age in Fox Lake
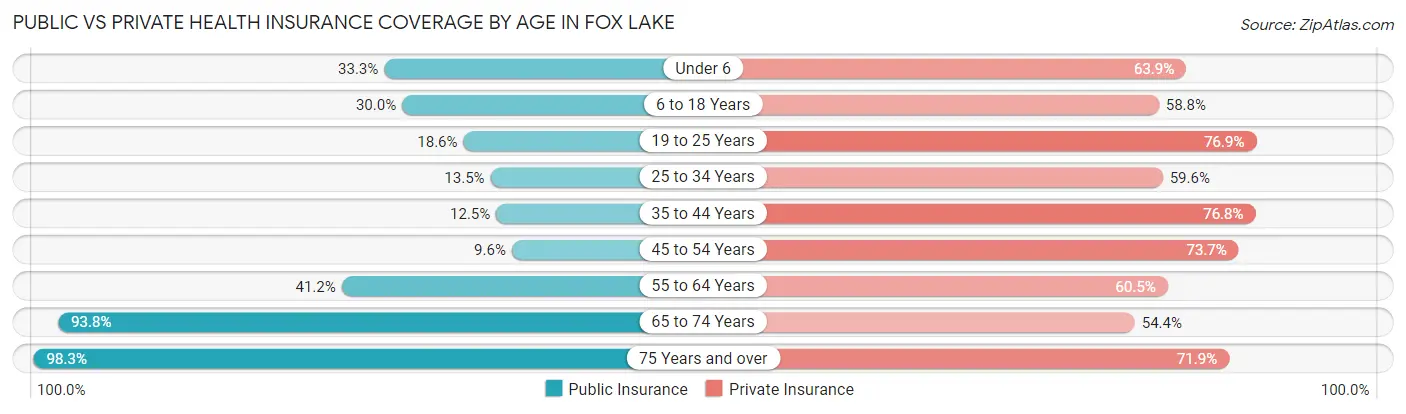
| Age Bracket | Public Insurance | Private Insurance |
| Under 6 | 176 (33.3%) | 338 (63.9%) |
| 6 to 18 Years | 398 (29.9%) | 782 (58.8%) |
| 19 to 25 Years | 152 (18.6%) | 630 (76.9%) |
| 25 to 34 Years | 145 (13.5%) | 638 (59.6%) |
| 35 to 44 Years | 175 (12.5%) | 1,076 (76.7%) |
| 45 to 54 Years | 133 (9.6%) | 1,023 (73.7%) |
| 55 to 64 Years | 699 (41.2%) | 1,027 (60.5%) |
| 65 to 74 Years | 1,392 (93.8%) | 807 (54.4%) |
| 75 Years and over | 1,010 (98.3%) | 738 (71.9%) |
| Total | 4,280 (39.8%) | 7,059 (65.7%) |
Disability Status by Sex by Age in Fox Lake
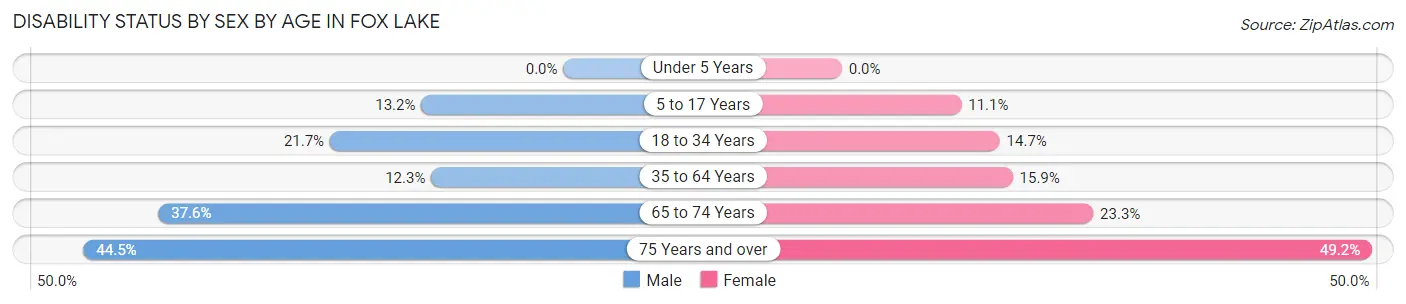
| Age Bracket | Male | Female |
| Under 5 Years | 0 (0.0%) | 0 (0.0%) |
| 5 to 17 Years | 82 (13.2%) | 56 (11.1%) |
| 18 to 34 Years | 250 (21.7%) | 142 (14.6%) |
| 35 to 64 Years | 237 (12.3%) | 405 (15.9%) |
| 65 to 74 Years | 255 (37.6%) | 188 (23.3%) |
| 75 Years and over | 204 (44.5%) | 280 (49.2%) |
Disability Class by Sex by Age in Fox Lake
Disability Class: Hearing Difficulty
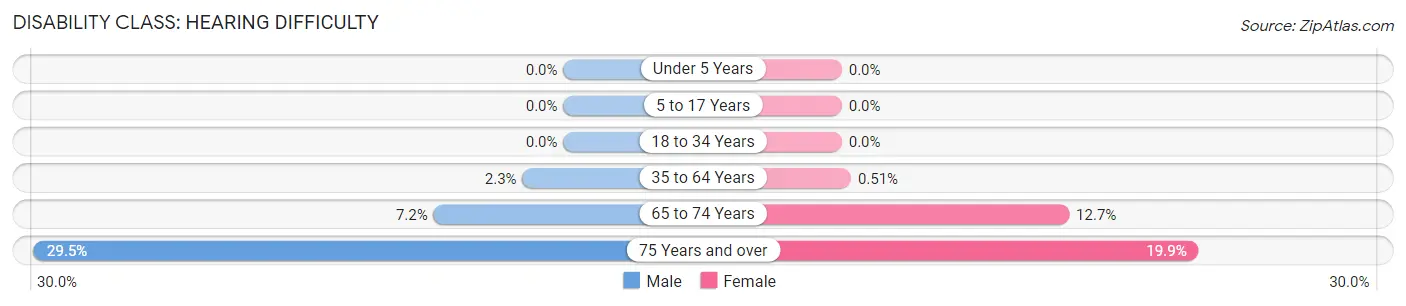
| Age Bracket | Male | Female |
| Under 5 Years | 0 (0.0%) | 0 (0.0%) |
| 5 to 17 Years | 0 (0.0%) | 0 (0.0%) |
| 18 to 34 Years | 0 (0.0%) | 0 (0.0%) |
| 35 to 64 Years | 44 (2.3%) | 13 (0.5%) |
| 65 to 74 Years | 49 (7.2%) | 102 (12.7%) |
| 75 Years and over | 135 (29.5%) | 113 (19.9%) |
Disability Class: Vision Difficulty
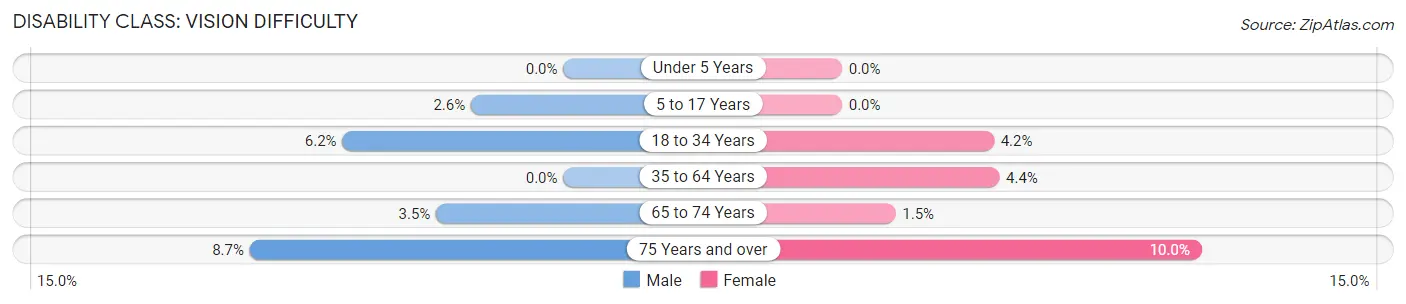
| Age Bracket | Male | Female |
| Under 5 Years | 0 (0.0%) | 0 (0.0%) |
| 5 to 17 Years | 16 (2.6%) | 0 (0.0%) |
| 18 to 34 Years | 71 (6.1%) | 41 (4.2%) |
| 35 to 64 Years | 0 (0.0%) | 112 (4.4%) |
| 65 to 74 Years | 24 (3.5%) | 12 (1.5%) |
| 75 Years and over | 40 (8.7%) | 57 (10.0%) |
Disability Class: Cognitive Difficulty
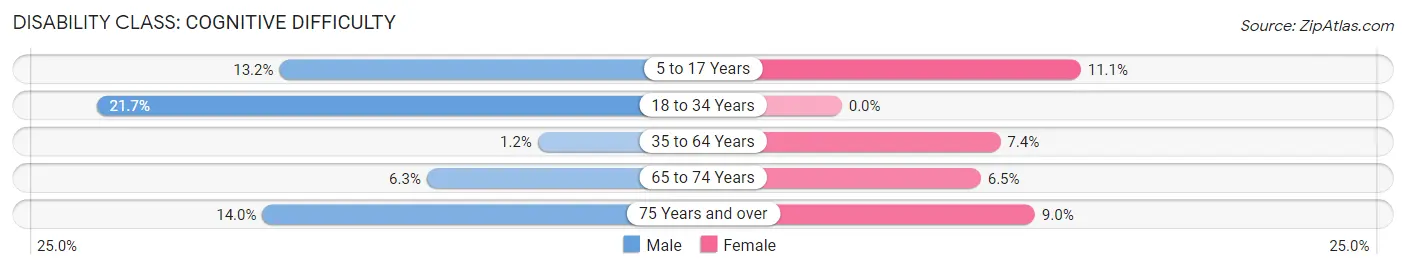
| Age Bracket | Male | Female |
| 5 to 17 Years | 82 (13.2%) | 56 (11.1%) |
| 18 to 34 Years | 250 (21.7%) | 0 (0.0%) |
| 35 to 64 Years | 23 (1.2%) | 188 (7.4%) |
| 65 to 74 Years | 43 (6.3%) | 52 (6.5%) |
| 75 Years and over | 64 (14.0%) | 51 (9.0%) |
Disability Class: Ambulatory Difficulty
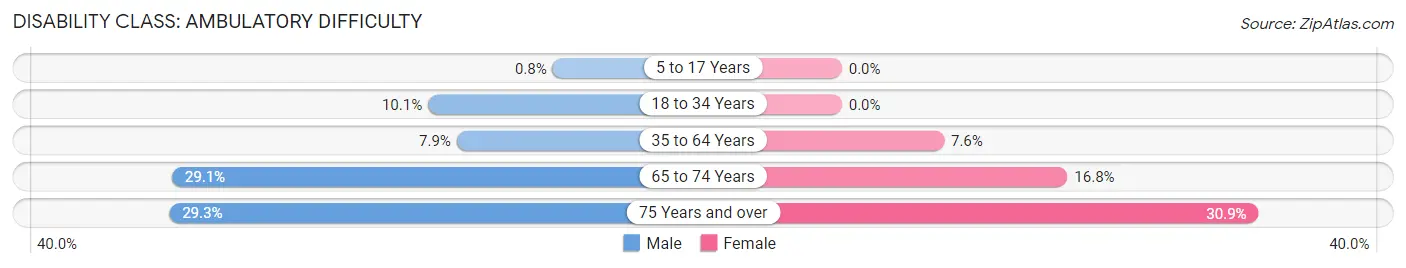
| Age Bracket | Male | Female |
| 5 to 17 Years | 5 (0.8%) | 0 (0.0%) |
| 18 to 34 Years | 116 (10.1%) | 0 (0.0%) |
| 35 to 64 Years | 153 (7.9%) | 194 (7.6%) |
| 65 to 74 Years | 197 (29.1%) | 135 (16.8%) |
| 75 Years and over | 134 (29.3%) | 176 (30.9%) |
Disability Class: Self-Care Difficulty
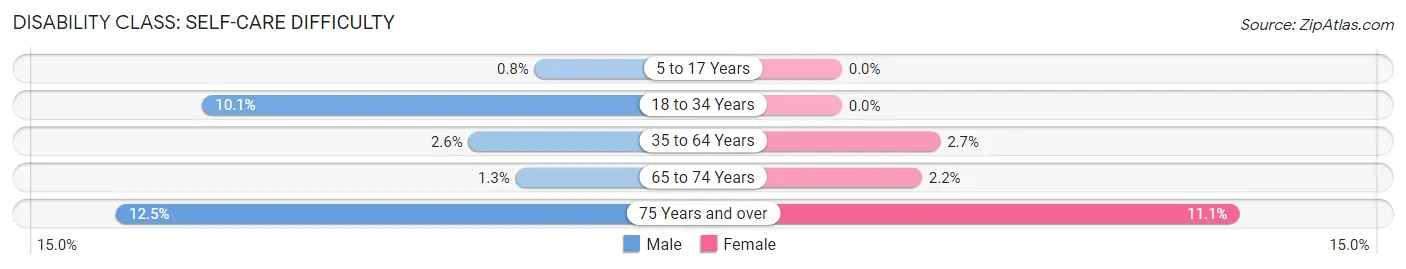
| Age Bracket | Male | Female |
| 5 to 17 Years | 5 (0.8%) | 0 (0.0%) |
| 18 to 34 Years | 116 (10.1%) | 0 (0.0%) |
| 35 to 64 Years | 51 (2.6%) | 70 (2.7%) |
| 65 to 74 Years | 9 (1.3%) | 18 (2.2%) |
| 75 Years and over | 57 (12.4%) | 63 (11.1%) |
Technology Access in Fox Lake
Computing Device Access in Fox Lake
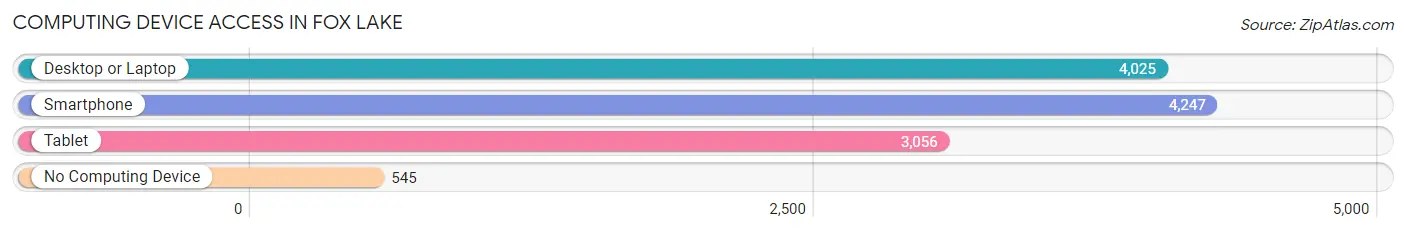
| Device Type | # Households | % Households |
| Desktop or Laptop | 4,025 | 77.5% |
| Smartphone | 4,247 | 81.8% |
| Tablet | 3,056 | 58.9% |
| No Computing Device | 545 | 10.5% |
| Total | 5,191 | 100.0% |
Internet Access in Fox Lake
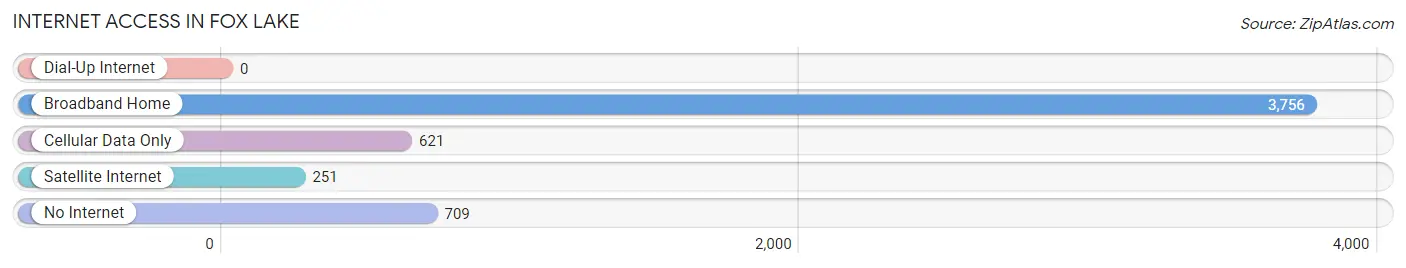
| Internet Type | # Households | % Households |
| Dial-Up Internet | 0 | 0.0% |
| Broadband Home | 3,756 | 72.4% |
| Cellular Data Only | 621 | 12.0% |
| Satellite Internet | 251 | 4.8% |
| No Internet | 709 | 13.7% |
| Total | 5,191 | 100.0% |
Fox Lake Summary
Fox Lake is a village located in Lake County, Illinois, United States. The population was 10,579 at the 2010 census. It is located in the Fox River Valley, and is part of the Chicago metropolitan area.
History
The area that is now Fox Lake was first settled in the 1830s by a group of settlers from New York. The village was originally known as Nippersink, and was later renamed Fox Lake. The name was chosen to honor the many foxes that lived in the area.
The village was officially incorporated in 1907. In the early 1900s, the village was a popular tourist destination, with many resorts and hotels located along the lake. The village was also home to a number of amusement parks, including the Fox Lake Amusement Park, which opened in 1908 and closed in the 1950s.
In the 1950s, the village began to experience a decline in tourism, and the population began to decline as well. In the 1970s, the village began to experience a resurgence in popularity, and the population began to increase again.
Geography
Fox Lake is located at 42°22′45″N 88°10′45″W (42.379167, -88.179167). According to the 2010 census, Fox Lake has a total area of 5.9 square miles (15.3 km2), of which 5.7 square miles (14.8 km2) is land and 0.2 square miles (0.5 km2) is water.
The village is located on the Fox River, and is surrounded by several lakes, including Nippersink Lake, Pistakee Lake, and Fox Lake. The village is also located near several state parks, including Chain O'Lakes State Park and Volo Bog State Natural Area.
Economy
The economy of Fox Lake is largely based on tourism and recreation. The village is home to several resorts and hotels, as well as a number of marinas and boat rental businesses. The village is also home to several restaurants and bars, as well as a number of retail stores.
Demographics
As of the 2010 census, there were 10,579 people, 4,093 households, and 2,717 families residing in the village. The population density was 1,845.3 people per square mile (715.2/km2). There were 4,521 housing units at an average density of 786.3 per square mile (303.7/km2). The racial makeup of the village was 92.2% White, 2.2% African American, 0.3% Native American, 1.7% Asian, 0.1% Pacific Islander, 1.9% from other races, and 1.6% from two or more races. Hispanic or Latino of any race were 6.2% of the population.
There were 4,093 households, out of which 33.2% had children under the age of 18 living with them, 51.2% were married couples living together, 10.7% had a female householder with no husband present, and 33.3% were non-families. 27.2% of all households were made up of individuals, and 9.2% had someone living alone who was 65 years of age or older. The average household size was 2.56 and the average family size was 3.14.
In the village, the population was spread out, with 25.7% under the age of 18, 7.2% from 18 to 24, 30.2% from 25 to 44, 24.2% from 45 to 64, and 12.7% who were 65 years of age or older. The median age was 37 years. For every 100 females, there were 97.2 males. For every 100 females age 18 and over, there were 94.2 males.
The median income for a household in the village was $50,945, and the median income for a family was $60,945. Males had a median income of $45,000 versus $30,000 for females. The per capita income for the village was $24,945. About 4.2% of families and 5.7% of the population were below the poverty line, including 6.7% of those under age 18 and 4.2% of those age 65 or over.
Common Questions
What is Per Capita Income in Fox Lake?
Per Capita income in Fox Lake is $42,676.
What is the Median Family Income in Fox Lake?
Median Family Income in Fox Lake is $102,104.
What is the Median Household income in Fox Lake?
Median Household Income in Fox Lake is $65,528.
What is Income or Wage Gap in Fox Lake?
Income or Wage Gap in Fox Lake is 20.6%.
Women in Fox Lake earn 79.4 cents for every dollar earned by a man.
What is Inequality or Gini Index in Fox Lake?
Inequality or Gini Index in Fox Lake is 0.46.
What is the Total Population of Fox Lake?
Total Population of Fox Lake is 10,798.
What is the Total Male Population of Fox Lake?
Total Male Population of Fox Lake is 4,983.
What is the Total Female Population of Fox Lake?
Total Female Population of Fox Lake is 5,815.
What is the Ratio of Males per 100 Females in Fox Lake?
There are 85.69 Males per 100 Females in Fox Lake.
What is the Ratio of Females per 100 Males in Fox Lake?
There are 116.70 Females per 100 Males in Fox Lake.
What is the Median Population Age in Fox Lake?
Median Population Age in Fox Lake is 47.3 Years.
What is the Average Family Size in Fox Lake
Average Family Size in Fox Lake is 2.8 People.
What is the Average Household Size in Fox Lake
Average Household Size in Fox Lake is 2.1 People.
How Large is the Labor Force in Fox Lake?
There are 5,823 People in the Labor Forcein in Fox Lake.
What is the Percentage of People in the Labor Force in Fox Lake?
62.2% of People are in the Labor Force in Fox Lake.
What is the Unemployment Rate in Fox Lake?
Unemployment Rate in Fox Lake is 3.3%.