Higginson, AR Map & Demographics
Higginson Map
Higginson Overview
$22,320
PER CAPITA INCOME
$62,500
AVG FAMILY INCOME
$68,056
AVG HOUSEHOLD INCOME
68.1%
WAGE / INCOME GAP [ % ]
31.9¢/ $1
WAGE / INCOME GAP [ $ ]
0.30
INEQUALITY / GINI INDEX
981
TOTAL POPULATION
442
MALE POPULATION
539
FEMALE POPULATION
82.00
MALES / 100 FEMALES
121.95
FEMALES / 100 MALES
25.0
MEDIAN AGE
3.7
AVG FAMILY SIZE
3.3
AVG HOUSEHOLD SIZE
562
LABOR FORCE [ PEOPLE ]
72.1%
PERCENT IN LABOR FORCE
3.9%
UNEMPLOYMENT RATE
Higginson Zip Codes
Higginson Area Codes
Income in Higginson
Income Overview in Higginson
Per Capita Income in Higginson is $22,320, while median incomes of families and households are $62,500 and $68,056 respectively.
| Characteristic | Number | Measure |
| Per Capita Income | 981 | $22,320 |
| Median Family Income | 196 | $62,500 |
| Mean Family Income | 196 | $65,211 |
| Median Household Income | 298 | $68,056 |
| Mean Household Income | 298 | $66,496 |
| Income Deficit | 196 | $0 |
| Wage / Income Gap (%) | 981 | 68.10% |
| Wage / Income Gap ($) | 981 | 31.90¢ per $1 |
| Gini / Inequality Index | 981 | 0.30 |
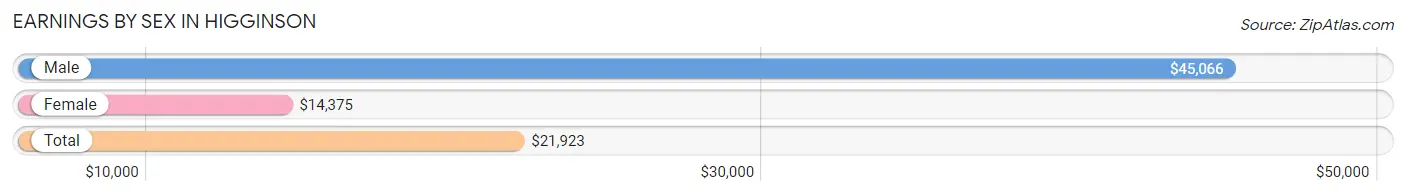
Earnings by Sex in Higginson
Average Earnings in Higginson are $21,923, $45,066 for men and $14,375 for women, a difference of 68.1%.
| Sex | Number | Average Earnings |
| Male | 275 (46.9%) | $45,066 |
| Female | 311 (53.1%) | $14,375 |
| Total | 586 (100.0%) | $21,923 |
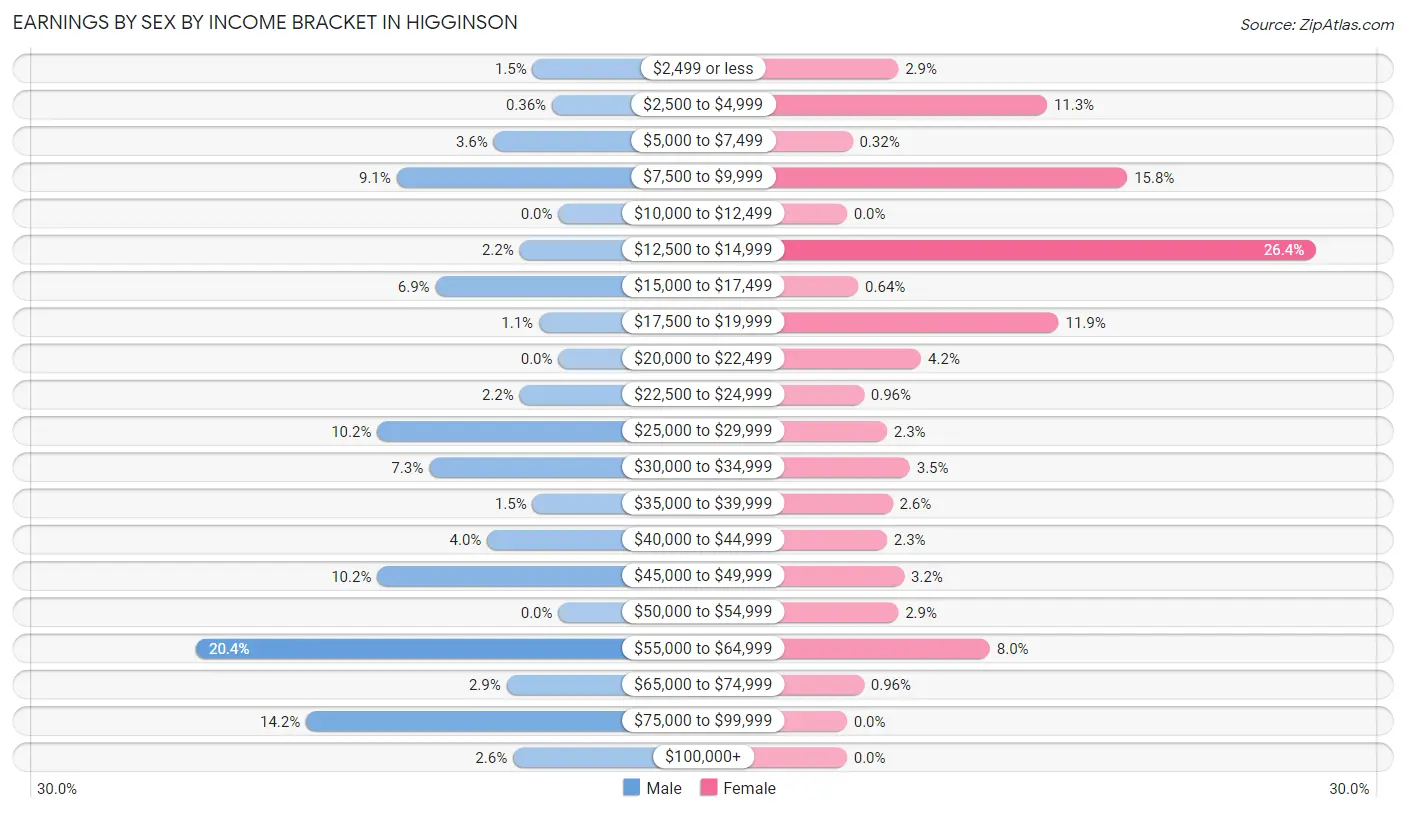
Earnings by Sex by Income Bracket in Higginson
The most common earnings brackets in Higginson are $55,000 to $64,999 for men (56 | 20.4%) and $12,500 to $14,999 for women (82 | 26.4%).
| Income | Male | Female |
| $2,499 or less | 4 (1.5%) | 9 (2.9%) |
| $2,500 to $4,999 | 1 (0.4%) | 35 (11.3%) |
| $5,000 to $7,499 | 10 (3.6%) | 1 (0.3%) |
| $7,500 to $9,999 | 25 (9.1%) | 49 (15.8%) |
| $10,000 to $12,499 | 0 (0.0%) | 0 (0.0%) |
| $12,500 to $14,999 | 6 (2.2%) | 82 (26.4%) |
| $15,000 to $17,499 | 19 (6.9%) | 2 (0.6%) |
| $17,500 to $19,999 | 3 (1.1%) | 37 (11.9%) |
| $20,000 to $22,499 | 0 (0.0%) | 13 (4.2%) |
| $22,500 to $24,999 | 6 (2.2%) | 3 (1.0%) |
| $25,000 to $29,999 | 28 (10.2%) | 7 (2.2%) |
| $30,000 to $34,999 | 20 (7.3%) | 11 (3.5%) |
| $35,000 to $39,999 | 4 (1.5%) | 8 (2.6%) |
| $40,000 to $44,999 | 11 (4.0%) | 7 (2.2%) |
| $45,000 to $49,999 | 28 (10.2%) | 10 (3.2%) |
| $50,000 to $54,999 | 0 (0.0%) | 9 (2.9%) |
| $55,000 to $64,999 | 56 (20.4%) | 25 (8.0%) |
| $65,000 to $74,999 | 8 (2.9%) | 3 (1.0%) |
| $75,000 to $99,999 | 39 (14.2%) | 0 (0.0%) |
| $100,000+ | 7 (2.5%) | 0 (0.0%) |
| Total | 275 (100.0%) | 311 (100.0%) |
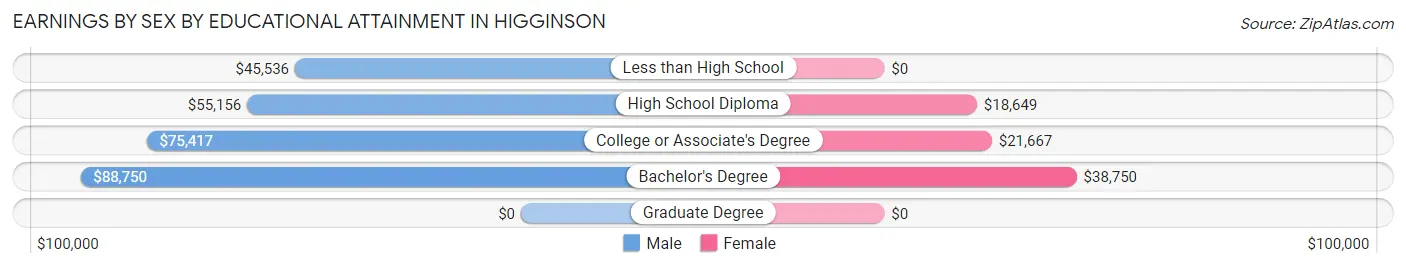
Earnings by Sex by Educational Attainment in Higginson
Average earnings in Higginson are $55,313 for men and $19,662 for women, a difference of 64.4%. Men with an educational attainment of bachelor's degree enjoy the highest average annual earnings of $88,750, while those with less than high school education earn the least with $45,536. Women with an educational attainment of bachelor's degree earn the most with the average annual earnings of $38,750, while those with high school diploma education have the smallest earnings of $18,649.
| Educational Attainment | Male Income | Female Income |
| Less than High School | $45,536 | $0 |
| High School Diploma | $55,156 | $18,649 |
| College or Associate's Degree | $75,417 | $21,667 |
| Bachelor's Degree | $88,750 | $38,750 |
| Graduate Degree | - | - |
| Total | $55,313 | $19,662 |
Family Income in Higginson
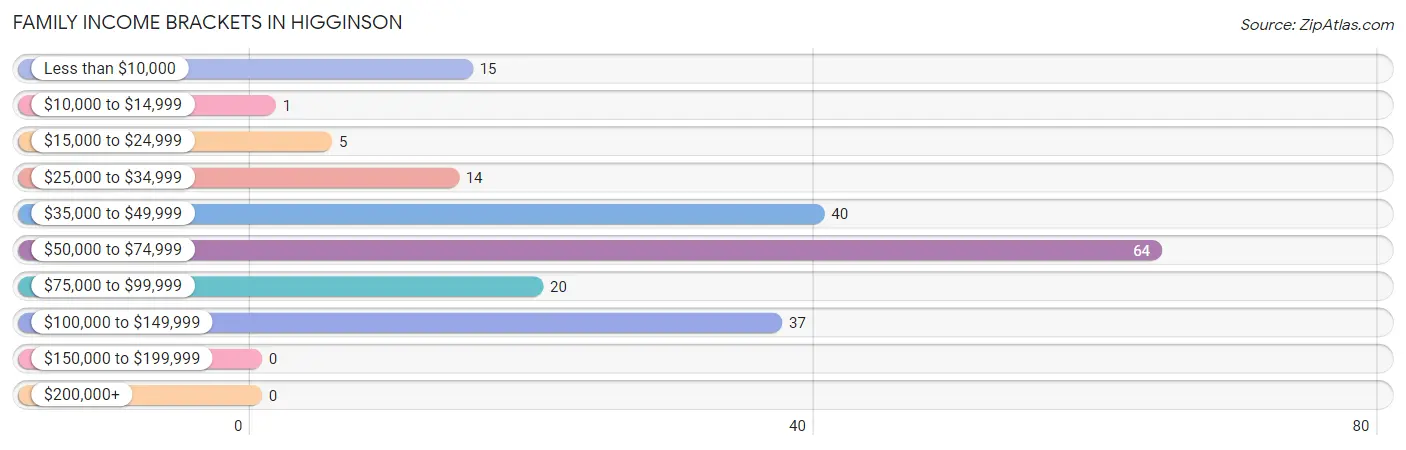
Family Income Brackets in Higginson
According to the Higginson family income data, there are 64 families falling into the $50,000 to $74,999 income range, which is the most common income bracket and makes up 32.7% of all families.
| Income Bracket | # Families | % Families |
| Less than $10,000 | 15 | 7.7% |
| $10,000 to $14,999 | 1 | 0.5% |
| $15,000 to $24,999 | 5 | 2.6% |
| $25,000 to $34,999 | 14 | 7.1% |
| $35,000 to $49,999 | 40 | 20.4% |
| $50,000 to $74,999 | 64 | 32.7% |
| $75,000 to $99,999 | 20 | 10.2% |
| $100,000 to $149,999 | 37 | 18.9% |
| $150,000 to $199,999 | 0 | 0.0% |
| $200,000+ | 0 | 0.0% |
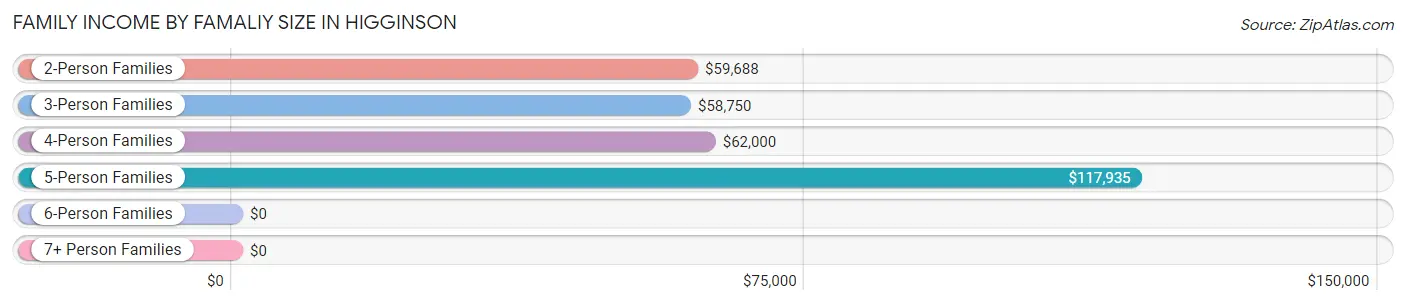
Family Income by Famaliy Size in Higginson
5-person families (46 | 23.5%) account for the highest median family income in Higginson with $117,935 per family, while 2-person families (97 | 49.5%) have the highest median income of $29,844 per family member.
| Income Bracket | # Families | Median Income |
| 2-Person Families | 97 (49.5%) | $59,688 |
| 3-Person Families | 20 (10.2%) | $58,750 |
| 4-Person Families | 20 (10.2%) | $62,000 |
| 5-Person Families | 46 (23.5%) | $117,935 |
| 6-Person Families | 13 (6.6%) | $0 |
| 7+ Person Families | 0 (0.0%) | $0 |
| Total | 196 (100.0%) | $62,500 |
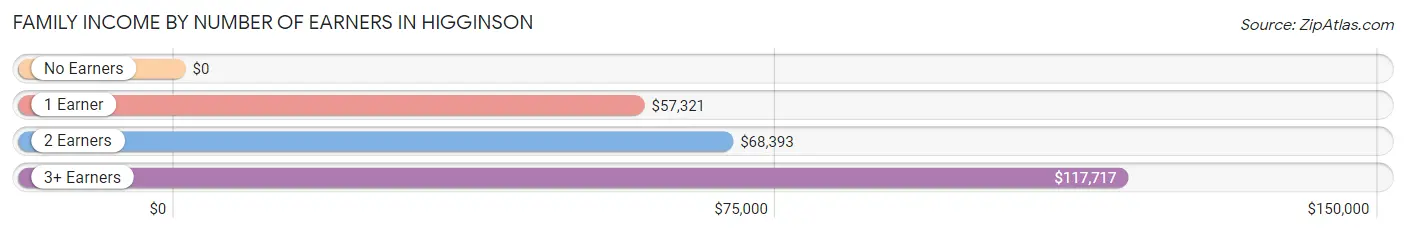
Family Income by Number of Earners in Higginson
| Number of Earners | # Families | Median Income |
| No Earners | 12 (6.1%) | $0 |
| 1 Earner | 97 (49.5%) | $57,321 |
| 2 Earners | 45 (23.0%) | $68,393 |
| 3+ Earners | 42 (21.4%) | $117,717 |
| Total | 196 (100.0%) | $62,500 |
Household Income in Higginson
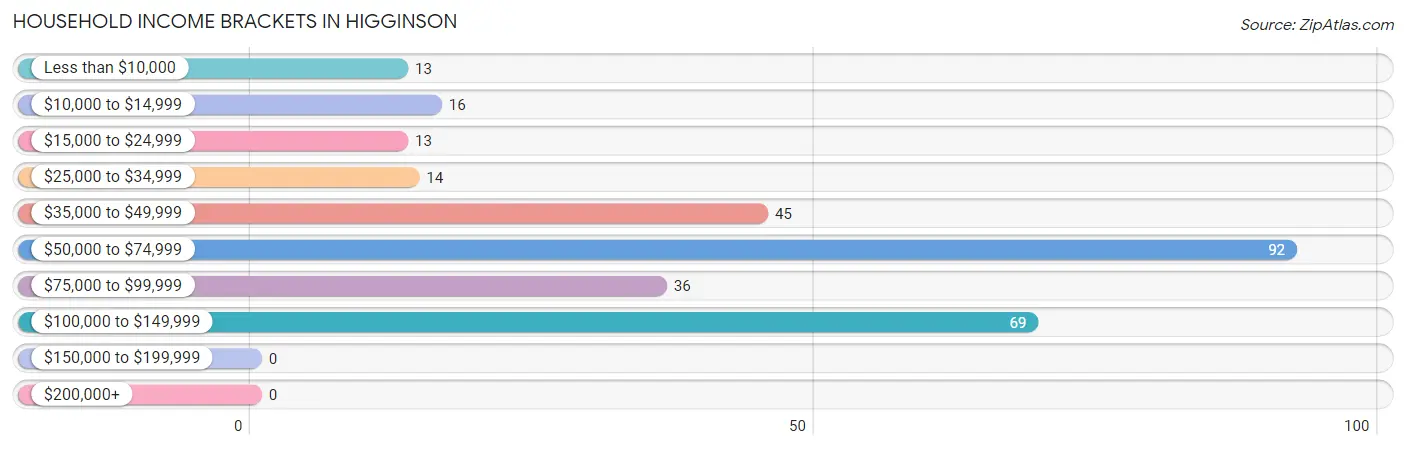
Household Income Brackets in Higginson
With 92 households falling in the category, the $50,000 to $74,999 income range is the most frequent in Higginson, accounting for 30.9% of all households.
| Income Bracket | # Households | % Households |
| Less than $10,000 | 13 | 4.4% |
| $10,000 to $14,999 | 16 | 5.4% |
| $15,000 to $24,999 | 13 | 4.4% |
| $25,000 to $34,999 | 14 | 4.7% |
| $35,000 to $49,999 | 45 | 15.1% |
| $50,000 to $74,999 | 92 | 30.9% |
| $75,000 to $99,999 | 36 | 12.1% |
| $100,000 to $149,999 | 69 | 23.2% |
| $150,000 to $199,999 | 0 | 0.0% |
| $200,000+ | 0 | 0.0% |
Household Income by Householder Age in Higginson
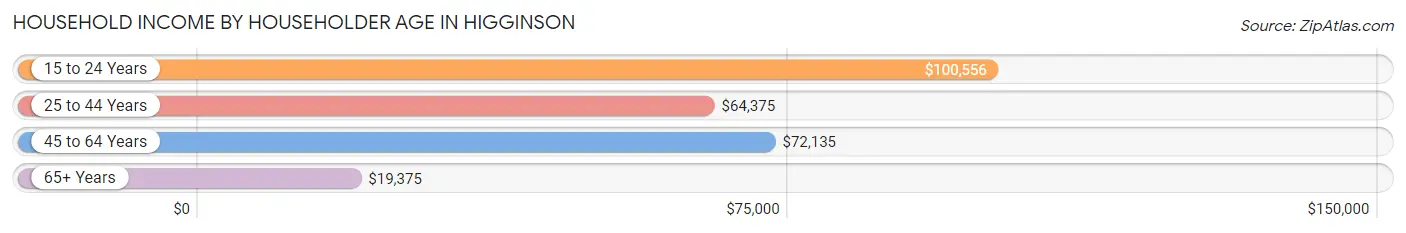
The median household income in Higginson is $68,056, with the highest median household income of $100,556 found in the 15 to 24 years age bracket for the primary householder. A total of 38 households (12.8%) fall into this category. Meanwhile, the 65+ years age bracket for the primary householder has the lowest median household income of $19,375, with 37 households (12.4%) in this group.
| Income Bracket | # Households | Median Income |
| 15 to 24 Years | 38 (12.8%) | $100,556 |
| 25 to 44 Years | 102 (34.2%) | $64,375 |
| 45 to 64 Years | 121 (40.6%) | $72,135 |
| 65+ Years | 37 (12.4%) | $19,375 |
| Total | 298 (100.0%) | $68,056 |
Poverty in Higginson
Income Below Poverty by Sex and Age in Higginson
With 12.2% poverty level for males and 19.2% for females among the residents of Higginson, 15 year old males and 16 and 17 year old females are the most vulnerable to poverty, with 7 males (87.5%) and 38 females (62.3%) in their respective age groups living below the poverty level.
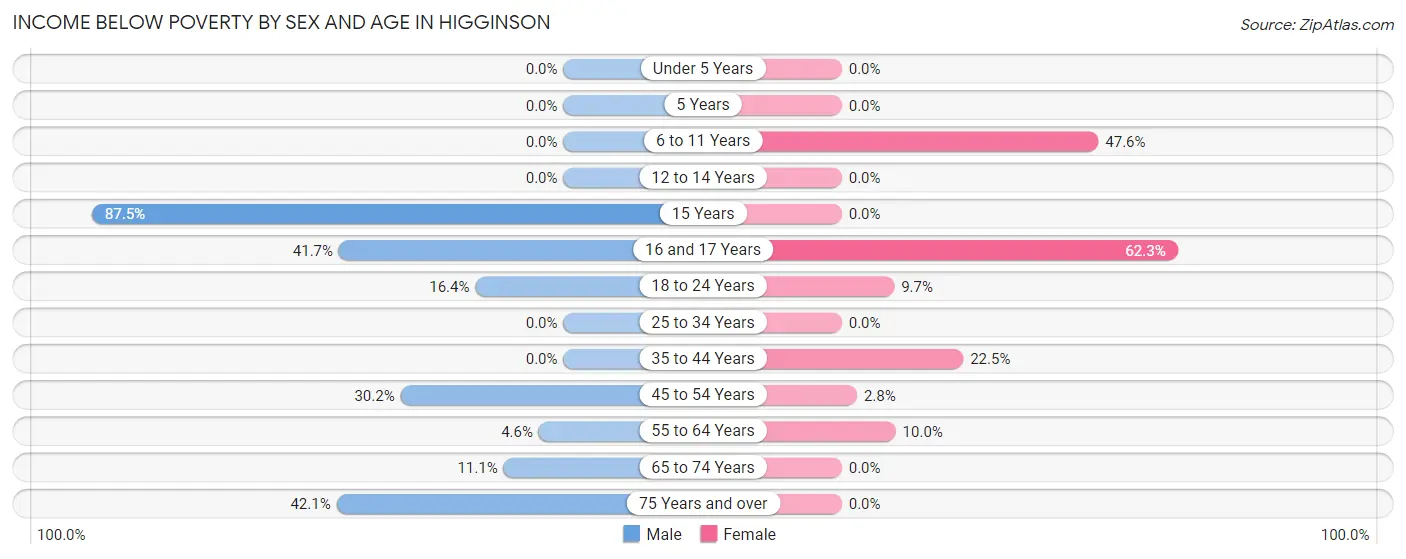
| Age Bracket | Male | Female |
| Under 5 Years | 0 (0.0%) | 0 (0.0%) |
| 5 Years | 0 (0.0%) | 0 (0.0%) |
| 6 to 11 Years | 0 (0.0%) | 30 (47.6%) |
| 12 to 14 Years | 0 (0.0%) | 0 (0.0%) |
| 15 Years | 7 (87.5%) | 0 (0.0%) |
| 16 and 17 Years | 5 (41.7%) | 38 (62.3%) |
| 18 to 24 Years | 17 (16.4%) | 11 (9.7%) |
| 25 to 34 Years | 0 (0.0%) | 0 (0.0%) |
| 35 to 44 Years | 0 (0.0%) | 16 (22.5%) |
| 45 to 54 Years | 13 (30.2%) | 2 (2.8%) |
| 55 to 64 Years | 2 (4.5%) | 3 (10.0%) |
| 65 to 74 Years | 2 (11.1%) | 0 (0.0%) |
| 75 Years and over | 8 (42.1%) | 0 (0.0%) |
| Total | 54 (12.2%) | 100 (19.2%) |
Income Above Poverty by Sex and Age in Higginson
According to the poverty statistics in Higginson, males aged under 5 years and females aged under 5 years are the age groups that are most secure financially, with 100.0% of males and 100.0% of females in these age groups living above the poverty line.
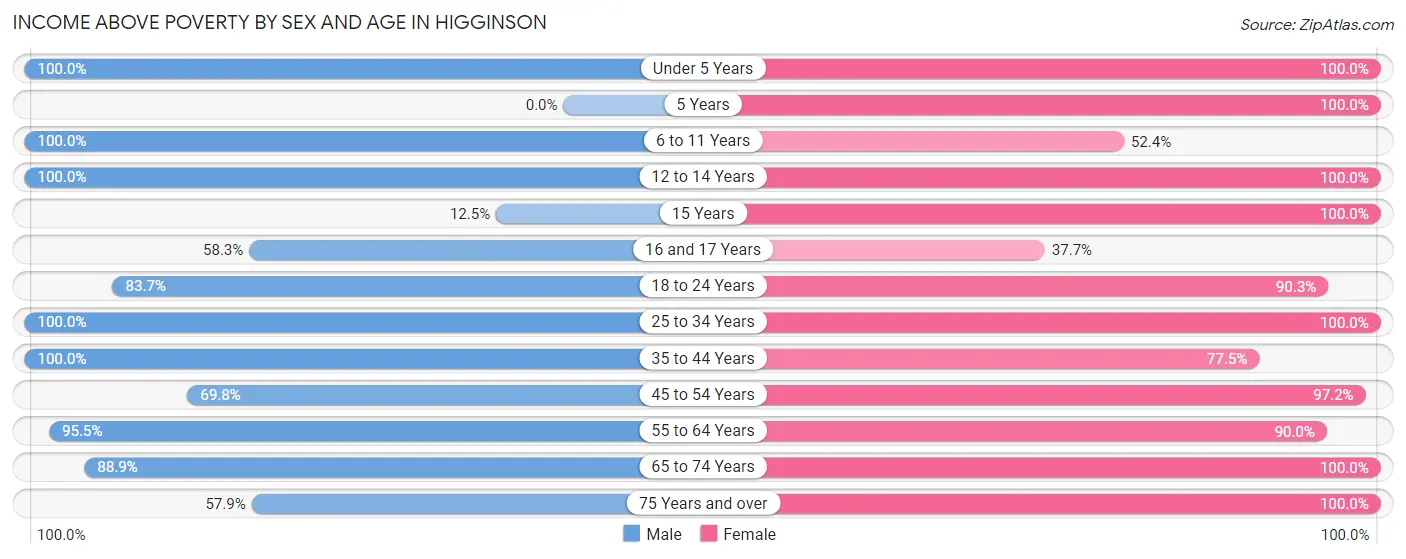
| Age Bracket | Male | Female |
| Under 5 Years | 11 (100.0%) | 26 (100.0%) |
| 5 Years | 0 (0.0%) | 2 (100.0%) |
| 6 to 11 Years | 40 (100.0%) | 33 (52.4%) |
| 12 to 14 Years | 11 (100.0%) | 9 (100.0%) |
| 15 Years | 1 (12.5%) | 12 (100.0%) |
| 16 and 17 Years | 7 (58.3%) | 23 (37.7%) |
| 18 to 24 Years | 87 (83.7%) | 102 (90.3%) |
| 25 to 34 Years | 61 (100.0%) | 33 (100.0%) |
| 35 to 44 Years | 71 (100.0%) | 55 (77.5%) |
| 45 to 54 Years | 30 (69.8%) | 69 (97.2%) |
| 55 to 64 Years | 42 (95.5%) | 27 (90.0%) |
| 65 to 74 Years | 16 (88.9%) | 14 (100.0%) |
| 75 Years and over | 11 (57.9%) | 15 (100.0%) |
| Total | 388 (87.8%) | 420 (80.8%) |
Income Below Poverty Among Married-Couple Families in Higginson
The poverty statistics for married-couple families in Higginson show that 7.1% or 9 of the total 126 families live below the poverty line. Families with 1 or 2 children have the highest poverty rate of 14.9%, comprising of 7 families. On the other hand, families with 3 or 4 children have the lowest poverty rate of 0.0%, which includes 0 families.
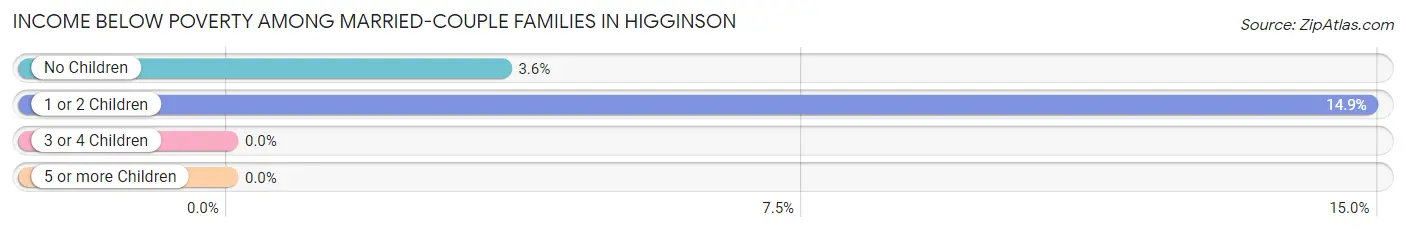
| Children | Above Poverty | Below Poverty |
| No Children | 54 (96.4%) | 2 (3.6%) |
| 1 or 2 Children | 40 (85.1%) | 7 (14.9%) |
| 3 or 4 Children | 23 (100.0%) | 0 (0.0%) |
| 5 or more Children | 0 (0.0%) | 0 (0.0%) |
| Total | 117 (92.9%) | 9 (7.1%) |
Income Below Poverty Among Single-Parent Households in Higginson
According to the poverty data in Higginson, 26.0% or 13 single-father households and 5.0% or 1 single-mother households are living below the poverty line. Among single-father households, those with 1 or 2 children have the highest poverty rate, with 13 households (61.9%) experiencing poverty. Likewise, among single-mother households, those with no children have the highest poverty rate, with 1 households (25.0%) falling below the poverty line.
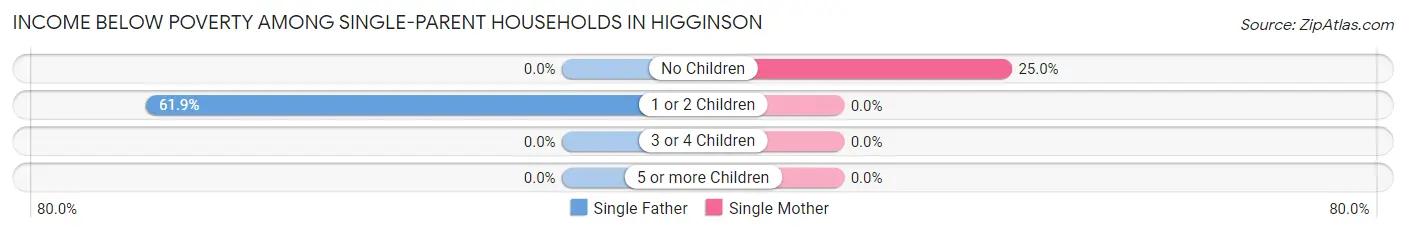
| Children | Single Father | Single Mother |
| No Children | 0 (0.0%) | 1 (25.0%) |
| 1 or 2 Children | 13 (61.9%) | 0 (0.0%) |
| 3 or 4 Children | 0 (0.0%) | 0 (0.0%) |
| 5 or more Children | 0 (0.0%) | 0 (0.0%) |
| Total | 13 (26.0%) | 1 (5.0%) |
Income Below Poverty Among Married-Couple vs Single-Parent Households in Higginson
The poverty data for Higginson shows that 9 of the married-couple family households (7.1%) and 14 of the single-parent households (20.0%) are living below the poverty level. Within the married-couple family households, those with 1 or 2 children have the highest poverty rate, with 7 households (14.9%) falling below the poverty line. Among the single-parent households, those with 1 or 2 children have the highest poverty rate, with 13 household (35.1%) living below poverty.
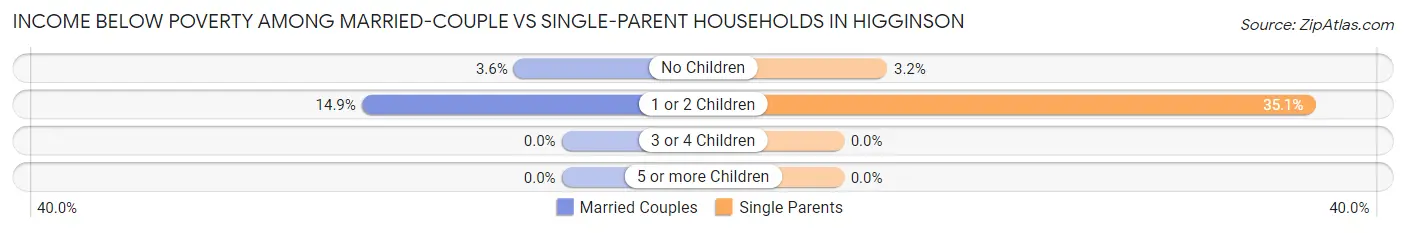
| Children | Married-Couple Families | Single-Parent Households |
| No Children | 2 (3.6%) | 1 (3.2%) |
| 1 or 2 Children | 7 (14.9%) | 13 (35.1%) |
| 3 or 4 Children | 0 (0.0%) | 0 (0.0%) |
| 5 or more Children | 0 (0.0%) | 0 (0.0%) |
| Total | 9 (7.1%) | 14 (20.0%) |
Race in Higginson
The most populous races in Higginson are White / Caucasian (741 | 75.5%), Two or more Races (185 | 18.9%), and Hispanic or Latino (55 | 5.6%).
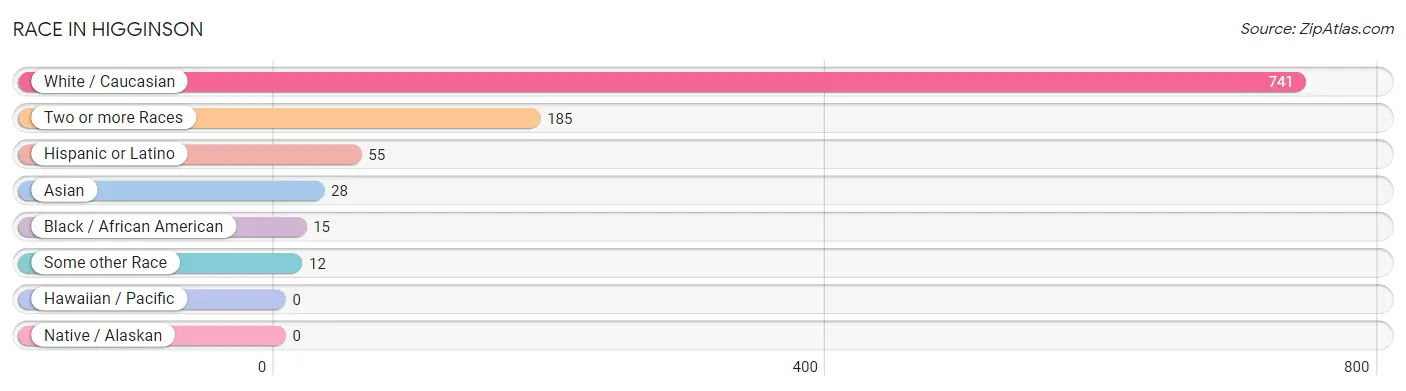
| Race | # Population | % Population |
| Asian | 28 | 2.9% |
| Black / African American | 15 | 1.5% |
| Hawaiian / Pacific | 0 | 0.0% |
| Hispanic or Latino | 55 | 5.6% |
| Native / Alaskan | 0 | 0.0% |
| White / Caucasian | 741 | 75.5% |
| Two or more Races | 185 | 18.9% |
| Some other Race | 12 | 1.2% |
| Total | 981 | 100.0% |
Ancestry in Higginson
The most populous ancestries reported in Higginson are English (93 | 9.5%), German (68 | 6.9%), American (64 | 6.5%), Mexican (37 | 3.8%), and Irish (36 | 3.7%), together accounting for 30.4% of all Higginson residents.
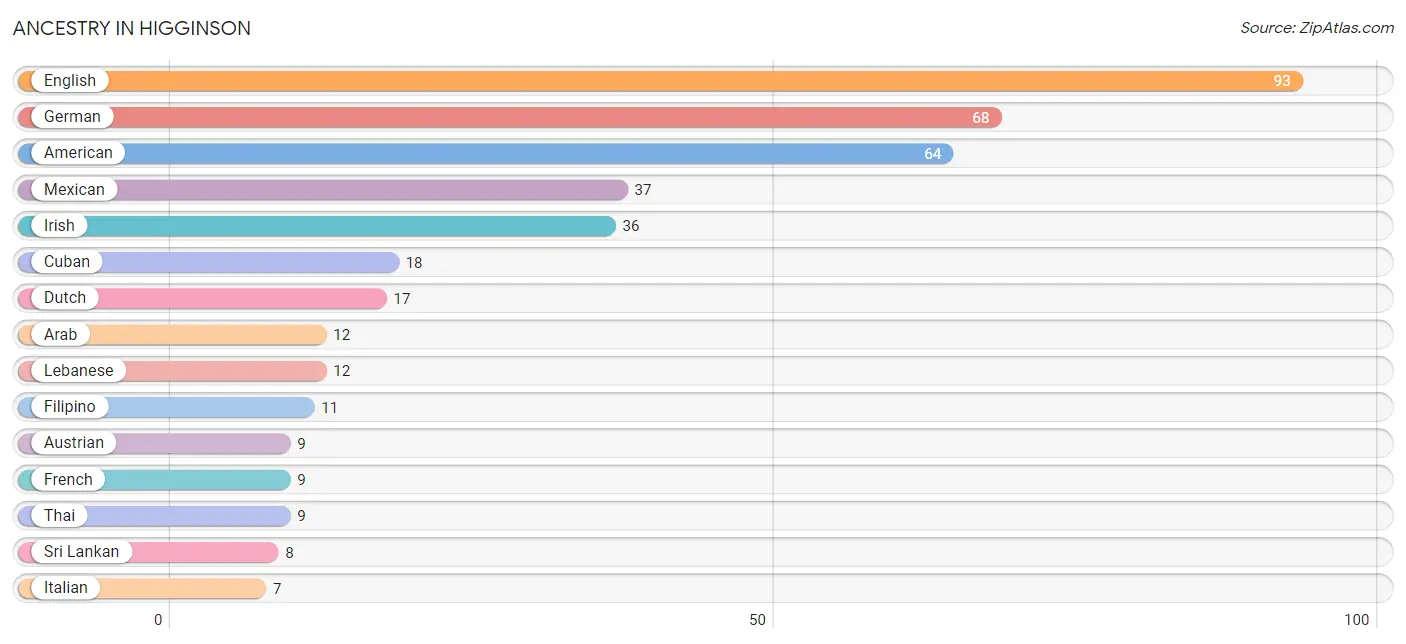
| Ancestry | # Population | % Population |
| American | 64 | 6.5% |
| Arab | 12 | 1.2% |
| Austrian | 9 | 0.9% |
| Cuban | 18 | 1.8% |
| Dutch | 17 | 1.7% |
| English | 93 | 9.5% |
| European | 3 | 0.3% |
| Filipino | 11 | 1.1% |
| French | 9 | 0.9% |
| German | 68 | 6.9% |
| Indian (Asian) | 2 | 0.2% |
| Irish | 36 | 3.7% |
| Italian | 7 | 0.7% |
| Korean | 7 | 0.7% |
| Lebanese | 12 | 1.2% |
| Mexican | 37 | 3.8% |
| Navajo | 2 | 0.2% |
| Russian | 7 | 0.7% |
| Scandinavian | 1 | 0.1% |
| Sri Lankan | 8 | 0.8% |
| Thai | 9 | 0.9% |
| Welsh | 3 | 0.3% | View All 22 Rows |
Immigrants in Higginson
The most numerous immigrant groups reported in Higginson came from Central America (11 | 1.1%), Europe (11 | 1.1%), Latin America (11 | 1.1%), Mexico (11 | 1.1%), and Western Europe (11 | 1.1%), together accounting for 5.6% of all Higginson residents.
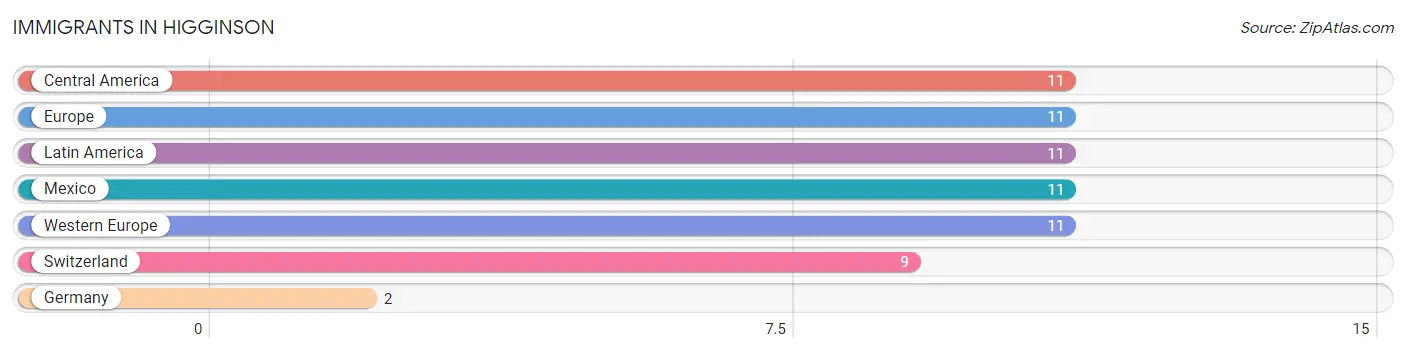
| Immigration Origin | # Population | % Population |
| Central America | 11 | 1.1% |
| Europe | 11 | 1.1% |
| Germany | 2 | 0.2% |
| Latin America | 11 | 1.1% |
| Mexico | 11 | 1.1% |
| Switzerland | 9 | 0.9% |
| Western Europe | 11 | 1.1% | View All 7 Rows |
Sex and Age in Higginson
Sex and Age in Higginson
The most populous age groups in Higginson are 20 to 24 Years (102 | 23.1%) for men and 20 to 24 Years (100 | 18.5%) for women.
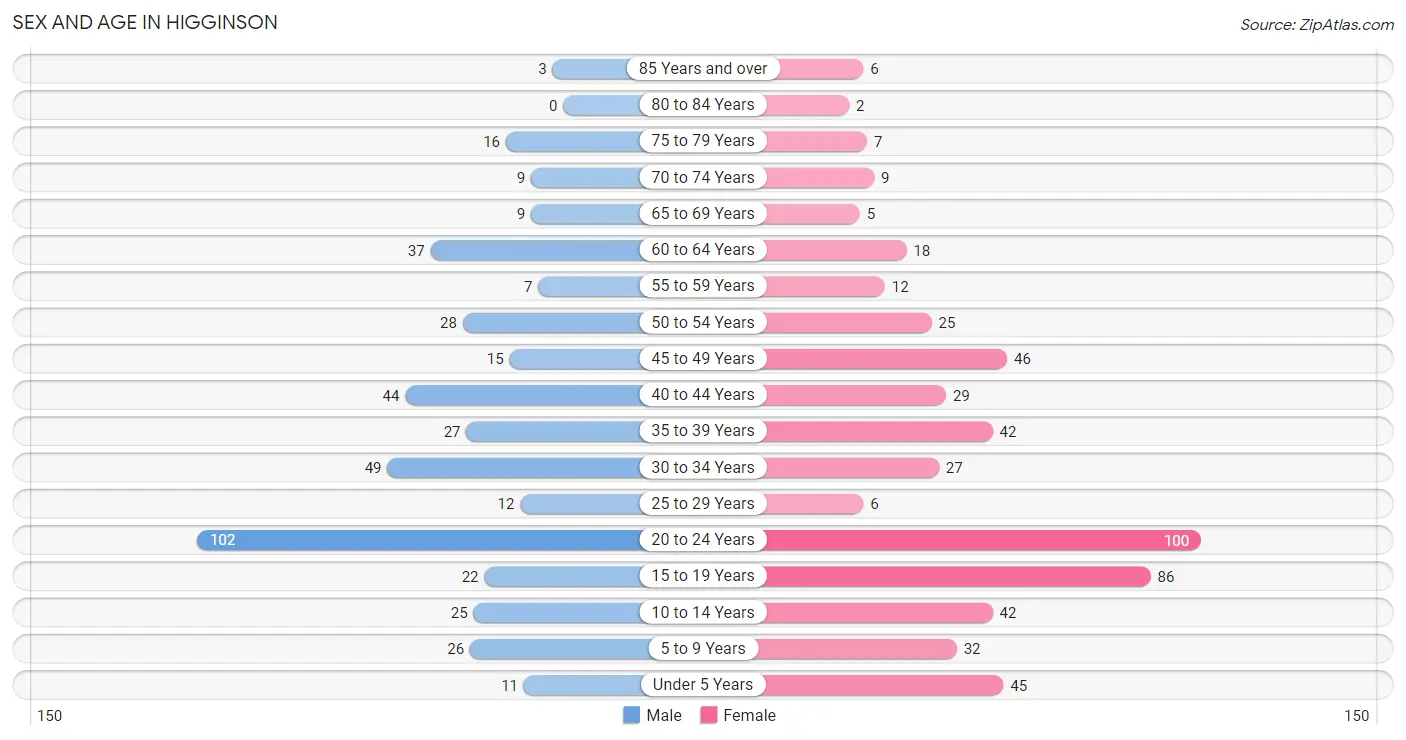
| Age Bracket | Male | Female |
| Under 5 Years | 11 (2.5%) | 45 (8.4%) |
| 5 to 9 Years | 26 (5.9%) | 32 (5.9%) |
| 10 to 14 Years | 25 (5.7%) | 42 (7.8%) |
| 15 to 19 Years | 22 (5.0%) | 86 (16.0%) |
| 20 to 24 Years | 102 (23.1%) | 100 (18.5%) |
| 25 to 29 Years | 12 (2.7%) | 6 (1.1%) |
| 30 to 34 Years | 49 (11.1%) | 27 (5.0%) |
| 35 to 39 Years | 27 (6.1%) | 42 (7.8%) |
| 40 to 44 Years | 44 (10.0%) | 29 (5.4%) |
| 45 to 49 Years | 15 (3.4%) | 46 (8.5%) |
| 50 to 54 Years | 28 (6.3%) | 25 (4.6%) |
| 55 to 59 Years | 7 (1.6%) | 12 (2.2%) |
| 60 to 64 Years | 37 (8.4%) | 18 (3.3%) |
| 65 to 69 Years | 9 (2.0%) | 5 (0.9%) |
| 70 to 74 Years | 9 (2.0%) | 9 (1.7%) |
| 75 to 79 Years | 16 (3.6%) | 7 (1.3%) |
| 80 to 84 Years | 0 (0.0%) | 2 (0.4%) |
| 85 Years and over | 3 (0.7%) | 6 (1.1%) |
| Total | 442 (100.0%) | 539 (100.0%) |
Families and Households in Higginson
Median Family Size in Higginson
The median family size in Higginson is 3.70 persons per family, with married-couple families (126 | 64.3%) accounting for the largest median family size of 3.79 persons per family. On the other hand, single female/mother families (20 | 10.2%) represent the smallest median family size with 3.50 persons per family.
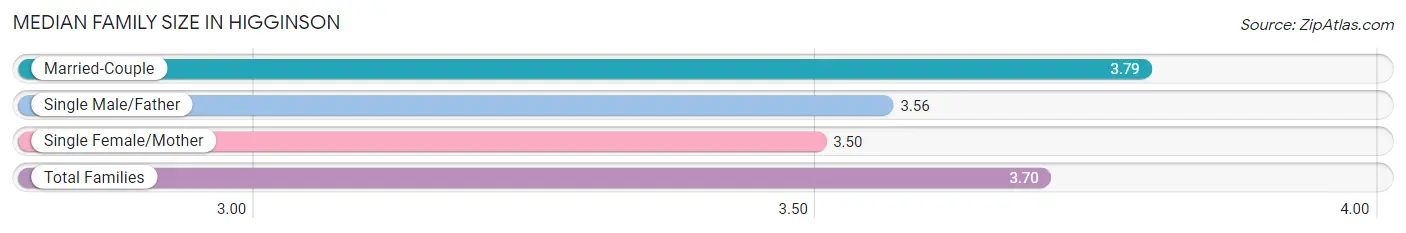
| Family Type | # Families | Family Size |
| Married-Couple | 126 (64.3%) | 3.79 |
| Single Male/Father | 50 (25.5%) | 3.56 |
| Single Female/Mother | 20 (10.2%) | 3.50 |
| Total Families | 196 (100.0%) | 3.70 |
Median Household Size in Higginson
The median household size in Higginson is 3.29 persons per household, with single male/father households (50 | 16.8%) accounting for the largest median household size of 5.24 persons per household. non-family households (102 | 34.2%) represent the smallest median household size with 1.50 persons per household.
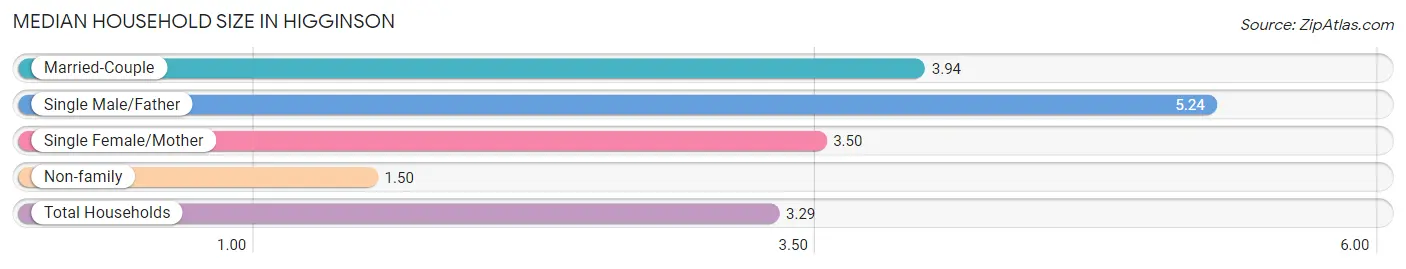
| Household Type | # Households | Household Size |
| Married-Couple | 126 (42.3%) | 3.94 |
| Single Male/Father | 50 (16.8%) | 5.24 |
| Single Female/Mother | 20 (6.7%) | 3.50 |
| Non-family | 102 (34.2%) | 1.50 |
| Total Households | 298 (100.0%) | 3.29 |
Household Size by Marriage Status in Higginson
Out of a total of 298 households in Higginson, 196 (65.8%) are family households, while 102 (34.2%) are nonfamily households. The most numerous type of family households are 2-person households, comprising 75, and the most common type of nonfamily households are 1-person households, comprising 60.
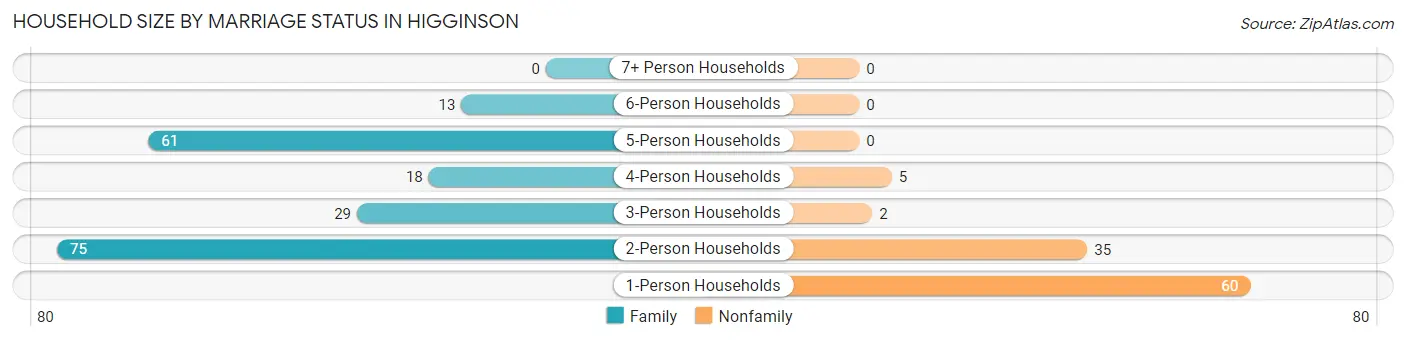
| Household Size | Family Households | Nonfamily Households |
| 1-Person Households | - | 60 (20.1%) |
| 2-Person Households | 75 (25.2%) | 35 (11.7%) |
| 3-Person Households | 29 (9.7%) | 2 (0.7%) |
| 4-Person Households | 18 (6.0%) | 5 (1.7%) |
| 5-Person Households | 61 (20.5%) | 0 (0.0%) |
| 6-Person Households | 13 (4.4%) | 0 (0.0%) |
| 7+ Person Households | 0 (0.0%) | 0 (0.0%) |
| Total | 196 (65.8%) | 102 (34.2%) |
Female Fertility in Higginson
Fertility by Age in Higginson
Average fertility rate in Higginson is 63.0 births per 1,000 women. Women in the age bracket of 20 to 34 years have the highest fertility rate with 158.0 births per 1,000 women. Women in the age bracket of 20 to 34 years acount for 100.0% of all women with births.
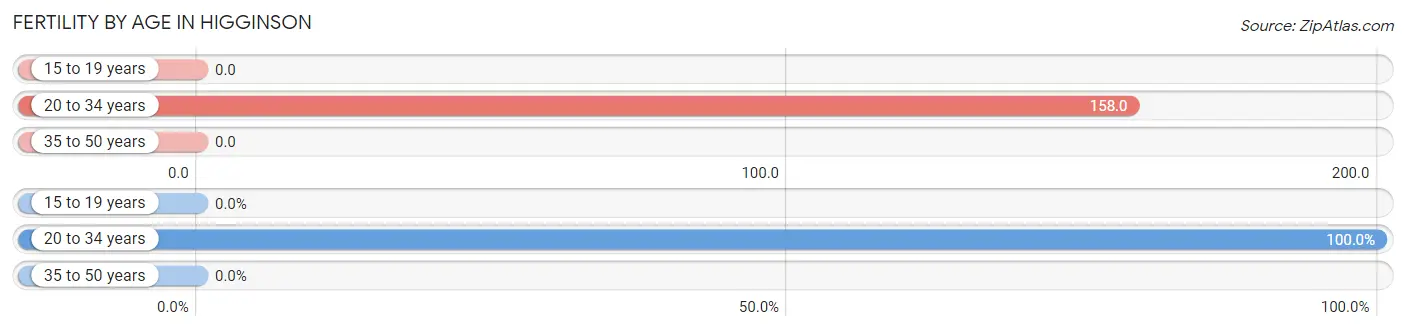
| Age Bracket | Women with Births | Births / 1,000 Women |
| 15 to 19 years | 0 (0.0%) | 0.0 |
| 20 to 34 years | 21 (100.0%) | 158.0 |
| 35 to 50 years | 0 (0.0%) | 0.0 |
| Total | 21 (100.0%) | 63.0 |
Fertility by Age by Marriage Status in Higginson
66.7% of women with births (21) in Higginson are married. The highest percentage of unmarried women with births falls into 20 to 34 years age bracket with 33.3% of them unmarried at the time of birth, while the lowest percentage of unmarried women with births belong to 20 to 34 years age bracket with 33.3% of them unmarried.
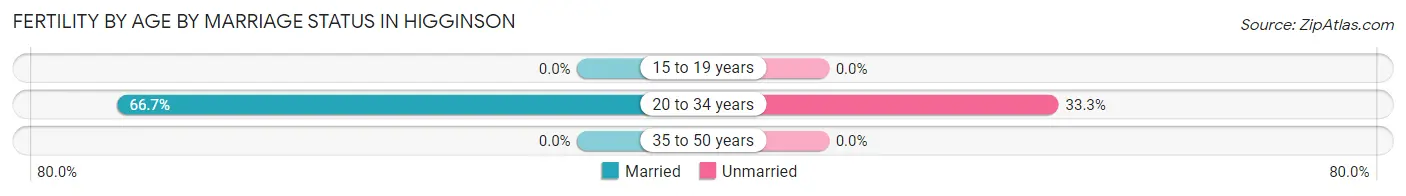
| Age Bracket | Married | Unmarried |
| 15 to 19 years | 0 (0.0%) | 0 (0.0%) |
| 20 to 34 years | 14 (66.7%) | 7 (33.3%) |
| 35 to 50 years | 0 (0.0%) | 0 (0.0%) |
| Total | 14 (66.7%) | 7 (33.3%) |
Fertility by Education in Higginson
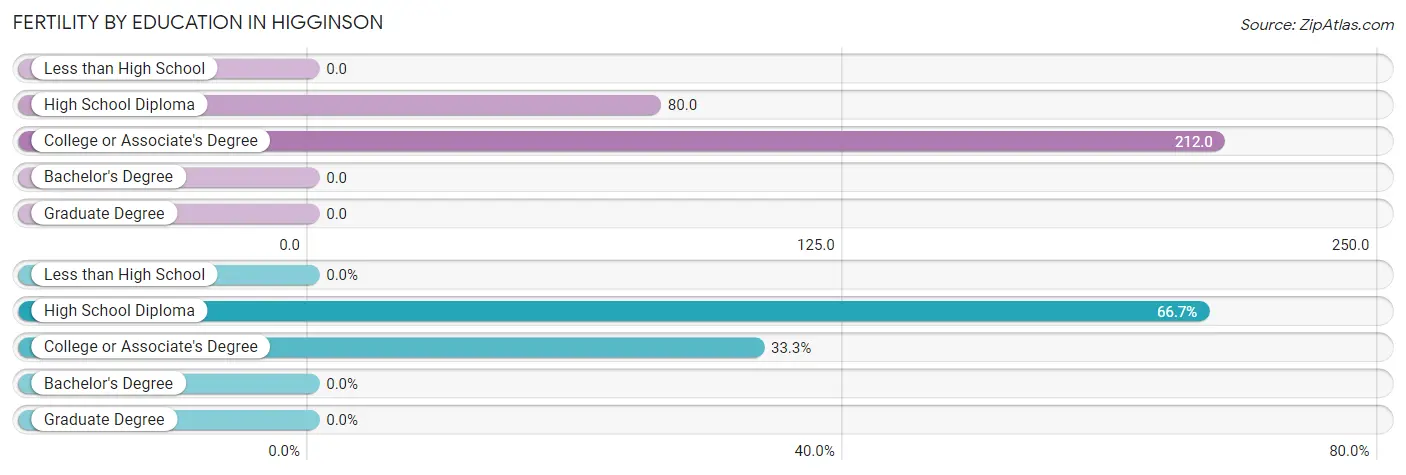
| Educational Attainment | Women with Births | Births / 1,000 Women |
| Less than High School | 0 (0.0%) | 0.0 |
| High School Diploma | 14 (66.7%) | 80.0 |
| College or Associate's Degree | 7 (33.3%) | 212.0 |
| Bachelor's Degree | 0 (0.0%) | 0.0 |
| Graduate Degree | 0 (0.0%) | 0.0 |
| Total | 21 (100.0%) | 63.0 |
Fertility by Education by Marriage Status in Higginson
33.3% of women with births in Higginson are unmarried. Women with the educational attainment of high school diploma are most likely to be married with 100.0% of them married at childbirth, while women with the educational attainment of college or associate's degree are least likely to be married with 100.0% of them unmarried at childbirth.
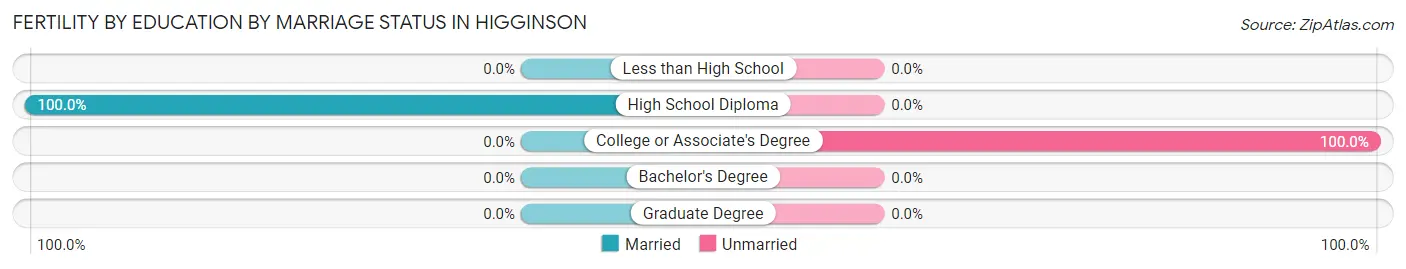
| Educational Attainment | Married | Unmarried |
| Less than High School | 0 (0.0%) | 0 (0.0%) |
| High School Diploma | 14 (100.0%) | 0 (0.0%) |
| College or Associate's Degree | 0 (0.0%) | 7 (100.0%) |
| Bachelor's Degree | 0 (0.0%) | 0 (0.0%) |
| Graduate Degree | 0 (0.0%) | 0 (0.0%) |
| Total | 14 (66.7%) | 7 (33.3%) |
Employment Characteristics in Higginson
Employment by Class of Employer in Higginson
Among the 536 employed individuals in Higginson, private company employees (400 | 74.6%), state government employees (34 | 6.3%), and self-employed (not incorporated) (29 | 5.4%) make up the most common classes of employment.
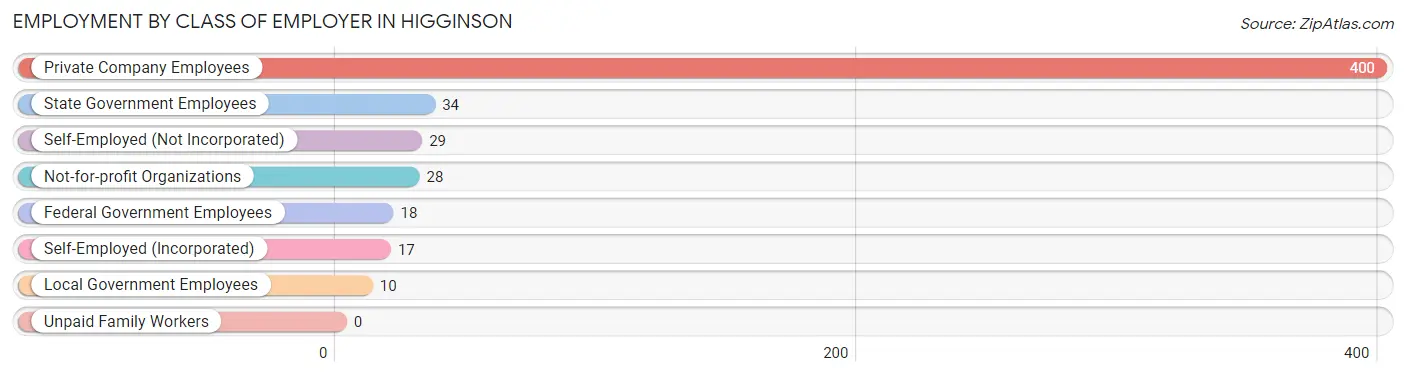
| Employer Class | # Employees | % Employees |
| Private Company Employees | 400 | 74.6% |
| Self-Employed (Incorporated) | 17 | 3.2% |
| Self-Employed (Not Incorporated) | 29 | 5.4% |
| Not-for-profit Organizations | 28 | 5.2% |
| Local Government Employees | 10 | 1.9% |
| State Government Employees | 34 | 6.3% |
| Federal Government Employees | 18 | 3.4% |
| Unpaid Family Workers | 0 | 0.0% |
| Total | 536 | 100.0% |
Employment Status by Age in Higginson
According to the labor force statistics for Higginson, out of the total population over 16 years of age (780), 72.1% or 562 individuals are in the labor force, with 3.9% or 22 of them unemployed. The age group with the highest labor force participation rate is 25 to 29 years, with 100.0% or 18 individuals in the labor force. Within the labor force, the 55 to 59 years age range has the highest percentage of unemployed individuals, with 40.0% or 2 of them being unemployed.
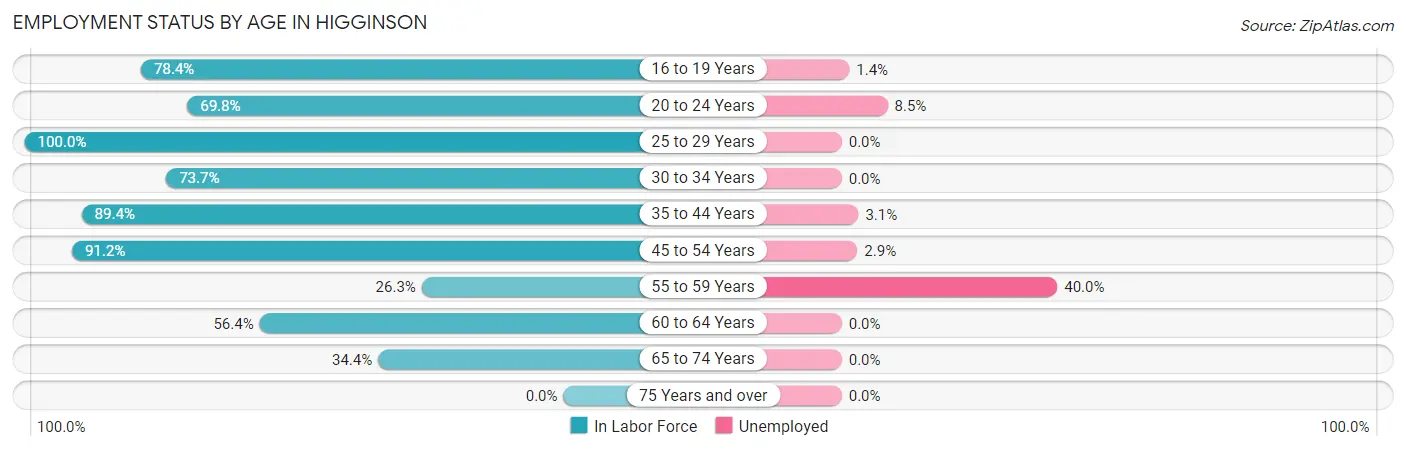
| Age Bracket | In Labor Force | Unemployed |
| 16 to 19 Years | 69 (78.4%) | 1 (1.4%) |
| 20 to 24 Years | 141 (69.8%) | 12 (8.5%) |
| 25 to 29 Years | 18 (100.0%) | 0 (0.0%) |
| 30 to 34 Years | 56 (73.7%) | 0 (0.0%) |
| 35 to 44 Years | 127 (89.4%) | 4 (3.1%) |
| 45 to 54 Years | 104 (91.2%) | 3 (2.9%) |
| 55 to 59 Years | 5 (26.3%) | 2 (40.0%) |
| 60 to 64 Years | 31 (56.4%) | 0 (0.0%) |
| 65 to 74 Years | 11 (34.4%) | 0 (0.0%) |
| 75 Years and over | 0 (0.0%) | 0 (0.0%) |
| Total | 562 (72.1%) | 22 (3.9%) |
Employment Status by Educational Attainment in Higginson
According to labor force statistics for Higginson, 80.4% of individuals (341) out of the total population between 25 and 64 years of age (424) are in the labor force, with 2.6% or 9 of them being unemployed. The group with the highest labor force participation rate are those with the educational attainment of less than high school, with 90.8% or 69 individuals in the labor force. Within the labor force, individuals with less than high school education have the highest percentage of unemployment, with 10.1% or 7 of them being unemployed.
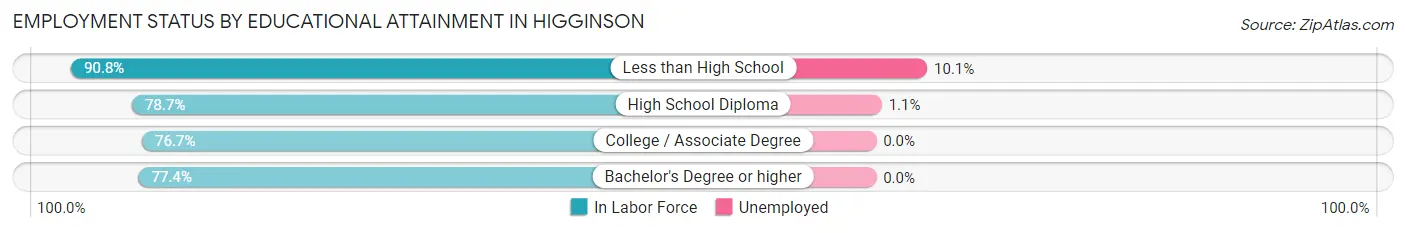
| Educational Attainment | In Labor Force | Unemployed |
| Less than High School | 69 (90.8%) | 8 (10.1%) |
| High School Diploma | 185 (78.7%) | 3 (1.1%) |
| College / Associate Degree | 46 (76.7%) | 0 (0.0%) |
| Bachelor's Degree or higher | 41 (77.4%) | 0 (0.0%) |
| Total | 341 (80.4%) | 11 (2.6%) |
Employment Occupations by Sex in Higginson
Management, Business, Science and Arts Occupations
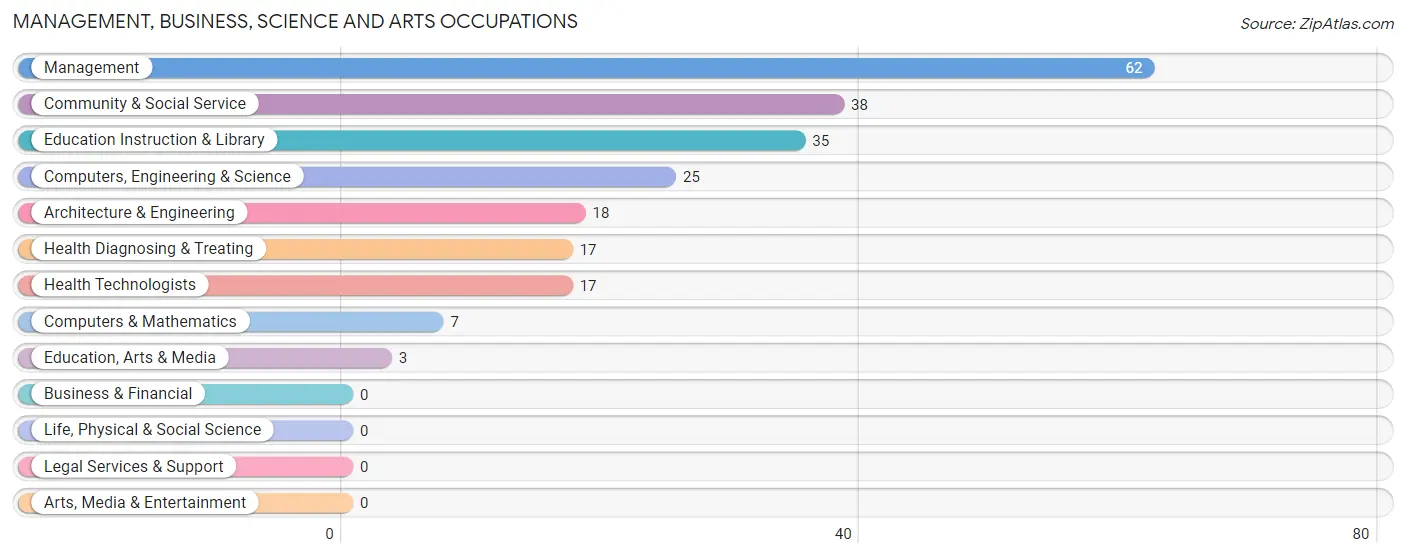
The most common Management, Business, Science and Arts occupations in Higginson are Management (62 | 11.5%), Community & Social Service (38 | 7.0%), Education Instruction & Library (35 | 6.5%), Computers, Engineering & Science (25 | 4.6%), and Architecture & Engineering (18 | 3.3%).
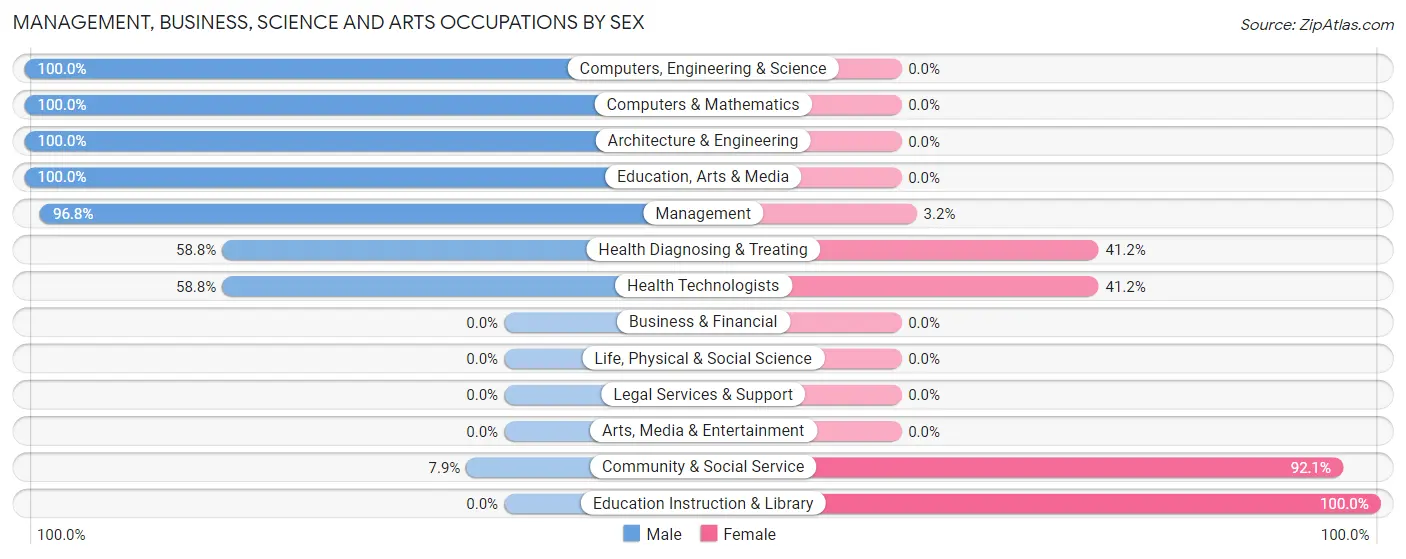
Management, Business, Science and Arts Occupations by Sex
Within the Management, Business, Science and Arts occupations in Higginson, the most male-oriented occupations are Computers, Engineering & Science (100.0%), Computers & Mathematics (100.0%), and Architecture & Engineering (100.0%), while the most female-oriented occupations are Education Instruction & Library (100.0%), Community & Social Service (92.1%), and Health Diagnosing & Treating (41.2%).
| Occupation | Male | Female |
| Management | 60 (96.8%) | 2 (3.2%) |
| Business & Financial | 0 (0.0%) | 0 (0.0%) |
| Computers, Engineering & Science | 25 (100.0%) | 0 (0.0%) |
| Computers & Mathematics | 7 (100.0%) | 0 (0.0%) |
| Architecture & Engineering | 18 (100.0%) | 0 (0.0%) |
| Life, Physical & Social Science | 0 (0.0%) | 0 (0.0%) |
| Community & Social Service | 3 (7.9%) | 35 (92.1%) |
| Education, Arts & Media | 3 (100.0%) | 0 (0.0%) |
| Legal Services & Support | 0 (0.0%) | 0 (0.0%) |
| Education Instruction & Library | 0 (0.0%) | 35 (100.0%) |
| Arts, Media & Entertainment | 0 (0.0%) | 0 (0.0%) |
| Health Diagnosing & Treating | 10 (58.8%) | 7 (41.2%) |
| Health Technologists | 10 (58.8%) | 7 (41.2%) |
| Total (Category) | 98 (69.0%) | 44 (31.0%) |
| Total (Overall) | 258 (47.8%) | 282 (52.2%) |
Services Occupations
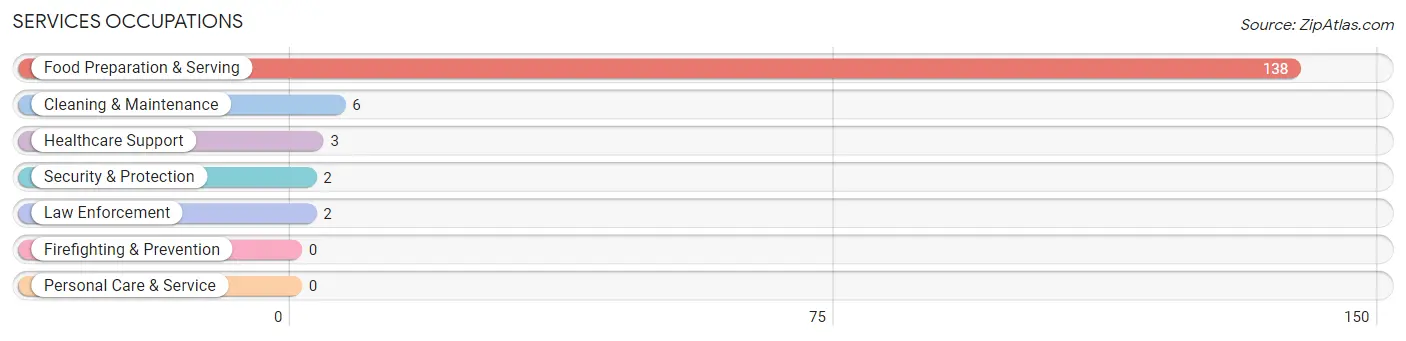
The most common Services occupations in Higginson are Food Preparation & Serving (138 | 25.6%), Cleaning & Maintenance (6 | 1.1%), Healthcare Support (3 | 0.6%), Security & Protection (2 | 0.4%), and Law Enforcement (2 | 0.4%).
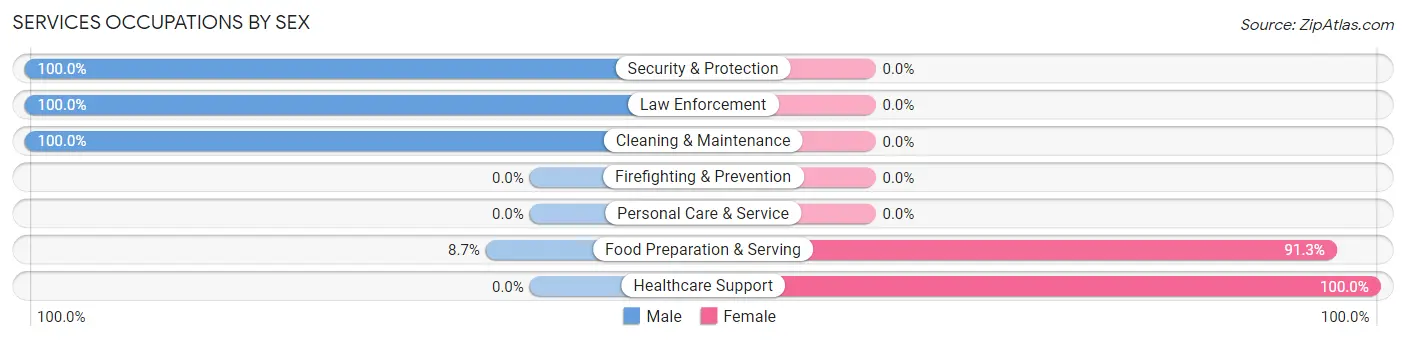
Services Occupations by Sex
Within the Services occupations in Higginson, the most male-oriented occupations are Security & Protection (100.0%), Law Enforcement (100.0%), and Cleaning & Maintenance (100.0%), while the most female-oriented occupations are Healthcare Support (100.0%), and Food Preparation & Serving (91.3%).
| Occupation | Male | Female |
| Healthcare Support | 0 (0.0%) | 3 (100.0%) |
| Security & Protection | 2 (100.0%) | 0 (0.0%) |
| Firefighting & Prevention | 0 (0.0%) | 0 (0.0%) |
| Law Enforcement | 2 (100.0%) | 0 (0.0%) |
| Food Preparation & Serving | 12 (8.7%) | 126 (91.3%) |
| Cleaning & Maintenance | 6 (100.0%) | 0 (0.0%) |
| Personal Care & Service | 0 (0.0%) | 0 (0.0%) |
| Total (Category) | 20 (13.4%) | 129 (86.6%) |
| Total (Overall) | 258 (47.8%) | 282 (52.2%) |
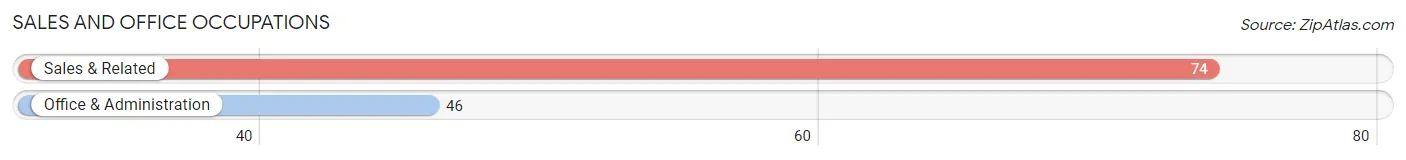
Sales and Office Occupations
The most common Sales and Office occupations in Higginson are Sales & Related (74 | 13.7%), and Office & Administration (46 | 8.5%).
Sales and Office Occupations by Sex
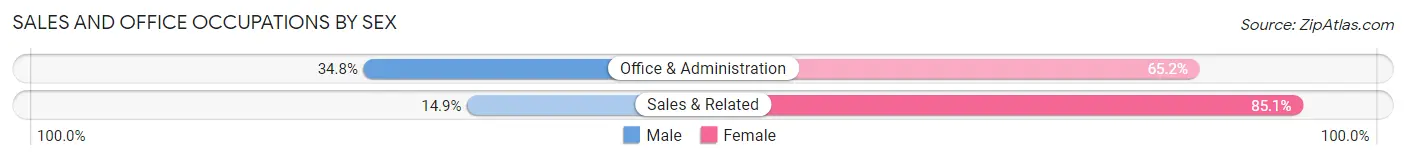
| Occupation | Male | Female |
| Sales & Related | 11 (14.9%) | 63 (85.1%) |
| Office & Administration | 16 (34.8%) | 30 (65.2%) |
| Total (Category) | 27 (22.5%) | 93 (77.5%) |
| Total (Overall) | 258 (47.8%) | 282 (52.2%) |
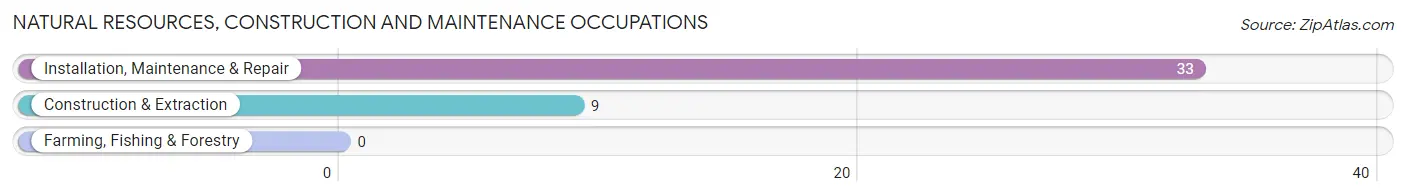
Natural Resources, Construction and Maintenance Occupations
The most common Natural Resources, Construction and Maintenance occupations in Higginson are Installation, Maintenance & Repair (33 | 6.1%), and Construction & Extraction (9 | 1.7%).
Natural Resources, Construction and Maintenance Occupations by Sex
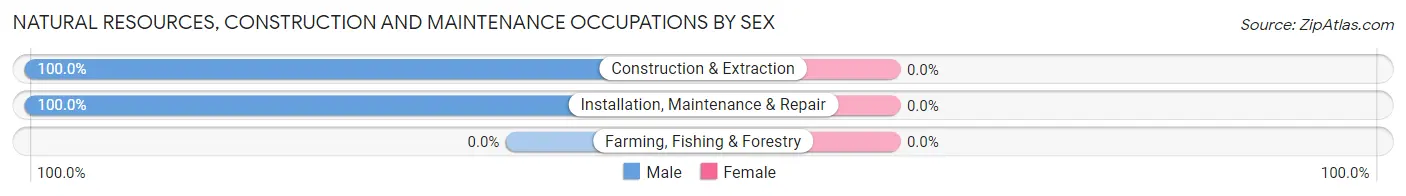
| Occupation | Male | Female |
| Farming, Fishing & Forestry | 0 (0.0%) | 0 (0.0%) |
| Construction & Extraction | 9 (100.0%) | 0 (0.0%) |
| Installation, Maintenance & Repair | 33 (100.0%) | 0 (0.0%) |
| Total (Category) | 42 (100.0%) | 0 (0.0%) |
| Total (Overall) | 258 (47.8%) | 282 (52.2%) |
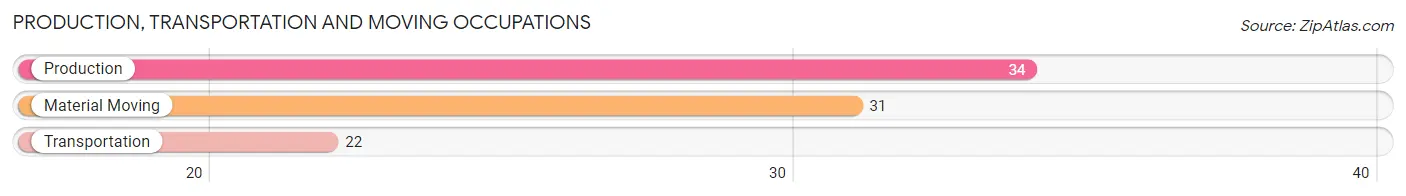
Production, Transportation and Moving Occupations
The most common Production, Transportation and Moving occupations in Higginson are Production (34 | 6.3%), Material Moving (31 | 5.7%), and Transportation (22 | 4.1%).
Production, Transportation and Moving Occupations by Sex
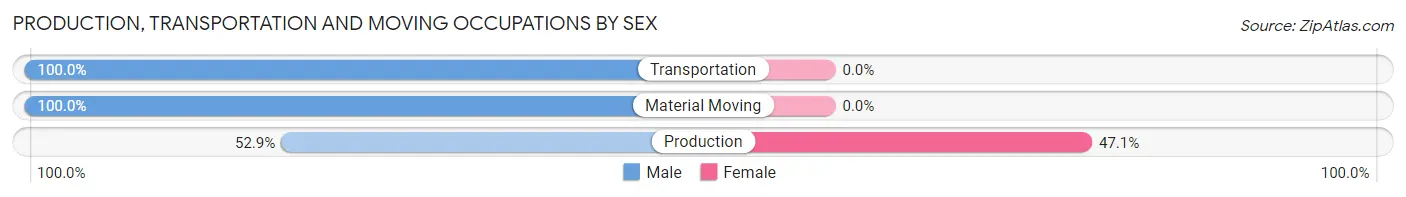
| Occupation | Male | Female |
| Production | 18 (52.9%) | 16 (47.1%) |
| Transportation | 22 (100.0%) | 0 (0.0%) |
| Material Moving | 31 (100.0%) | 0 (0.0%) |
| Total (Category) | 71 (81.6%) | 16 (18.4%) |
| Total (Overall) | 258 (47.8%) | 282 (52.2%) |
Employment Industries by Sex in Higginson
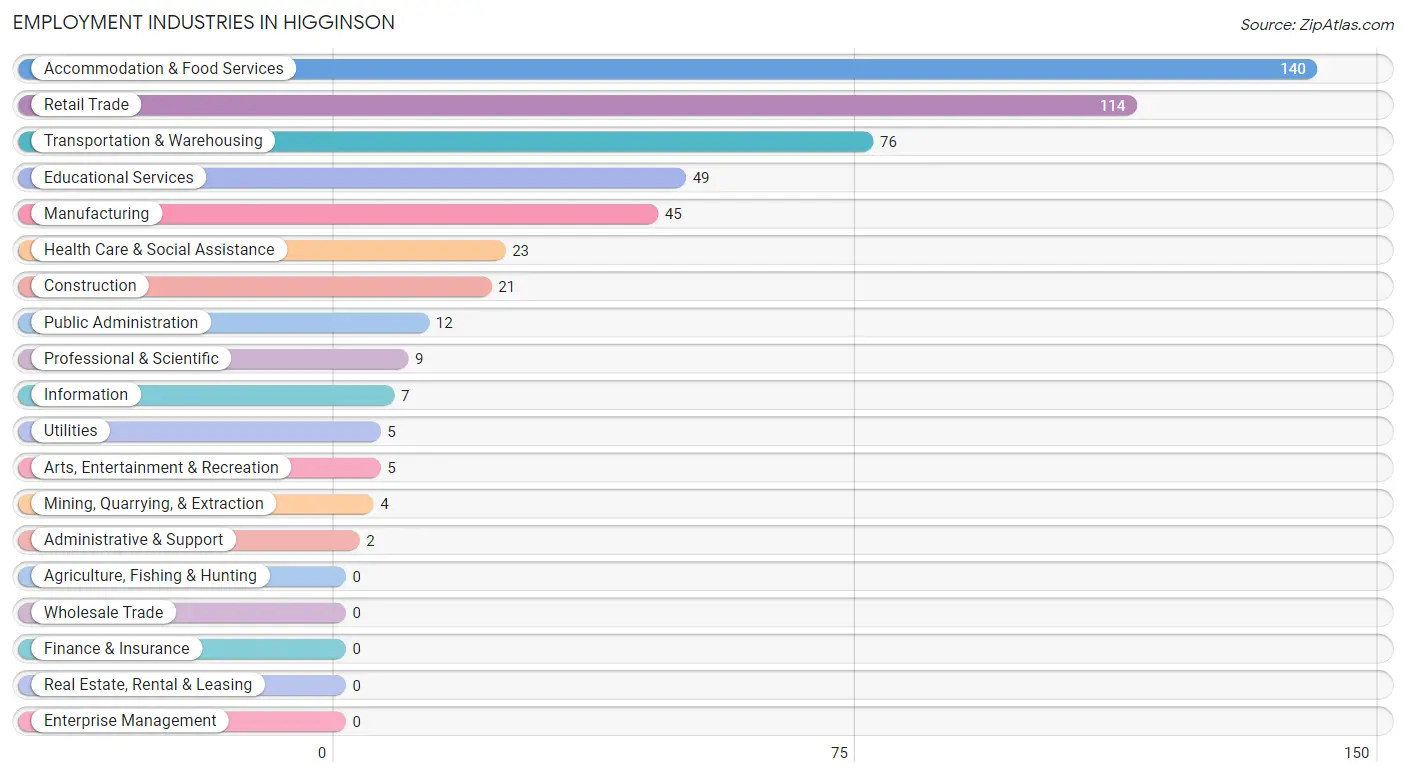
Employment Industries in Higginson
The major employment industries in Higginson include Accommodation & Food Services (140 | 25.9%), Retail Trade (114 | 21.1%), Transportation & Warehousing (76 | 14.1%), Educational Services (49 | 9.1%), and Manufacturing (45 | 8.3%).
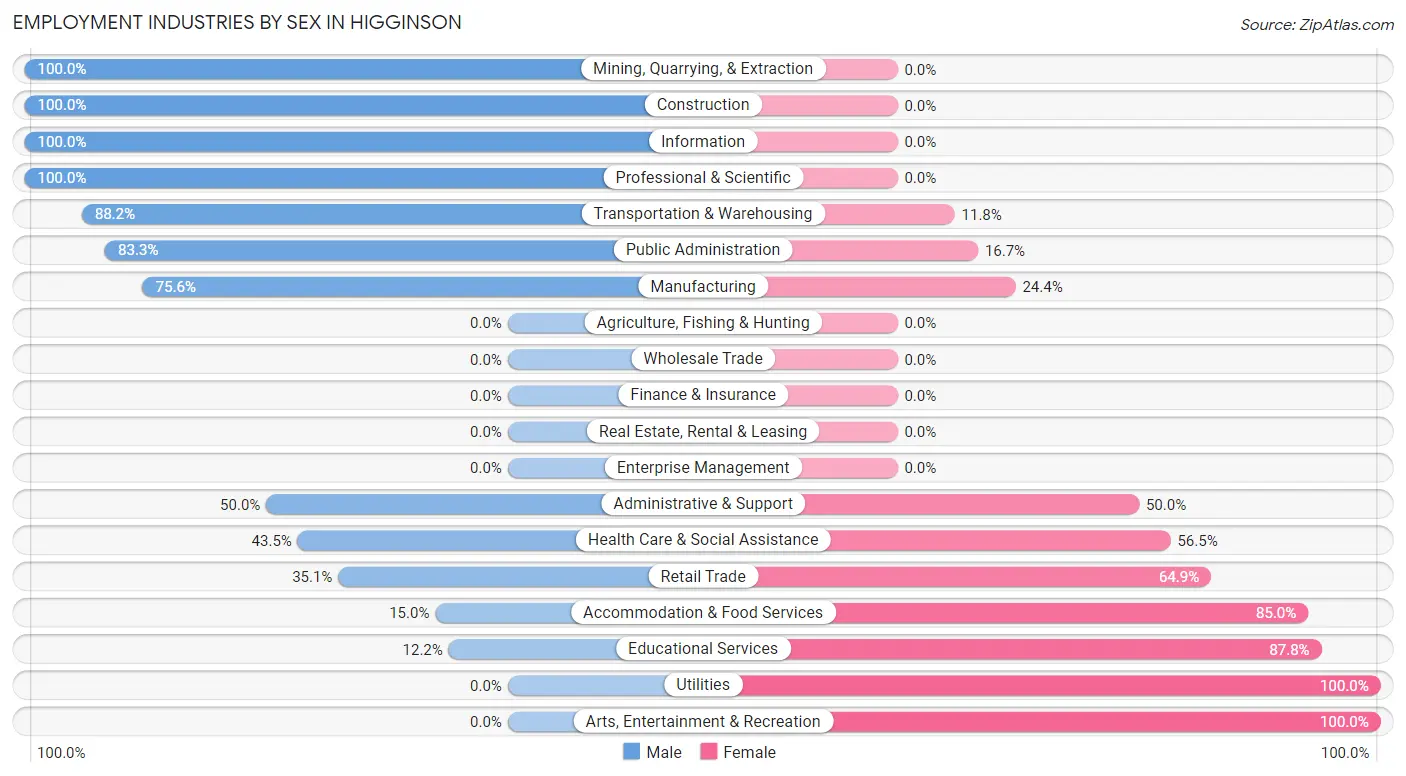
Employment Industries by Sex in Higginson
The Higginson industries that see more men than women are Mining, Quarrying, & Extraction (100.0%), Construction (100.0%), and Information (100.0%), whereas the industries that tend to have a higher number of women are Utilities (100.0%), Arts, Entertainment & Recreation (100.0%), and Educational Services (87.8%).
| Industry | Male | Female |
| Agriculture, Fishing & Hunting | 0 (0.0%) | 0 (0.0%) |
| Mining, Quarrying, & Extraction | 4 (100.0%) | 0 (0.0%) |
| Construction | 21 (100.0%) | 0 (0.0%) |
| Manufacturing | 34 (75.6%) | 11 (24.4%) |
| Wholesale Trade | 0 (0.0%) | 0 (0.0%) |
| Retail Trade | 40 (35.1%) | 74 (64.9%) |
| Transportation & Warehousing | 67 (88.2%) | 9 (11.8%) |
| Utilities | 0 (0.0%) | 5 (100.0%) |
| Information | 7 (100.0%) | 0 (0.0%) |
| Finance & Insurance | 0 (0.0%) | 0 (0.0%) |
| Real Estate, Rental & Leasing | 0 (0.0%) | 0 (0.0%) |
| Professional & Scientific | 9 (100.0%) | 0 (0.0%) |
| Enterprise Management | 0 (0.0%) | 0 (0.0%) |
| Administrative & Support | 1 (50.0%) | 1 (50.0%) |
| Educational Services | 6 (12.2%) | 43 (87.8%) |
| Health Care & Social Assistance | 10 (43.5%) | 13 (56.5%) |
| Arts, Entertainment & Recreation | 0 (0.0%) | 5 (100.0%) |
| Accommodation & Food Services | 21 (15.0%) | 119 (85.0%) |
| Public Administration | 10 (83.3%) | 2 (16.7%) |
| Total | 258 (47.8%) | 282 (52.2%) |
Education in Higginson
School Enrollment in Higginson
The most common levels of schooling among the 315 students in Higginson are high school (101 | 32.1%), college / undergraduate (92 | 29.2%), and elementary school (56 | 17.8%).
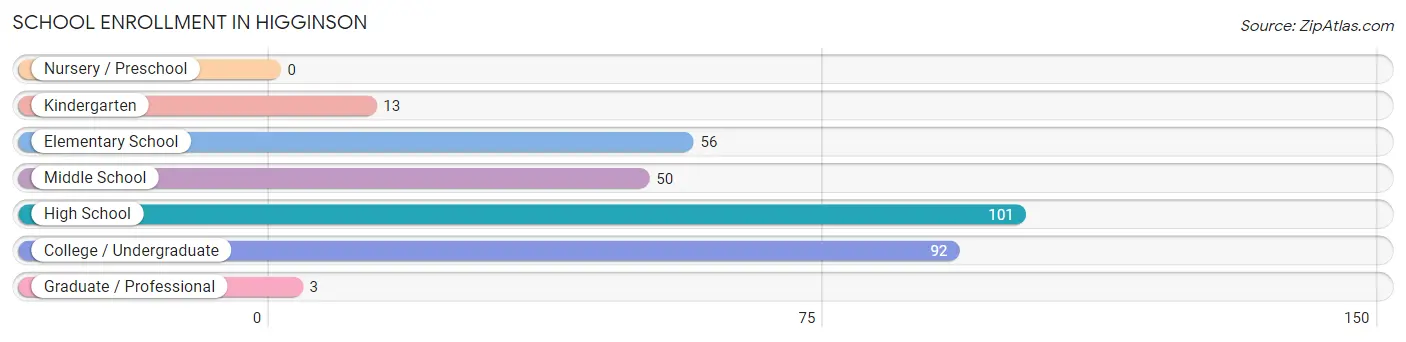
| School Level | # Students | % Students |
| Nursery / Preschool | 0 | 0.0% |
| Kindergarten | 13 | 4.1% |
| Elementary School | 56 | 17.8% |
| Middle School | 50 | 15.9% |
| High School | 101 | 32.1% |
| College / Undergraduate | 92 | 29.2% |
| Graduate / Professional | 3 | 0.9% |
| Total | 315 | 100.0% |
School Enrollment by Age by Funding Source in Higginson
Out of a total of 315 students who are enrolled in schools in Higginson, 89 (28.3%) attend a private institution, while the remaining 226 (71.7%) are enrolled in public schools. The age group of 20 to 24 year olds has the highest likelihood of being enrolled in private schools, with 68 (93.1% in the age bracket) enrolled. Conversely, the age group of 5 to 9 year old has the lowest likelihood of being enrolled in a private school, with 58 (100.0% in the age bracket) attending a public institution.
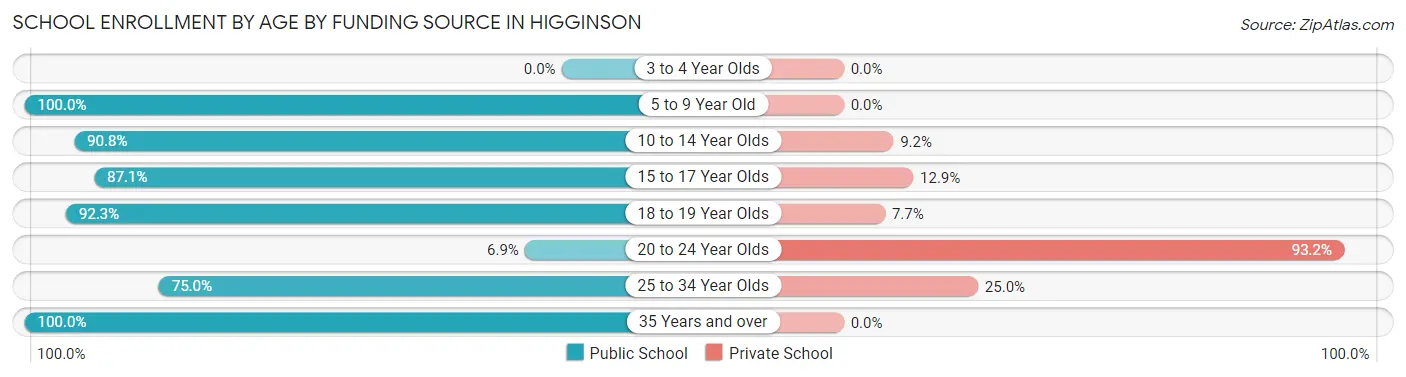
| Age Bracket | Public School | Private School |
| 3 to 4 Year Olds | 0 (0.0%) | 0 (0.0%) |
| 5 to 9 Year Old | 58 (100.0%) | 0 (0.0%) |
| 10 to 14 Year Olds | 59 (90.8%) | 6 (9.2%) |
| 15 to 17 Year Olds | 74 (87.1%) | 11 (12.9%) |
| 18 to 19 Year Olds | 12 (92.3%) | 1 (7.7%) |
| 20 to 24 Year Olds | 5 (6.9%) | 68 (93.1%) |
| 25 to 34 Year Olds | 9 (75.0%) | 3 (25.0%) |
| 35 Years and over | 9 (100.0%) | 0 (0.0%) |
| Total | 226 (71.7%) | 89 (28.3%) |
Educational Attainment by Field of Study in Higginson
Business (29 | 46.0%), education (11 | 17.5%), computers & mathematics (8 | 12.7%), bio, nature & agricultural (8 | 12.7%), and arts & humanities (5 | 7.9%) are the most common fields of study among 63 individuals in Higginson who have obtained a bachelor's degree or higher.
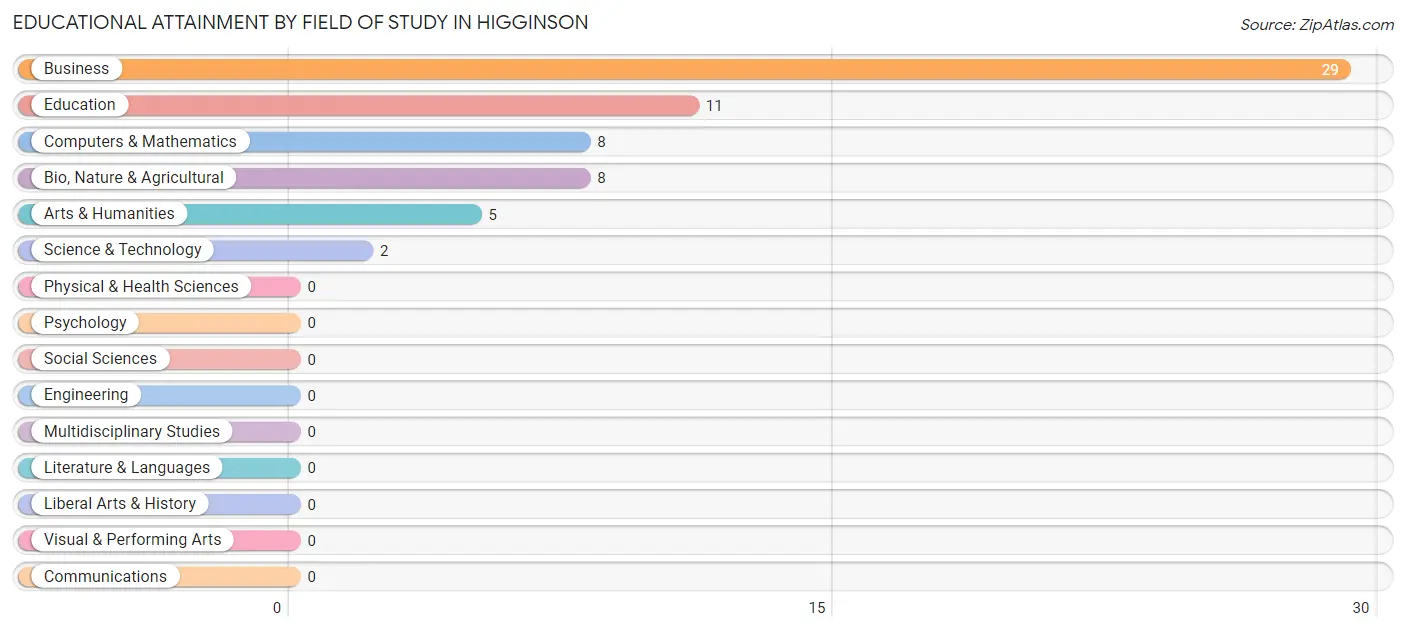
| Field of Study | # Graduates | % Graduates |
| Computers & Mathematics | 8 | 12.7% |
| Bio, Nature & Agricultural | 8 | 12.7% |
| Physical & Health Sciences | 0 | 0.0% |
| Psychology | 0 | 0.0% |
| Social Sciences | 0 | 0.0% |
| Engineering | 0 | 0.0% |
| Multidisciplinary Studies | 0 | 0.0% |
| Science & Technology | 2 | 3.2% |
| Business | 29 | 46.0% |
| Education | 11 | 17.5% |
| Literature & Languages | 0 | 0.0% |
| Liberal Arts & History | 0 | 0.0% |
| Visual & Performing Arts | 0 | 0.0% |
| Communications | 0 | 0.0% |
| Arts & Humanities | 5 | 7.9% |
| Total | 63 | 100.0% |
Transportation & Commute in Higginson
Vehicle Availability by Sex in Higginson
The most prevalent vehicle ownership categories in Higginson are males with 2 vehicles (115, accounting for 44.6%) and females with 2 vehicles (58, making up 41.4%).
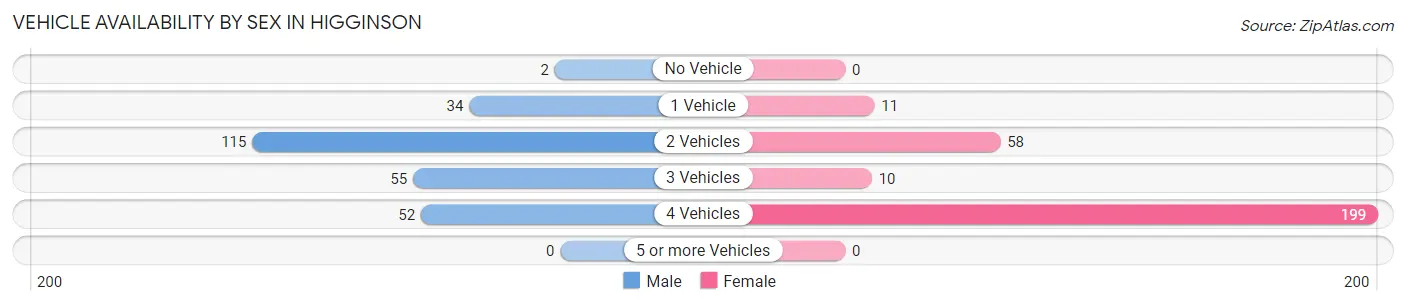
| Vehicles Available | Male | Female |
| No Vehicle | 2 (0.8%) | 0 (0.0%) |
| 1 Vehicle | 34 (13.2%) | 11 (4.0%) |
| 2 Vehicles | 115 (44.6%) | 58 (20.9%) |
| 3 Vehicles | 55 (21.3%) | 10 (3.6%) |
| 4 Vehicles | 52 (20.2%) | 199 (71.6%) |
| 5 or more Vehicles | 0 (0.0%) | 0 (0.0%) |
| Total | 258 (100.0%) | 278 (100.0%) |
Commute Time in Higginson
The most frequently occuring commute durations in Higginson are 10 to 14 minutes (216 commuters, 40.6%), 5 to 9 minutes (164 commuters, 30.8%), and 15 to 19 minutes (57 commuters, 10.7%).
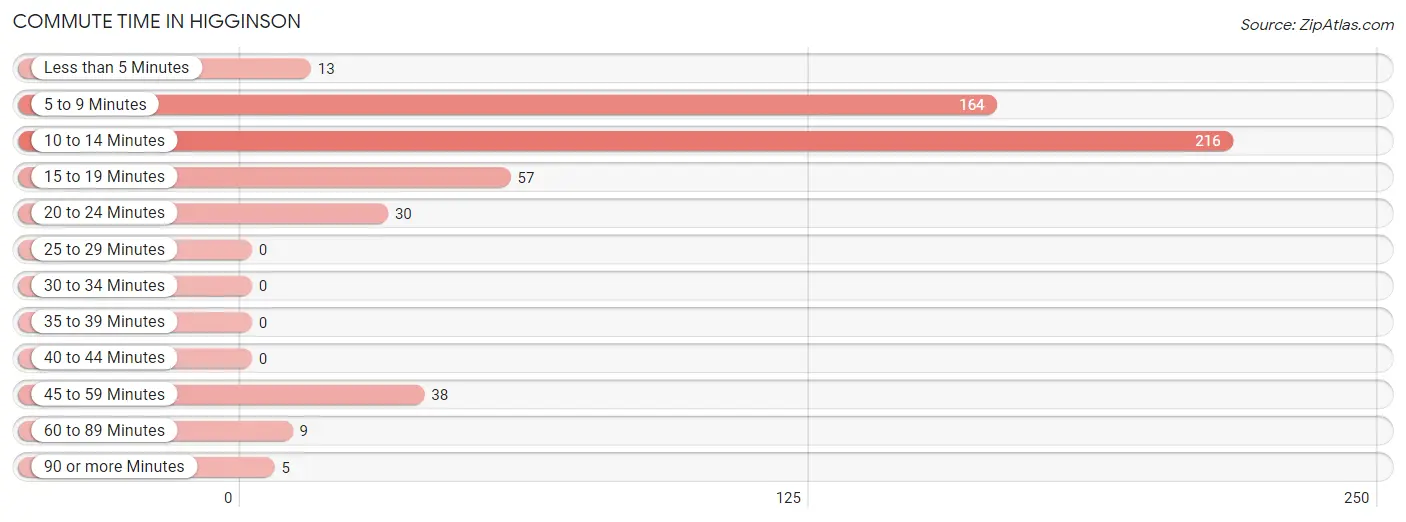
| Commute Time | # Commuters | % Commuters |
| Less than 5 Minutes | 13 | 2.4% |
| 5 to 9 Minutes | 164 | 30.8% |
| 10 to 14 Minutes | 216 | 40.6% |
| 15 to 19 Minutes | 57 | 10.7% |
| 20 to 24 Minutes | 30 | 5.6% |
| 25 to 29 Minutes | 0 | 0.0% |
| 30 to 34 Minutes | 0 | 0.0% |
| 35 to 39 Minutes | 0 | 0.0% |
| 40 to 44 Minutes | 0 | 0.0% |
| 45 to 59 Minutes | 38 | 7.1% |
| 60 to 89 Minutes | 9 | 1.7% |
| 90 or more Minutes | 5 | 0.9% |
Commute Time by Sex in Higginson
The most common commute times in Higginson are 10 to 14 minutes (85 commuters, 33.5%) for males and 10 to 14 minutes (131 commuters, 47.1%) for females.
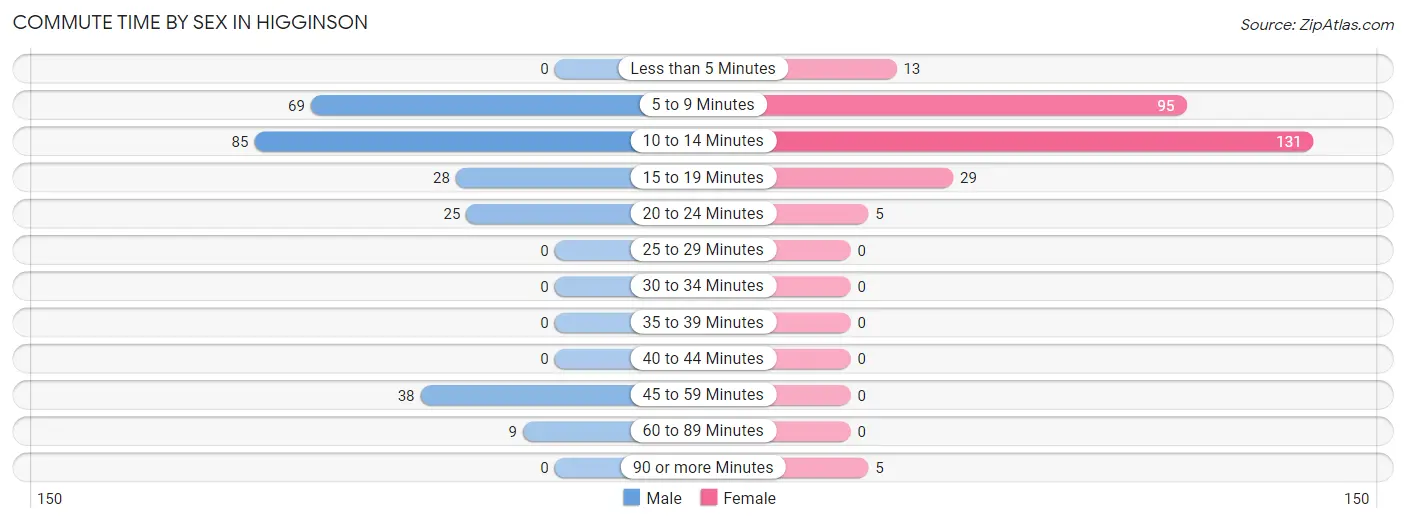
| Commute Time | Male | Female |
| Less than 5 Minutes | 0 (0.0%) | 13 (4.7%) |
| 5 to 9 Minutes | 69 (27.2%) | 95 (34.2%) |
| 10 to 14 Minutes | 85 (33.5%) | 131 (47.1%) |
| 15 to 19 Minutes | 28 (11.0%) | 29 (10.4%) |
| 20 to 24 Minutes | 25 (9.8%) | 5 (1.8%) |
| 25 to 29 Minutes | 0 (0.0%) | 0 (0.0%) |
| 30 to 34 Minutes | 0 (0.0%) | 0 (0.0%) |
| 35 to 39 Minutes | 0 (0.0%) | 0 (0.0%) |
| 40 to 44 Minutes | 0 (0.0%) | 0 (0.0%) |
| 45 to 59 Minutes | 38 (15.0%) | 0 (0.0%) |
| 60 to 89 Minutes | 9 (3.5%) | 0 (0.0%) |
| 90 or more Minutes | 0 (0.0%) | 5 (1.8%) |
Time of Departure to Work by Sex in Higginson
The most frequent times of departure to work in Higginson are 6:00 AM to 6:29 AM (41, 16.1%) for males and 12:00 PM to 3:59 PM (134, 48.2%) for females.
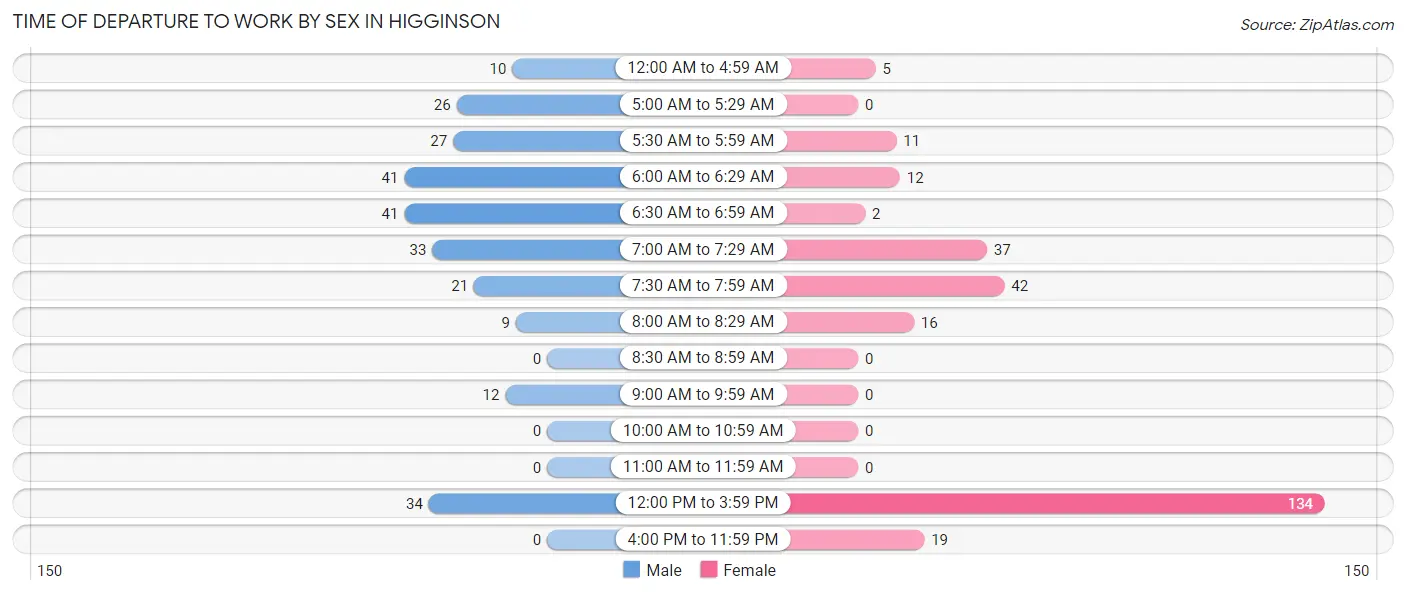
| Time of Departure | Male | Female |
| 12:00 AM to 4:59 AM | 10 (3.9%) | 5 (1.8%) |
| 5:00 AM to 5:29 AM | 26 (10.2%) | 0 (0.0%) |
| 5:30 AM to 5:59 AM | 27 (10.6%) | 11 (4.0%) |
| 6:00 AM to 6:29 AM | 41 (16.1%) | 12 (4.3%) |
| 6:30 AM to 6:59 AM | 41 (16.1%) | 2 (0.7%) |
| 7:00 AM to 7:29 AM | 33 (13.0%) | 37 (13.3%) |
| 7:30 AM to 7:59 AM | 21 (8.3%) | 42 (15.1%) |
| 8:00 AM to 8:29 AM | 9 (3.5%) | 16 (5.8%) |
| 8:30 AM to 8:59 AM | 0 (0.0%) | 0 (0.0%) |
| 9:00 AM to 9:59 AM | 12 (4.7%) | 0 (0.0%) |
| 10:00 AM to 10:59 AM | 0 (0.0%) | 0 (0.0%) |
| 11:00 AM to 11:59 AM | 0 (0.0%) | 0 (0.0%) |
| 12:00 PM to 3:59 PM | 34 (13.4%) | 134 (48.2%) |
| 4:00 PM to 11:59 PM | 0 (0.0%) | 19 (6.8%) |
| Total | 254 (100.0%) | 278 (100.0%) |
Housing Occupancy in Higginson
Occupancy by Ownership in Higginson
Of the total 298 dwellings in Higginson, owner-occupied units account for 192 (64.4%), while renter-occupied units make up 106 (35.6%).
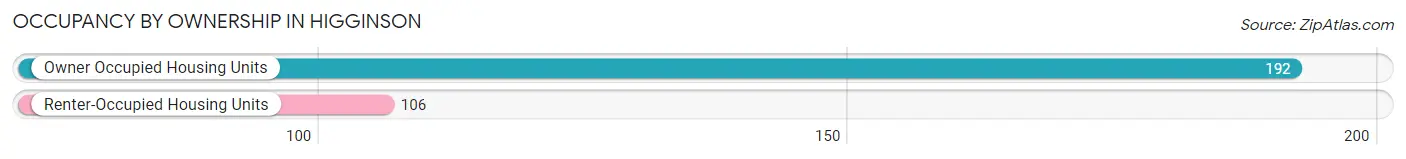
| Occupancy | # Housing Units | % Housing Units |
| Owner Occupied Housing Units | 192 | 64.4% |
| Renter-Occupied Housing Units | 106 | 35.6% |
| Total Occupied Housing Units | 298 | 100.0% |
Occupancy by Household Size in Higginson
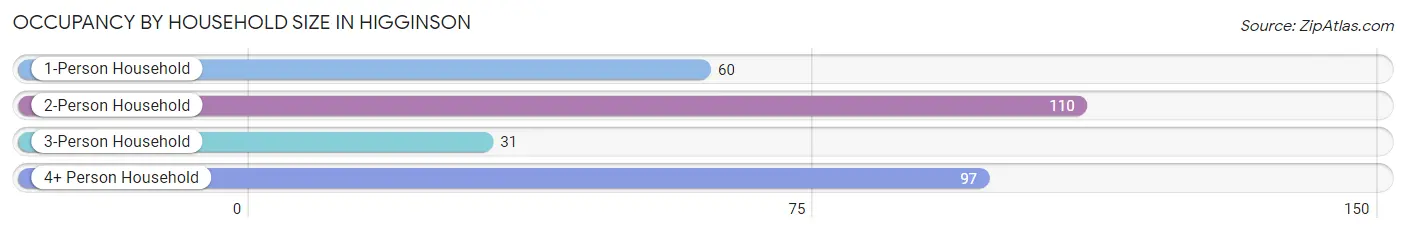
| Household Size | # Housing Units | % Housing Units |
| 1-Person Household | 60 | 20.1% |
| 2-Person Household | 110 | 36.9% |
| 3-Person Household | 31 | 10.4% |
| 4+ Person Household | 97 | 32.6% |
| Total Housing Units | 298 | 100.0% |
Occupancy by Ownership by Household Size in Higginson
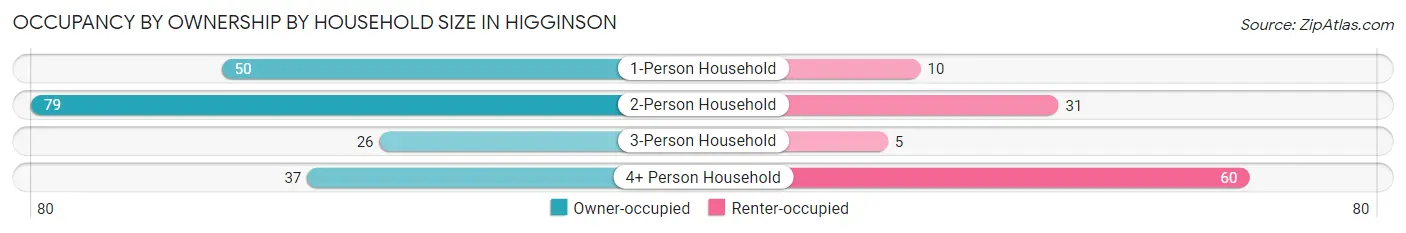
| Household Size | Owner-occupied | Renter-occupied |
| 1-Person Household | 50 (83.3%) | 10 (16.7%) |
| 2-Person Household | 79 (71.8%) | 31 (28.2%) |
| 3-Person Household | 26 (83.9%) | 5 (16.1%) |
| 4+ Person Household | 37 (38.1%) | 60 (61.9%) |
| Total Housing Units | 192 (64.4%) | 106 (35.6%) |
Occupancy by Educational Attainment in Higginson
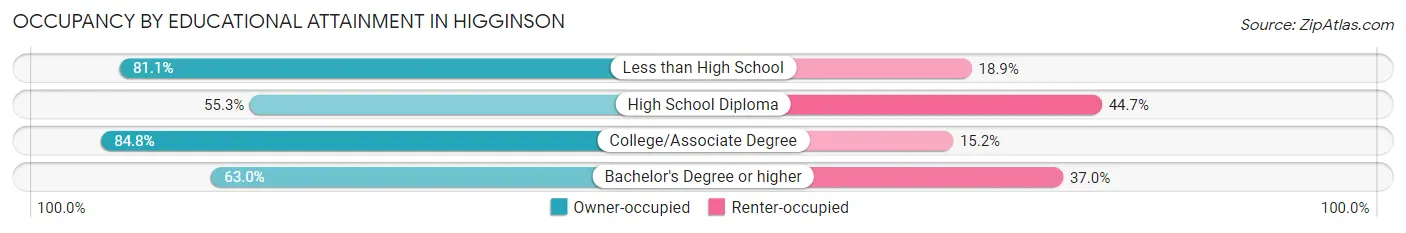
| Household Size | Owner-occupied | Renter-occupied |
| Less than High School | 30 (81.1%) | 7 (18.9%) |
| High School Diploma | 89 (55.3%) | 72 (44.7%) |
| College/Associate Degree | 39 (84.8%) | 7 (15.2%) |
| Bachelor's Degree or higher | 34 (63.0%) | 20 (37.0%) |
Occupancy by Age of Householder in Higginson
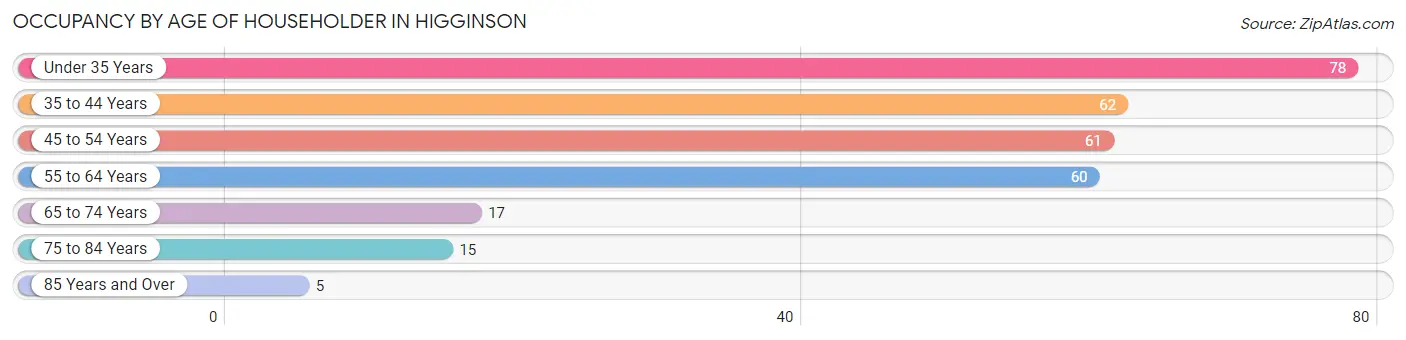
| Age Bracket | # Households | % Households |
| Under 35 Years | 78 | 26.2% |
| 35 to 44 Years | 62 | 20.8% |
| 45 to 54 Years | 61 | 20.5% |
| 55 to 64 Years | 60 | 20.1% |
| 65 to 74 Years | 17 | 5.7% |
| 75 to 84 Years | 15 | 5.0% |
| 85 Years and Over | 5 | 1.7% |
| Total | 298 | 100.0% |
Housing Finances in Higginson
Median Income by Occupancy in Higginson
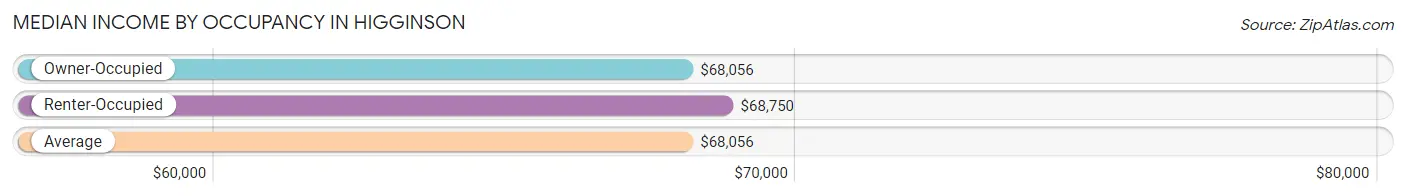
| Occupancy Type | # Households | Median Income |
| Owner-Occupied | 192 (64.4%) | $68,056 |
| Renter-Occupied | 106 (35.6%) | $68,750 |
| Average | 298 (100.0%) | $68,056 |
Occupancy by Householder Income Bracket in Higginson
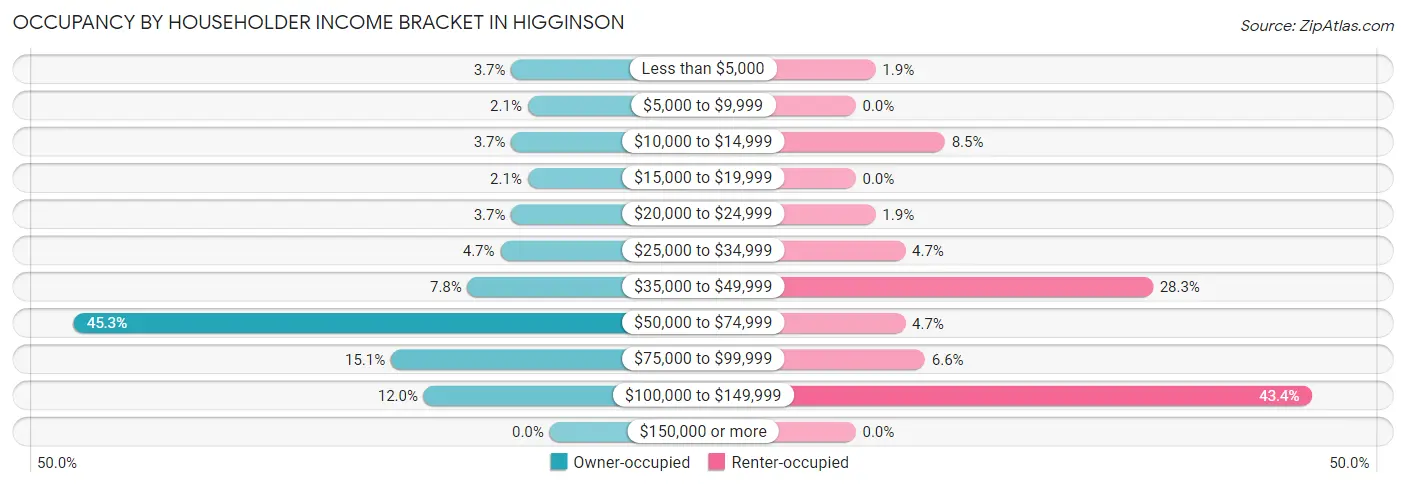
| Income Bracket | Owner-occupied | Renter-occupied |
| Less than $5,000 | 7 (3.6%) | 2 (1.9%) |
| $5,000 to $9,999 | 4 (2.1%) | 0 (0.0%) |
| $10,000 to $14,999 | 7 (3.6%) | 9 (8.5%) |
| $15,000 to $19,999 | 4 (2.1%) | 0 (0.0%) |
| $20,000 to $24,999 | 7 (3.6%) | 2 (1.9%) |
| $25,000 to $34,999 | 9 (4.7%) | 5 (4.7%) |
| $35,000 to $49,999 | 15 (7.8%) | 30 (28.3%) |
| $50,000 to $74,999 | 87 (45.3%) | 5 (4.7%) |
| $75,000 to $99,999 | 29 (15.1%) | 7 (6.6%) |
| $100,000 to $149,999 | 23 (12.0%) | 46 (43.4%) |
| $150,000 or more | 0 (0.0%) | 0 (0.0%) |
| Total | 192 (100.0%) | 106 (100.0%) |
Monthly Housing Cost Tiers in Higginson
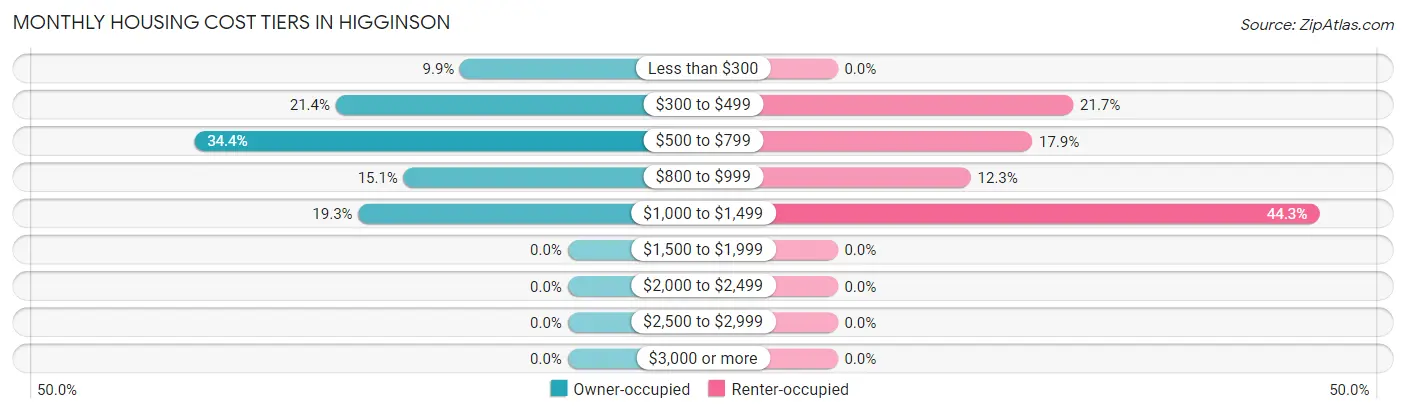
| Monthly Cost | Owner-occupied | Renter-occupied |
| Less than $300 | 19 (9.9%) | 0 (0.0%) |
| $300 to $499 | 41 (21.3%) | 23 (21.7%) |
| $500 to $799 | 66 (34.4%) | 19 (17.9%) |
| $800 to $999 | 29 (15.1%) | 13 (12.3%) |
| $1,000 to $1,499 | 37 (19.3%) | 47 (44.3%) |
| $1,500 to $1,999 | 0 (0.0%) | 0 (0.0%) |
| $2,000 to $2,499 | 0 (0.0%) | 0 (0.0%) |
| $2,500 to $2,999 | 0 (0.0%) | 0 (0.0%) |
| $3,000 or more | 0 (0.0%) | 0 (0.0%) |
| Total | 192 (100.0%) | 106 (100.0%) |
Physical Housing Characteristics in Higginson
Housing Structures in Higginson
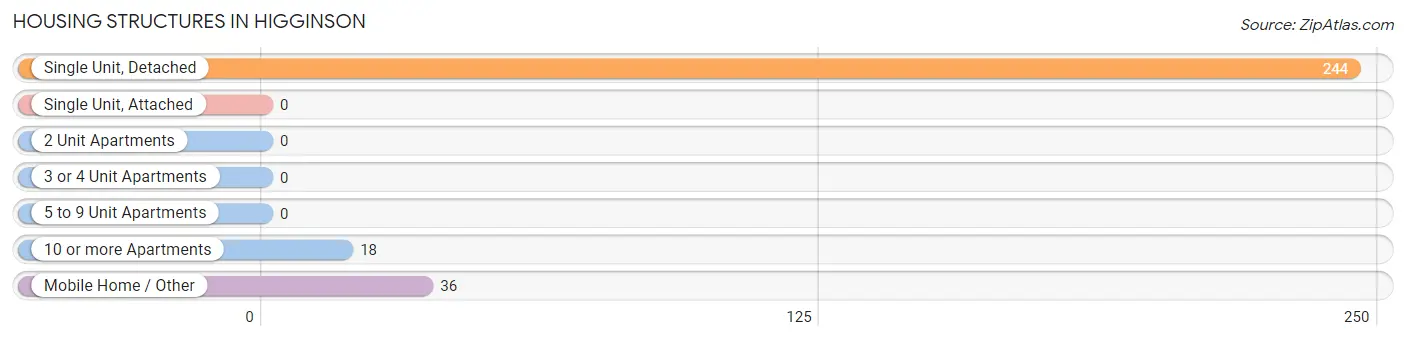
| Structure Type | # Housing Units | % Housing Units |
| Single Unit, Detached | 244 | 81.9% |
| Single Unit, Attached | 0 | 0.0% |
| 2 Unit Apartments | 0 | 0.0% |
| 3 or 4 Unit Apartments | 0 | 0.0% |
| 5 to 9 Unit Apartments | 0 | 0.0% |
| 10 or more Apartments | 18 | 6.0% |
| Mobile Home / Other | 36 | 12.1% |
| Total | 298 | 100.0% |
Housing Structures by Occupancy in Higginson
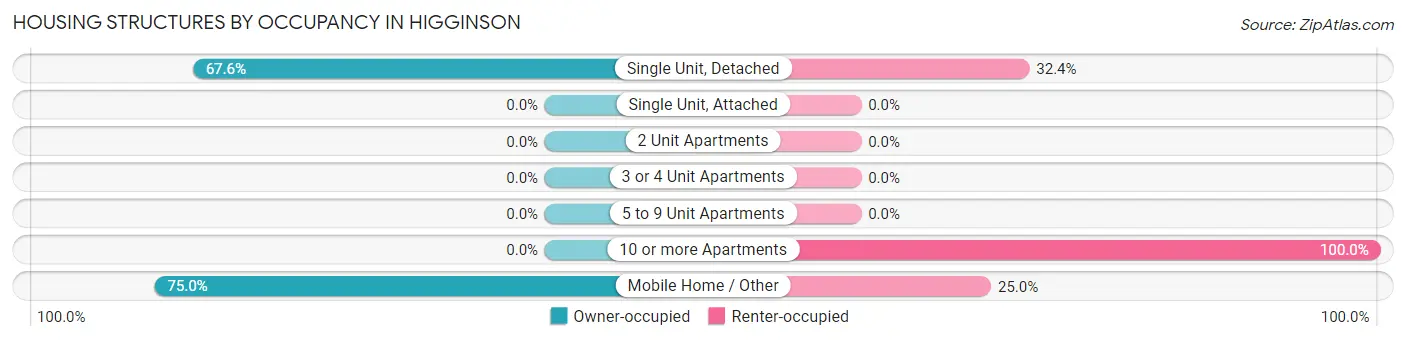
| Structure Type | Owner-occupied | Renter-occupied |
| Single Unit, Detached | 165 (67.6%) | 79 (32.4%) |
| Single Unit, Attached | 0 (0.0%) | 0 (0.0%) |
| 2 Unit Apartments | 0 (0.0%) | 0 (0.0%) |
| 3 or 4 Unit Apartments | 0 (0.0%) | 0 (0.0%) |
| 5 to 9 Unit Apartments | 0 (0.0%) | 0 (0.0%) |
| 10 or more Apartments | 0 (0.0%) | 18 (100.0%) |
| Mobile Home / Other | 27 (75.0%) | 9 (25.0%) |
| Total | 192 (64.4%) | 106 (35.6%) |
Housing Structures by Number of Rooms in Higginson
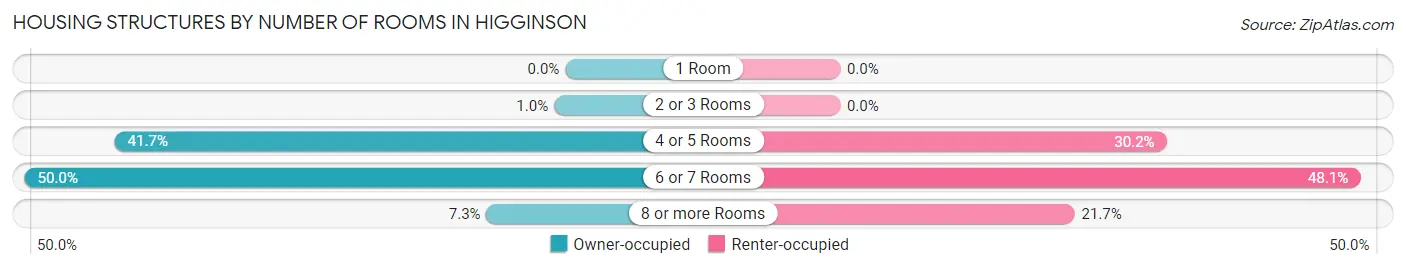
| Number of Rooms | Owner-occupied | Renter-occupied |
| 1 Room | 0 (0.0%) | 0 (0.0%) |
| 2 or 3 Rooms | 2 (1.0%) | 0 (0.0%) |
| 4 or 5 Rooms | 80 (41.7%) | 32 (30.2%) |
| 6 or 7 Rooms | 96 (50.0%) | 51 (48.1%) |
| 8 or more Rooms | 14 (7.3%) | 23 (21.7%) |
| Total | 192 (100.0%) | 106 (100.0%) |
Housing Structure by Heating Type in Higginson
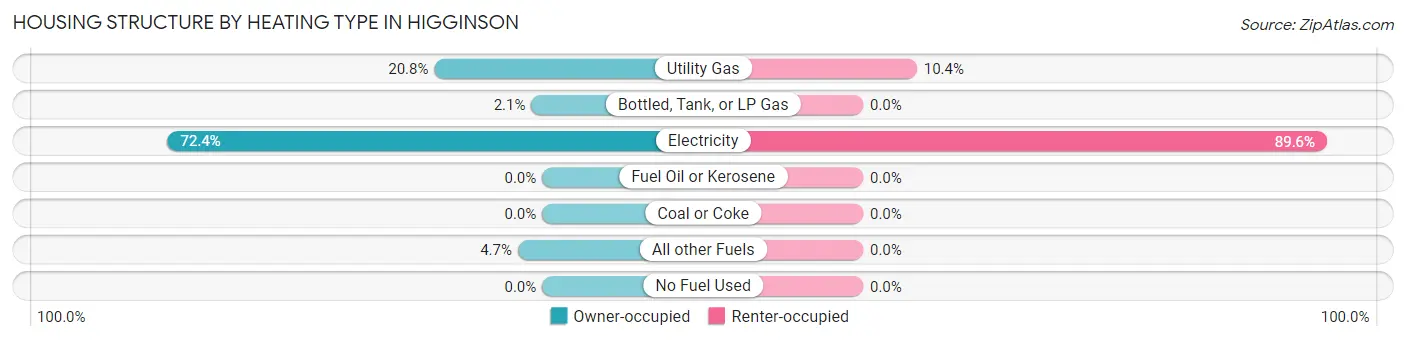
| Heating Type | Owner-occupied | Renter-occupied |
| Utility Gas | 40 (20.8%) | 11 (10.4%) |
| Bottled, Tank, or LP Gas | 4 (2.1%) | 0 (0.0%) |
| Electricity | 139 (72.4%) | 95 (89.6%) |
| Fuel Oil or Kerosene | 0 (0.0%) | 0 (0.0%) |
| Coal or Coke | 0 (0.0%) | 0 (0.0%) |
| All other Fuels | 9 (4.7%) | 0 (0.0%) |
| No Fuel Used | 0 (0.0%) | 0 (0.0%) |
| Total | 192 (100.0%) | 106 (100.0%) |
Household Vehicle Usage in Higginson
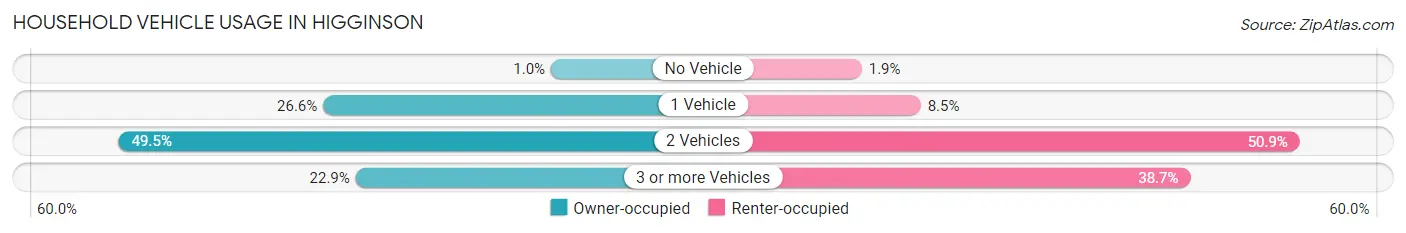
| Vehicles per Household | Owner-occupied | Renter-occupied |
| No Vehicle | 2 (1.0%) | 2 (1.9%) |
| 1 Vehicle | 51 (26.6%) | 9 (8.5%) |
| 2 Vehicles | 95 (49.5%) | 54 (50.9%) |
| 3 or more Vehicles | 44 (22.9%) | 41 (38.7%) |
| Total | 192 (100.0%) | 106 (100.0%) |
Real Estate & Mortgages in Higginson
Real Estate and Mortgage Overview in Higginson
| Characteristic | Without Mortgage | With Mortgage |
| Housing Units | 71 | 121 |
| Median Property Value | $89,100 | $88,400 |
| Median Household Income | $39,688 | $0 |
| Monthly Housing Costs | $329 | $0 |
| Real Estate Taxes | $470 | $2 |
Property Value by Mortgage Status in Higginson
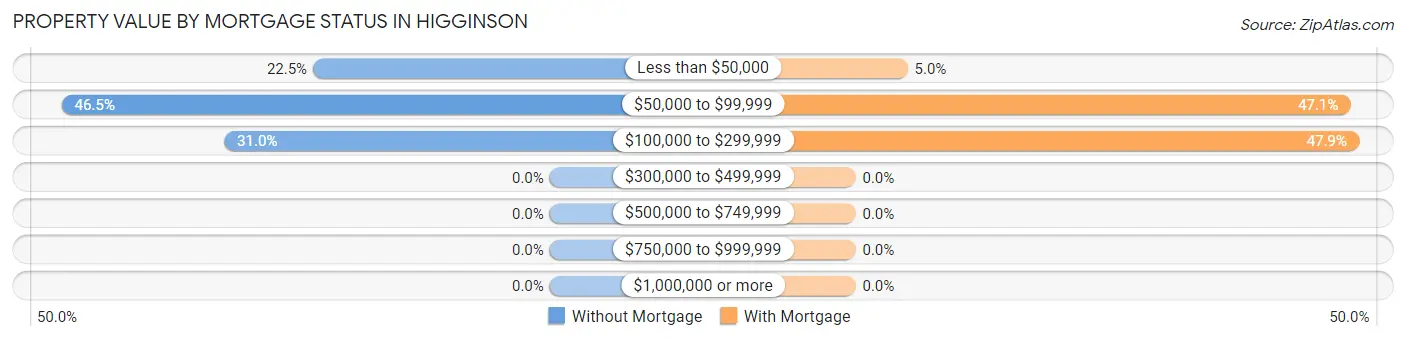
| Property Value | Without Mortgage | With Mortgage |
| Less than $50,000 | 16 (22.5%) | 6 (5.0%) |
| $50,000 to $99,999 | 33 (46.5%) | 57 (47.1%) |
| $100,000 to $299,999 | 22 (31.0%) | 58 (47.9%) |
| $300,000 to $499,999 | 0 (0.0%) | 0 (0.0%) |
| $500,000 to $749,999 | 0 (0.0%) | 0 (0.0%) |
| $750,000 to $999,999 | 0 (0.0%) | 0 (0.0%) |
| $1,000,000 or more | 0 (0.0%) | 0 (0.0%) |
| Total | 71 (100.0%) | 121 (100.0%) |
Household Income by Mortgage Status in Higginson
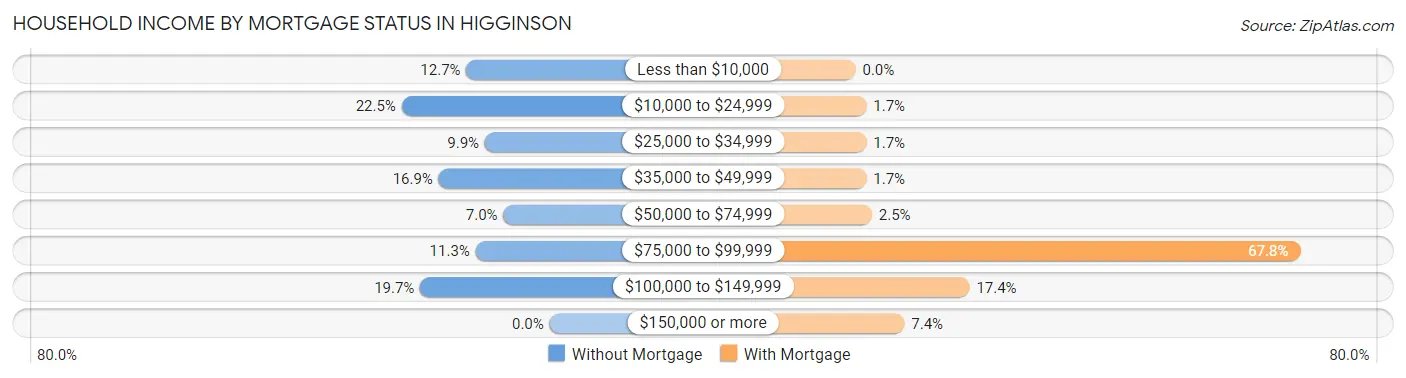
| Household Income | Without Mortgage | With Mortgage |
| Less than $10,000 | 9 (12.7%) | 0 (0.0%) |
| $10,000 to $24,999 | 16 (22.5%) | 2 (1.7%) |
| $25,000 to $34,999 | 7 (9.9%) | 2 (1.7%) |
| $35,000 to $49,999 | 12 (16.9%) | 2 (1.7%) |
| $50,000 to $74,999 | 5 (7.0%) | 3 (2.5%) |
| $75,000 to $99,999 | 8 (11.3%) | 82 (67.8%) |
| $100,000 to $149,999 | 14 (19.7%) | 21 (17.4%) |
| $150,000 or more | 0 (0.0%) | 9 (7.4%) |
| Total | 71 (100.0%) | 121 (100.0%) |
Property Value to Household Income Ratio in Higginson
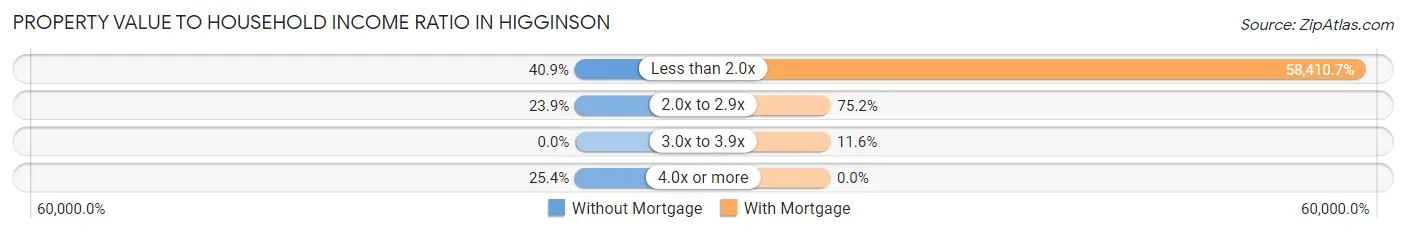
| Value-to-Income Ratio | Without Mortgage | With Mortgage |
| Less than 2.0x | 29 (40.8%) | 70,677 (58,410.7%) |
| 2.0x to 2.9x | 17 (23.9%) | 91 (75.2%) |
| 3.0x to 3.9x | 0 (0.0%) | 14 (11.6%) |
| 4.0x or more | 18 (25.4%) | 0 (0.0%) |
| Total | 71 (100.0%) | 121 (100.0%) |
Real Estate Taxes by Mortgage Status in Higginson
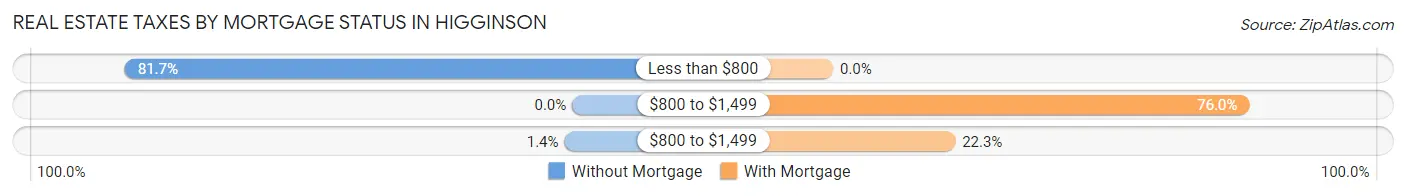
| Property Taxes | Without Mortgage | With Mortgage |
| Less than $800 | 58 (81.7%) | 0 (0.0%) |
| $800 to $1,499 | 0 (0.0%) | 92 (76.0%) |
| $800 to $1,499 | 1 (1.4%) | 27 (22.3%) |
| Total | 71 (100.0%) | 121 (100.0%) |
Health & Disability in Higginson
Health Insurance Coverage by Age in Higginson
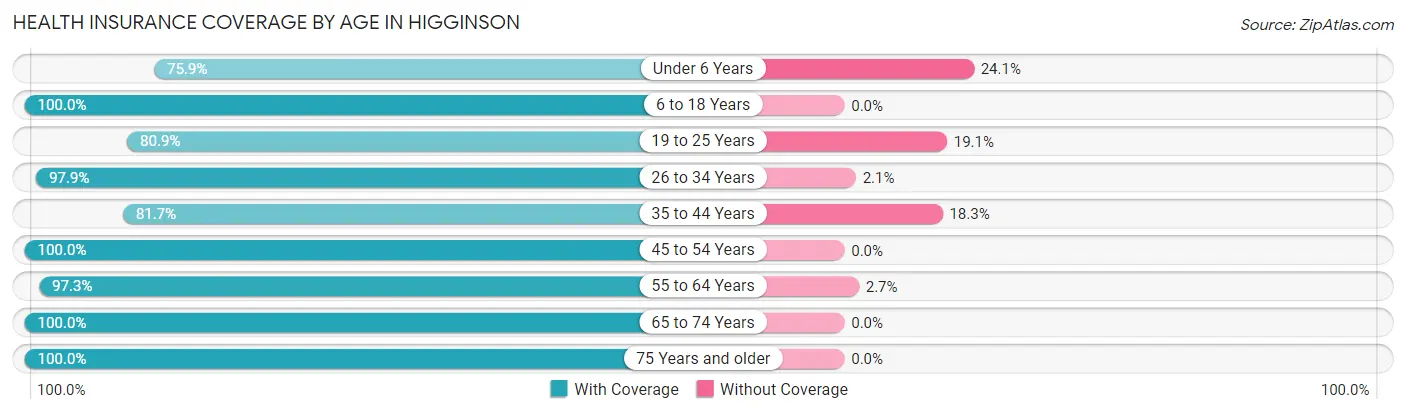
| Age Bracket | With Coverage | Without Coverage |
| Under 6 Years | 44 (75.9%) | 14 (24.1%) |
| 6 to 18 Years | 229 (100.0%) | 0 (0.0%) |
| 19 to 25 Years | 165 (80.9%) | 39 (19.1%) |
| 26 to 34 Years | 92 (97.9%) | 2 (2.1%) |
| 35 to 44 Years | 116 (81.7%) | 26 (18.3%) |
| 45 to 54 Years | 114 (100.0%) | 0 (0.0%) |
| 55 to 64 Years | 72 (97.3%) | 2 (2.7%) |
| 65 to 74 Years | 32 (100.0%) | 0 (0.0%) |
| 75 Years and older | 34 (100.0%) | 0 (0.0%) |
| Total | 898 (91.5%) | 83 (8.5%) |
Health Insurance Coverage by Citizenship Status in Higginson
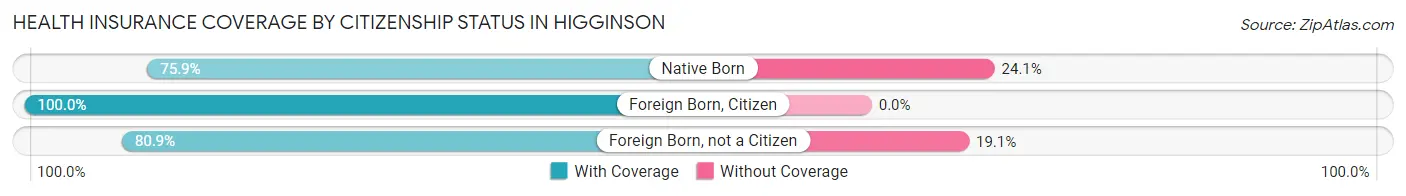
| Citizenship Status | With Coverage | Without Coverage |
| Native Born | 44 (75.9%) | 14 (24.1%) |
| Foreign Born, Citizen | 229 (100.0%) | 0 (0.0%) |
| Foreign Born, not a Citizen | 165 (80.9%) | 39 (19.1%) |
Health Insurance Coverage by Household Income in Higginson
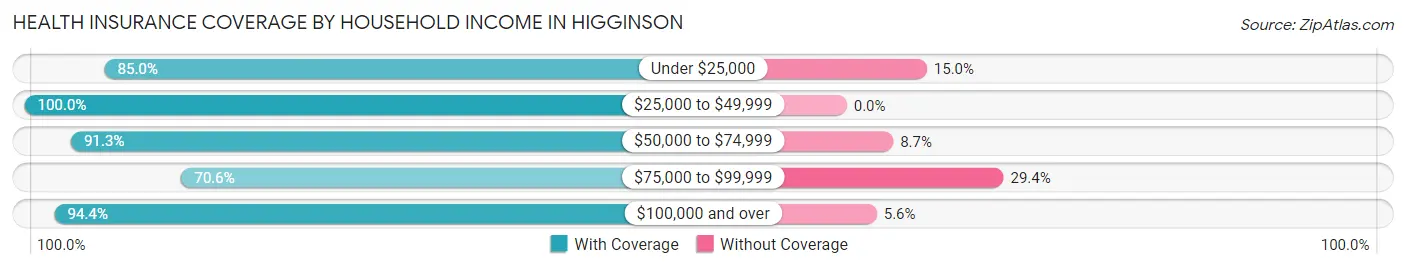
| Household Income | With Coverage | Without Coverage |
| Under $25,000 | 51 (85.0%) | 9 (15.0%) |
| $25,000 to $49,999 | 275 (100.0%) | 0 (0.0%) |
| $50,000 to $74,999 | 231 (91.3%) | 22 (8.7%) |
| $75,000 to $99,999 | 89 (70.6%) | 37 (29.4%) |
| $100,000 and over | 252 (94.4%) | 15 (5.6%) |
Public vs Private Health Insurance Coverage by Age in Higginson
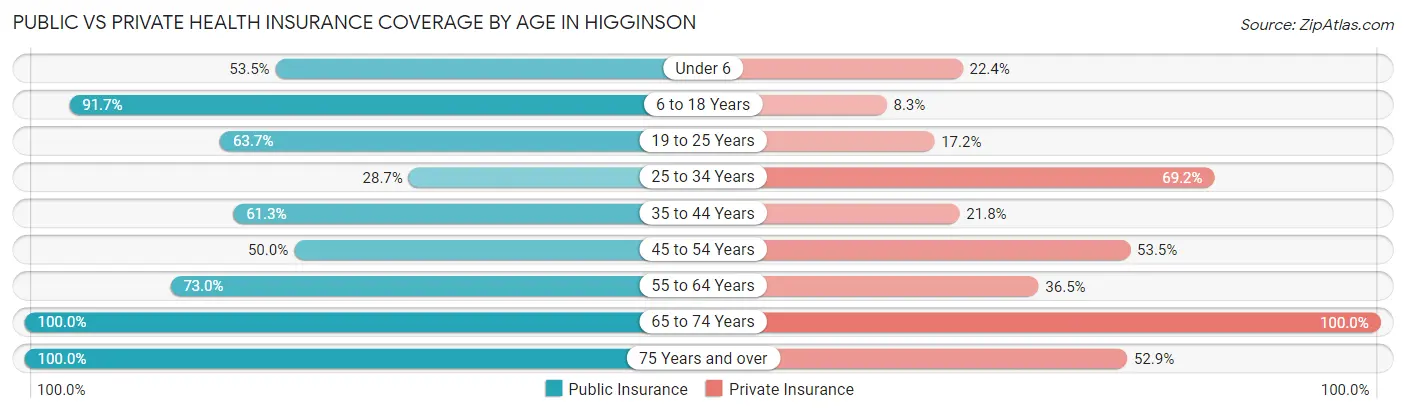
| Age Bracket | Public Insurance | Private Insurance |
| Under 6 | 31 (53.4%) | 13 (22.4%) |
| 6 to 18 Years | 210 (91.7%) | 19 (8.3%) |
| 19 to 25 Years | 130 (63.7%) | 35 (17.2%) |
| 25 to 34 Years | 27 (28.7%) | 65 (69.2%) |
| 35 to 44 Years | 87 (61.3%) | 31 (21.8%) |
| 45 to 54 Years | 57 (50.0%) | 61 (53.5%) |
| 55 to 64 Years | 54 (73.0%) | 27 (36.5%) |
| 65 to 74 Years | 32 (100.0%) | 32 (100.0%) |
| 75 Years and over | 34 (100.0%) | 18 (52.9%) |
| Total | 662 (67.5%) | 301 (30.7%) |
Disability Status by Sex by Age in Higginson
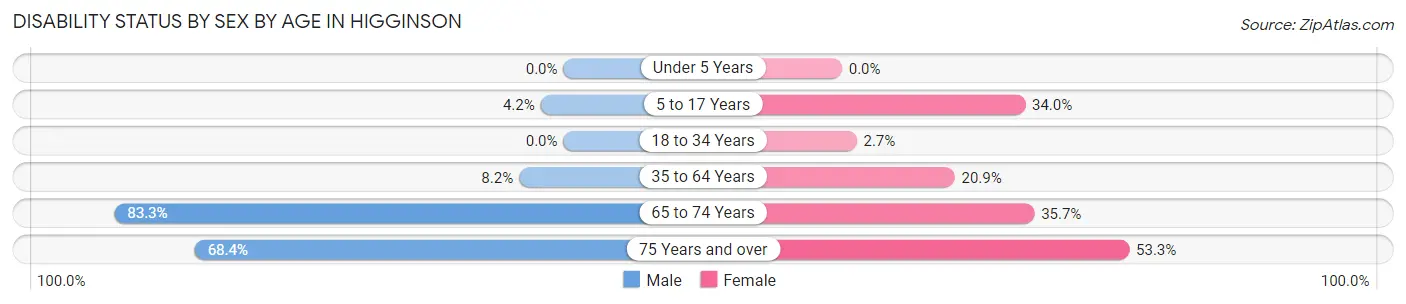
| Age Bracket | Male | Female |
| Under 5 Years | 0 (0.0%) | 0 (0.0%) |
| 5 to 17 Years | 3 (4.2%) | 50 (34.0%) |
| 18 to 34 Years | 0 (0.0%) | 4 (2.7%) |
| 35 to 64 Years | 13 (8.2%) | 36 (20.9%) |
| 65 to 74 Years | 15 (83.3%) | 5 (35.7%) |
| 75 Years and over | 13 (68.4%) | 8 (53.3%) |
Disability Class by Sex by Age in Higginson
Disability Class: Hearing Difficulty
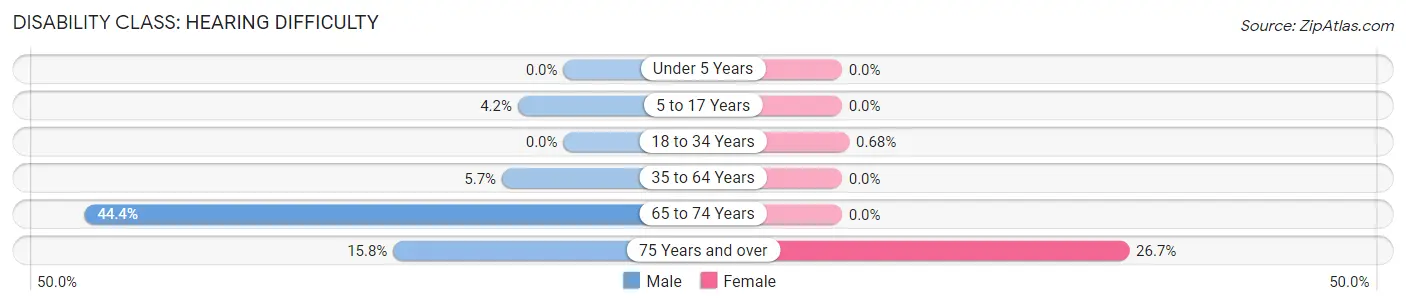
| Age Bracket | Male | Female |
| Under 5 Years | 0 (0.0%) | 0 (0.0%) |
| 5 to 17 Years | 3 (4.2%) | 0 (0.0%) |
| 18 to 34 Years | 0 (0.0%) | 1 (0.7%) |
| 35 to 64 Years | 9 (5.7%) | 0 (0.0%) |
| 65 to 74 Years | 8 (44.4%) | 0 (0.0%) |
| 75 Years and over | 3 (15.8%) | 4 (26.7%) |
Disability Class: Vision Difficulty
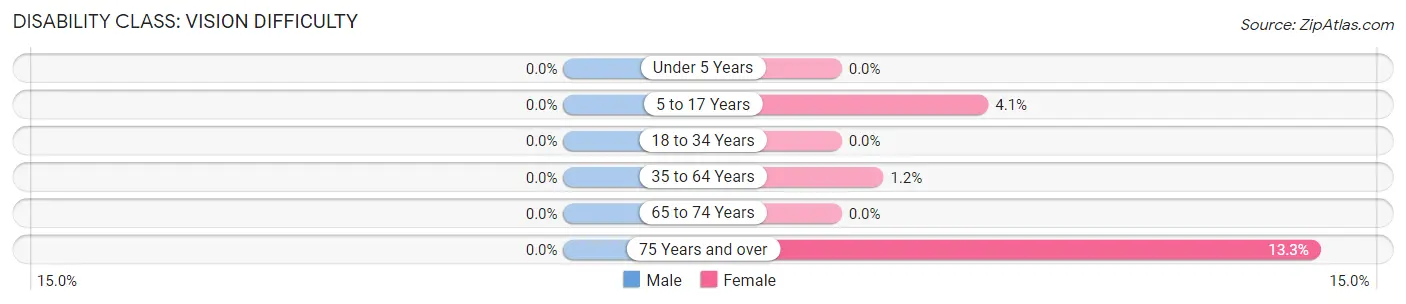
| Age Bracket | Male | Female |
| Under 5 Years | 0 (0.0%) | 0 (0.0%) |
| 5 to 17 Years | 0 (0.0%) | 6 (4.1%) |
| 18 to 34 Years | 0 (0.0%) | 0 (0.0%) |
| 35 to 64 Years | 0 (0.0%) | 2 (1.2%) |
| 65 to 74 Years | 0 (0.0%) | 0 (0.0%) |
| 75 Years and over | 0 (0.0%) | 2 (13.3%) |
Disability Class: Cognitive Difficulty
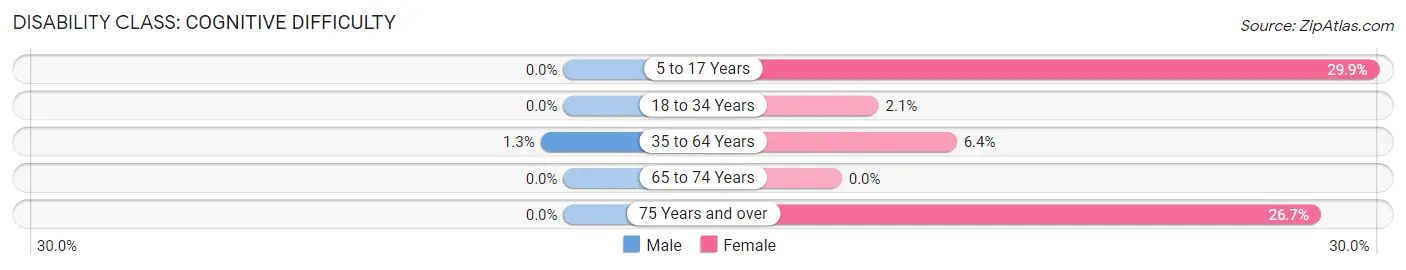
| Age Bracket | Male | Female |
| 5 to 17 Years | 0 (0.0%) | 44 (29.9%) |
| 18 to 34 Years | 0 (0.0%) | 3 (2.1%) |
| 35 to 64 Years | 2 (1.3%) | 11 (6.4%) |
| 65 to 74 Years | 0 (0.0%) | 0 (0.0%) |
| 75 Years and over | 0 (0.0%) | 4 (26.7%) |
Disability Class: Ambulatory Difficulty
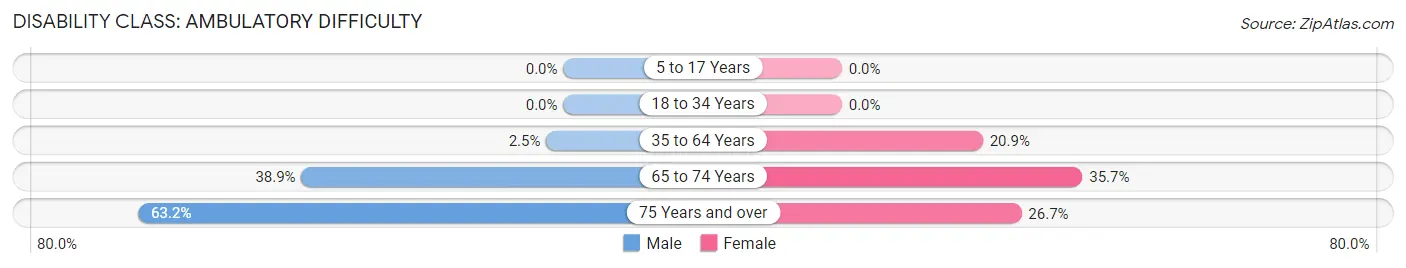
| Age Bracket | Male | Female |
| 5 to 17 Years | 0 (0.0%) | 0 (0.0%) |
| 18 to 34 Years | 0 (0.0%) | 0 (0.0%) |
| 35 to 64 Years | 4 (2.5%) | 36 (20.9%) |
| 65 to 74 Years | 7 (38.9%) | 5 (35.7%) |
| 75 Years and over | 12 (63.2%) | 4 (26.7%) |
Disability Class: Self-Care Difficulty
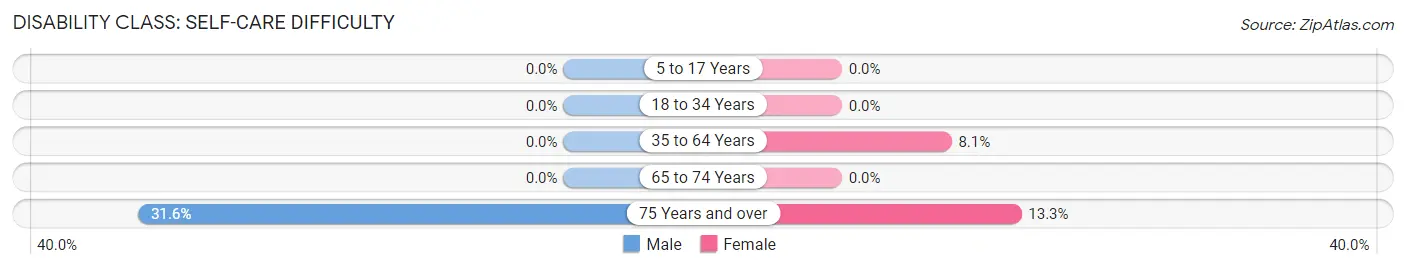
| Age Bracket | Male | Female |
| 5 to 17 Years | 0 (0.0%) | 0 (0.0%) |
| 18 to 34 Years | 0 (0.0%) | 0 (0.0%) |
| 35 to 64 Years | 0 (0.0%) | 14 (8.1%) |
| 65 to 74 Years | 0 (0.0%) | 0 (0.0%) |
| 75 Years and over | 6 (31.6%) | 2 (13.3%) |
Technology Access in Higginson
Computing Device Access in Higginson
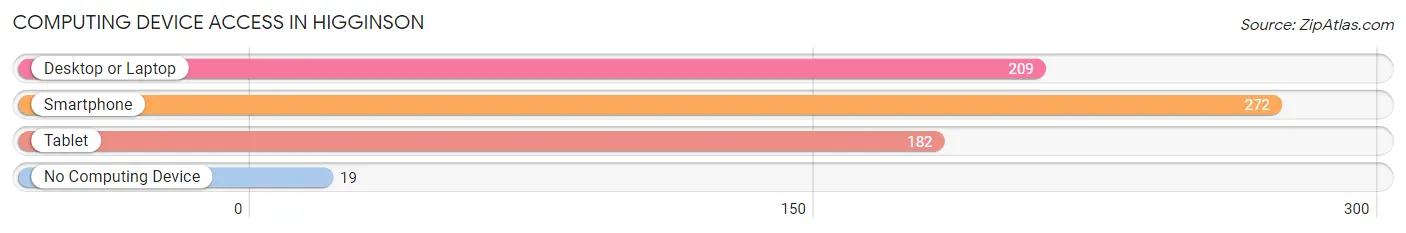
| Device Type | # Households | % Households |
| Desktop or Laptop | 209 | 70.1% |
| Smartphone | 272 | 91.3% |
| Tablet | 182 | 61.1% |
| No Computing Device | 19 | 6.4% |
| Total | 298 | 100.0% |
Internet Access in Higginson
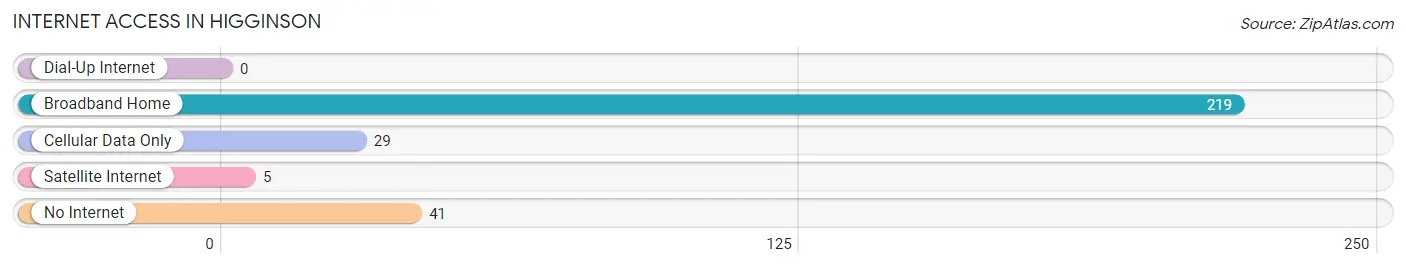
| Internet Type | # Households | % Households |
| Dial-Up Internet | 0 | 0.0% |
| Broadband Home | 219 | 73.5% |
| Cellular Data Only | 29 | 9.7% |
| Satellite Internet | 5 | 1.7% |
| No Internet | 41 | 13.8% |
| Total | 298 | 100.0% |
Higginson Summary
Higginson is a small town located in White County, Arkansas. It is situated in the foothills of the Ozark Mountains, approximately 30 miles northeast of Little Rock. The town was founded in 1872 and named after the prominent Higginson family, who were early settlers in the area. The population of Higginson was estimated to be 545 in 2020.
Geography
Higginson is located in the foothills of the Ozark Mountains, approximately 30 miles northeast of Little Rock. The town is situated in the White River Valley, which is surrounded by rolling hills and wooded areas. The White River runs through the town, providing a source of recreation and fishing. The town is also located near the Cache River National Wildlife Refuge, which is a popular destination for bird watching and other outdoor activities.
The climate in Higginson is humid subtropical, with hot summers and mild winters. The average annual temperature is around 64°F, with an average high of 87°F in the summer and an average low of 41°F in the winter. The average annual precipitation is around 48 inches.
Economy
The economy of Higginson is largely based on agriculture and tourism. The town is home to several farms, which produce a variety of crops, including corn, soybeans, cotton, and wheat. The town also has a number of small businesses, including restaurants, retail stores, and service providers.
Tourism is an important part of the local economy. The town is home to several attractions, including the White River National Wildlife Refuge, the Cache River State Park, and the Higginson-Henry Wildlife Management Area. The town also hosts a number of festivals and events throughout the year, including the Higginson Harvest Festival and the Higginson Music Festival.
Demographics
The population of Higginson was estimated to be 545 in 2020. The racial makeup of the town was 97.3% White, 0.7% African American, 0.2% Native American, 0.2% Asian, and 1.6% from other races. The median household income was $37,500, and the median home value was $90,000.
Education
Higginson is served by the White County School District, which includes two elementary schools, one middle school, and one high school. The town also has a public library and a number of churches.
Conclusion
Higginson is a small town located in White County, Arkansas. It is situated in the foothills of the Ozark Mountains, approximately 30 miles northeast of Little Rock. The town was founded in 1872 and named after the prominent Higginson family, who were early settlers in the area. The economy of Higginson is largely based on agriculture and tourism, and the population was estimated to be 545 in 2020. The town is served by the White County School District and has a number of attractions, including the White River National Wildlife Refuge, the Cache River State Park, and the Higginson-Henry Wildlife Management Area.
Common Questions
What is Per Capita Income in Higginson?
Per Capita income in Higginson is $22,320.
What is the Median Family Income in Higginson?
Median Family Income in Higginson is $62,500.
What is the Median Household income in Higginson?
Median Household Income in Higginson is $68,056.
What is Income or Wage Gap in Higginson?
Income or Wage Gap in Higginson is 68.1%.
Women in Higginson earn 31.9 cents for every dollar earned by a man.
What is Inequality or Gini Index in Higginson?
Inequality or Gini Index in Higginson is 0.30.
What is the Total Population of Higginson?
Total Population of Higginson is 981.
What is the Total Male Population of Higginson?
Total Male Population of Higginson is 442.
What is the Total Female Population of Higginson?
Total Female Population of Higginson is 539.
What is the Ratio of Males per 100 Females in Higginson?
There are 82.00 Males per 100 Females in Higginson.
What is the Ratio of Females per 100 Males in Higginson?
There are 121.95 Females per 100 Males in Higginson.
What is the Median Population Age in Higginson?
Median Population Age in Higginson is 25.0 Years.
What is the Average Family Size in Higginson
Average Family Size in Higginson is 3.7 People.
What is the Average Household Size in Higginson
Average Household Size in Higginson is 3.3 People.
How Large is the Labor Force in Higginson?
There are 562 People in the Labor Forcein in Higginson.
What is the Percentage of People in the Labor Force in Higginson?
72.1% of People are in the Labor Force in Higginson.
What is the Unemployment Rate in Higginson?
Unemployment Rate in Higginson is 3.9%.