McRae, AR
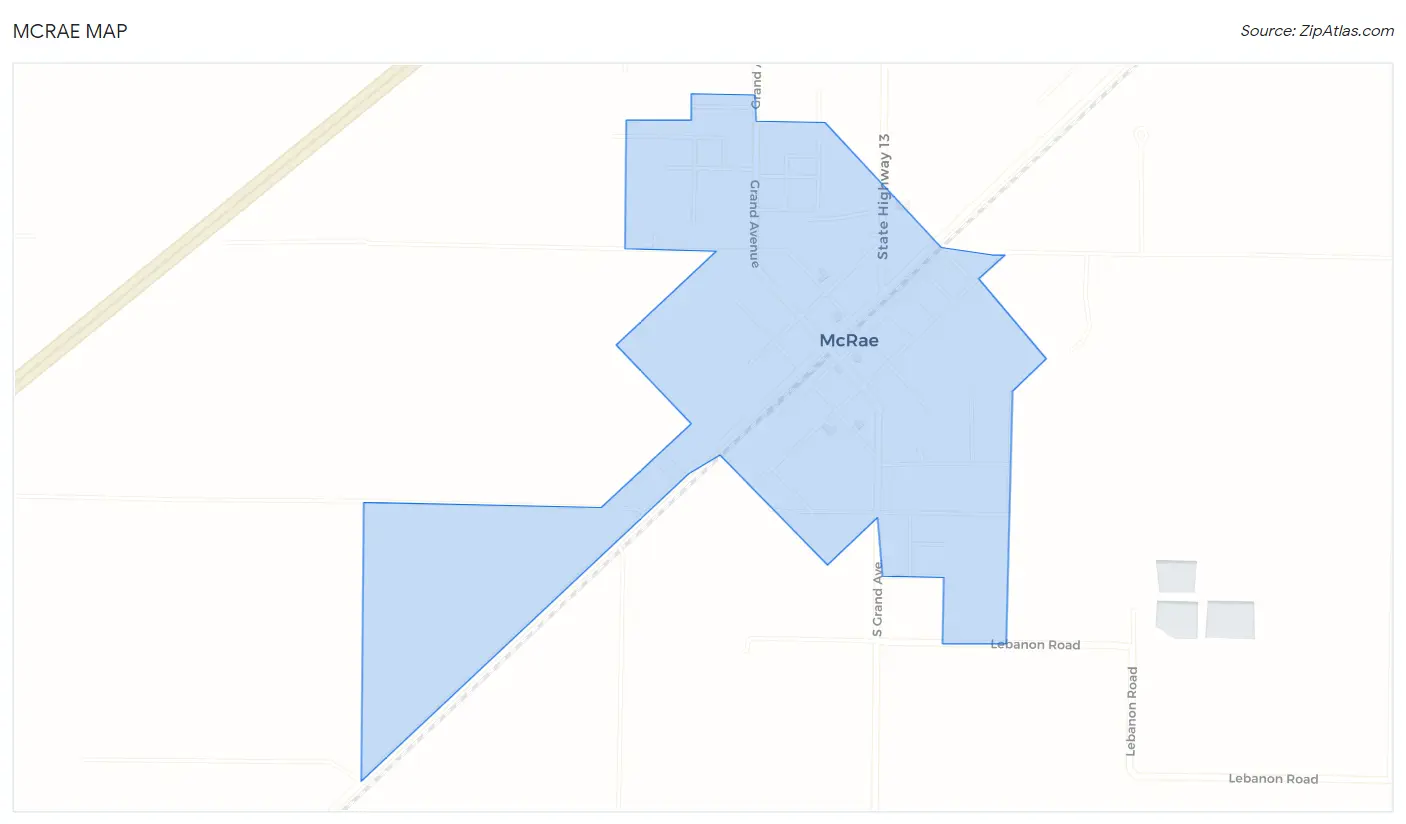
McRae Map
McRae Overview
853
TOTAL POPULATION
381
MALE POPULATION
472
FEMALE POPULATION
80.72
MALES / 100 FEMALES
123.88
FEMALES / 100 MALES
41.7
MEDIAN AGE
2.8
AVG FAMILY SIZE
2.2
AVG HOUSEHOLD SIZE
$20,775
PER CAPITA INCOME
$44,792
AVG FAMILY INCOME
$27,452
AVG HOUSEHOLD INCOME
18.7%
WAGE / INCOME GAP [ % ]
81.3¢/ $1
WAGE / INCOME GAP [ $ ]
0.41
INEQUALITY / GINI INDEX
375
LABOR FORCE [ PEOPLE ]
56.5%
PERCENT IN LABOR FORCE
1.9%
UNEMPLOYMENT RATE
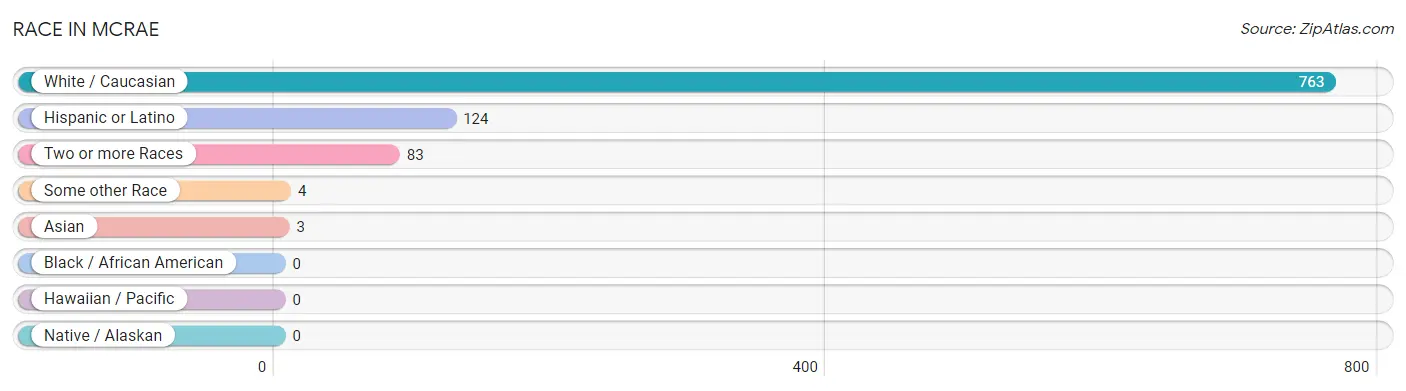
Race in McRae
The most populous races in McRae are White / Caucasian (763 | 89.4%), Hispanic or Latino (124 | 14.5%), and Two or more Races (83 | 9.7%).
| Race | # Population | % Population |
| Asian | 3 | 0.4% |
| Black / African American | 0 | 0.0% |
| Hawaiian / Pacific | 0 | 0.0% |
| Hispanic or Latino | 124 | 14.5% |
| Native / Alaskan | 0 | 0.0% |
| White / Caucasian | 763 | 89.4% |
| Two or more Races | 83 | 9.7% |
| Some other Race | 4 | 0.5% |
| Total | 853 | 100.0% |
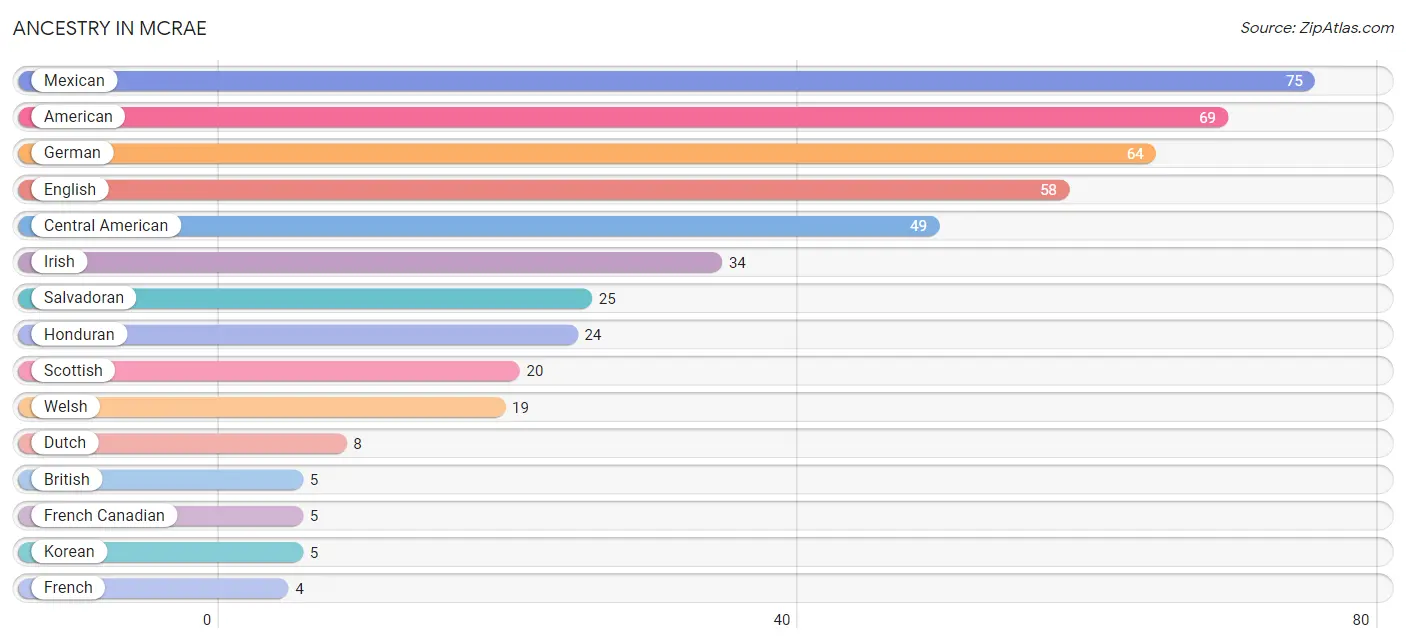
Ancestry in McRae
The most populous ancestries reported in McRae are Mexican (75 | 8.8%), American (69 | 8.1%), German (64 | 7.5%), English (58 | 6.8%), and Central American (49 | 5.7%), together accounting for 36.9% of all McRae residents.
| Ancestry | # Population | % Population |
| American | 69 | 8.1% |
| British | 5 | 0.6% |
| Central American | 49 | 5.7% |
| Cherokee | 1 | 0.1% |
| Dutch | 8 | 0.9% |
| English | 58 | 6.8% |
| French | 4 | 0.5% |
| French American Indian | 2 | 0.2% |
| French Canadian | 5 | 0.6% |
| German | 64 | 7.5% |
| Honduran | 24 | 2.8% |
| Irish | 34 | 4.0% |
| Italian | 2 | 0.2% |
| Korean | 5 | 0.6% |
| Lithuanian | 2 | 0.2% |
| Mexican | 75 | 8.8% |
| Salvadoran | 25 | 2.9% |
| Scottish | 20 | 2.3% |
| Welsh | 19 | 2.2% | View All 19 Rows |
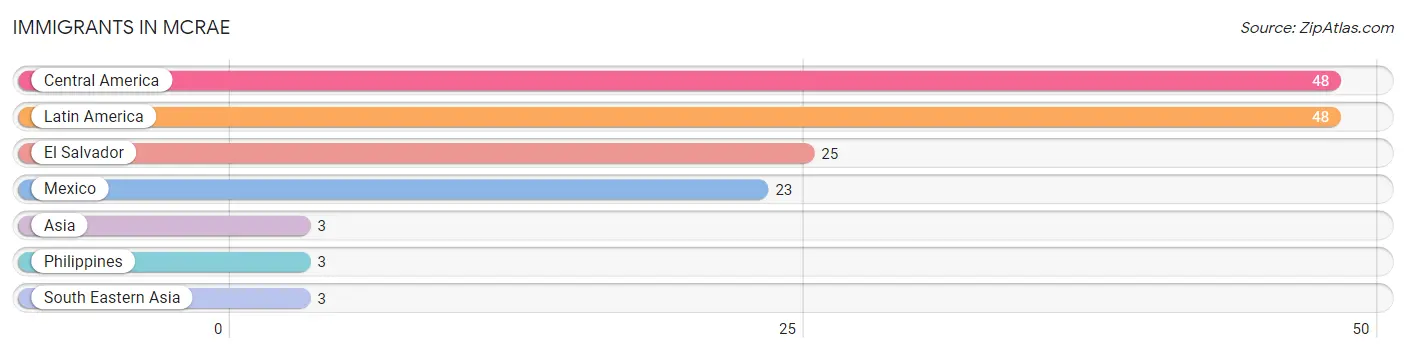
Immigrants in McRae
The most numerous immigrant groups reported in McRae came from Central America (48 | 5.6%), Latin America (48 | 5.6%), El Salvador (25 | 2.9%), Mexico (23 | 2.7%), and Asia (3 | 0.4%), together accounting for 17.2% of all McRae residents.
| Immigration Origin | # Population | % Population |
| Asia | 3 | 0.4% |
| Central America | 48 | 5.6% |
| El Salvador | 25 | 2.9% |
| Latin America | 48 | 5.6% |
| Mexico | 23 | 2.7% |
| Philippines | 3 | 0.4% |
| South Eastern Asia | 3 | 0.4% | View All 7 Rows |
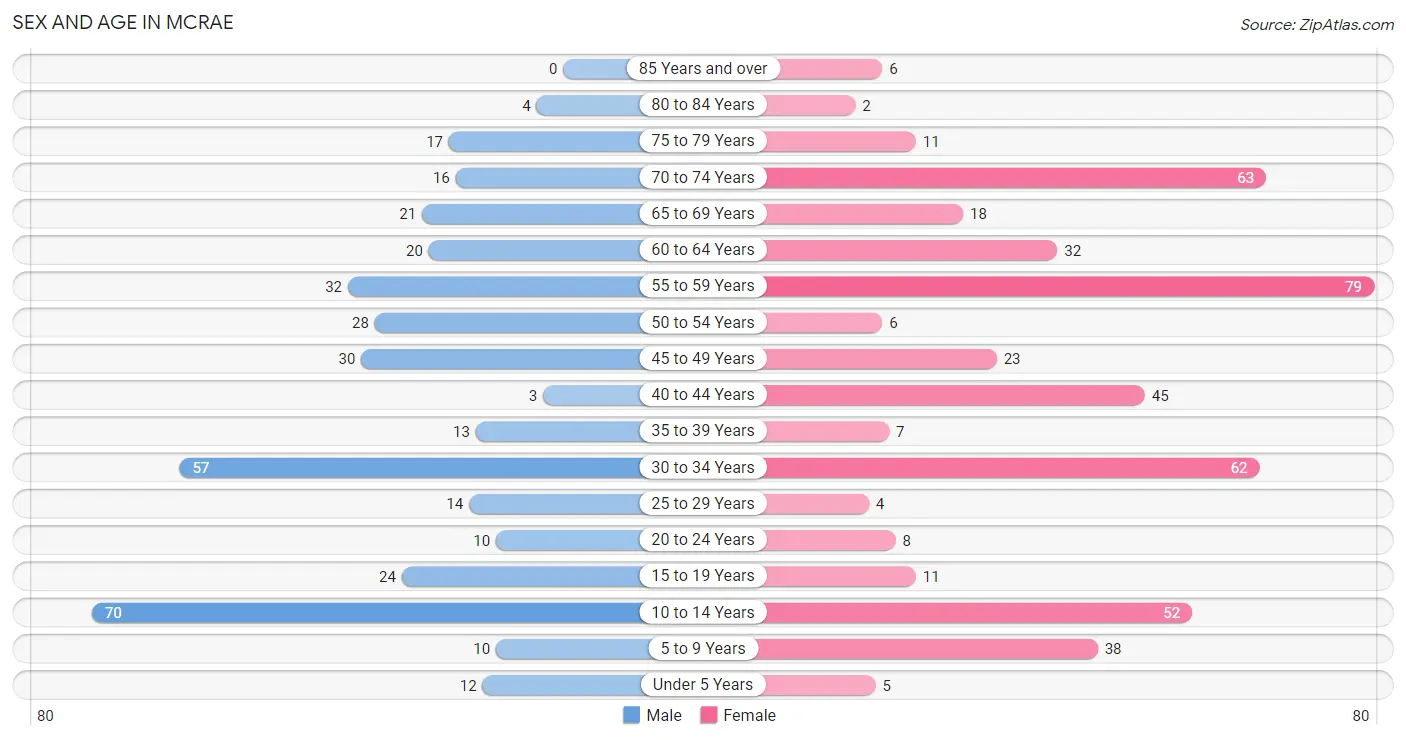
Sex and Age in McRae
Sex and Age in McRae
The most populous age groups in McRae are 10 to 14 Years (70 | 18.4%) for men and 55 to 59 Years (79 | 16.7%) for women.
| Age Bracket | Male | Female |
| Under 5 Years | 12 (3.2%) | 5 (1.1%) |
| 5 to 9 Years | 10 (2.6%) | 38 (8.1%) |
| 10 to 14 Years | 70 (18.4%) | 52 (11.0%) |
| 15 to 19 Years | 24 (6.3%) | 11 (2.3%) |
| 20 to 24 Years | 10 (2.6%) | 8 (1.7%) |
| 25 to 29 Years | 14 (3.7%) | 4 (0.9%) |
| 30 to 34 Years | 57 (15.0%) | 62 (13.1%) |
| 35 to 39 Years | 13 (3.4%) | 7 (1.5%) |
| 40 to 44 Years | 3 (0.8%) | 45 (9.5%) |
| 45 to 49 Years | 30 (7.9%) | 23 (4.9%) |
| 50 to 54 Years | 28 (7.3%) | 6 (1.3%) |
| 55 to 59 Years | 32 (8.4%) | 79 (16.7%) |
| 60 to 64 Years | 20 (5.2%) | 32 (6.8%) |
| 65 to 69 Years | 21 (5.5%) | 18 (3.8%) |
| 70 to 74 Years | 16 (4.2%) | 63 (13.4%) |
| 75 to 79 Years | 17 (4.5%) | 11 (2.3%) |
| 80 to 84 Years | 4 (1.1%) | 2 (0.4%) |
| 85 Years and over | 0 (0.0%) | 6 (1.3%) |
| Total | 381 (100.0%) | 472 (100.0%) |
Families and Households in McRae
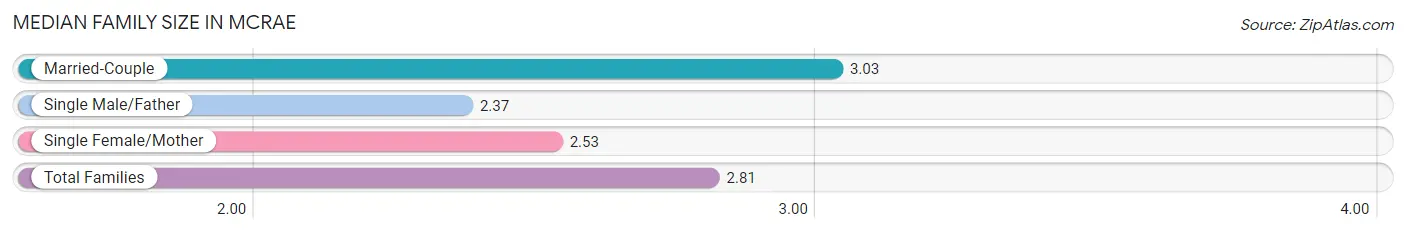
Median Family Size in McRae
The median family size in McRae is 2.81 persons per family, with married-couple families (149 | 59.4%) accounting for the largest median family size of 3.03 persons per family. On the other hand, single male/father families (27 | 10.8%) represent the smallest median family size with 2.37 persons per family.
| Family Type | # Families | Family Size |
| Married-Couple | 149 (59.4%) | 3.03 |
| Single Male/Father | 27 (10.8%) | 2.37 |
| Single Female/Mother | 75 (29.9%) | 2.53 |
| Total Families | 251 (100.0%) | 2.81 |
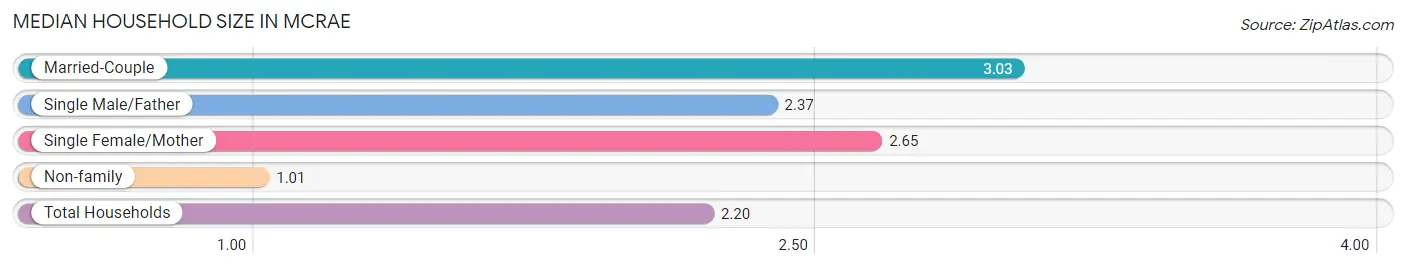
Median Household Size in McRae
The median household size in McRae is 2.20 persons per household, with married-couple households (149 | 38.4%) accounting for the largest median household size of 3.03 persons per household. non-family households (137 | 35.3%) represent the smallest median household size with 1.01 persons per household.
| Household Type | # Households | Household Size |
| Married-Couple | 149 (38.4%) | 3.03 |
| Single Male/Father | 27 (7.0%) | 2.37 |
| Single Female/Mother | 75 (19.3%) | 2.65 |
| Non-family | 137 (35.3%) | 1.01 |
| Total Households | 388 (100.0%) | 2.20 |
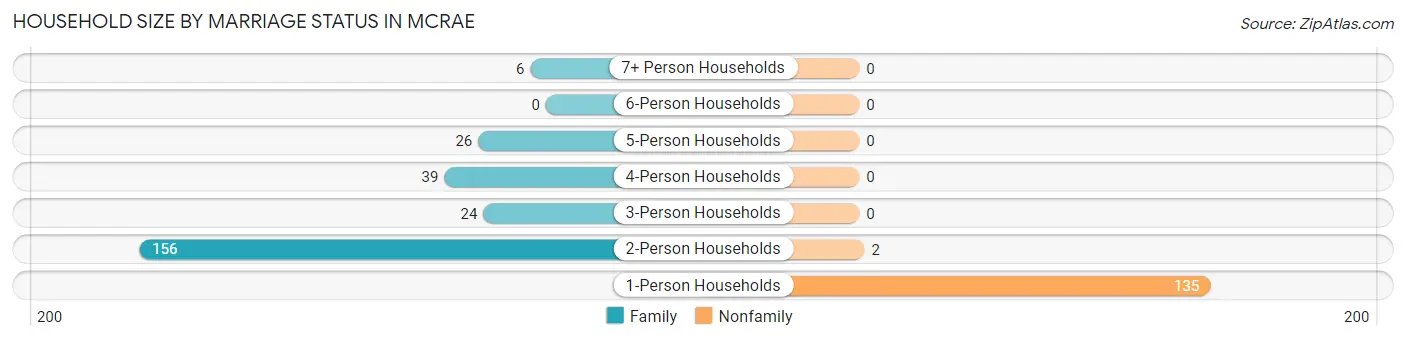
Household Size by Marriage Status in McRae
Out of a total of 388 households in McRae, 251 (64.7%) are family households, while 137 (35.3%) are nonfamily households. The most numerous type of family households are 2-person households, comprising 156, and the most common type of nonfamily households are 1-person households, comprising 135.
| Household Size | Family Households | Nonfamily Households |
| 1-Person Households | - | 135 (34.8%) |
| 2-Person Households | 156 (40.2%) | 2 (0.5%) |
| 3-Person Households | 24 (6.2%) | 0 (0.0%) |
| 4-Person Households | 39 (10.1%) | 0 (0.0%) |
| 5-Person Households | 26 (6.7%) | 0 (0.0%) |
| 6-Person Households | 0 (0.0%) | 0 (0.0%) |
| 7+ Person Households | 6 (1.5%) | 0 (0.0%) |
| Total | 251 (64.7%) | 137 (35.3%) |
Female Fertility in McRae
Fertility by Age in McRae
Average fertility rate in McRae is 25.0 births per 1,000 women. Women in the age bracket of 20 to 34 years have the highest fertility rate with 54.0 births per 1,000 women. Women in the age bracket of 20 to 34 years acount for 100.0% of all women with births.
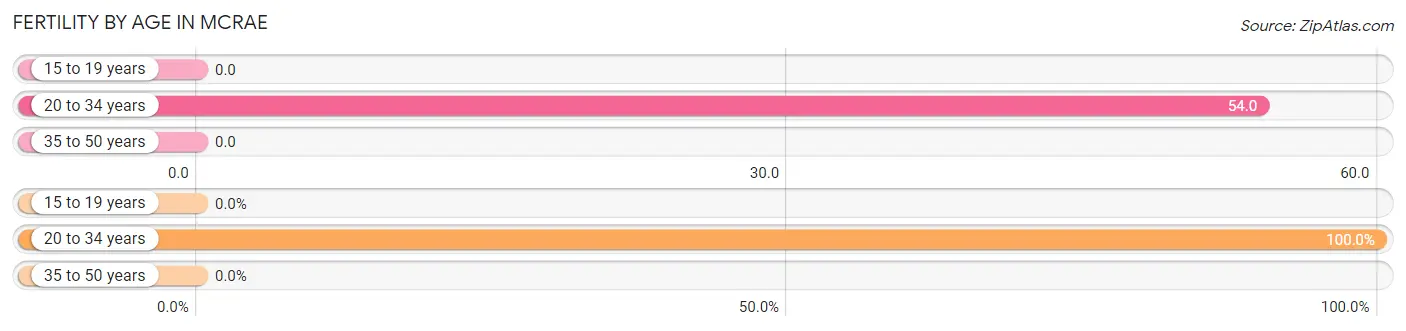
| Age Bracket | Women with Births | Births / 1,000 Women |
| 15 to 19 years | 0 (0.0%) | 0.0 |
| 20 to 34 years | 4 (100.0%) | 54.0 |
| 35 to 50 years | 0 (0.0%) | 0.0 |
| Total | 4 (100.0%) | 25.0 |
Fertility by Age by Marriage Status in McRae
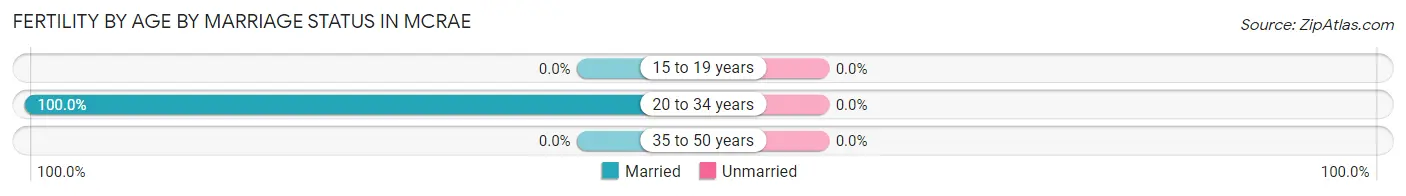
| Age Bracket | Married | Unmarried |
| 15 to 19 years | 0 (0.0%) | 0 (0.0%) |
| 20 to 34 years | 4 (100.0%) | 0 (0.0%) |
| 35 to 50 years | 0 (0.0%) | 0 (0.0%) |
| Total | 4 (100.0%) | 0 (0.0%) |
Fertility by Education in McRae
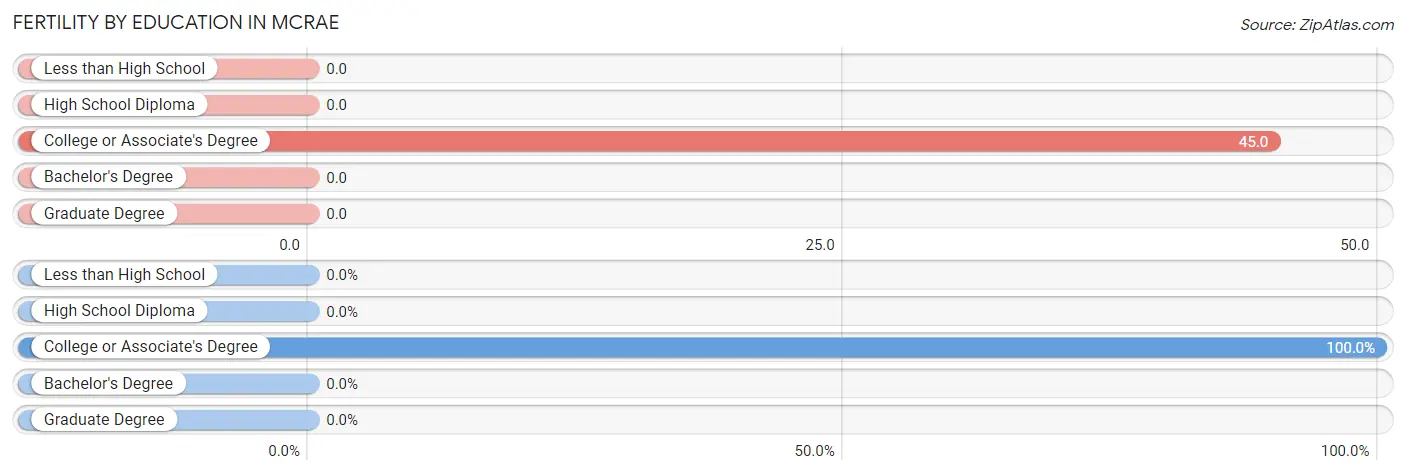
| Educational Attainment | Women with Births | Births / 1,000 Women |
| Less than High School | 0 (0.0%) | 0.0 |
| High School Diploma | 0 (0.0%) | 0.0 |
| College or Associate's Degree | 4 (100.0%) | 45.0 |
| Bachelor's Degree | 0 (0.0%) | 0.0 |
| Graduate Degree | 0 (0.0%) | 0.0 |
| Total | 4 (100.0%) | 25.0 |
Fertility by Education by Marriage Status in McRae
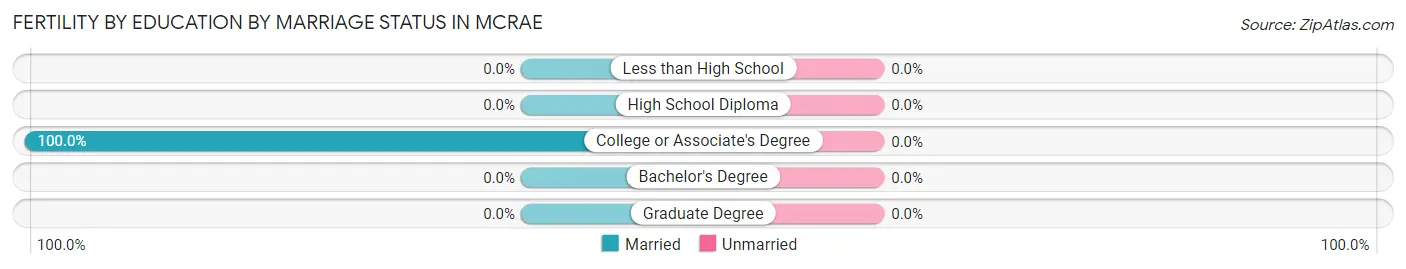
| Educational Attainment | Married | Unmarried |
| Less than High School | 0 (0.0%) | 0 (0.0%) |
| High School Diploma | 0 (0.0%) | 0 (0.0%) |
| College or Associate's Degree | 4 (100.0%) | 0 (0.0%) |
| Bachelor's Degree | 0 (0.0%) | 0 (0.0%) |
| Graduate Degree | 0 (0.0%) | 0 (0.0%) |
| Total | 4 (100.0%) | 0 (0.0%) |
Income in McRae
Income Overview in McRae
Per Capita Income in McRae is $20,775, while median incomes of families and households are $44,792 and $27,452 respectively.
| Characteristic | Number | Measure |
| Per Capita Income | 853 | $20,775 |
| Median Family Income | 251 | $44,792 |
| Mean Family Income | 251 | $54,429 |
| Median Household Income | 388 | $27,452 |
| Mean Household Income | 388 | $43,088 |
| Income Deficit | 251 | $0 |
| Wage / Income Gap (%) | 853 | 18.68% |
| Wage / Income Gap ($) | 853 | 81.32¢ per $1 |
| Gini / Inequality Index | 853 | 0.41 |
Earnings by Sex in McRae
Average Earnings in McRae are $33,375, $35,795 for men and $29,107 for women, a difference of 18.7%.
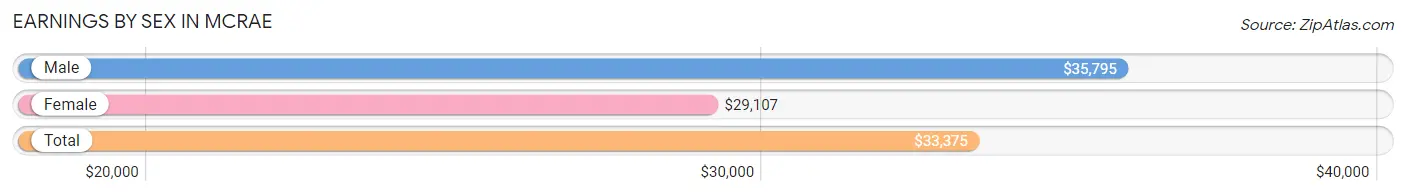
| Sex | Number | Average Earnings |
| Male | 185 (49.5%) | $35,795 |
| Female | 189 (50.5%) | $29,107 |
| Total | 374 (100.0%) | $33,375 |
Earnings by Sex by Income Bracket in McRae
The most common earnings brackets in McRae are $55,000 to $64,999 for men (40 | 21.6%) and $45,000 to $49,999 for women (31 | 16.4%).
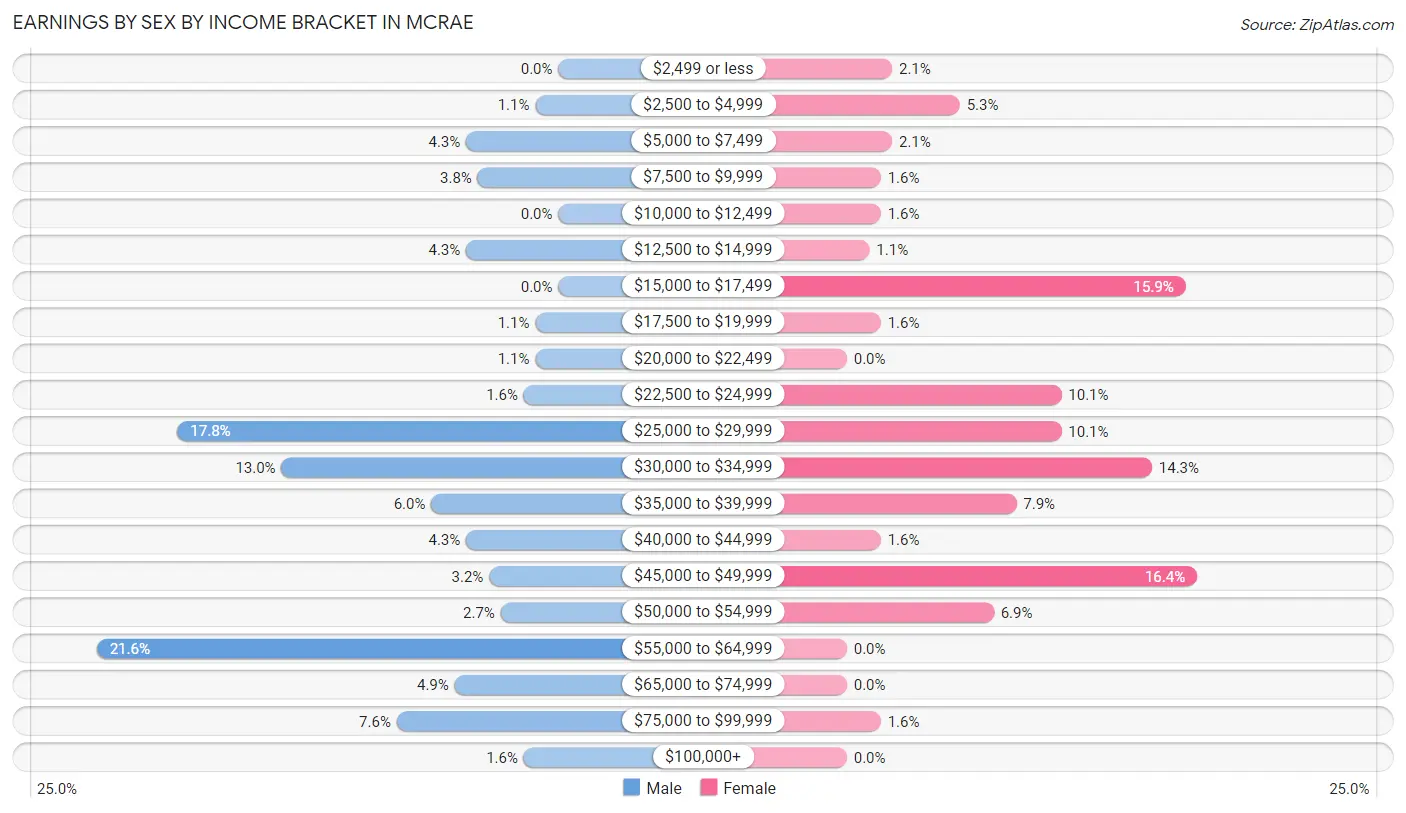
| Income | Male | Female |
| $2,499 or less | 0 (0.0%) | 4 (2.1%) |
| $2,500 to $4,999 | 2 (1.1%) | 10 (5.3%) |
| $5,000 to $7,499 | 8 (4.3%) | 4 (2.1%) |
| $7,500 to $9,999 | 7 (3.8%) | 3 (1.6%) |
| $10,000 to $12,499 | 0 (0.0%) | 3 (1.6%) |
| $12,500 to $14,999 | 8 (4.3%) | 2 (1.1%) |
| $15,000 to $17,499 | 0 (0.0%) | 30 (15.9%) |
| $17,500 to $19,999 | 2 (1.1%) | 3 (1.6%) |
| $20,000 to $22,499 | 2 (1.1%) | 0 (0.0%) |
| $22,500 to $24,999 | 3 (1.6%) | 19 (10.1%) |
| $25,000 to $29,999 | 33 (17.8%) | 19 (10.1%) |
| $30,000 to $34,999 | 24 (13.0%) | 27 (14.3%) |
| $35,000 to $39,999 | 11 (5.9%) | 15 (7.9%) |
| $40,000 to $44,999 | 8 (4.3%) | 3 (1.6%) |
| $45,000 to $49,999 | 6 (3.2%) | 31 (16.4%) |
| $50,000 to $54,999 | 5 (2.7%) | 13 (6.9%) |
| $55,000 to $64,999 | 40 (21.6%) | 0 (0.0%) |
| $65,000 to $74,999 | 9 (4.9%) | 0 (0.0%) |
| $75,000 to $99,999 | 14 (7.6%) | 3 (1.6%) |
| $100,000+ | 3 (1.6%) | 0 (0.0%) |
| Total | 185 (100.0%) | 189 (100.0%) |
Earnings by Sex by Educational Attainment in McRae
Average earnings in McRae are $36,477 for men and $28,929 for women, a difference of 20.7%. Men with an educational attainment of college or associate's degree enjoy the highest average annual earnings of $62,750, while those with bachelor's degree education earn the least with $26,776. Women with an educational attainment of high school diploma earn the most with the average annual earnings of $36,023, while those with college or associate's degree education have the smallest earnings of $25,313.
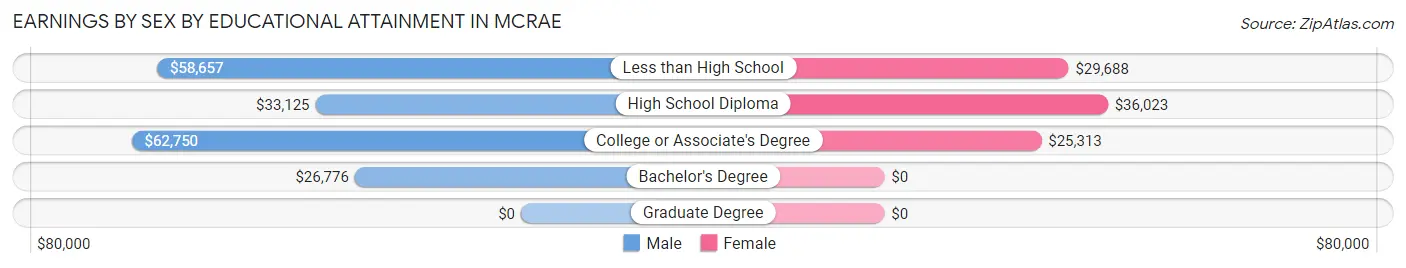
| Educational Attainment | Male Income | Female Income |
| Less than High School | $58,657 | $29,688 |
| High School Diploma | $33,125 | $36,023 |
| College or Associate's Degree | $62,750 | $25,313 |
| Bachelor's Degree | $26,776 | $0 |
| Graduate Degree | - | - |
| Total | $36,477 | $28,929 |
Family Income in McRae
Family Income Brackets in McRae
According to the McRae family income data, there are 47 families falling into the $25,000 to $34,999 income range, which is the most common income bracket and makes up 18.7% of all families.
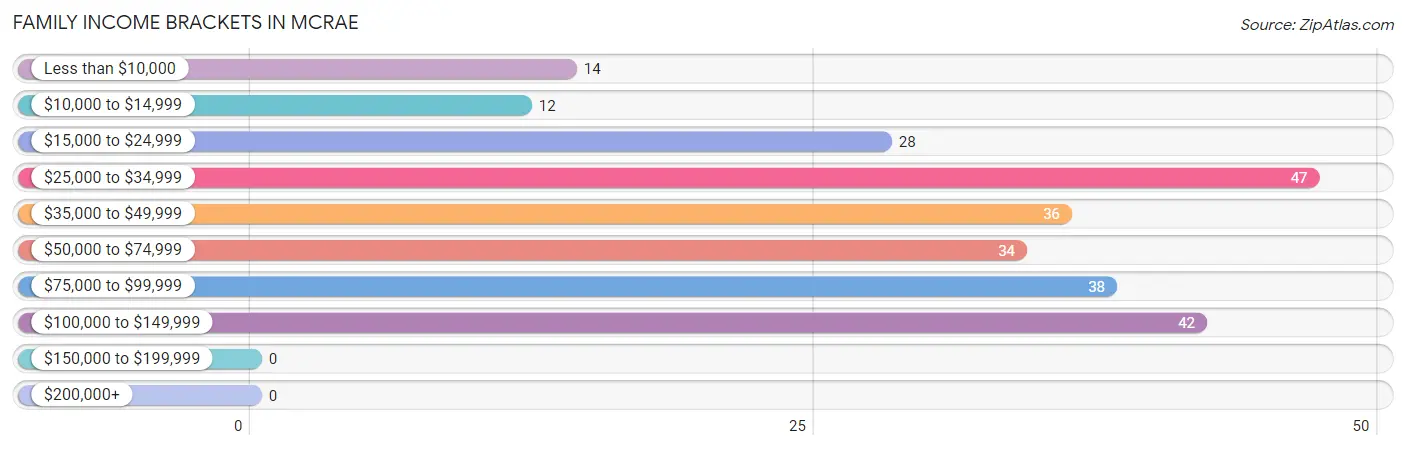
| Income Bracket | # Families | % Families |
| Less than $10,000 | 14 | 5.6% |
| $10,000 to $14,999 | 12 | 4.8% |
| $15,000 to $24,999 | 28 | 11.2% |
| $25,000 to $34,999 | 47 | 18.7% |
| $35,000 to $49,999 | 36 | 14.3% |
| $50,000 to $74,999 | 34 | 13.5% |
| $75,000 to $99,999 | 38 | 15.1% |
| $100,000 to $149,999 | 42 | 16.7% |
| $150,000 to $199,999 | 0 | 0.0% |
| $200,000+ | 0 | 0.0% |
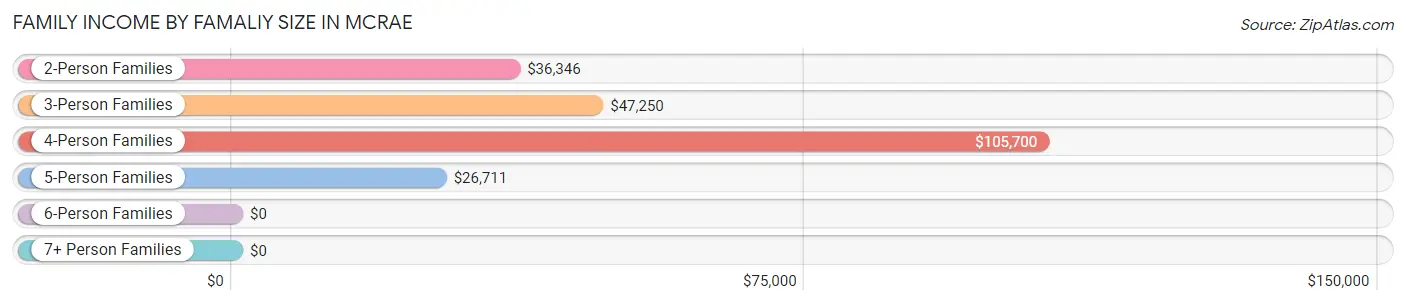
Family Income by Famaliy Size in McRae
4-person families (36 | 14.3%) account for the highest median family income in McRae with $105,700 per family, while 4-person families (36 | 14.3%) have the highest median income of $26,425 per family member.
| Income Bracket | # Families | Median Income |
| 2-Person Families | 160 (63.7%) | $36,346 |
| 3-Person Families | 23 (9.2%) | $47,250 |
| 4-Person Families | 36 (14.3%) | $105,700 |
| 5-Person Families | 26 (10.4%) | $26,711 |
| 6-Person Families | 0 (0.0%) | $0 |
| 7+ Person Families | 6 (2.4%) | $0 |
| Total | 251 (100.0%) | $44,792 |
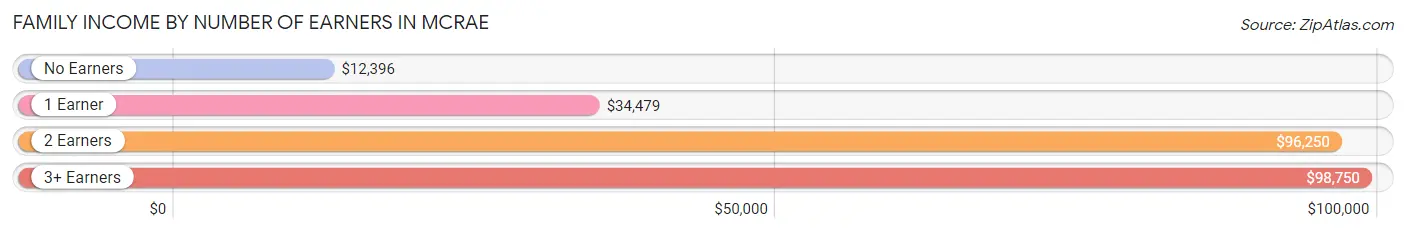
Family Income by Number of Earners in McRae
The median family income in McRae is $44,792, with families comprising 3+ earners (7) having the highest median family income of $98,750, while families with no earners (47) have the lowest median family income of $12,396, accounting for 2.8% and 18.7% of families, respectively.
| Number of Earners | # Families | Median Income |
| No Earners | 47 (18.7%) | $12,396 |
| 1 Earner | 119 (47.4%) | $34,479 |
| 2 Earners | 78 (31.1%) | $96,250 |
| 3+ Earners | 7 (2.8%) | $98,750 |
| Total | 251 (100.0%) | $44,792 |
Household Income in McRae
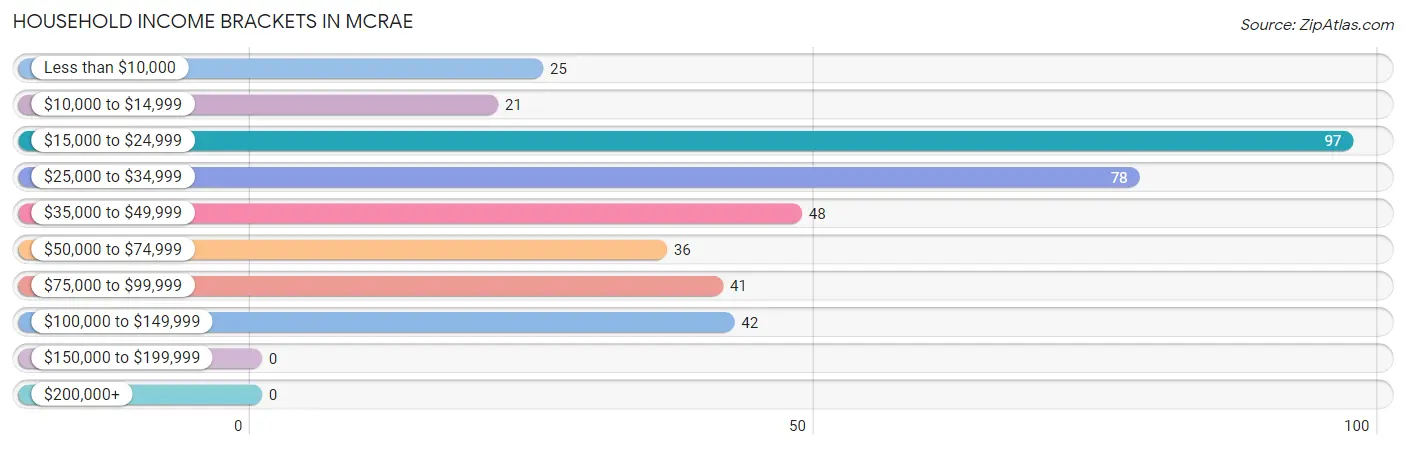
Household Income Brackets in McRae
With 97 households falling in the category, the $15,000 to $24,999 income range is the most frequent in McRae, accounting for 25.0% of all households.
| Income Bracket | # Households | % Households |
| Less than $10,000 | 25 | 6.4% |
| $10,000 to $14,999 | 21 | 5.4% |
| $15,000 to $24,999 | 97 | 25.0% |
| $25,000 to $34,999 | 78 | 20.1% |
| $35,000 to $49,999 | 48 | 12.4% |
| $50,000 to $74,999 | 36 | 9.3% |
| $75,000 to $99,999 | 41 | 10.6% |
| $100,000 to $149,999 | 42 | 10.8% |
| $150,000 to $199,999 | 0 | 0.0% |
| $200,000+ | 0 | 0.0% |
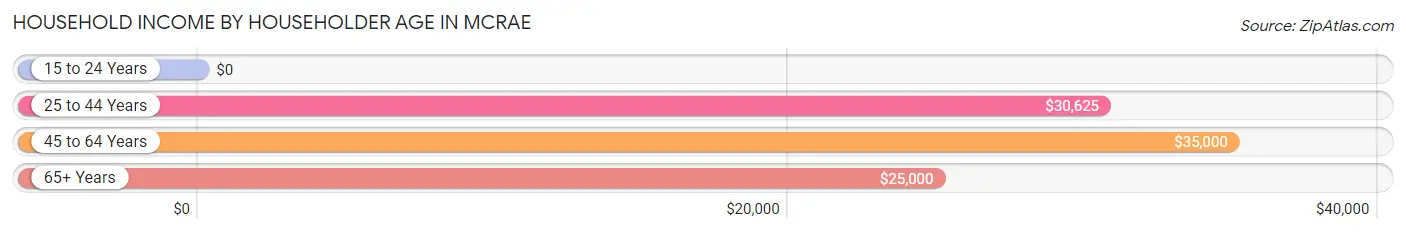
Household Income by Householder Age in McRae
The median household income in McRae is $27,452, with the highest median household income of $35,000 found in the 45 to 64 years age bracket for the primary householder. A total of 158 households (40.7%) fall into this category. Meanwhile, the 15 to 24 years age bracket for the primary householder has the lowest median household income of $0, with 6 households (1.5%) in this group.
| Income Bracket | # Households | Median Income |
| 15 to 24 Years | 6 (1.5%) | $0 |
| 25 to 44 Years | 110 (28.3%) | $30,625 |
| 45 to 64 Years | 158 (40.7%) | $35,000 |
| 65+ Years | 114 (29.4%) | $25,000 |
| Total | 388 (100.0%) | $27,452 |
Poverty in McRae
Income Below Poverty by Sex and Age in McRae
With 16.0% poverty level for males and 27.1% for females among the residents of McRae, 18 to 24 year old males and 12 to 14 year old females are the most vulnerable to poverty, with 8 males (57.1%) and 30 females (61.2%) in their respective age groups living below the poverty level.
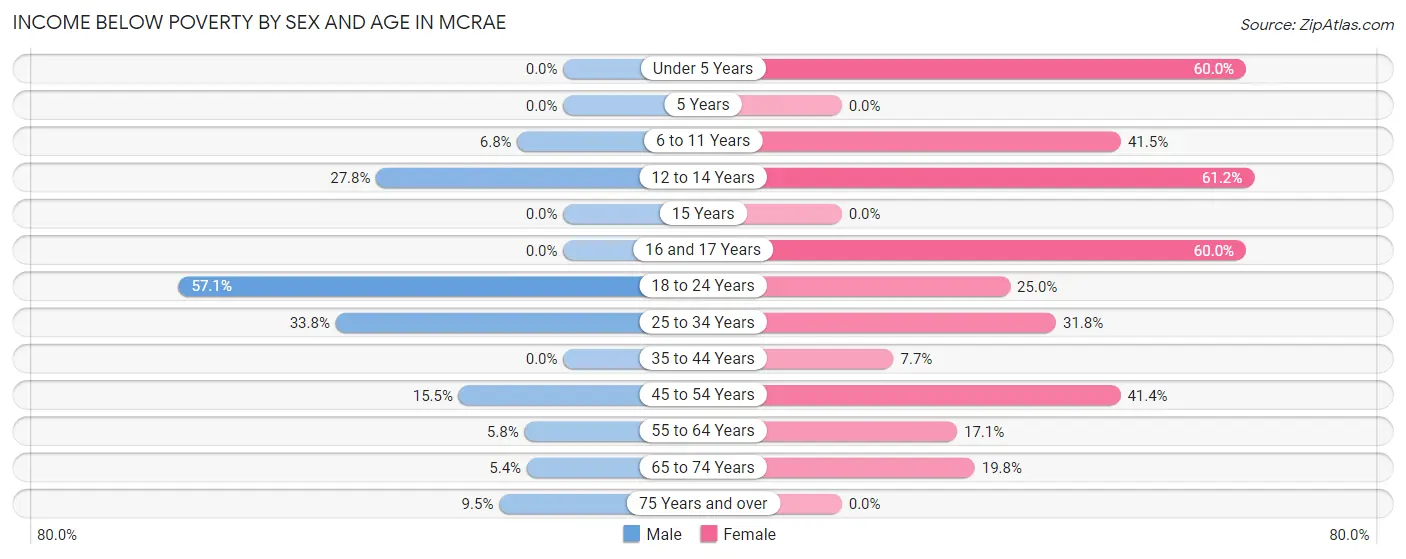
| Age Bracket | Male | Female |
| Under 5 Years | 0 (0.0%) | 3 (60.0%) |
| 5 Years | 0 (0.0%) | 0 (0.0%) |
| 6 to 11 Years | 3 (6.8%) | 17 (41.5%) |
| 12 to 14 Years | 10 (27.8%) | 30 (61.2%) |
| 15 Years | 0 (0.0%) | 0 (0.0%) |
| 16 and 17 Years | 0 (0.0%) | 3 (60.0%) |
| 18 to 24 Years | 8 (57.1%) | 3 (25.0%) |
| 25 to 34 Years | 24 (33.8%) | 21 (31.8%) |
| 35 to 44 Years | 0 (0.0%) | 4 (7.7%) |
| 45 to 54 Years | 9 (15.5%) | 12 (41.4%) |
| 55 to 64 Years | 3 (5.8%) | 19 (17.1%) |
| 65 to 74 Years | 2 (5.4%) | 16 (19.8%) |
| 75 Years and over | 2 (9.5%) | 0 (0.0%) |
| Total | 61 (16.0%) | 128 (27.1%) |
Income Above Poverty by Sex and Age in McRae
According to the poverty statistics in McRae, males aged under 5 years and females aged 15 years are the age groups that are most secure financially, with 100.0% of males and 100.0% of females in these age groups living above the poverty line.
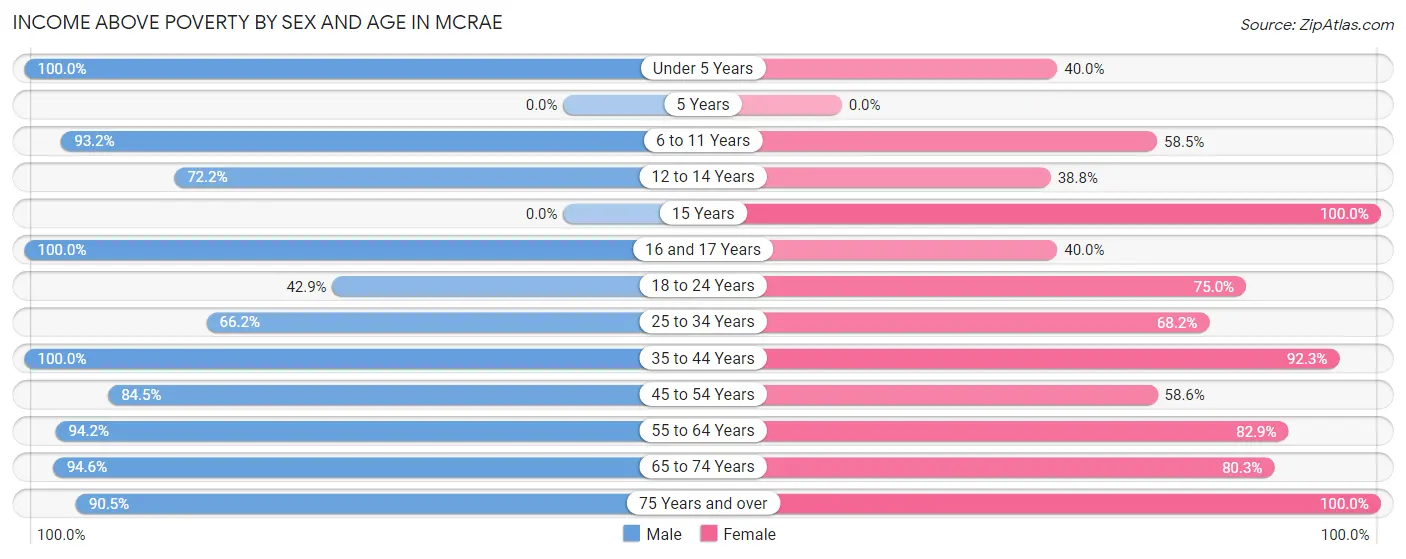
| Age Bracket | Male | Female |
| Under 5 Years | 12 (100.0%) | 2 (40.0%) |
| 5 Years | 0 (0.0%) | 0 (0.0%) |
| 6 to 11 Years | 41 (93.2%) | 24 (58.5%) |
| 12 to 14 Years | 26 (72.2%) | 19 (38.8%) |
| 15 Years | 0 (0.0%) | 2 (100.0%) |
| 16 and 17 Years | 20 (100.0%) | 2 (40.0%) |
| 18 to 24 Years | 6 (42.9%) | 9 (75.0%) |
| 25 to 34 Years | 47 (66.2%) | 45 (68.2%) |
| 35 to 44 Years | 16 (100.0%) | 48 (92.3%) |
| 45 to 54 Years | 49 (84.5%) | 17 (58.6%) |
| 55 to 64 Years | 49 (94.2%) | 92 (82.9%) |
| 65 to 74 Years | 35 (94.6%) | 65 (80.2%) |
| 75 Years and over | 19 (90.5%) | 19 (100.0%) |
| Total | 320 (84.0%) | 344 (72.9%) |
Income Below Poverty Among Married-Couple Families in McRae
The poverty statistics for married-couple families in McRae show that 22.2% or 33 of the total 149 families live below the poverty line. Families with 3 or 4 children have the highest poverty rate of 79.2%, comprising of 19 families. On the other hand, families with 1 or 2 children have the lowest poverty rate of 9.5%, which includes 4 families.
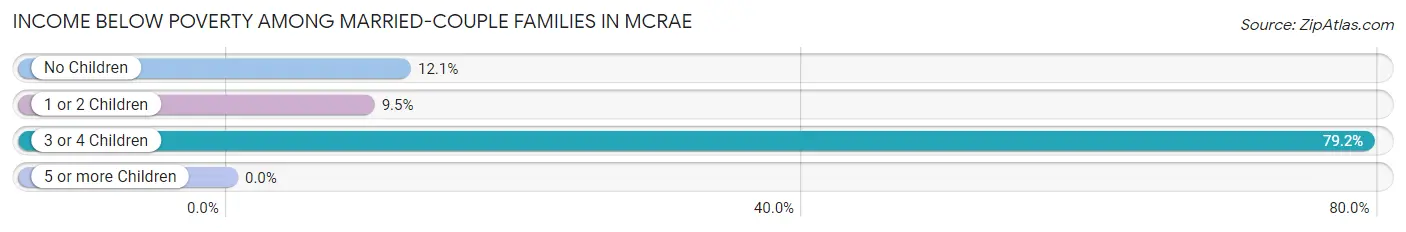
| Children | Above Poverty | Below Poverty |
| No Children | 73 (87.9%) | 10 (12.0%) |
| 1 or 2 Children | 38 (90.5%) | 4 (9.5%) |
| 3 or 4 Children | 5 (20.8%) | 19 (79.2%) |
| 5 or more Children | 0 (0.0%) | 0 (0.0%) |
| Total | 116 (77.8%) | 33 (22.2%) |
Income Below Poverty Among Single-Parent Households in McRae
According to the poverty data in McRae, 7.4% or 2 single-father households and 24.0% or 18 single-mother households are living below the poverty line. Among single-father households, those with 1 or 2 children have the highest poverty rate, with 2 households (14.3%) experiencing poverty. Likewise, among single-mother households, those with no children have the highest poverty rate, with 11 households (61.1%) falling below the poverty line.
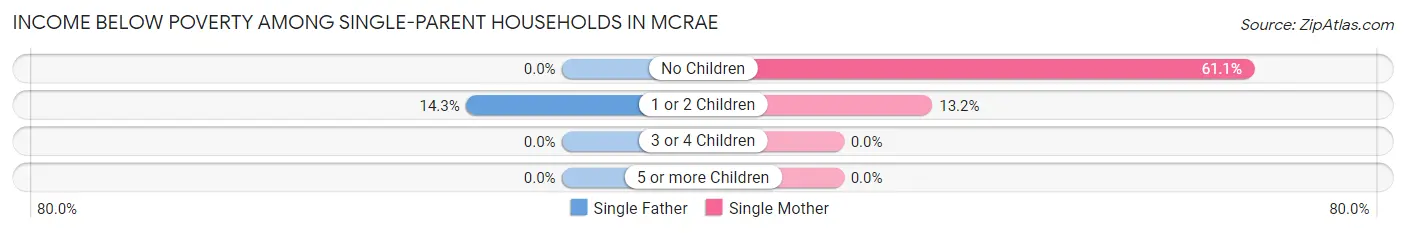
| Children | Single Father | Single Mother |
| No Children | 0 (0.0%) | 11 (61.1%) |
| 1 or 2 Children | 2 (14.3%) | 7 (13.2%) |
| 3 or 4 Children | 0 (0.0%) | 0 (0.0%) |
| 5 or more Children | 0 (0.0%) | 0 (0.0%) |
| Total | 2 (7.4%) | 18 (24.0%) |
Income Below Poverty Among Married-Couple vs Single-Parent Households in McRae
The poverty data for McRae shows that 33 of the married-couple family households (22.2%) and 20 of the single-parent households (19.6%) are living below the poverty level. Within the married-couple family households, those with 3 or 4 children have the highest poverty rate, with 19 households (79.2%) falling below the poverty line. Among the single-parent households, those with no children have the highest poverty rate, with 11 household (35.5%) living below poverty.
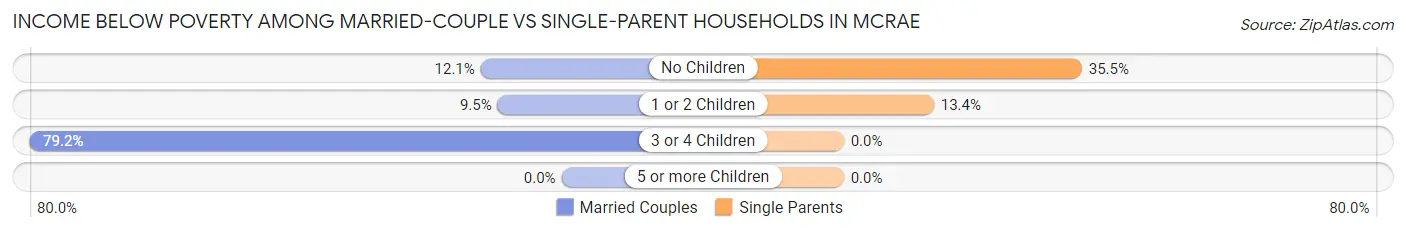
| Children | Married-Couple Families | Single-Parent Households |
| No Children | 10 (12.0%) | 11 (35.5%) |
| 1 or 2 Children | 4 (9.5%) | 9 (13.4%) |
| 3 or 4 Children | 19 (79.2%) | 0 (0.0%) |
| 5 or more Children | 0 (0.0%) | 0 (0.0%) |
| Total | 33 (22.2%) | 20 (19.6%) |
Employment Characteristics in McRae
Employment by Class of Employer in McRae
Among the 366 employed individuals in McRae, private company employees (216 | 59.0%), state government employees (74 | 20.2%), and not-for-profit organizations (38 | 10.4%) make up the most common classes of employment.
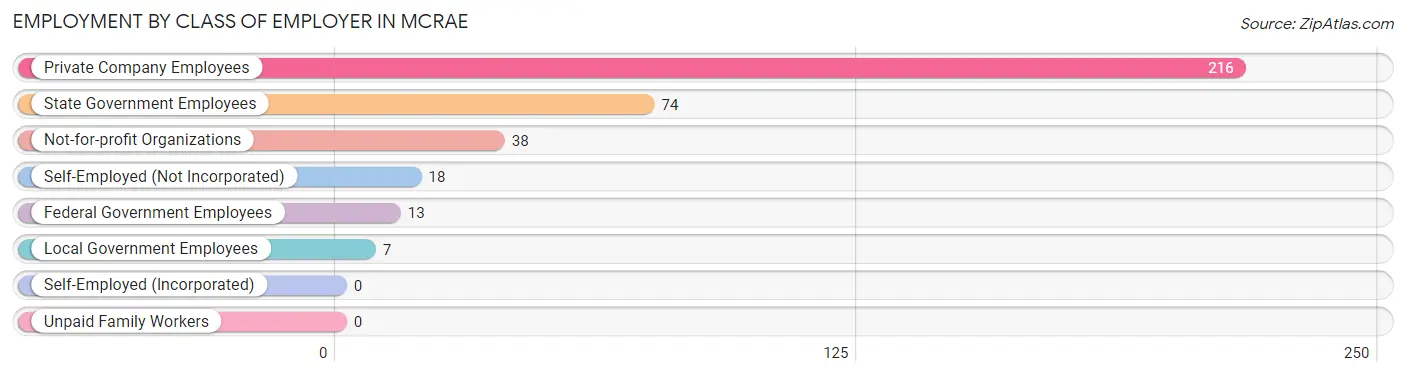
| Employer Class | # Employees | % Employees |
| Private Company Employees | 216 | 59.0% |
| Self-Employed (Incorporated) | 0 | 0.0% |
| Self-Employed (Not Incorporated) | 18 | 4.9% |
| Not-for-profit Organizations | 38 | 10.4% |
| Local Government Employees | 7 | 1.9% |
| State Government Employees | 74 | 20.2% |
| Federal Government Employees | 13 | 3.5% |
| Unpaid Family Workers | 0 | 0.0% |
| Total | 366 | 100.0% |
Employment Status by Age in McRae
According to the labor force statistics for McRae, out of the total population over 16 years of age (664), 56.5% or 375 individuals are in the labor force, with 1.9% or 7 of them unemployed. The age group with the highest labor force participation rate is 25 to 29 years, with 100.0% or 18 individuals in the labor force. Within the labor force, the 25 to 29 years age range has the highest percentage of unemployed individuals, with 22.2% or 4 of them being unemployed.
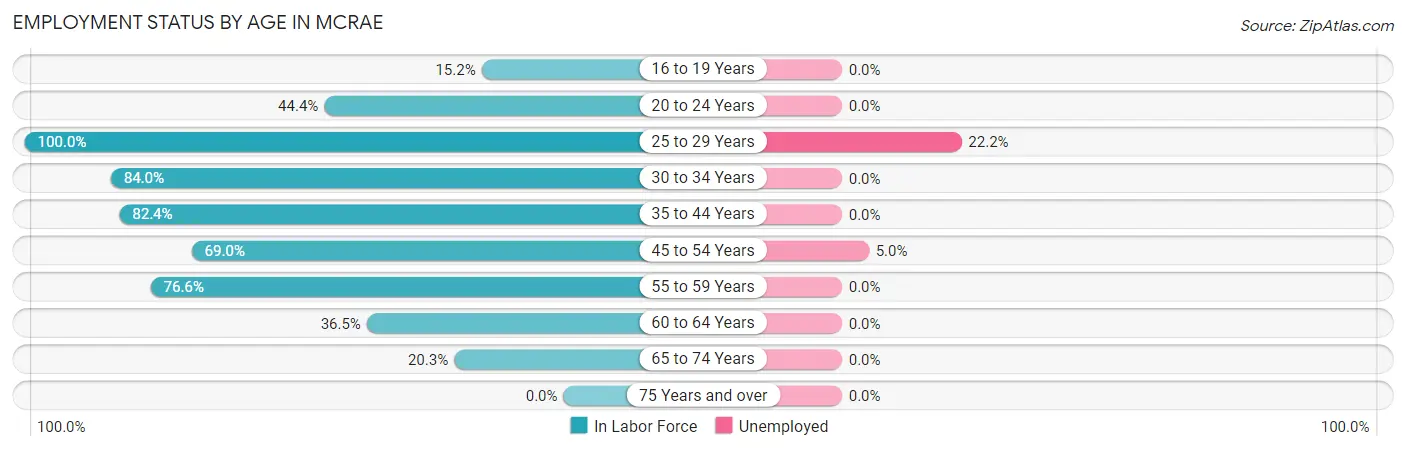
| Age Bracket | In Labor Force | Unemployed |
| 16 to 19 Years | 5 (15.2%) | 0 (0.0%) |
| 20 to 24 Years | 8 (44.4%) | 0 (0.0%) |
| 25 to 29 Years | 18 (100.0%) | 4 (22.2%) |
| 30 to 34 Years | 100 (84.0%) | 0 (0.0%) |
| 35 to 44 Years | 56 (82.4%) | 0 (0.0%) |
| 45 to 54 Years | 60 (69.0%) | 3 (5.0%) |
| 55 to 59 Years | 85 (76.6%) | 0 (0.0%) |
| 60 to 64 Years | 19 (36.5%) | 0 (0.0%) |
| 65 to 74 Years | 24 (20.3%) | 0 (0.0%) |
| 75 Years and over | 0 (0.0%) | 0 (0.0%) |
| Total | 375 (56.5%) | 7 (1.9%) |
Employment Status by Educational Attainment in McRae
According to labor force statistics for McRae, 74.3% of individuals (338) out of the total population between 25 and 64 years of age (455) are in the labor force, with 2.1% or 7 of them being unemployed. The group with the highest labor force participation rate are those with the educational attainment of college / associate degree, with 84.9% or 141 individuals in the labor force. Within the labor force, individuals with bachelor's degree or higher education have the highest percentage of unemployment, with 16.3% or 7 of them being unemployed.
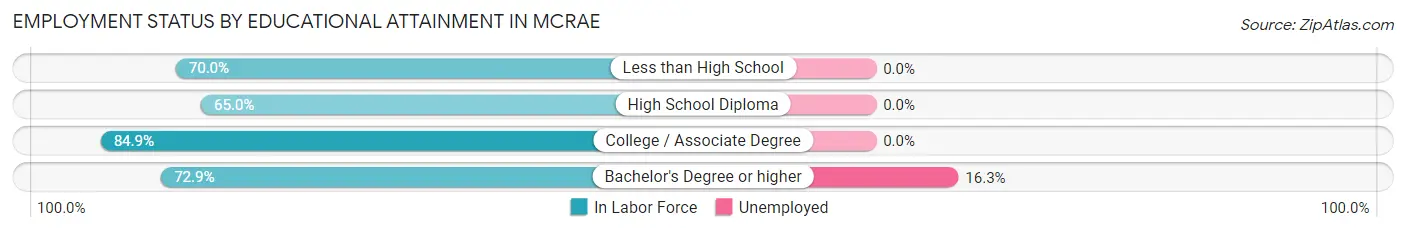
| Educational Attainment | In Labor Force | Unemployed |
| Less than High School | 63 (70.0%) | 0 (0.0%) |
| High School Diploma | 91 (65.0%) | 0 (0.0%) |
| College / Associate Degree | 141 (84.9%) | 0 (0.0%) |
| Bachelor's Degree or higher | 43 (72.9%) | 10 (16.3%) |
| Total | 338 (74.3%) | 10 (2.1%) |
Employment Occupations by Sex in McRae
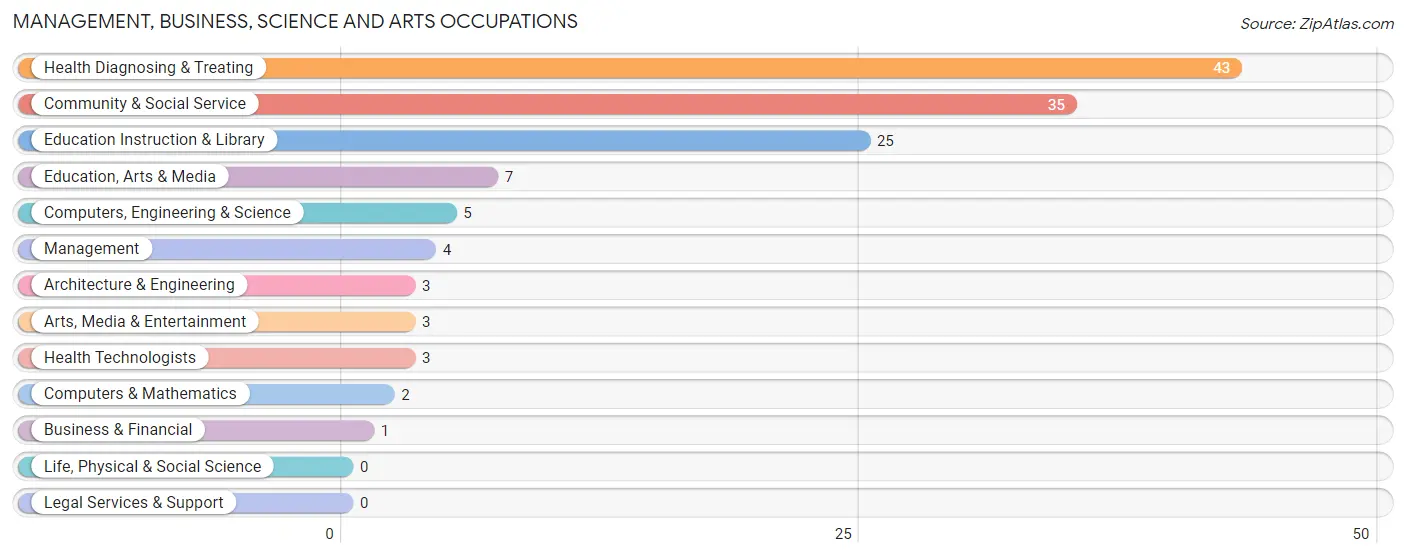
Management, Business, Science and Arts Occupations
The most common Management, Business, Science and Arts occupations in McRae are Health Diagnosing & Treating (43 | 11.7%), Community & Social Service (35 | 9.5%), Education Instruction & Library (25 | 6.8%), Education, Arts & Media (7 | 1.9%), and Computers, Engineering & Science (5 | 1.4%).
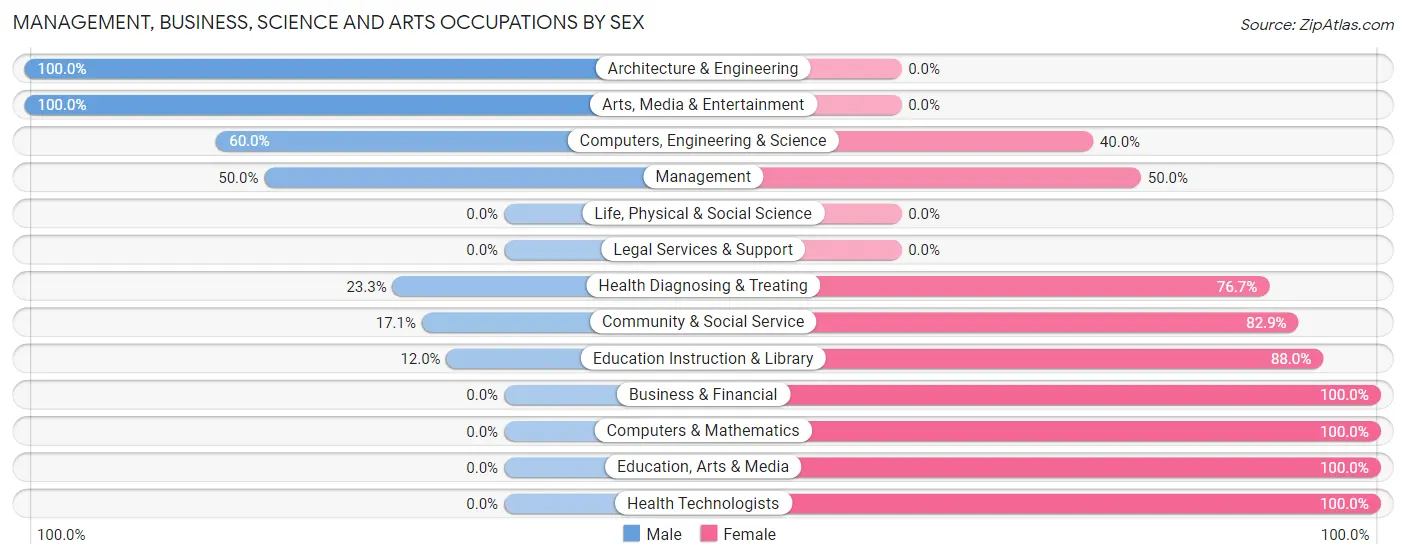
Management, Business, Science and Arts Occupations by Sex
Within the Management, Business, Science and Arts occupations in McRae, the most male-oriented occupations are Architecture & Engineering (100.0%), Arts, Media & Entertainment (100.0%), and Computers, Engineering & Science (60.0%), while the most female-oriented occupations are Business & Financial (100.0%), Computers & Mathematics (100.0%), and Education, Arts & Media (100.0%).
| Occupation | Male | Female |
| Management | 2 (50.0%) | 2 (50.0%) |
| Business & Financial | 0 (0.0%) | 1 (100.0%) |
| Computers, Engineering & Science | 3 (60.0%) | 2 (40.0%) |
| Computers & Mathematics | 0 (0.0%) | 2 (100.0%) |
| Architecture & Engineering | 3 (100.0%) | 0 (0.0%) |
| Life, Physical & Social Science | 0 (0.0%) | 0 (0.0%) |
| Community & Social Service | 6 (17.1%) | 29 (82.9%) |
| Education, Arts & Media | 0 (0.0%) | 7 (100.0%) |
| Legal Services & Support | 0 (0.0%) | 0 (0.0%) |
| Education Instruction & Library | 3 (12.0%) | 22 (88.0%) |
| Arts, Media & Entertainment | 3 (100.0%) | 0 (0.0%) |
| Health Diagnosing & Treating | 10 (23.3%) | 33 (76.7%) |
| Health Technologists | 0 (0.0%) | 3 (100.0%) |
| Total (Category) | 21 (23.9%) | 67 (76.1%) |
| Total (Overall) | 179 (48.6%) | 189 (51.4%) |
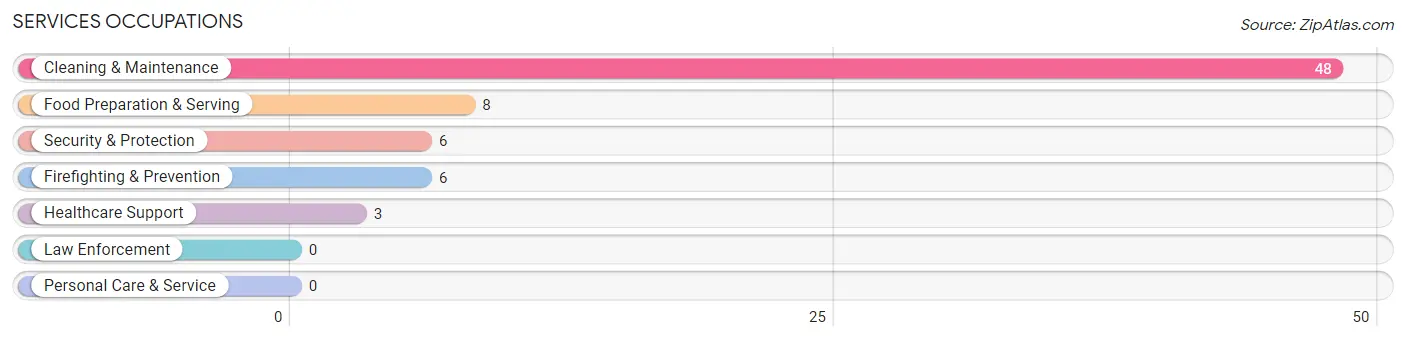
Services Occupations
The most common Services occupations in McRae are Cleaning & Maintenance (48 | 13.0%), Food Preparation & Serving (8 | 2.2%), Security & Protection (6 | 1.6%), Firefighting & Prevention (6 | 1.6%), and Healthcare Support (3 | 0.8%).
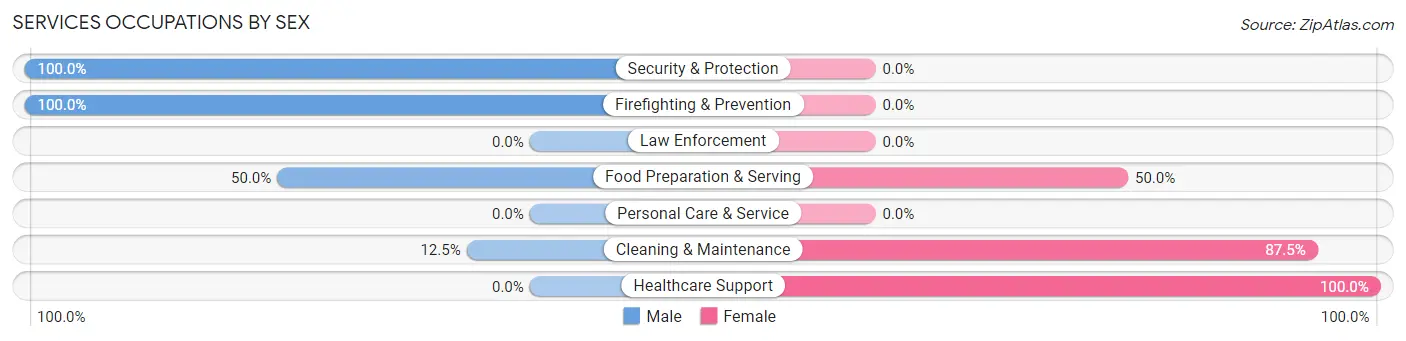
Services Occupations by Sex
Within the Services occupations in McRae, the most male-oriented occupations are Security & Protection (100.0%), Firefighting & Prevention (100.0%), and Food Preparation & Serving (50.0%), while the most female-oriented occupations are Healthcare Support (100.0%), Cleaning & Maintenance (87.5%), and Food Preparation & Serving (50.0%).
| Occupation | Male | Female |
| Healthcare Support | 0 (0.0%) | 3 (100.0%) |
| Security & Protection | 6 (100.0%) | 0 (0.0%) |
| Firefighting & Prevention | 6 (100.0%) | 0 (0.0%) |
| Law Enforcement | 0 (0.0%) | 0 (0.0%) |
| Food Preparation & Serving | 4 (50.0%) | 4 (50.0%) |
| Cleaning & Maintenance | 6 (12.5%) | 42 (87.5%) |
| Personal Care & Service | 0 (0.0%) | 0 (0.0%) |
| Total (Category) | 16 (24.6%) | 49 (75.4%) |
| Total (Overall) | 179 (48.6%) | 189 (51.4%) |
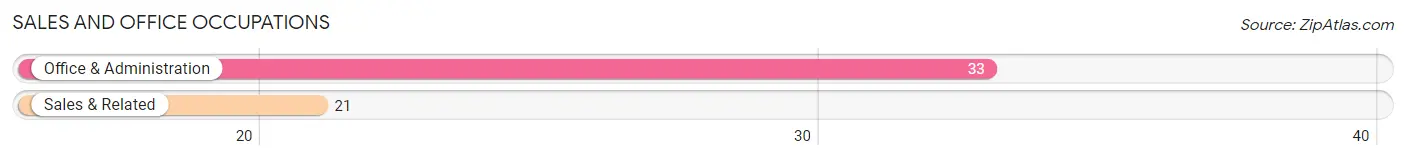
Sales and Office Occupations
The most common Sales and Office occupations in McRae are Office & Administration (33 | 9.0%), and Sales & Related (21 | 5.7%).
Sales and Office Occupations by Sex
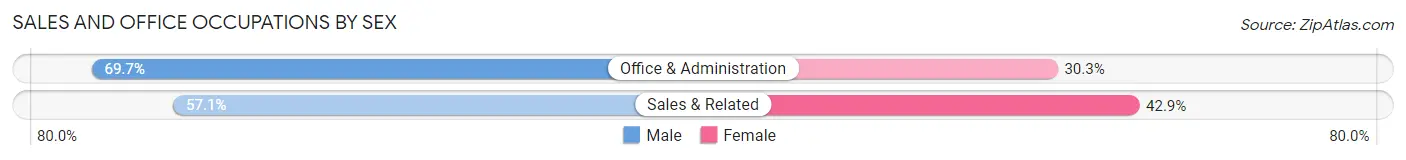
| Occupation | Male | Female |
| Sales & Related | 12 (57.1%) | 9 (42.9%) |
| Office & Administration | 23 (69.7%) | 10 (30.3%) |
| Total (Category) | 35 (64.8%) | 19 (35.2%) |
| Total (Overall) | 179 (48.6%) | 189 (51.4%) |
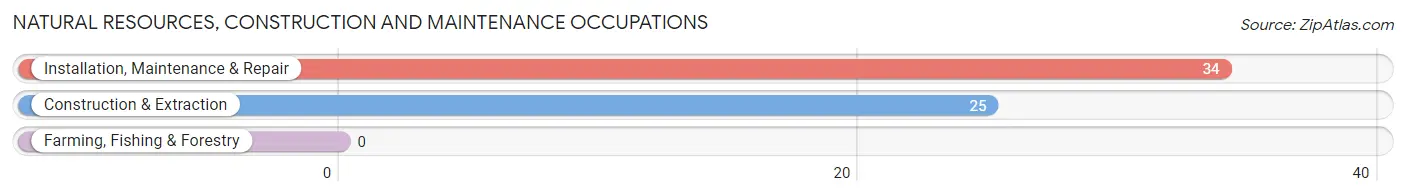
Natural Resources, Construction and Maintenance Occupations
The most common Natural Resources, Construction and Maintenance occupations in McRae are Installation, Maintenance & Repair (34 | 9.2%), and Construction & Extraction (25 | 6.8%).
Natural Resources, Construction and Maintenance Occupations by Sex
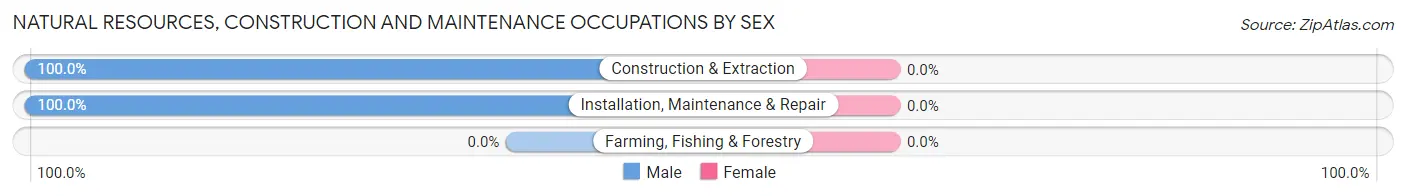
| Occupation | Male | Female |
| Farming, Fishing & Forestry | 0 (0.0%) | 0 (0.0%) |
| Construction & Extraction | 25 (100.0%) | 0 (0.0%) |
| Installation, Maintenance & Repair | 34 (100.0%) | 0 (0.0%) |
| Total (Category) | 59 (100.0%) | 0 (0.0%) |
| Total (Overall) | 179 (48.6%) | 189 (51.4%) |
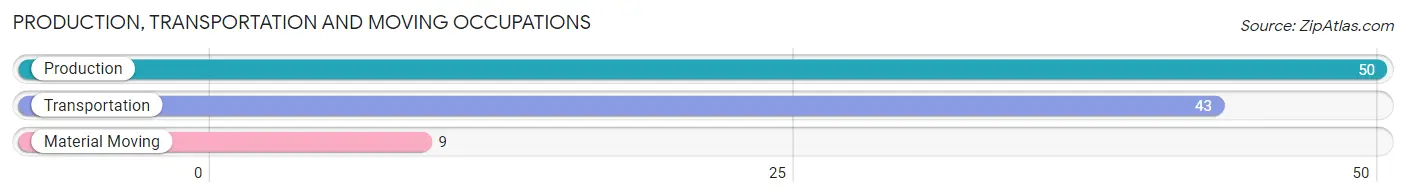
Production, Transportation and Moving Occupations
The most common Production, Transportation and Moving occupations in McRae are Production (50 | 13.6%), Transportation (43 | 11.7%), and Material Moving (9 | 2.5%).
Production, Transportation and Moving Occupations by Sex
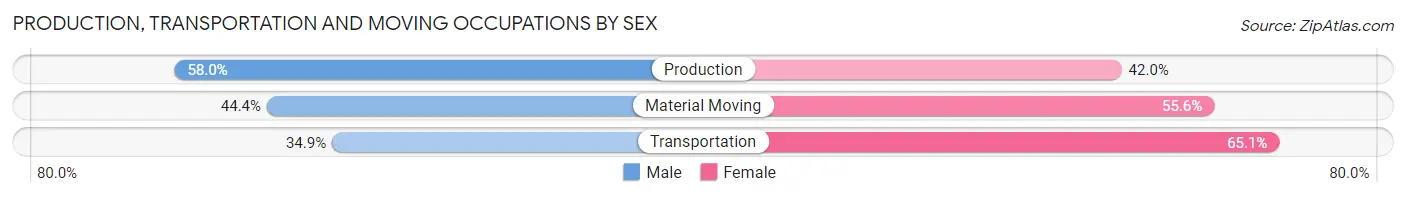
| Occupation | Male | Female |
| Production | 29 (58.0%) | 21 (42.0%) |
| Transportation | 15 (34.9%) | 28 (65.1%) |
| Material Moving | 4 (44.4%) | 5 (55.6%) |
| Total (Category) | 48 (47.1%) | 54 (52.9%) |
| Total (Overall) | 179 (48.6%) | 189 (51.4%) |
Employment Industries by Sex in McRae
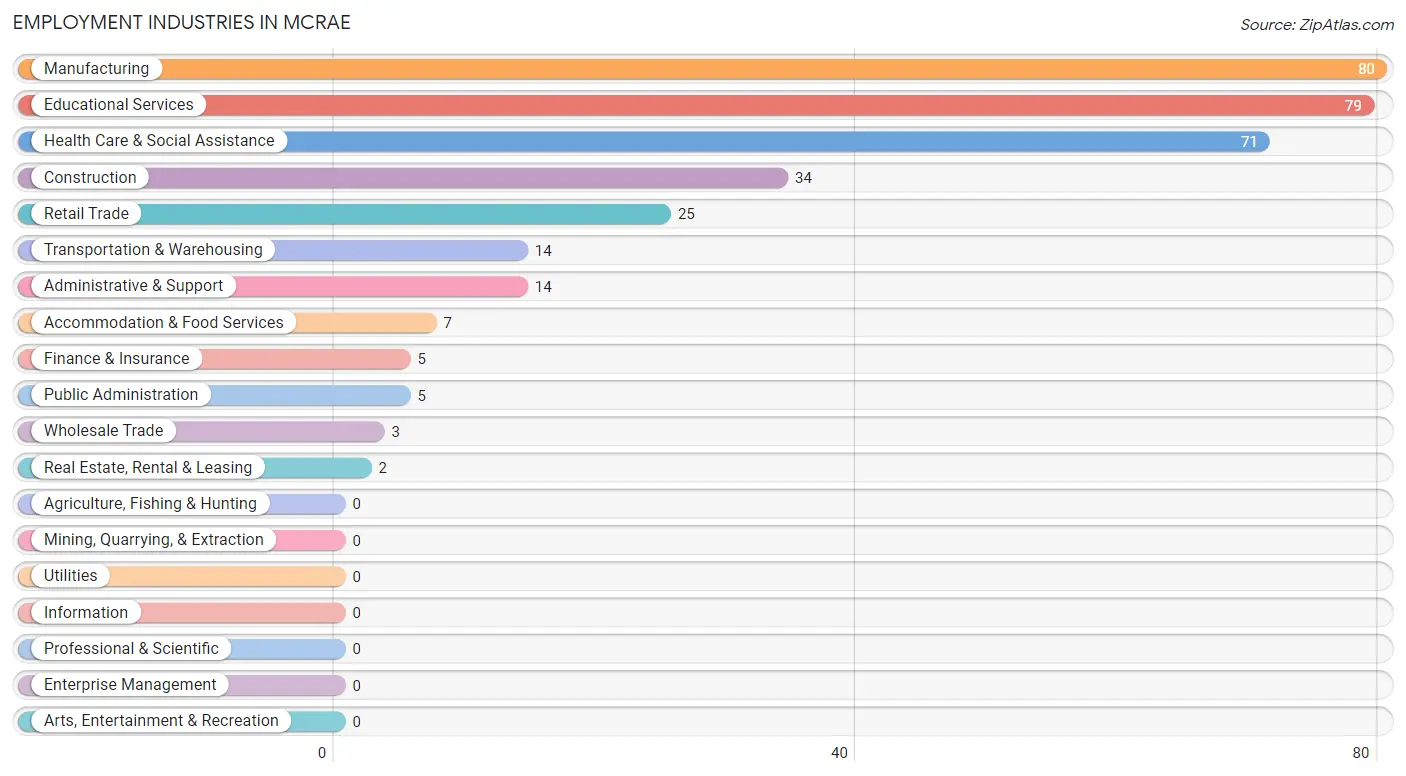
Employment Industries in McRae
The major employment industries in McRae include Manufacturing (80 | 21.7%), Educational Services (79 | 21.5%), Health Care & Social Assistance (71 | 19.3%), Construction (34 | 9.2%), and Retail Trade (25 | 6.8%).
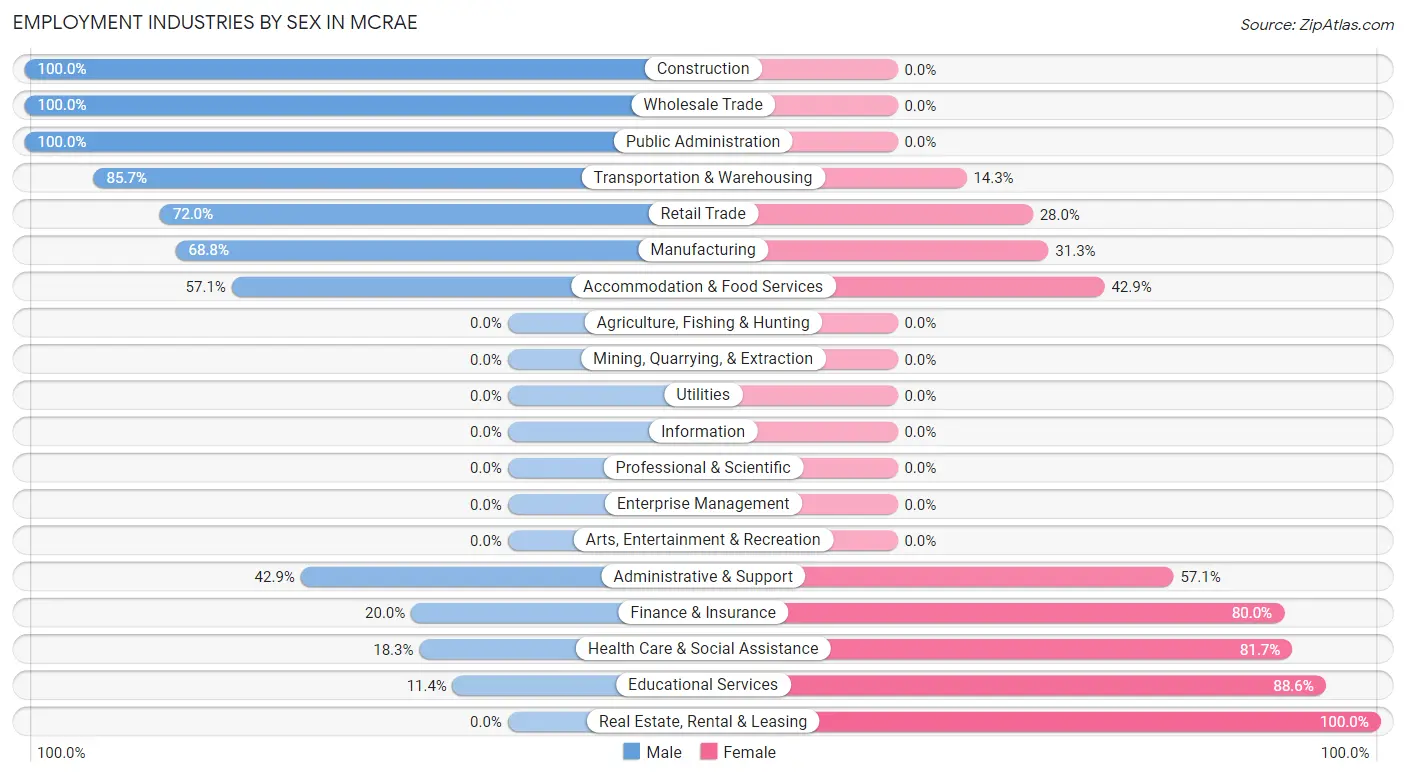
Employment Industries by Sex in McRae
The McRae industries that see more men than women are Construction (100.0%), Wholesale Trade (100.0%), and Public Administration (100.0%), whereas the industries that tend to have a higher number of women are Real Estate, Rental & Leasing (100.0%), Educational Services (88.6%), and Health Care & Social Assistance (81.7%).
| Industry | Male | Female |
| Agriculture, Fishing & Hunting | 0 (0.0%) | 0 (0.0%) |
| Mining, Quarrying, & Extraction | 0 (0.0%) | 0 (0.0%) |
| Construction | 34 (100.0%) | 0 (0.0%) |
| Manufacturing | 55 (68.8%) | 25 (31.2%) |
| Wholesale Trade | 3 (100.0%) | 0 (0.0%) |
| Retail Trade | 18 (72.0%) | 7 (28.0%) |
| Transportation & Warehousing | 12 (85.7%) | 2 (14.3%) |
| Utilities | 0 (0.0%) | 0 (0.0%) |
| Information | 0 (0.0%) | 0 (0.0%) |
| Finance & Insurance | 1 (20.0%) | 4 (80.0%) |
| Real Estate, Rental & Leasing | 0 (0.0%) | 2 (100.0%) |
| Professional & Scientific | 0 (0.0%) | 0 (0.0%) |
| Enterprise Management | 0 (0.0%) | 0 (0.0%) |
| Administrative & Support | 6 (42.9%) | 8 (57.1%) |
| Educational Services | 9 (11.4%) | 70 (88.6%) |
| Health Care & Social Assistance | 13 (18.3%) | 58 (81.7%) |
| Arts, Entertainment & Recreation | 0 (0.0%) | 0 (0.0%) |
| Accommodation & Food Services | 4 (57.1%) | 3 (42.9%) |
| Public Administration | 5 (100.0%) | 0 (0.0%) |
| Total | 179 (48.6%) | 189 (51.4%) |
Education in McRae
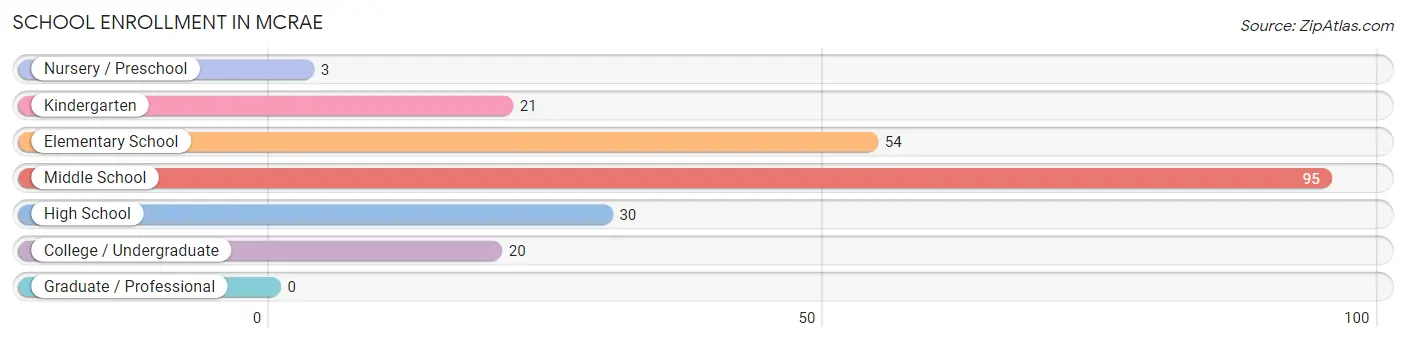
School Enrollment in McRae
The most common levels of schooling among the 223 students in McRae are middle school (95 | 42.6%), elementary school (54 | 24.2%), and high school (30 | 13.5%).
| School Level | # Students | % Students |
| Nursery / Preschool | 3 | 1.3% |
| Kindergarten | 21 | 9.4% |
| Elementary School | 54 | 24.2% |
| Middle School | 95 | 42.6% |
| High School | 30 | 13.5% |
| College / Undergraduate | 20 | 9.0% |
| Graduate / Professional | 0 | 0.0% |
| Total | 223 | 100.0% |
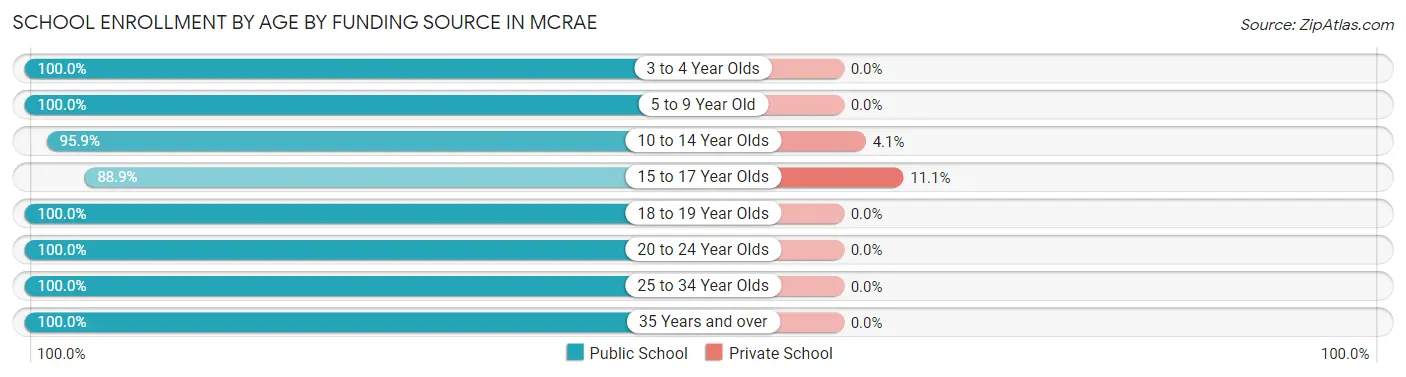
School Enrollment by Age by Funding Source in McRae
Out of a total of 223 students who are enrolled in schools in McRae, 8 (3.6%) attend a private institution, while the remaining 215 (96.4%) are enrolled in public schools. The age group of 15 to 17 year olds has the highest likelihood of being enrolled in private schools, with 3 (11.1% in the age bracket) enrolled. Conversely, the age group of 3 to 4 year olds has the lowest likelihood of being enrolled in a private school, with 3 (100.0% in the age bracket) attending a public institution.
| Age Bracket | Public School | Private School |
| 3 to 4 Year Olds | 3 (100.0%) | 0 (0.0%) |
| 5 to 9 Year Old | 48 (100.0%) | 0 (0.0%) |
| 10 to 14 Year Olds | 117 (95.9%) | 5 (4.1%) |
| 15 to 17 Year Olds | 24 (88.9%) | 3 (11.1%) |
| 18 to 19 Year Olds | 1 (100.0%) | 0 (0.0%) |
| 20 to 24 Year Olds | 2 (100.0%) | 0 (0.0%) |
| 25 to 34 Year Olds | 17 (100.0%) | 0 (0.0%) |
| 35 Years and over | 3 (100.0%) | 0 (0.0%) |
| Total | 215 (96.4%) | 8 (3.6%) |
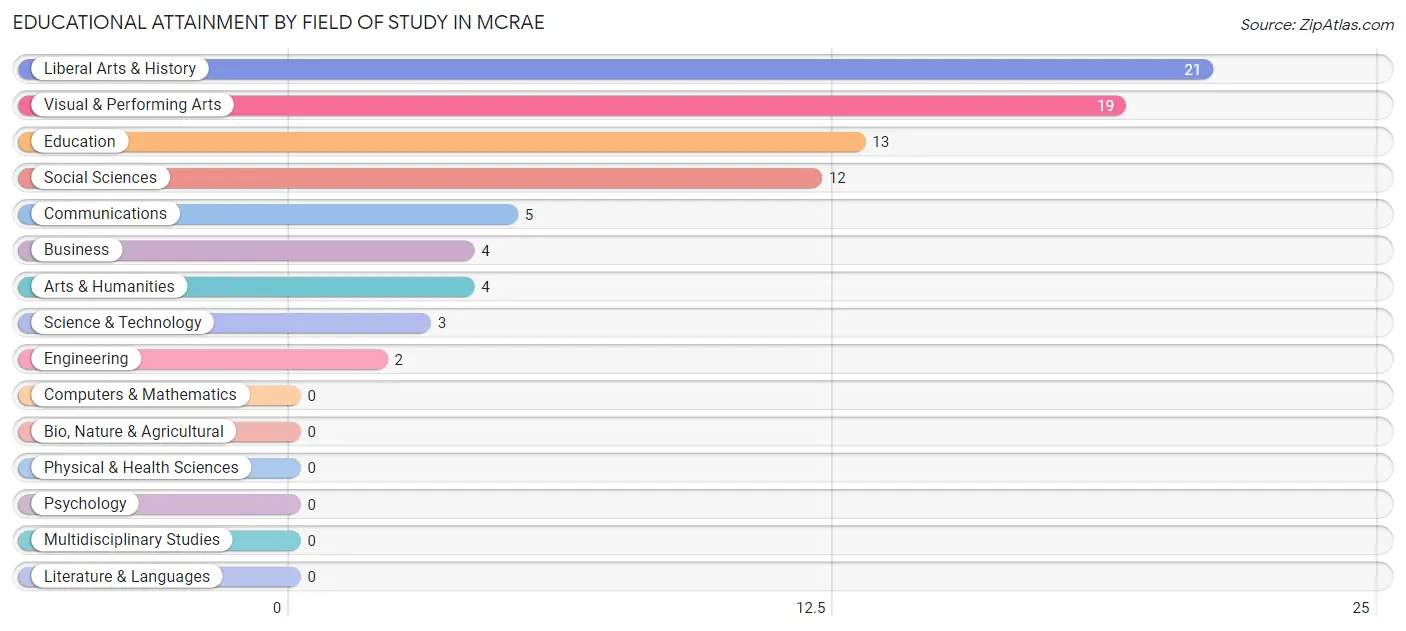
Educational Attainment by Field of Study in McRae
Liberal arts & history (21 | 25.3%), visual & performing arts (19 | 22.9%), education (13 | 15.7%), social sciences (12 | 14.5%), and communications (5 | 6.0%) are the most common fields of study among 83 individuals in McRae who have obtained a bachelor's degree or higher.
| Field of Study | # Graduates | % Graduates |
| Computers & Mathematics | 0 | 0.0% |
| Bio, Nature & Agricultural | 0 | 0.0% |
| Physical & Health Sciences | 0 | 0.0% |
| Psychology | 0 | 0.0% |
| Social Sciences | 12 | 14.5% |
| Engineering | 2 | 2.4% |
| Multidisciplinary Studies | 0 | 0.0% |
| Science & Technology | 3 | 3.6% |
| Business | 4 | 4.8% |
| Education | 13 | 15.7% |
| Literature & Languages | 0 | 0.0% |
| Liberal Arts & History | 21 | 25.3% |
| Visual & Performing Arts | 19 | 22.9% |
| Communications | 5 | 6.0% |
| Arts & Humanities | 4 | 4.8% |
| Total | 83 | 100.0% |
Transportation & Commute in McRae
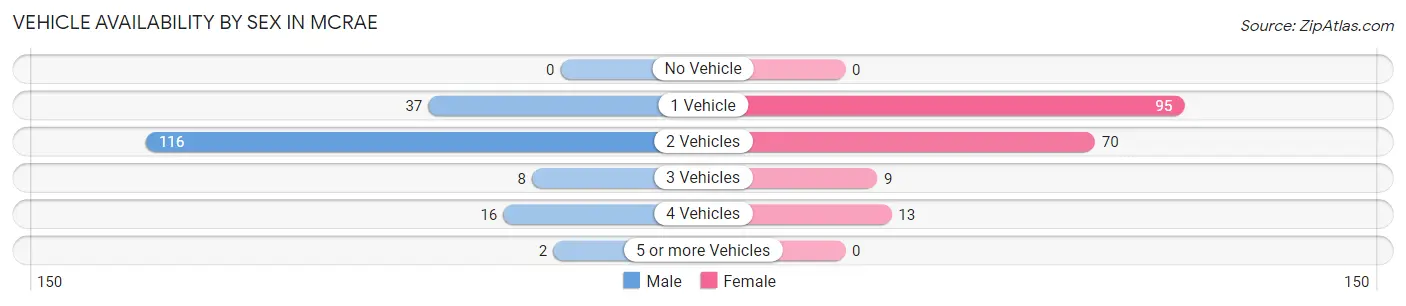
Vehicle Availability by Sex in McRae
The most prevalent vehicle ownership categories in McRae are males with 2 vehicles (116, accounting for 64.8%) and females with 2 vehicles (70, making up 62.0%).
| Vehicles Available | Male | Female |
| No Vehicle | 0 (0.0%) | 0 (0.0%) |
| 1 Vehicle | 37 (20.7%) | 95 (50.8%) |
| 2 Vehicles | 116 (64.8%) | 70 (37.4%) |
| 3 Vehicles | 8 (4.5%) | 9 (4.8%) |
| 4 Vehicles | 16 (8.9%) | 13 (7.0%) |
| 5 or more Vehicles | 2 (1.1%) | 0 (0.0%) |
| Total | 179 (100.0%) | 187 (100.0%) |
Commute Time in McRae
The most frequently occuring commute durations in McRae are 45 to 59 minutes (78 commuters, 21.5%), 30 to 34 minutes (61 commuters, 16.8%), and 15 to 19 minutes (58 commuters, 16.0%).
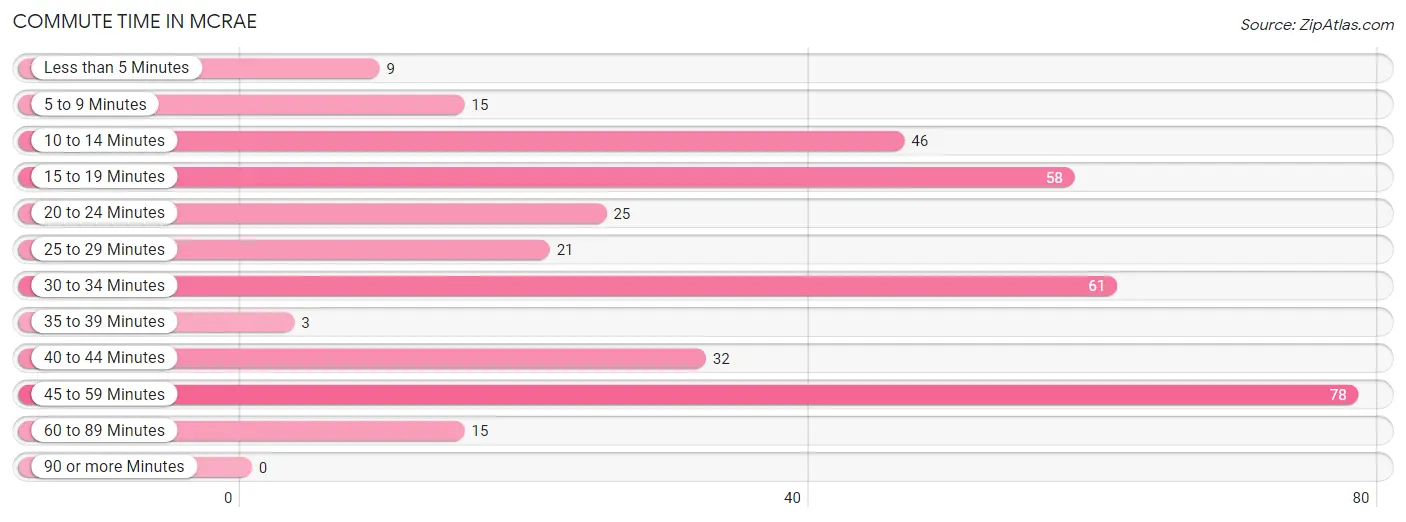
| Commute Time | # Commuters | % Commuters |
| Less than 5 Minutes | 9 | 2.5% |
| 5 to 9 Minutes | 15 | 4.1% |
| 10 to 14 Minutes | 46 | 12.7% |
| 15 to 19 Minutes | 58 | 16.0% |
| 20 to 24 Minutes | 25 | 6.9% |
| 25 to 29 Minutes | 21 | 5.8% |
| 30 to 34 Minutes | 61 | 16.8% |
| 35 to 39 Minutes | 3 | 0.8% |
| 40 to 44 Minutes | 32 | 8.8% |
| 45 to 59 Minutes | 78 | 21.5% |
| 60 to 89 Minutes | 15 | 4.1% |
| 90 or more Minutes | 0 | 0.0% |
Commute Time by Sex in McRae
The most common commute times in McRae are 45 to 59 minutes (51 commuters, 29.0%) for males and 15 to 19 minutes (40 commuters, 21.4%) for females.
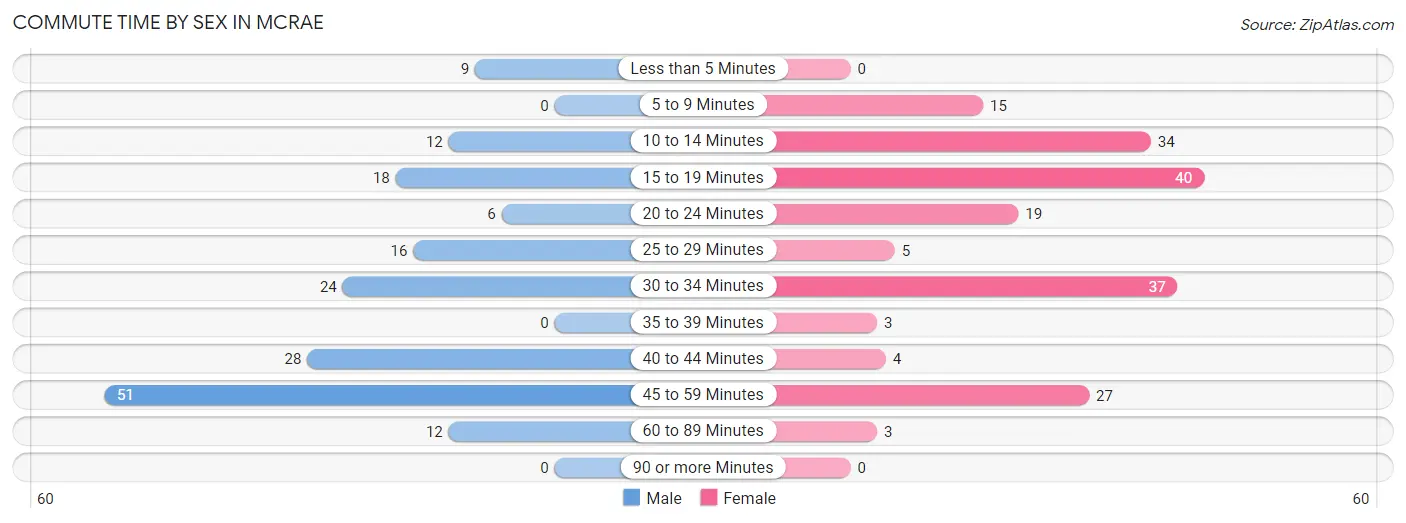
| Commute Time | Male | Female |
| Less than 5 Minutes | 9 (5.1%) | 0 (0.0%) |
| 5 to 9 Minutes | 0 (0.0%) | 15 (8.0%) |
| 10 to 14 Minutes | 12 (6.8%) | 34 (18.2%) |
| 15 to 19 Minutes | 18 (10.2%) | 40 (21.4%) |
| 20 to 24 Minutes | 6 (3.4%) | 19 (10.2%) |
| 25 to 29 Minutes | 16 (9.1%) | 5 (2.7%) |
| 30 to 34 Minutes | 24 (13.6%) | 37 (19.8%) |
| 35 to 39 Minutes | 0 (0.0%) | 3 (1.6%) |
| 40 to 44 Minutes | 28 (15.9%) | 4 (2.1%) |
| 45 to 59 Minutes | 51 (29.0%) | 27 (14.4%) |
| 60 to 89 Minutes | 12 (6.8%) | 3 (1.6%) |
| 90 or more Minutes | 0 (0.0%) | 0 (0.0%) |
Time of Departure to Work by Sex in McRae
The most frequent times of departure to work in McRae are 6:00 AM to 6:29 AM (43, 24.4%) for males and 6:00 AM to 6:29 AM (78, 41.7%) for females.
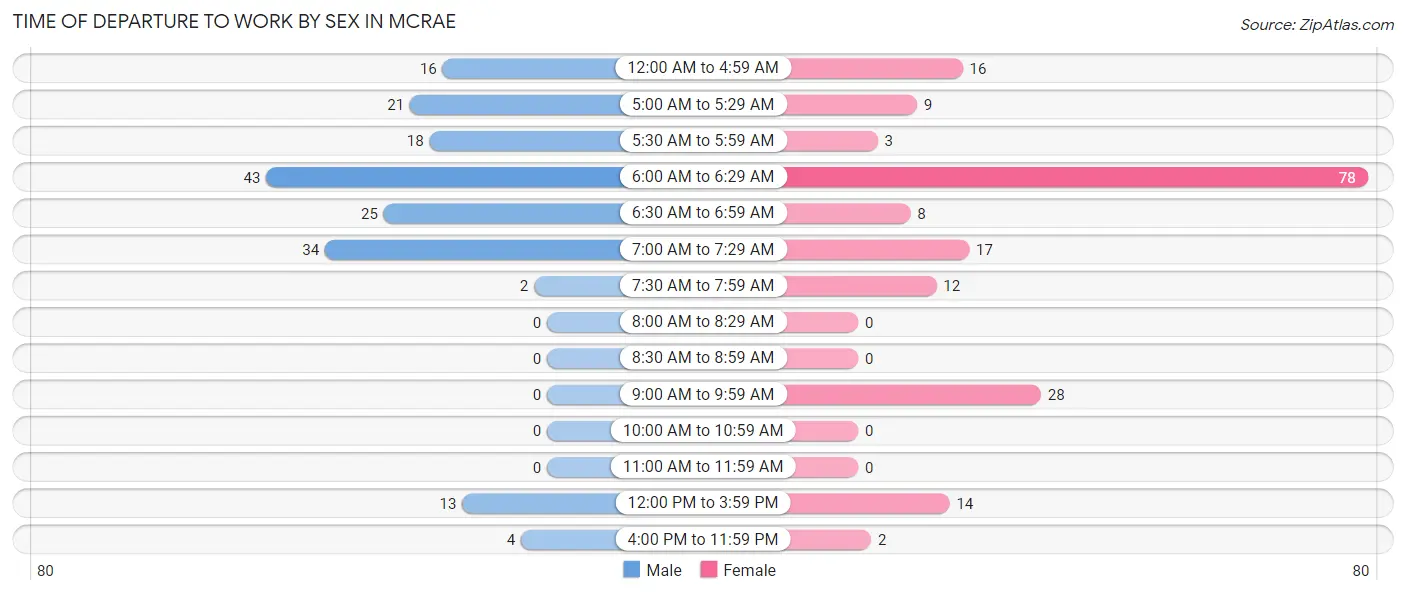
| Time of Departure | Male | Female |
| 12:00 AM to 4:59 AM | 16 (9.1%) | 16 (8.6%) |
| 5:00 AM to 5:29 AM | 21 (11.9%) | 9 (4.8%) |
| 5:30 AM to 5:59 AM | 18 (10.2%) | 3 (1.6%) |
| 6:00 AM to 6:29 AM | 43 (24.4%) | 78 (41.7%) |
| 6:30 AM to 6:59 AM | 25 (14.2%) | 8 (4.3%) |
| 7:00 AM to 7:29 AM | 34 (19.3%) | 17 (9.1%) |
| 7:30 AM to 7:59 AM | 2 (1.1%) | 12 (6.4%) |
| 8:00 AM to 8:29 AM | 0 (0.0%) | 0 (0.0%) |
| 8:30 AM to 8:59 AM | 0 (0.0%) | 0 (0.0%) |
| 9:00 AM to 9:59 AM | 0 (0.0%) | 28 (15.0%) |
| 10:00 AM to 10:59 AM | 0 (0.0%) | 0 (0.0%) |
| 11:00 AM to 11:59 AM | 0 (0.0%) | 0 (0.0%) |
| 12:00 PM to 3:59 PM | 13 (7.4%) | 14 (7.5%) |
| 4:00 PM to 11:59 PM | 4 (2.3%) | 2 (1.1%) |
| Total | 176 (100.0%) | 187 (100.0%) |
Housing Occupancy in McRae
Occupancy by Ownership in McRae
Of the total 388 dwellings in McRae, owner-occupied units account for 219 (56.4%), while renter-occupied units make up 169 (43.6%).
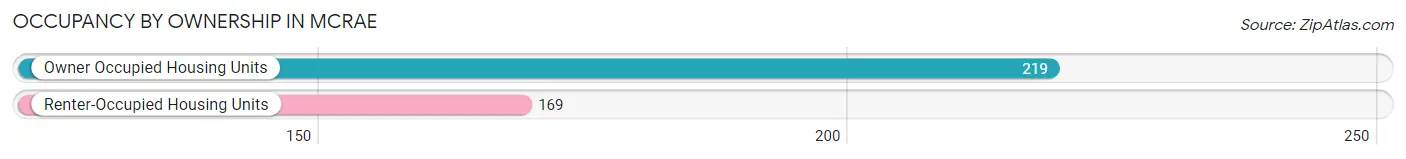
| Occupancy | # Housing Units | % Housing Units |
| Owner Occupied Housing Units | 219 | 56.4% |
| Renter-Occupied Housing Units | 169 | 43.6% |
| Total Occupied Housing Units | 388 | 100.0% |
Occupancy by Household Size in McRae
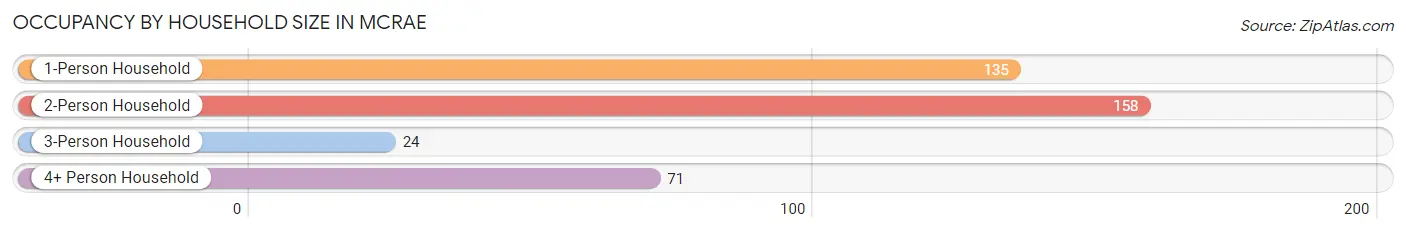
| Household Size | # Housing Units | % Housing Units |
| 1-Person Household | 135 | 34.8% |
| 2-Person Household | 158 | 40.7% |
| 3-Person Household | 24 | 6.2% |
| 4+ Person Household | 71 | 18.3% |
| Total Housing Units | 388 | 100.0% |
Occupancy by Ownership by Household Size in McRae
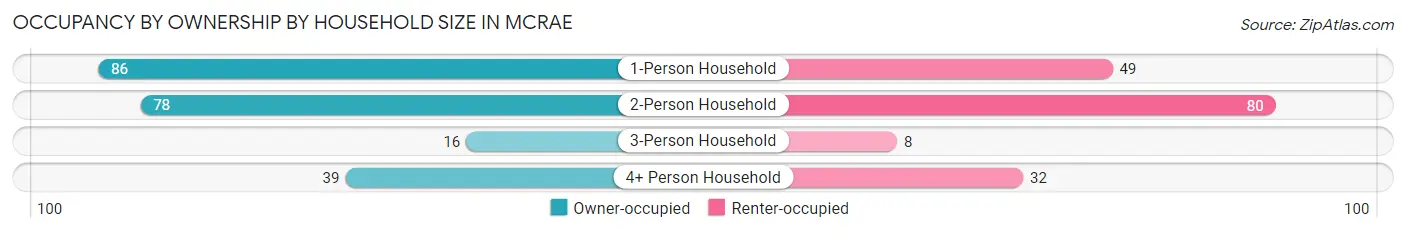
| Household Size | Owner-occupied | Renter-occupied |
| 1-Person Household | 86 (63.7%) | 49 (36.3%) |
| 2-Person Household | 78 (49.4%) | 80 (50.6%) |
| 3-Person Household | 16 (66.7%) | 8 (33.3%) |
| 4+ Person Household | 39 (54.9%) | 32 (45.1%) |
| Total Housing Units | 219 (56.4%) | 169 (43.6%) |
Occupancy by Educational Attainment in McRae
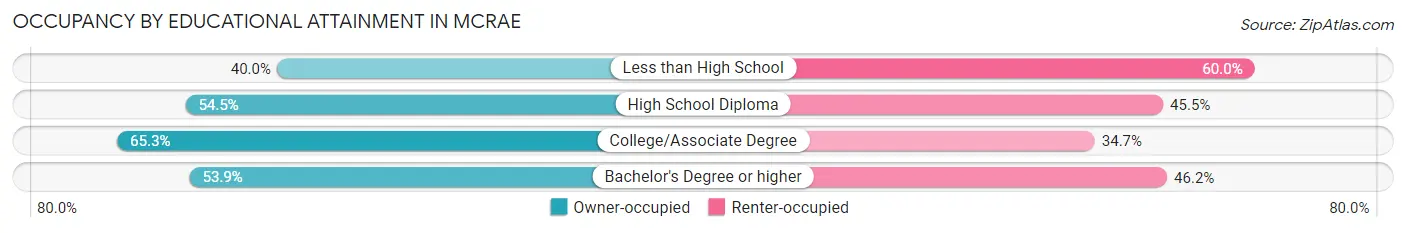
| Household Size | Owner-occupied | Renter-occupied |
| Less than High School | 22 (40.0%) | 33 (60.0%) |
| High School Diploma | 73 (54.5%) | 61 (45.5%) |
| College/Associate Degree | 96 (65.3%) | 51 (34.7%) |
| Bachelor's Degree or higher | 28 (53.8%) | 24 (46.2%) |
Occupancy by Age of Householder in McRae
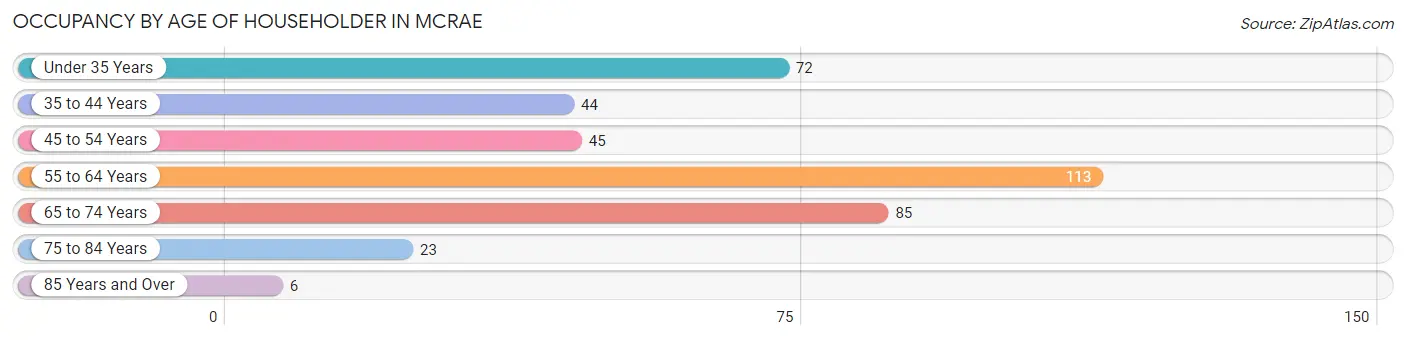
| Age Bracket | # Households | % Households |
| Under 35 Years | 72 | 18.6% |
| 35 to 44 Years | 44 | 11.3% |
| 45 to 54 Years | 45 | 11.6% |
| 55 to 64 Years | 113 | 29.1% |
| 65 to 74 Years | 85 | 21.9% |
| 75 to 84 Years | 23 | 5.9% |
| 85 Years and Over | 6 | 1.5% |
| Total | 388 | 100.0% |
Housing Finances in McRae
Median Income by Occupancy in McRae
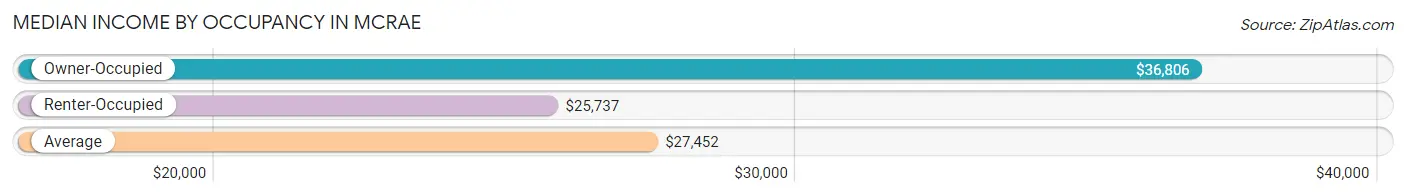
| Occupancy Type | # Households | Median Income |
| Owner-Occupied | 219 (56.4%) | $36,806 |
| Renter-Occupied | 169 (43.6%) | $25,737 |
| Average | 388 (100.0%) | $27,452 |
Occupancy by Householder Income Bracket in McRae
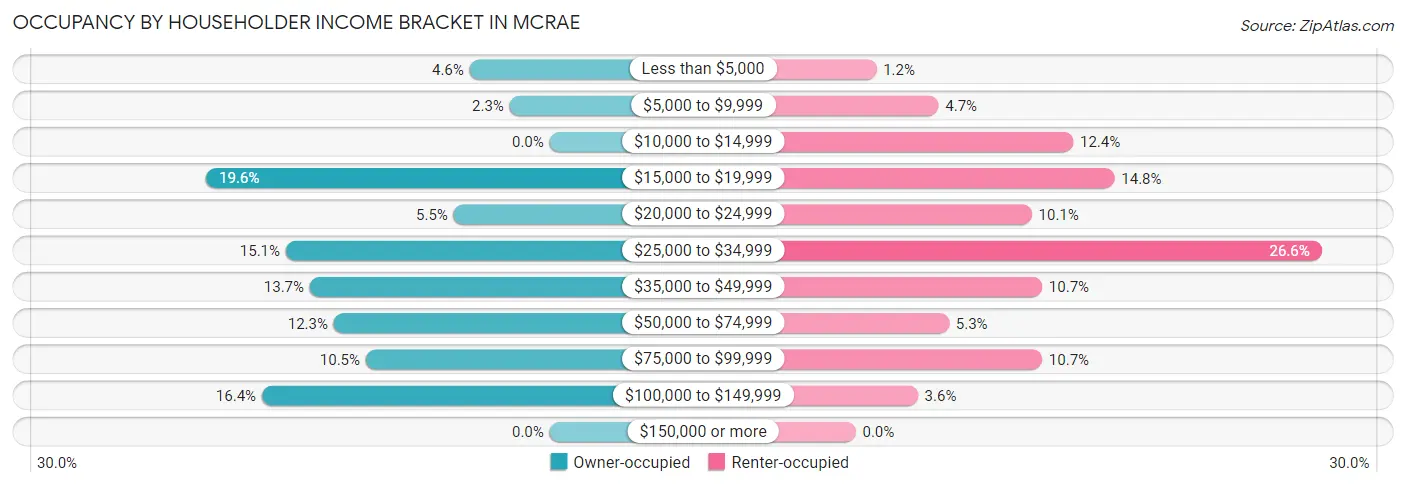
| Income Bracket | Owner-occupied | Renter-occupied |
| Less than $5,000 | 10 (4.6%) | 2 (1.2%) |
| $5,000 to $9,999 | 5 (2.3%) | 8 (4.7%) |
| $10,000 to $14,999 | 0 (0.0%) | 21 (12.4%) |
| $15,000 to $19,999 | 43 (19.6%) | 25 (14.8%) |
| $20,000 to $24,999 | 12 (5.5%) | 17 (10.1%) |
| $25,000 to $34,999 | 33 (15.1%) | 45 (26.6%) |
| $35,000 to $49,999 | 30 (13.7%) | 18 (10.6%) |
| $50,000 to $74,999 | 27 (12.3%) | 9 (5.3%) |
| $75,000 to $99,999 | 23 (10.5%) | 18 (10.6%) |
| $100,000 to $149,999 | 36 (16.4%) | 6 (3.5%) |
| $150,000 or more | 0 (0.0%) | 0 (0.0%) |
| Total | 219 (100.0%) | 169 (100.0%) |
Monthly Housing Cost Tiers in McRae
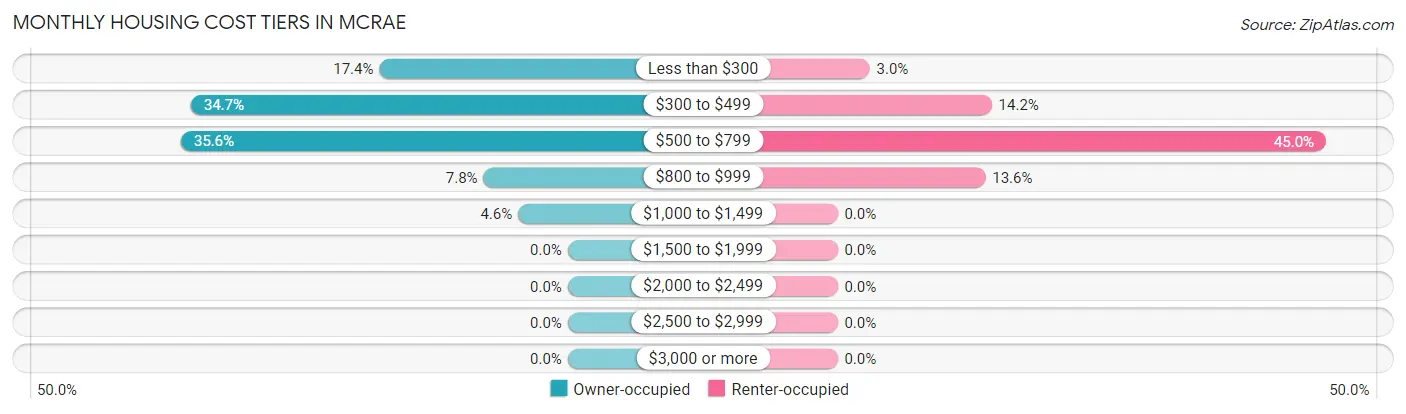
| Monthly Cost | Owner-occupied | Renter-occupied |
| Less than $300 | 38 (17.3%) | 5 (3.0%) |
| $300 to $499 | 76 (34.7%) | 24 (14.2%) |
| $500 to $799 | 78 (35.6%) | 76 (45.0%) |
| $800 to $999 | 17 (7.8%) | 23 (13.6%) |
| $1,000 to $1,499 | 10 (4.6%) | 0 (0.0%) |
| $1,500 to $1,999 | 0 (0.0%) | 0 (0.0%) |
| $2,000 to $2,499 | 0 (0.0%) | 0 (0.0%) |
| $2,500 to $2,999 | 0 (0.0%) | 0 (0.0%) |
| $3,000 or more | 0 (0.0%) | 0 (0.0%) |
| Total | 219 (100.0%) | 169 (100.0%) |
Physical Housing Characteristics in McRae
Housing Structures in McRae
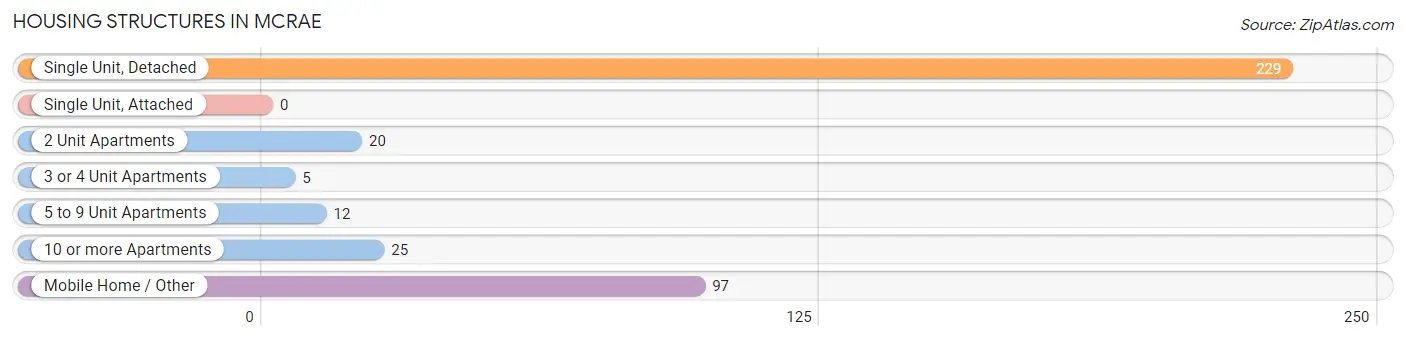
| Structure Type | # Housing Units | % Housing Units |
| Single Unit, Detached | 229 | 59.0% |
| Single Unit, Attached | 0 | 0.0% |
| 2 Unit Apartments | 20 | 5.1% |
| 3 or 4 Unit Apartments | 5 | 1.3% |
| 5 to 9 Unit Apartments | 12 | 3.1% |
| 10 or more Apartments | 25 | 6.4% |
| Mobile Home / Other | 97 | 25.0% |
| Total | 388 | 100.0% |
Housing Structures by Occupancy in McRae
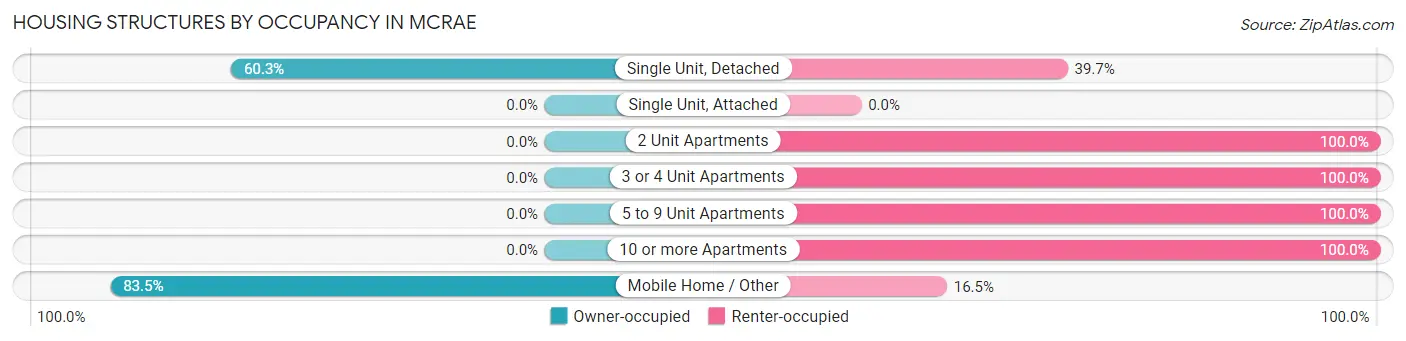
| Structure Type | Owner-occupied | Renter-occupied |
| Single Unit, Detached | 138 (60.3%) | 91 (39.7%) |
| Single Unit, Attached | 0 (0.0%) | 0 (0.0%) |
| 2 Unit Apartments | 0 (0.0%) | 20 (100.0%) |
| 3 or 4 Unit Apartments | 0 (0.0%) | 5 (100.0%) |
| 5 to 9 Unit Apartments | 0 (0.0%) | 12 (100.0%) |
| 10 or more Apartments | 0 (0.0%) | 25 (100.0%) |
| Mobile Home / Other | 81 (83.5%) | 16 (16.5%) |
| Total | 219 (56.4%) | 169 (43.6%) |
Housing Structures by Number of Rooms in McRae
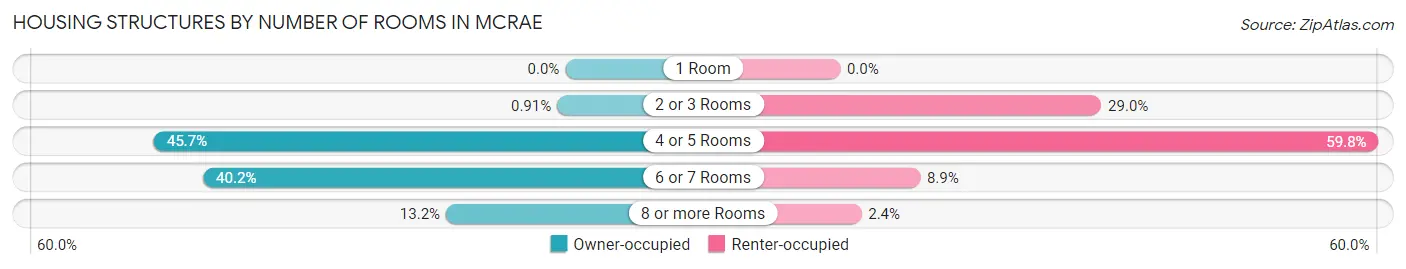
| Number of Rooms | Owner-occupied | Renter-occupied |
| 1 Room | 0 (0.0%) | 0 (0.0%) |
| 2 or 3 Rooms | 2 (0.9%) | 49 (29.0%) |
| 4 or 5 Rooms | 100 (45.7%) | 101 (59.8%) |
| 6 or 7 Rooms | 88 (40.2%) | 15 (8.9%) |
| 8 or more Rooms | 29 (13.2%) | 4 (2.4%) |
| Total | 219 (100.0%) | 169 (100.0%) |
Housing Structure by Heating Type in McRae
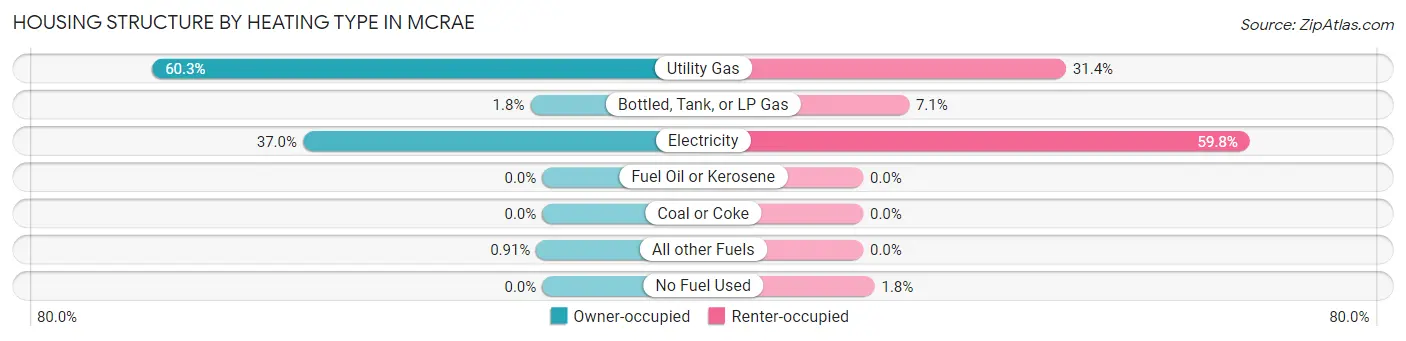
| Heating Type | Owner-occupied | Renter-occupied |
| Utility Gas | 132 (60.3%) | 53 (31.4%) |
| Bottled, Tank, or LP Gas | 4 (1.8%) | 12 (7.1%) |
| Electricity | 81 (37.0%) | 101 (59.8%) |
| Fuel Oil or Kerosene | 0 (0.0%) | 0 (0.0%) |
| Coal or Coke | 0 (0.0%) | 0 (0.0%) |
| All other Fuels | 2 (0.9%) | 0 (0.0%) |
| No Fuel Used | 0 (0.0%) | 3 (1.8%) |
| Total | 219 (100.0%) | 169 (100.0%) |
Household Vehicle Usage in McRae
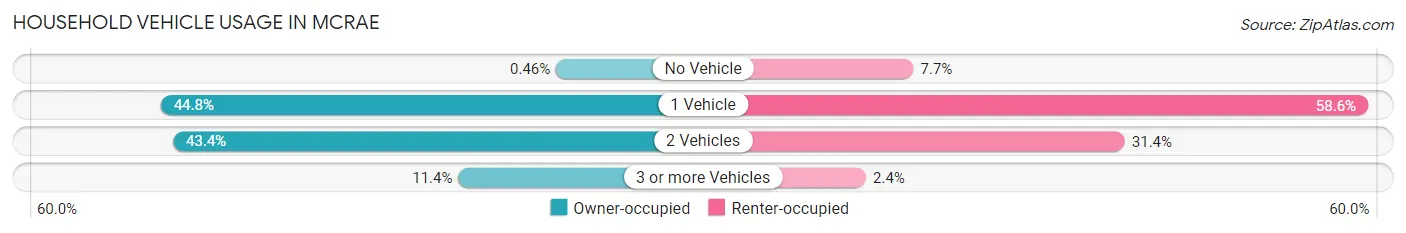
| Vehicles per Household | Owner-occupied | Renter-occupied |
| No Vehicle | 1 (0.5%) | 13 (7.7%) |
| 1 Vehicle | 98 (44.8%) | 99 (58.6%) |
| 2 Vehicles | 95 (43.4%) | 53 (31.4%) |
| 3 or more Vehicles | 25 (11.4%) | 4 (2.4%) |
| Total | 219 (100.0%) | 169 (100.0%) |
Real Estate & Mortgages in McRae
Real Estate and Mortgage Overview in McRae
| Characteristic | Without Mortgage | With Mortgage |
| Housing Units | 125 | 94 |
| Median Property Value | - | - |
| Median Household Income | $43,125 | $0 |
| Monthly Housing Costs | $349 | $0 |
| Real Estate Taxes | $246 | $14 |
Property Value by Mortgage Status in McRae
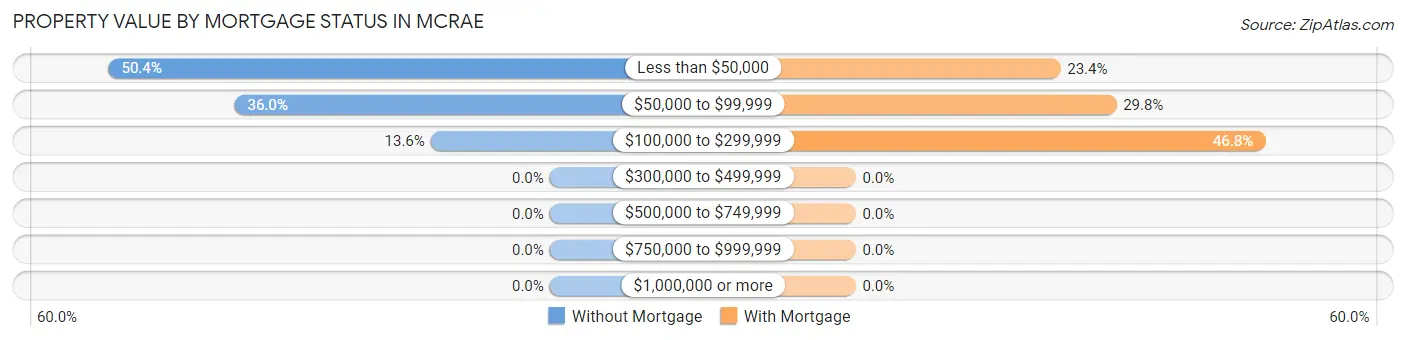
| Property Value | Without Mortgage | With Mortgage |
| Less than $50,000 | 63 (50.4%) | 22 (23.4%) |
| $50,000 to $99,999 | 45 (36.0%) | 28 (29.8%) |
| $100,000 to $299,999 | 17 (13.6%) | 44 (46.8%) |
| $300,000 to $499,999 | 0 (0.0%) | 0 (0.0%) |
| $500,000 to $749,999 | 0 (0.0%) | 0 (0.0%) |
| $750,000 to $999,999 | 0 (0.0%) | 0 (0.0%) |
| $1,000,000 or more | 0 (0.0%) | 0 (0.0%) |
| Total | 125 (100.0%) | 94 (100.0%) |
Household Income by Mortgage Status in McRae
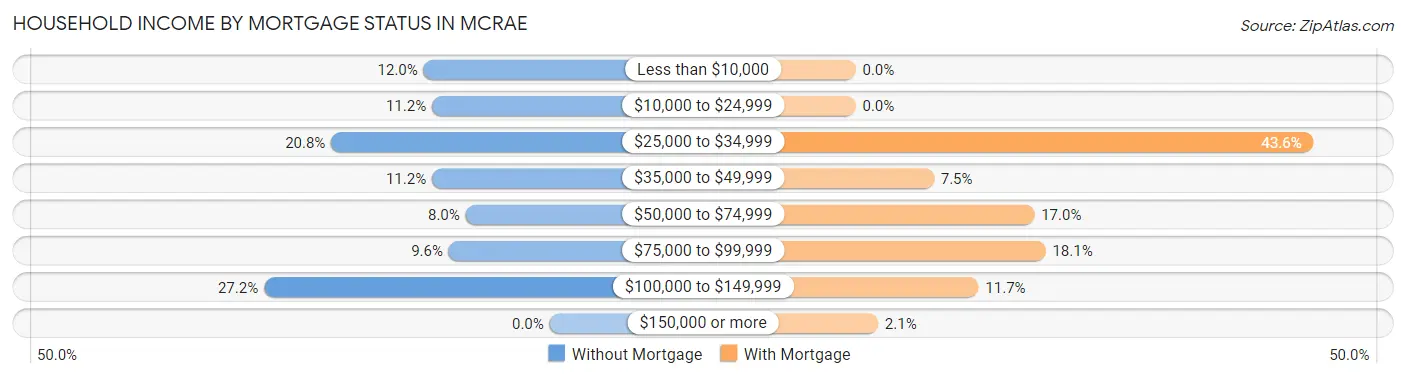
| Household Income | Without Mortgage | With Mortgage |
| Less than $10,000 | 15 (12.0%) | 0 (0.0%) |
| $10,000 to $24,999 | 14 (11.2%) | 0 (0.0%) |
| $25,000 to $34,999 | 26 (20.8%) | 41 (43.6%) |
| $35,000 to $49,999 | 14 (11.2%) | 7 (7.4%) |
| $50,000 to $74,999 | 10 (8.0%) | 16 (17.0%) |
| $75,000 to $99,999 | 12 (9.6%) | 17 (18.1%) |
| $100,000 to $149,999 | 34 (27.2%) | 11 (11.7%) |
| $150,000 or more | 0 (0.0%) | 2 (2.1%) |
| Total | 125 (100.0%) | 94 (100.0%) |
Property Value to Household Income Ratio in McRae
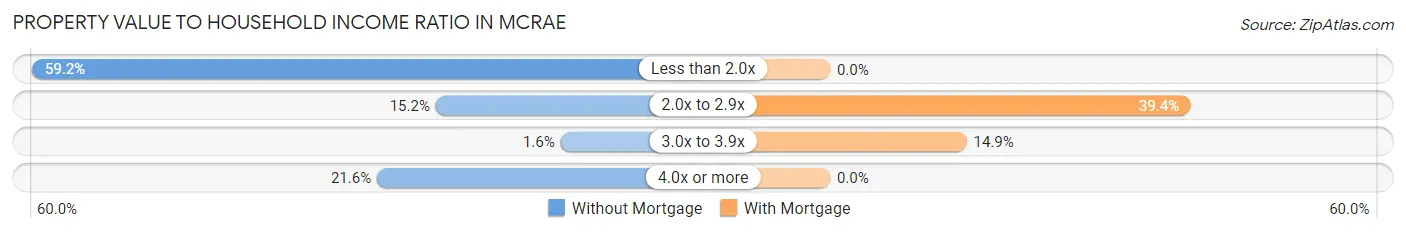
| Value-to-Income Ratio | Without Mortgage | With Mortgage |
| Less than 2.0x | 74 (59.2%) | 0 (0.0%) |
| 2.0x to 2.9x | 19 (15.2%) | 37 (39.4%) |
| 3.0x to 3.9x | 2 (1.6%) | 14 (14.9%) |
| 4.0x or more | 27 (21.6%) | 0 (0.0%) |
| Total | 125 (100.0%) | 94 (100.0%) |
Real Estate Taxes by Mortgage Status in McRae
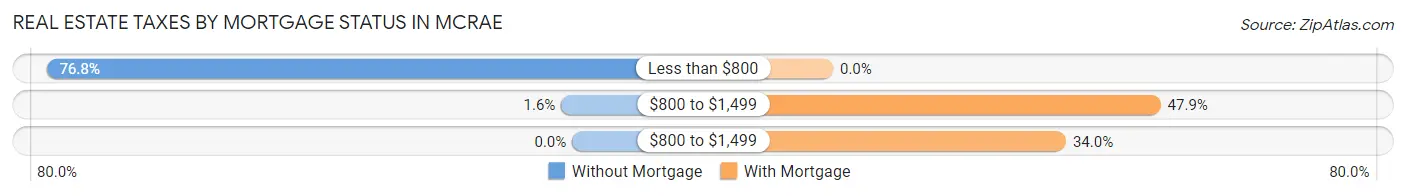
| Property Taxes | Without Mortgage | With Mortgage |
| Less than $800 | 96 (76.8%) | 0 (0.0%) |
| $800 to $1,499 | 2 (1.6%) | 45 (47.9%) |
| $800 to $1,499 | 0 (0.0%) | 32 (34.0%) |
| Total | 125 (100.0%) | 94 (100.0%) |
Health & Disability in McRae
Health Insurance Coverage by Age in McRae
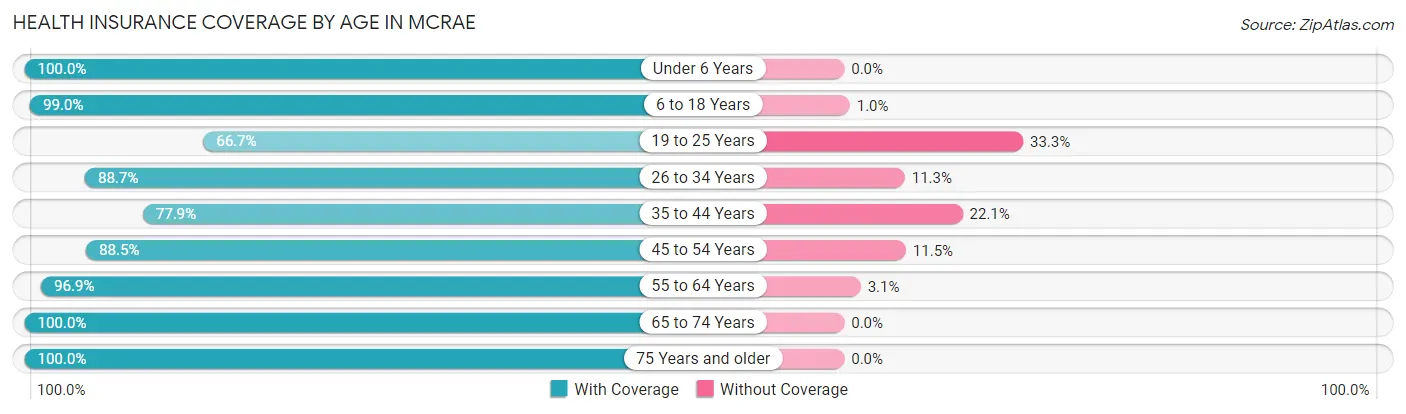
| Age Bracket | With Coverage | Without Coverage |
| Under 6 Years | 17 (100.0%) | 0 (0.0%) |
| 6 to 18 Years | 195 (99.0%) | 2 (1.0%) |
| 19 to 25 Years | 20 (66.7%) | 10 (33.3%) |
| 26 to 34 Years | 118 (88.7%) | 15 (11.3%) |
| 35 to 44 Years | 53 (77.9%) | 15 (22.1%) |
| 45 to 54 Years | 77 (88.5%) | 10 (11.5%) |
| 55 to 64 Years | 158 (96.9%) | 5 (3.1%) |
| 65 to 74 Years | 118 (100.0%) | 0 (0.0%) |
| 75 Years and older | 40 (100.0%) | 0 (0.0%) |
| Total | 796 (93.3%) | 57 (6.7%) |
Health Insurance Coverage by Citizenship Status in McRae
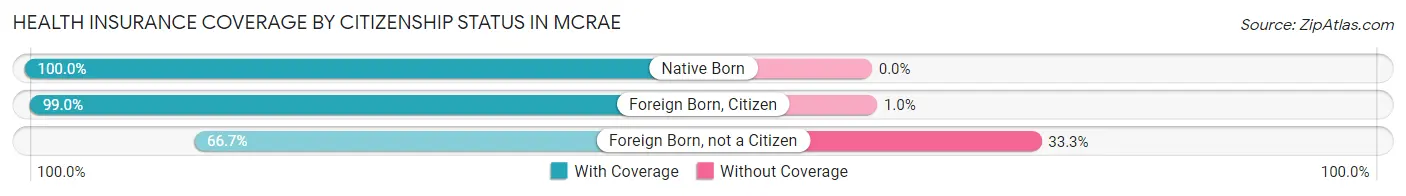
| Citizenship Status | With Coverage | Without Coverage |
| Native Born | 17 (100.0%) | 0 (0.0%) |
| Foreign Born, Citizen | 195 (99.0%) | 2 (1.0%) |
| Foreign Born, not a Citizen | 20 (66.7%) | 10 (33.3%) |
Health Insurance Coverage by Household Income in McRae
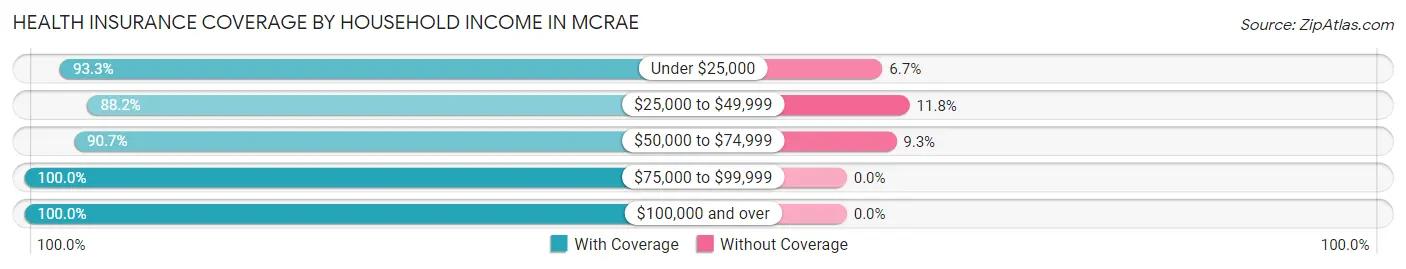
| Household Income | With Coverage | Without Coverage |
| Under $25,000 | 182 (93.3%) | 13 (6.7%) |
| $25,000 to $49,999 | 262 (88.2%) | 35 (11.8%) |
| $50,000 to $74,999 | 88 (90.7%) | 9 (9.3%) |
| $75,000 to $99,999 | 132 (100.0%) | 0 (0.0%) |
| $100,000 and over | 132 (100.0%) | 0 (0.0%) |
Public vs Private Health Insurance Coverage by Age in McRae
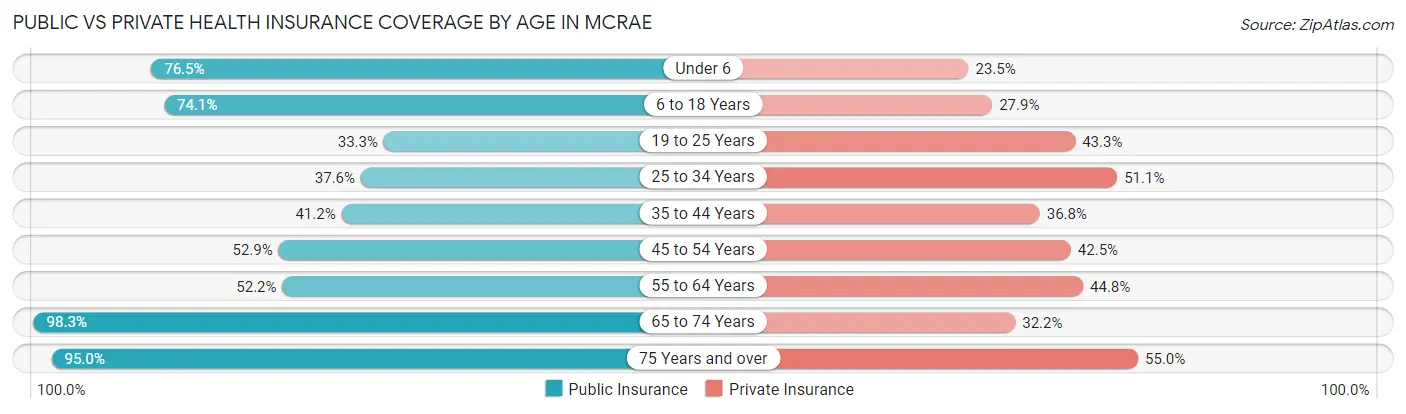
| Age Bracket | Public Insurance | Private Insurance |
| Under 6 | 13 (76.5%) | 4 (23.5%) |
| 6 to 18 Years | 146 (74.1%) | 55 (27.9%) |
| 19 to 25 Years | 10 (33.3%) | 13 (43.3%) |
| 25 to 34 Years | 50 (37.6%) | 68 (51.1%) |
| 35 to 44 Years | 28 (41.2%) | 25 (36.8%) |
| 45 to 54 Years | 46 (52.9%) | 37 (42.5%) |
| 55 to 64 Years | 85 (52.1%) | 73 (44.8%) |
| 65 to 74 Years | 116 (98.3%) | 38 (32.2%) |
| 75 Years and over | 38 (95.0%) | 22 (55.0%) |
| Total | 532 (62.4%) | 335 (39.3%) |
Disability Status by Sex by Age in McRae
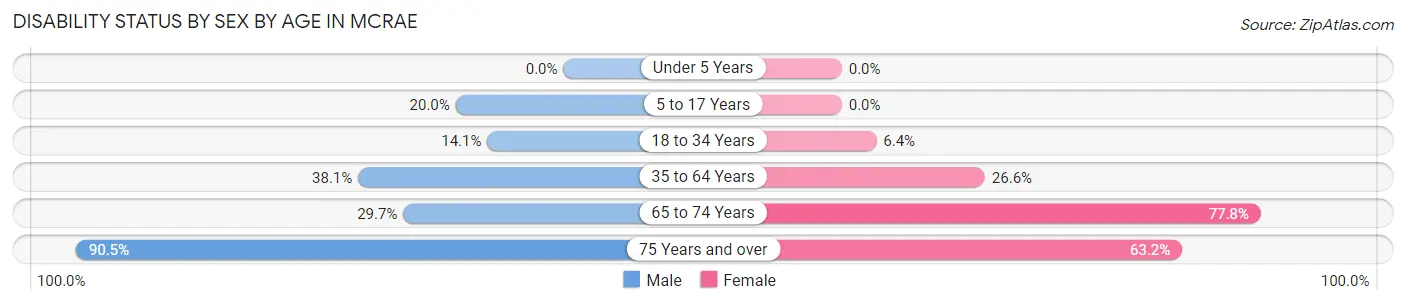
| Age Bracket | Male | Female |
| Under 5 Years | 0 (0.0%) | 0 (0.0%) |
| 5 to 17 Years | 20 (20.0%) | 0 (0.0%) |
| 18 to 34 Years | 12 (14.1%) | 5 (6.4%) |
| 35 to 64 Years | 48 (38.1%) | 51 (26.6%) |
| 65 to 74 Years | 11 (29.7%) | 63 (77.8%) |
| 75 Years and over | 19 (90.5%) | 12 (63.2%) |
Disability Class by Sex by Age in McRae
Disability Class: Hearing Difficulty
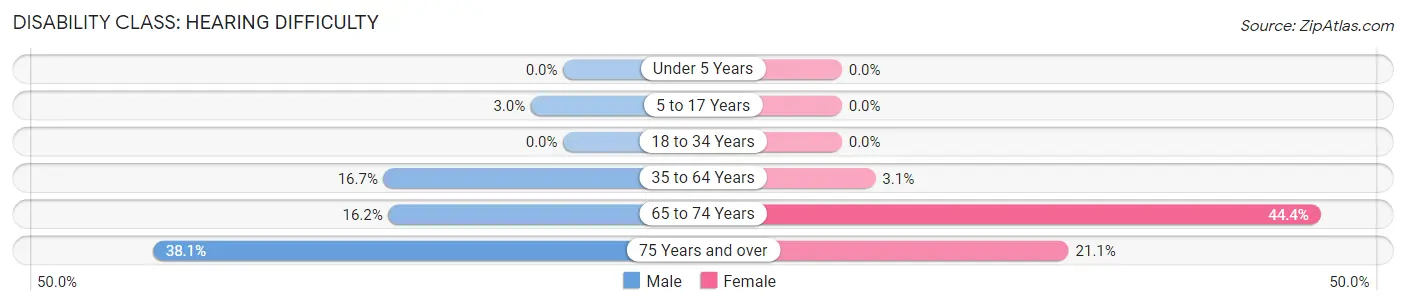
| Age Bracket | Male | Female |
| Under 5 Years | 0 (0.0%) | 0 (0.0%) |
| 5 to 17 Years | 3 (3.0%) | 0 (0.0%) |
| 18 to 34 Years | 0 (0.0%) | 0 (0.0%) |
| 35 to 64 Years | 21 (16.7%) | 6 (3.1%) |
| 65 to 74 Years | 6 (16.2%) | 36 (44.4%) |
| 75 Years and over | 8 (38.1%) | 4 (21.0%) |
Disability Class: Vision Difficulty
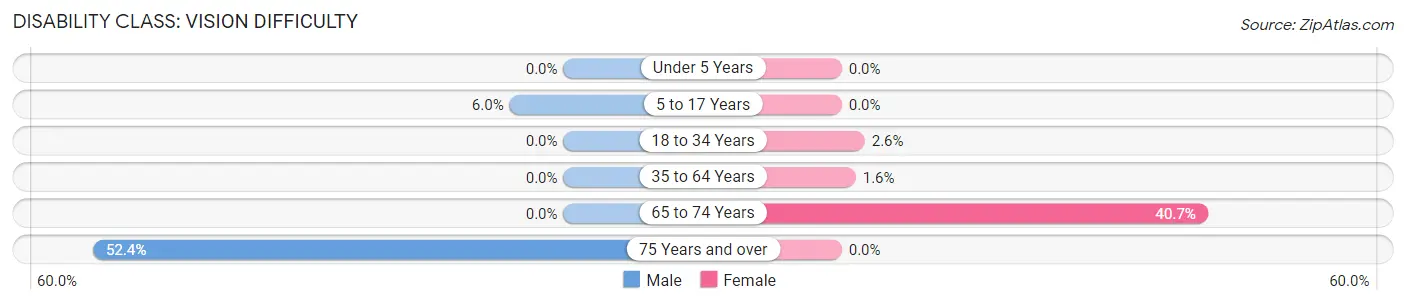
| Age Bracket | Male | Female |
| Under 5 Years | 0 (0.0%) | 0 (0.0%) |
| 5 to 17 Years | 6 (6.0%) | 0 (0.0%) |
| 18 to 34 Years | 0 (0.0%) | 2 (2.6%) |
| 35 to 64 Years | 0 (0.0%) | 3 (1.6%) |
| 65 to 74 Years | 0 (0.0%) | 33 (40.7%) |
| 75 Years and over | 11 (52.4%) | 0 (0.0%) |
Disability Class: Cognitive Difficulty
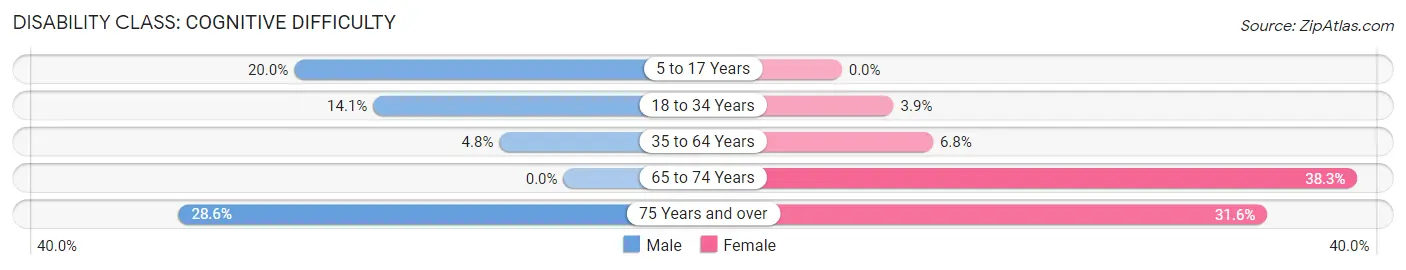
| Age Bracket | Male | Female |
| 5 to 17 Years | 20 (20.0%) | 0 (0.0%) |
| 18 to 34 Years | 12 (14.1%) | 3 (3.8%) |
| 35 to 64 Years | 6 (4.8%) | 13 (6.8%) |
| 65 to 74 Years | 0 (0.0%) | 31 (38.3%) |
| 75 Years and over | 6 (28.6%) | 6 (31.6%) |
Disability Class: Ambulatory Difficulty
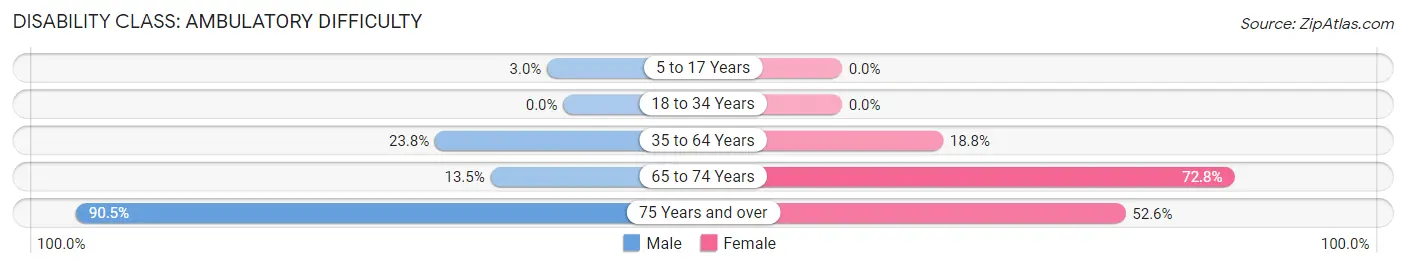
| Age Bracket | Male | Female |
| 5 to 17 Years | 3 (3.0%) | 0 (0.0%) |
| 18 to 34 Years | 0 (0.0%) | 0 (0.0%) |
| 35 to 64 Years | 30 (23.8%) | 36 (18.8%) |
| 65 to 74 Years | 5 (13.5%) | 59 (72.8%) |
| 75 Years and over | 19 (90.5%) | 10 (52.6%) |
Disability Class: Self-Care Difficulty
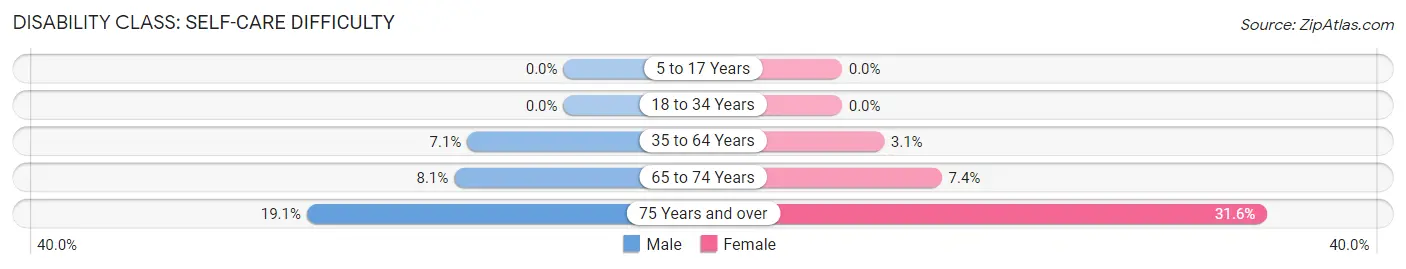
| Age Bracket | Male | Female |
| 5 to 17 Years | 0 (0.0%) | 0 (0.0%) |
| 18 to 34 Years | 0 (0.0%) | 0 (0.0%) |
| 35 to 64 Years | 9 (7.1%) | 6 (3.1%) |
| 65 to 74 Years | 3 (8.1%) | 6 (7.4%) |
| 75 Years and over | 4 (19.1%) | 6 (31.6%) |
Technology Access in McRae
Computing Device Access in McRae
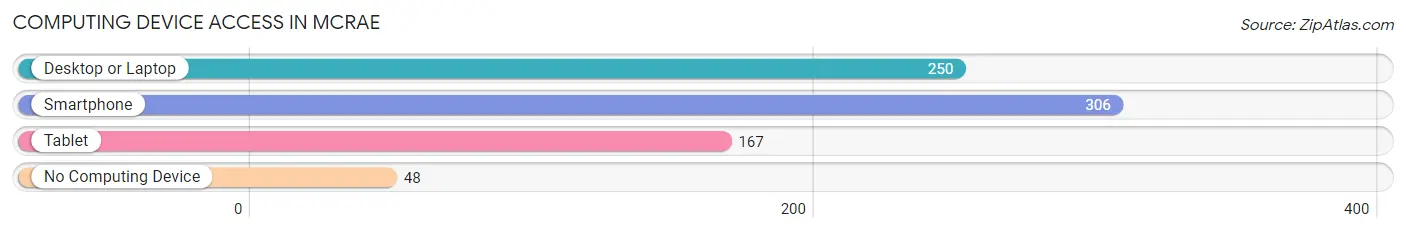
| Device Type | # Households | % Households |
| Desktop or Laptop | 250 | 64.4% |
| Smartphone | 306 | 78.9% |
| Tablet | 167 | 43.0% |
| No Computing Device | 48 | 12.4% |
| Total | 388 | 100.0% |
Internet Access in McRae
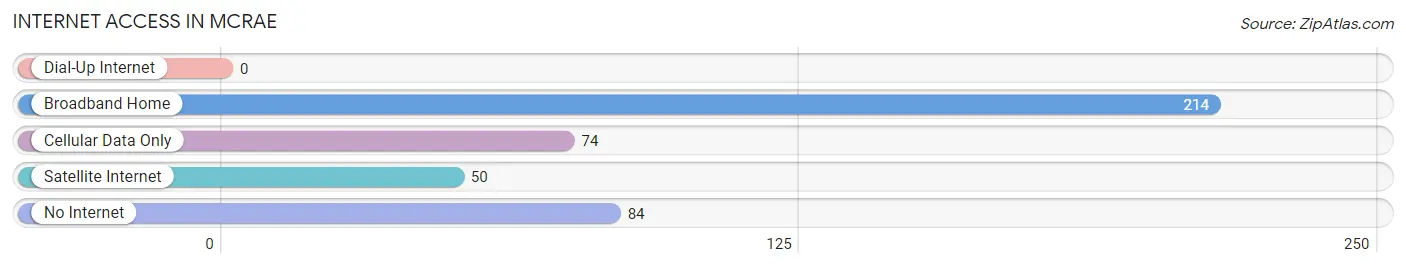
| Internet Type | # Households | % Households |
| Dial-Up Internet | 0 | 0.0% |
| Broadband Home | 214 | 55.1% |
| Cellular Data Only | 74 | 19.1% |
| Satellite Internet | 50 | 12.9% |
| No Internet | 84 | 21.6% |
| Total | 388 | 100.0% |
McRae Summary
McRae, Arkansas is a small city located in White County, Arkansas. It is situated in the foothills of the Ozark Mountains and is part of the Little Rock-North Little Rock-Conway Metropolitan Statistical Area. The city has a population of approximately 2,500 people and is the county seat of White County.
History
McRae was founded in 1873 by William McRae, a former Confederate soldier. The city was named after him and was incorporated in 1876. The city was originally a farming community and was known for its cotton production. In the late 19th century, the city began to grow and develop as a commercial center. The city was home to several businesses, including a cotton gin, a sawmill, and a gristmill.
In the early 20th century, the city experienced a period of growth and development. The city was home to several businesses, including a bank, a hotel, a movie theater, and a variety of stores. The city also had a railroad line that connected it to other cities in the region.
Geography
McRae is located in the foothills of the Ozark Mountains in White County, Arkansas. The city is situated at the intersection of U.S. Route 67 and Arkansas Highway 5. The city is located approximately 30 miles north of Little Rock and approximately 60 miles south of Fayetteville.
The city has a total area of 2.2 square miles, all of which is land. The city is located at an elevation of 545 feet above sea level. The city has a humid subtropical climate, with hot, humid summers and mild winters.
Economy
McRae’s economy is largely based on agriculture and manufacturing. The city is home to several manufacturing companies, including a furniture factory, a plastics factory, and a metal fabrication plant. The city is also home to several agricultural businesses, including a cotton gin, a grain elevator, and a feed mill.
The city is also home to several retail businesses, including a grocery store, a hardware store, and a variety of other stores. The city is also home to several restaurants and bars.
Demographics
As of the 2010 census, McRae had a population of 2,500 people. The racial makeup of the city was 95.2% White, 0.8% African American, 0.4% Native American, 0.4% Asian, 0.1% Pacific Islander, and 2.1% from other races. Hispanic or Latino of any race were 2.2% of the population.
The median household income in McRae was $30,000, and the median family income was $35,000. The per capita income in the city was $15,000. Approximately 17.2% of the population was below the poverty line.
McRae is a small city with a rich history and a diverse economy. The city is home to several businesses and is a popular destination for tourists. The city is also home to a variety of cultural and recreational activities, making it an ideal place to live and work.
Common Questions
What is the Total Population of McRae?
Total Population of McRae is 853.
What is the Total Male Population of McRae?
Total Male Population of McRae is 381.
What is the Total Female Population of McRae?
Total Female Population of McRae is 472.
What is the Ratio of Males per 100 Females in McRae?
There are 80.72 Males per 100 Females in McRae.
What is the Ratio of Females per 100 Males in McRae?
There are 123.88 Females per 100 Males in McRae.
What is the Median Population Age in McRae?
Median Population Age in McRae is 41.7 Years.
What is the Average Family Size in McRae
Average Family Size in McRae is 2.8 People.
What is the Average Household Size in McRae
Average Household Size in McRae is 2.2 People.
What is Per Capita Income in McRae?
Per Capita income in McRae is $20,775.
What is the Median Family Income in McRae?
Median Family Income in McRae is $44,792.
What is the Median Household income in McRae?
Median Household Income in McRae is $27,452.
What is Income or Wage Gap in McRae?
Income or Wage Gap in McRae is 18.7%.
Women in McRae earn 81.3 cents for every dollar earned by a man.
What is Inequality or Gini Index in McRae?
Inequality or Gini Index in McRae is 0.41.
How Large is the Labor Force in McRae?
There are 375 People in the Labor Forcein in McRae.
What is the Percentage of People in the Labor Force in McRae?
56.5% of People are in the Labor Force in McRae.
What is the Unemployment Rate in McRae?
Unemployment Rate in McRae is 1.9%.