Central City, AR
Central City Map
Central City Overview
729
TOTAL POPULATION
339
MALE POPULATION
390
FEMALE POPULATION
86.92
MALES / 100 FEMALES
115.04
FEMALES / 100 MALES
41.0
MEDIAN AGE
3.4
AVG FAMILY SIZE
3.0
AVG HOUSEHOLD SIZE
$29,728
PER CAPITA INCOME
$88,000
AVG FAMILY INCOME
$73,456
AVG HOUSEHOLD INCOME
39.5%
WAGE / INCOME GAP [ % ]
60.5¢/ $1
WAGE / INCOME GAP [ $ ]
$7,300
FAMILY INCOME DEFICIT
0.41
INEQUALITY / GINI INDEX
416
LABOR FORCE [ PEOPLE ]
67.6%
PERCENT IN LABOR FORCE
5.0%
UNEMPLOYMENT RATE
Central City Area Codes
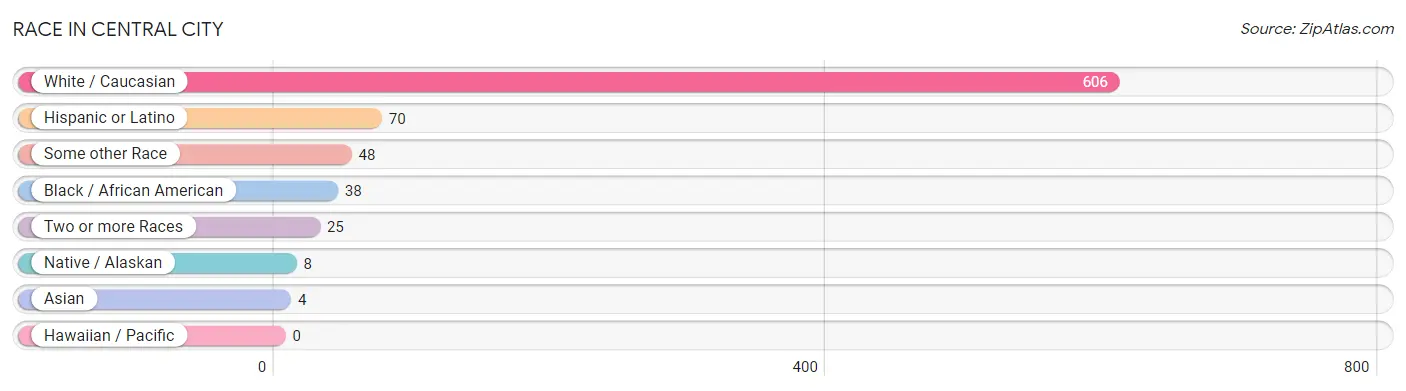
Race in Central City
The most populous races in Central City are White / Caucasian (606 | 83.1%), Hispanic or Latino (70 | 9.6%), and Some other Race (48 | 6.6%).
| Race | # Population | % Population |
| Asian | 4 | 0.5% |
| Black / African American | 38 | 5.2% |
| Hawaiian / Pacific | 0 | 0.0% |
| Hispanic or Latino | 70 | 9.6% |
| Native / Alaskan | 8 | 1.1% |
| White / Caucasian | 606 | 83.1% |
| Two or more Races | 25 | 3.4% |
| Some other Race | 48 | 6.6% |
| Total | 729 | 100.0% |
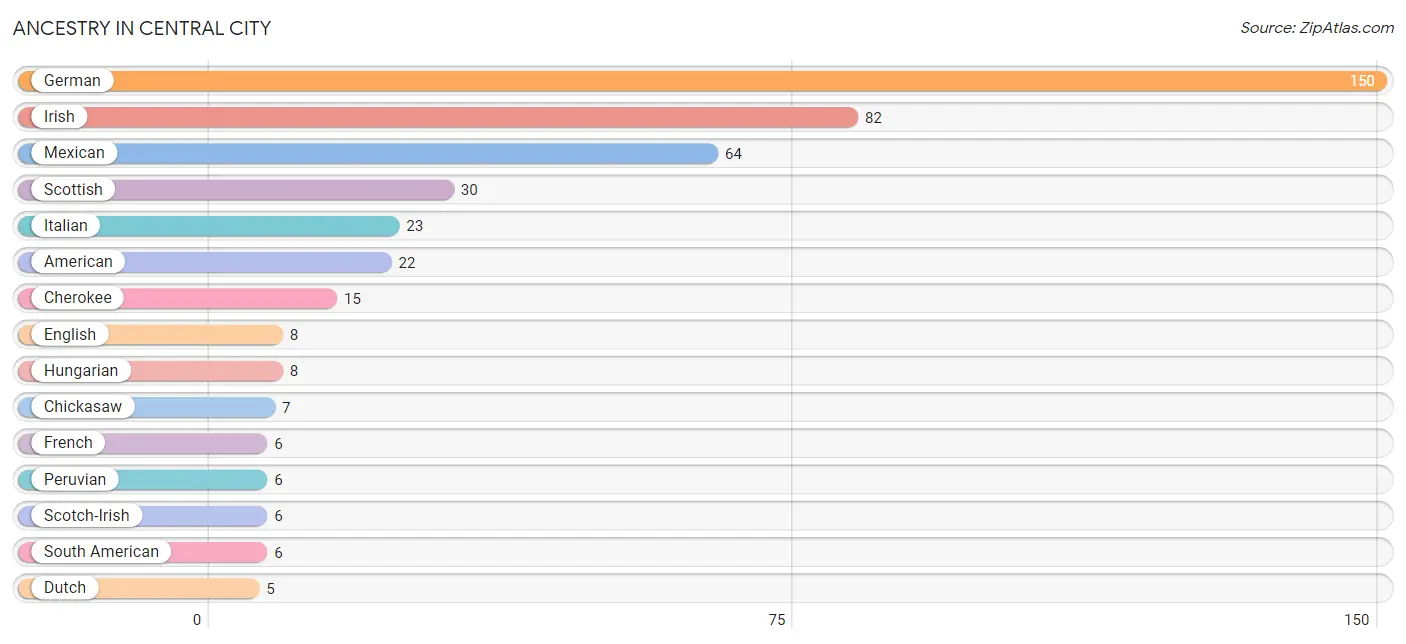
Ancestry in Central City
The most populous ancestries reported in Central City are German (150 | 20.6%), Irish (82 | 11.3%), Mexican (64 | 8.8%), Scottish (30 | 4.1%), and Italian (23 | 3.2%), together accounting for 47.9% of all Central City residents.
| Ancestry | # Population | % Population |
| American | 22 | 3.0% |
| Arab | 4 | 0.5% |
| Cherokee | 15 | 2.1% |
| Chickasaw | 7 | 1.0% |
| Dutch | 5 | 0.7% |
| English | 8 | 1.1% |
| French | 6 | 0.8% |
| German | 150 | 20.6% |
| Hungarian | 8 | 1.1% |
| Irish | 82 | 11.3% |
| Italian | 23 | 3.2% |
| Korean | 4 | 0.5% |
| Lebanese | 4 | 0.5% |
| Mexican | 64 | 8.8% |
| Peruvian | 6 | 0.8% |
| Polish | 2 | 0.3% |
| Portuguese | 2 | 0.3% |
| Scotch-Irish | 6 | 0.8% |
| Scottish | 30 | 4.1% |
| South American | 6 | 0.8% |
| Swedish | 3 | 0.4% |
| Welsh | 4 | 0.5% | View All 22 Rows |
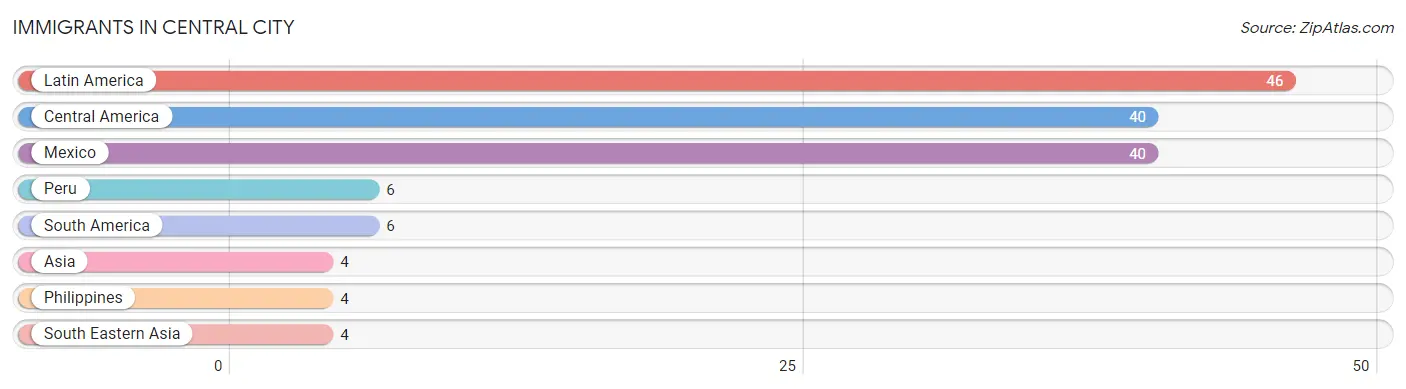
Immigrants in Central City
The most numerous immigrant groups reported in Central City came from Latin America (46 | 6.3%), Central America (40 | 5.5%), Mexico (40 | 5.5%), Peru (6 | 0.8%), and South America (6 | 0.8%), together accounting for 18.9% of all Central City residents.
| Immigration Origin | # Population | % Population |
| Asia | 4 | 0.5% |
| Central America | 40 | 5.5% |
| Latin America | 46 | 6.3% |
| Mexico | 40 | 5.5% |
| Peru | 6 | 0.8% |
| Philippines | 4 | 0.5% |
| South America | 6 | 0.8% |
| South Eastern Asia | 4 | 0.5% | View All 8 Rows |
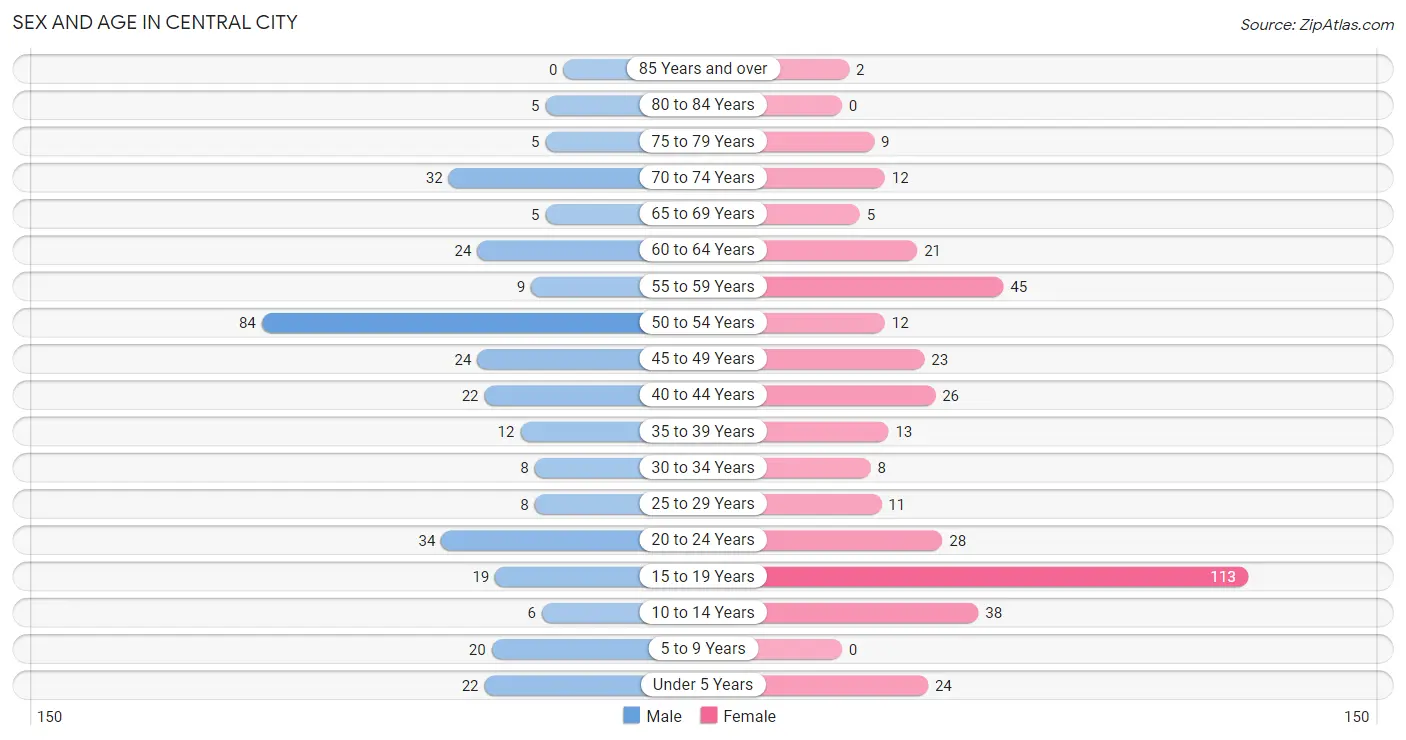
Sex and Age in Central City
Sex and Age in Central City
The most populous age groups in Central City are 50 to 54 Years (84 | 24.8%) for men and 15 to 19 Years (113 | 29.0%) for women.
| Age Bracket | Male | Female |
| Under 5 Years | 22 (6.5%) | 24 (6.1%) |
| 5 to 9 Years | 20 (5.9%) | 0 (0.0%) |
| 10 to 14 Years | 6 (1.8%) | 38 (9.7%) |
| 15 to 19 Years | 19 (5.6%) | 113 (29.0%) |
| 20 to 24 Years | 34 (10.0%) | 28 (7.2%) |
| 25 to 29 Years | 8 (2.4%) | 11 (2.8%) |
| 30 to 34 Years | 8 (2.4%) | 8 (2.1%) |
| 35 to 39 Years | 12 (3.5%) | 13 (3.3%) |
| 40 to 44 Years | 22 (6.5%) | 26 (6.7%) |
| 45 to 49 Years | 24 (7.1%) | 23 (5.9%) |
| 50 to 54 Years | 84 (24.8%) | 12 (3.1%) |
| 55 to 59 Years | 9 (2.6%) | 45 (11.5%) |
| 60 to 64 Years | 24 (7.1%) | 21 (5.4%) |
| 65 to 69 Years | 5 (1.5%) | 5 (1.3%) |
| 70 to 74 Years | 32 (9.4%) | 12 (3.1%) |
| 75 to 79 Years | 5 (1.5%) | 9 (2.3%) |
| 80 to 84 Years | 5 (1.5%) | 0 (0.0%) |
| 85 Years and over | 0 (0.0%) | 2 (0.5%) |
| Total | 339 (100.0%) | 390 (100.0%) |
Families and Households in Central City
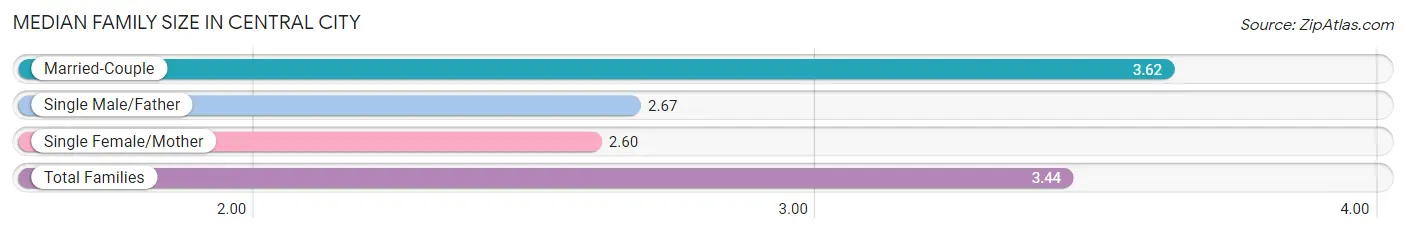
Median Family Size in Central City
The median family size in Central City is 3.44 persons per family, with married-couple families (151 | 81.2%) accounting for the largest median family size of 3.62 persons per family. On the other hand, single female/mother families (5 | 2.7%) represent the smallest median family size with 2.60 persons per family.
| Family Type | # Families | Family Size |
| Married-Couple | 151 (81.2%) | 3.62 |
| Single Male/Father | 30 (16.1%) | 2.67 |
| Single Female/Mother | 5 (2.7%) | 2.60 |
| Total Families | 186 (100.0%) | 3.44 |
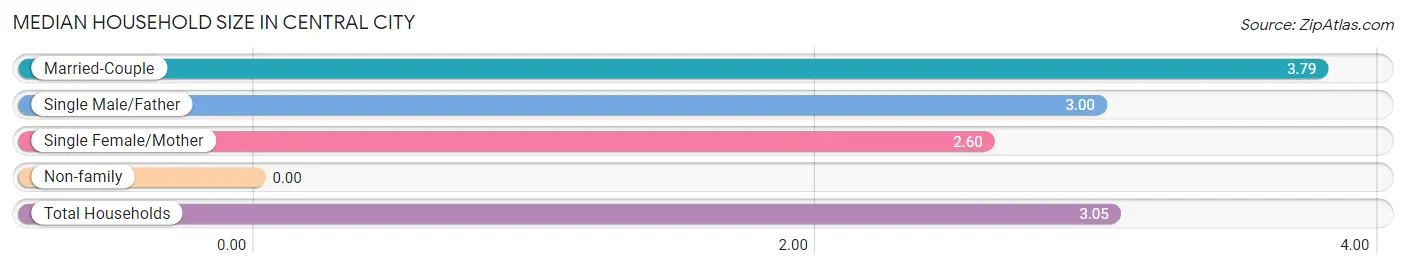
Median Household Size in Central City
| Household Type | # Households | Household Size |
| Married-Couple | 151 (63.2%) | 3.79 |
| Single Male/Father | 30 (12.6%) | 3.00 |
| Single Female/Mother | 5 (2.1%) | 2.60 |
| Non-family | 53 (22.2%) | - |
| Total Households | 239 (100.0%) | 3.05 |
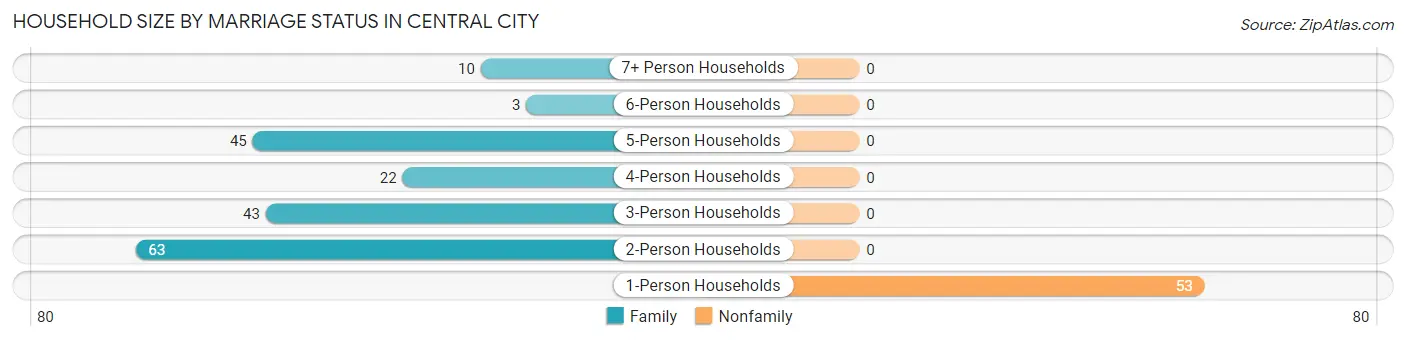
Household Size by Marriage Status in Central City
Out of a total of 239 households in Central City, 186 (77.8%) are family households, while 53 (22.2%) are nonfamily households. The most numerous type of family households are 2-person households, comprising 63, and the most common type of nonfamily households are 1-person households, comprising 53.
| Household Size | Family Households | Nonfamily Households |
| 1-Person Households | - | 53 (22.2%) |
| 2-Person Households | 63 (26.4%) | 0 (0.0%) |
| 3-Person Households | 43 (18.0%) | 0 (0.0%) |
| 4-Person Households | 22 (9.2%) | 0 (0.0%) |
| 5-Person Households | 45 (18.8%) | 0 (0.0%) |
| 6-Person Households | 3 (1.3%) | 0 (0.0%) |
| 7+ Person Households | 10 (4.2%) | 0 (0.0%) |
| Total | 186 (77.8%) | 53 (22.2%) |
Female Fertility in Central City
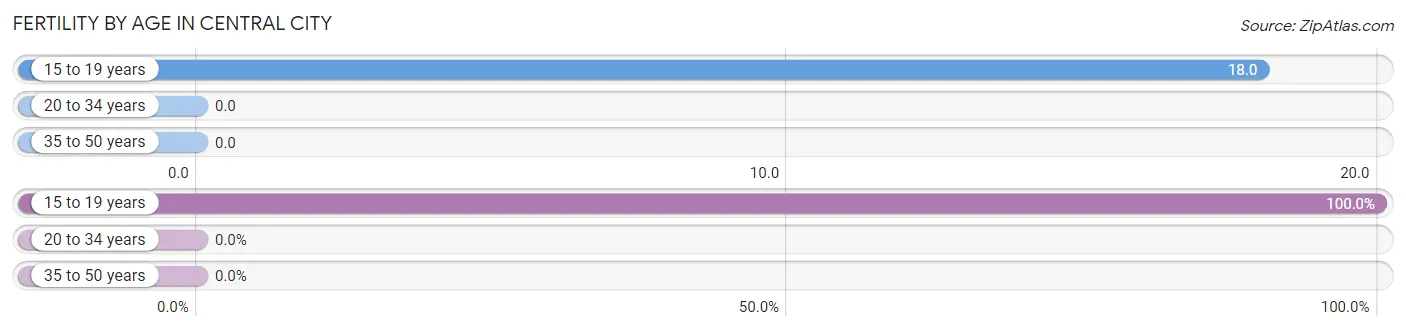
Fertility by Age in Central City
Average fertility rate in Central City is 9.0 births per 1,000 women. Women in the age bracket of 15 to 19 years have the highest fertility rate with 18.0 births per 1,000 women. Women in the age bracket of 15 to 19 years acount for 100.0% of all women with births.
| Age Bracket | Women with Births | Births / 1,000 Women |
| 15 to 19 years | 2 (100.0%) | 18.0 |
| 20 to 34 years | 0 (0.0%) | 0.0 |
| 35 to 50 years | 0 (0.0%) | 0.0 |
| Total | 2 (100.0%) | 9.0 |
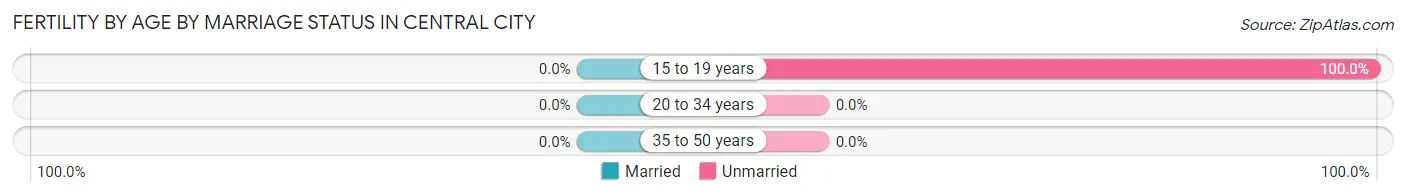
Fertility by Age by Marriage Status in Central City
| Age Bracket | Married | Unmarried |
| 15 to 19 years | 0 (0.0%) | 2 (100.0%) |
| 20 to 34 years | 0 (0.0%) | 0 (0.0%) |
| 35 to 50 years | 0 (0.0%) | 0 (0.0%) |
| Total | 0 (0.0%) | 2 (100.0%) |
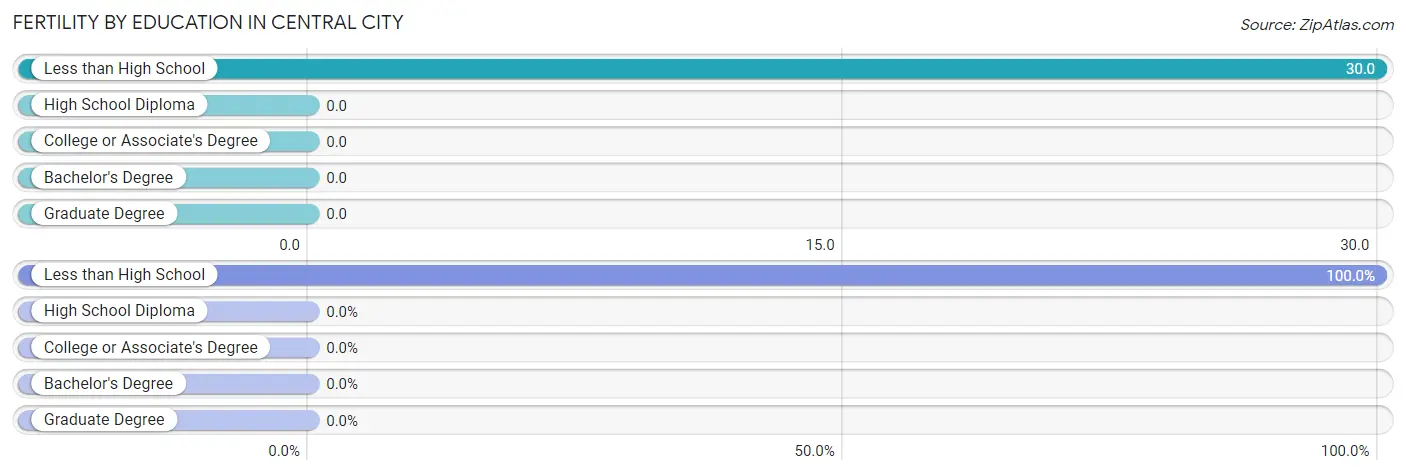
Fertility by Education in Central City
| Educational Attainment | Women with Births | Births / 1,000 Women |
| Less than High School | 2 (100.0%) | 30.0 |
| High School Diploma | 0 (0.0%) | 0.0 |
| College or Associate's Degree | 0 (0.0%) | 0.0 |
| Bachelor's Degree | 0 (0.0%) | 0.0 |
| Graduate Degree | 0 (0.0%) | 0.0 |
| Total | 2 (100.0%) | 9.0 |
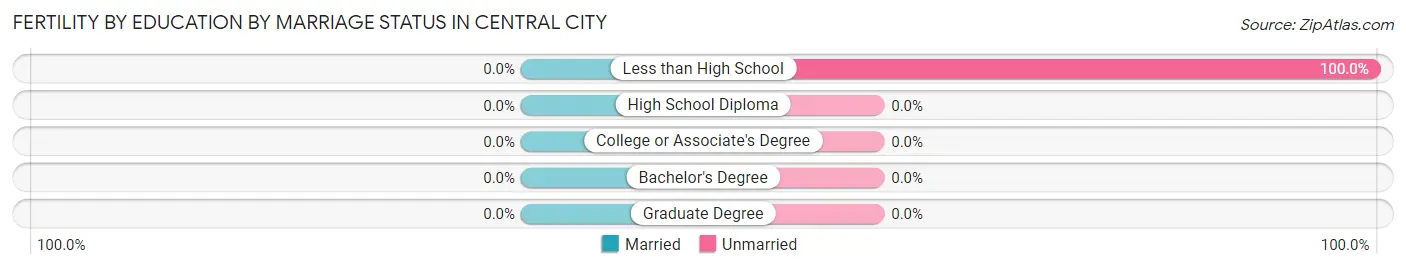
Fertility by Education by Marriage Status in Central City
| Educational Attainment | Married | Unmarried |
| Less than High School | 0 (0.0%) | 2 (100.0%) |
| High School Diploma | 0 (0.0%) | 0 (0.0%) |
| College or Associate's Degree | 0 (0.0%) | 0 (0.0%) |
| Bachelor's Degree | 0 (0.0%) | 0 (0.0%) |
| Graduate Degree | 0 (0.0%) | 0 (0.0%) |
| Total | 0 (0.0%) | 2 (100.0%) |
Income in Central City
Income Overview in Central City
Per Capita Income in Central City is $29,728, while median incomes of families and households are $88,000 and $73,456 respectively.
| Characteristic | Number | Measure |
| Per Capita Income | 729 | $29,728 |
| Median Family Income | 186 | $88,000 |
| Mean Family Income | 186 | $99,240 |
| Median Household Income | 239 | $73,456 |
| Mean Household Income | 239 | $85,876 |
| Income Deficit | 186 | $7,300 |
| Wage / Income Gap (%) | 729 | 39.52% |
| Wage / Income Gap ($) | 729 | 60.48¢ per $1 |
| Gini / Inequality Index | 729 | 0.41 |
Earnings by Sex in Central City
Average Earnings in Central City are $29,750, $43,173 for men and $26,111 for women, a difference of 39.5%.
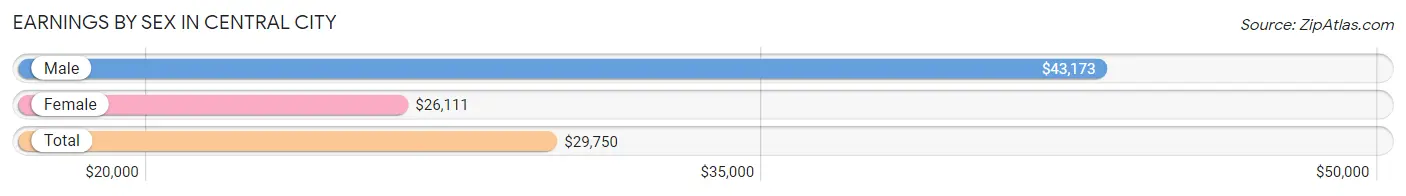
| Sex | Number | Average Earnings |
| Male | 225 (52.4%) | $43,173 |
| Female | 204 (47.5%) | $26,111 |
| Total | 429 (100.0%) | $29,750 |
Earnings by Sex by Income Bracket in Central City
The most common earnings brackets in Central City are $50,000 to $54,999 for men (52 | 23.1%) and $2,499 or less for women (45 | 22.1%).
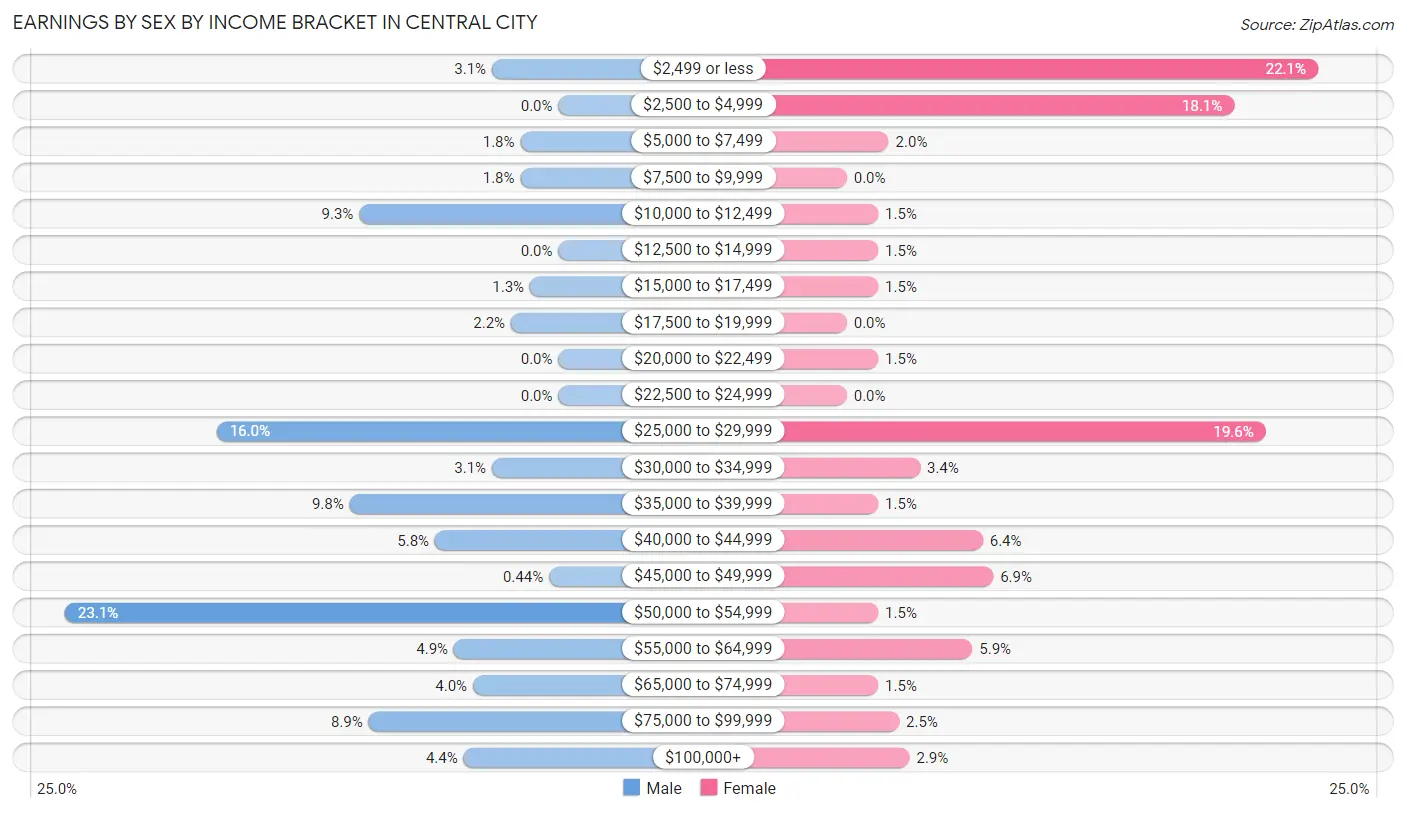
| Income | Male | Female |
| $2,499 or less | 7 (3.1%) | 45 (22.1%) |
| $2,500 to $4,999 | 0 (0.0%) | 37 (18.1%) |
| $5,000 to $7,499 | 4 (1.8%) | 4 (2.0%) |
| $7,500 to $9,999 | 4 (1.8%) | 0 (0.0%) |
| $10,000 to $12,499 | 21 (9.3%) | 3 (1.5%) |
| $12,500 to $14,999 | 0 (0.0%) | 3 (1.5%) |
| $15,000 to $17,499 | 3 (1.3%) | 3 (1.5%) |
| $17,500 to $19,999 | 5 (2.2%) | 0 (0.0%) |
| $20,000 to $22,499 | 0 (0.0%) | 3 (1.5%) |
| $22,500 to $24,999 | 0 (0.0%) | 0 (0.0%) |
| $25,000 to $29,999 | 36 (16.0%) | 40 (19.6%) |
| $30,000 to $34,999 | 7 (3.1%) | 7 (3.4%) |
| $35,000 to $39,999 | 22 (9.8%) | 3 (1.5%) |
| $40,000 to $44,999 | 13 (5.8%) | 13 (6.4%) |
| $45,000 to $49,999 | 1 (0.4%) | 14 (6.9%) |
| $50,000 to $54,999 | 52 (23.1%) | 3 (1.5%) |
| $55,000 to $64,999 | 11 (4.9%) | 12 (5.9%) |
| $65,000 to $74,999 | 9 (4.0%) | 3 (1.5%) |
| $75,000 to $99,999 | 20 (8.9%) | 5 (2.5%) |
| $100,000+ | 10 (4.4%) | 6 (2.9%) |
| Total | 225 (100.0%) | 204 (100.0%) |
Earnings by Sex by Educational Attainment in Central City
Average earnings in Central City are $50,652 for men and $28,790 for women, a difference of 43.2%. Men with an educational attainment of college or associate's degree enjoy the highest average annual earnings of $59,167, while those with high school diploma education earn the least with $50,698. Women with an educational attainment of bachelor's degree earn the most with the average annual earnings of $55,833, while those with high school diploma education have the smallest earnings of $28,147.
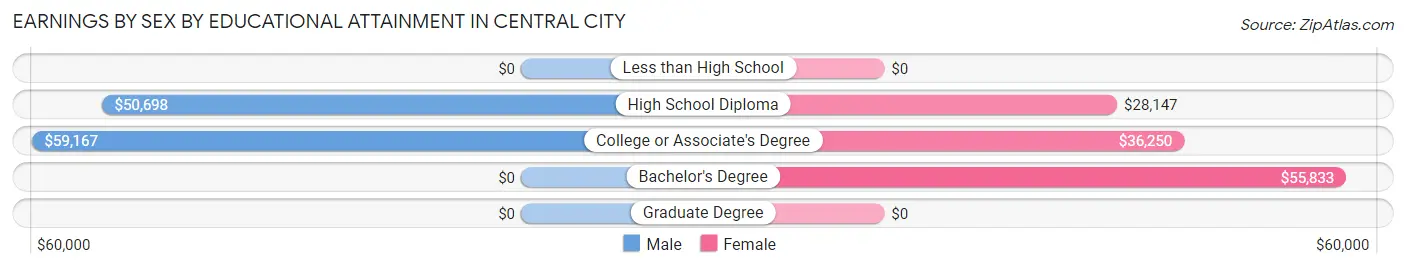
| Educational Attainment | Male Income | Female Income |
| Less than High School | - | - |
| High School Diploma | $50,698 | $28,147 |
| College or Associate's Degree | $59,167 | $36,250 |
| Bachelor's Degree | - | - |
| Graduate Degree | - | - |
| Total | $50,652 | $28,790 |
Family Income in Central City
Family Income Brackets in Central City
According to the Central City family income data, there are 56 families falling into the $75,000 to $99,999 income range, which is the most common income bracket and makes up 30.1% of all families.
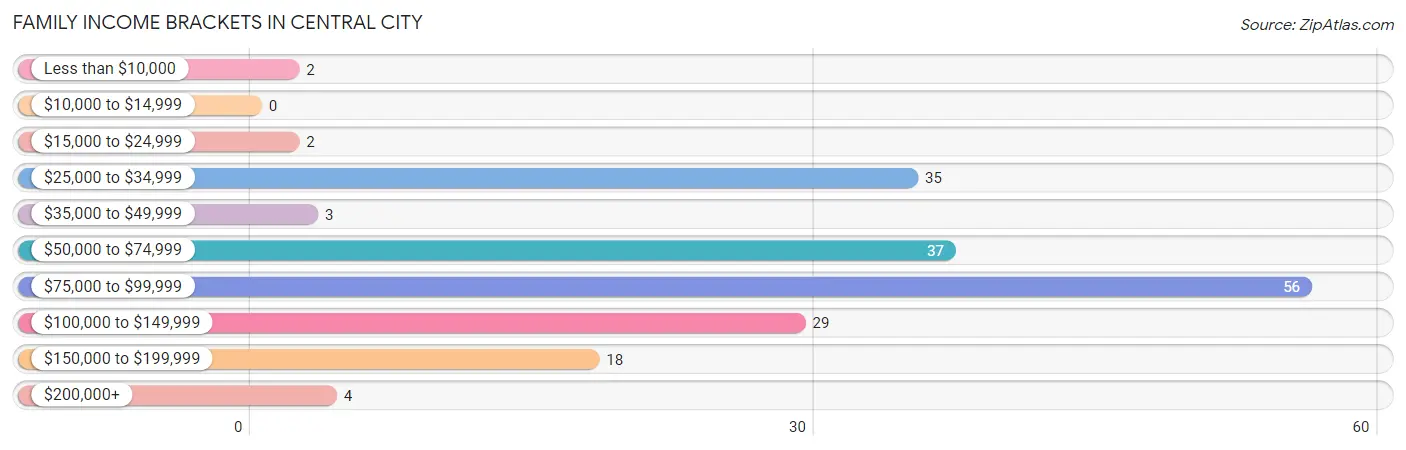
| Income Bracket | # Families | % Families |
| Less than $10,000 | 2 | 1.1% |
| $10,000 to $14,999 | 0 | 0.0% |
| $15,000 to $24,999 | 2 | 1.1% |
| $25,000 to $34,999 | 35 | 18.8% |
| $35,000 to $49,999 | 3 | 1.6% |
| $50,000 to $74,999 | 37 | 19.9% |
| $75,000 to $99,999 | 56 | 30.1% |
| $100,000 to $149,999 | 29 | 15.6% |
| $150,000 to $199,999 | 18 | 9.7% |
| $200,000+ | 4 | 2.2% |
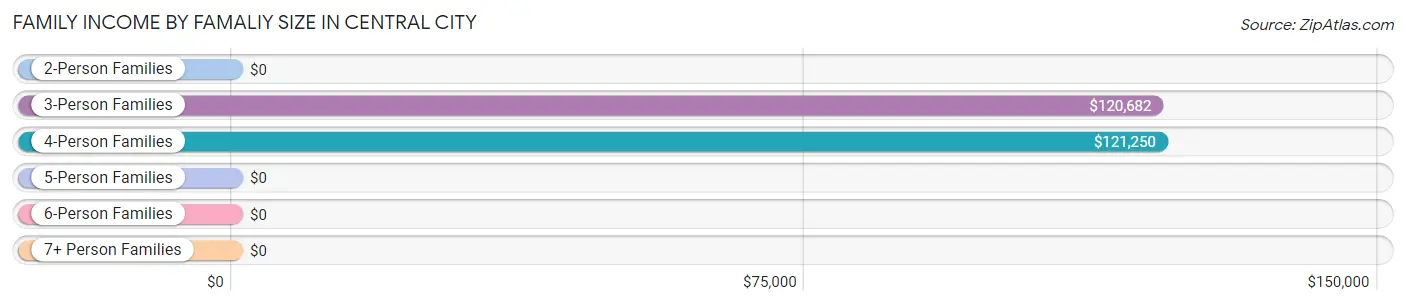
Family Income by Famaliy Size in Central City
4-person families (19 | 10.2%) account for the highest median family income in Central City with $121,250 per family, while 3-person families (34 | 18.3%) have the highest median income of $40,227 per family member.
| Income Bracket | # Families | Median Income |
| 2-Person Families | 75 (40.3%) | $0 |
| 3-Person Families | 34 (18.3%) | $120,682 |
| 4-Person Families | 19 (10.2%) | $121,250 |
| 5-Person Families | 45 (24.2%) | $0 |
| 6-Person Families | 11 (5.9%) | $0 |
| 7+ Person Families | 2 (1.1%) | $0 |
| Total | 186 (100.0%) | $88,000 |
Family Income by Number of Earners in Central City
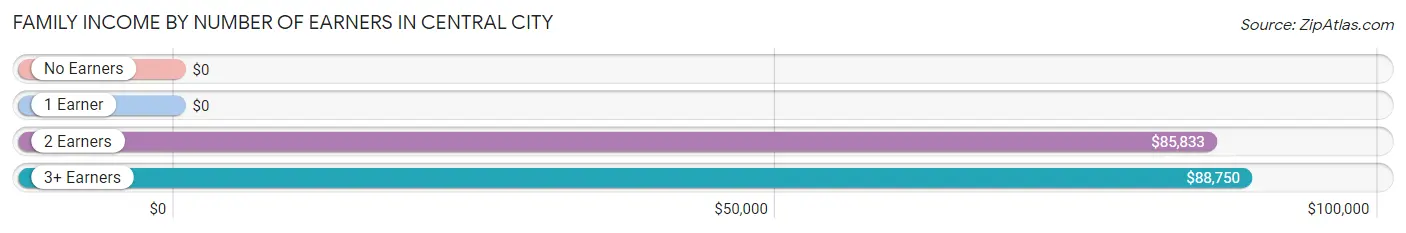
| Number of Earners | # Families | Median Income |
| No Earners | 13 (7.0%) | $0 |
| 1 Earner | 28 (15.0%) | $0 |
| 2 Earners | 80 (43.0%) | $85,833 |
| 3+ Earners | 65 (34.9%) | $88,750 |
| Total | 186 (100.0%) | $88,000 |
Household Income in Central City
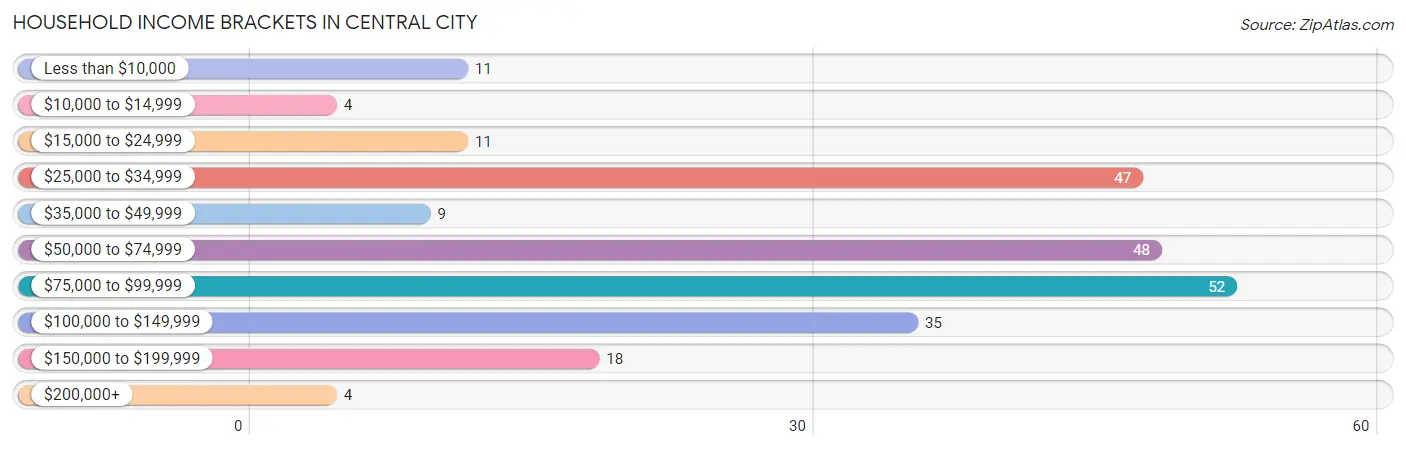
Household Income Brackets in Central City
With 52 households falling in the category, the $75,000 to $99,999 income range is the most frequent in Central City, accounting for 21.8% of all households. In contrast, only 4 households (1.7%) fall into the $10,000 to $14,999 income bracket, making it the least populous group.
| Income Bracket | # Households | % Households |
| Less than $10,000 | 11 | 4.6% |
| $10,000 to $14,999 | 4 | 1.7% |
| $15,000 to $24,999 | 11 | 4.6% |
| $25,000 to $34,999 | 47 | 19.7% |
| $35,000 to $49,999 | 9 | 3.8% |
| $50,000 to $74,999 | 48 | 20.1% |
| $75,000 to $99,999 | 52 | 21.8% |
| $100,000 to $149,999 | 35 | 14.6% |
| $150,000 to $199,999 | 18 | 7.5% |
| $200,000+ | 4 | 1.7% |
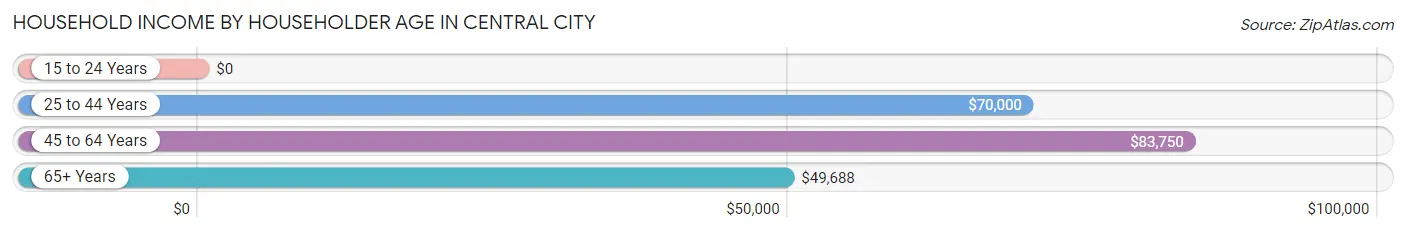
Household Income by Householder Age in Central City
The median household income in Central City is $73,456, with the highest median household income of $83,750 found in the 45 to 64 years age bracket for the primary householder. A total of 128 households (53.6%) fall into this category. Meanwhile, the 15 to 24 years age bracket for the primary householder has the lowest median household income of $0, with 2 households (0.8%) in this group.
| Income Bracket | # Households | Median Income |
| 15 to 24 Years | 2 (0.8%) | $0 |
| 25 to 44 Years | 62 (25.9%) | $70,000 |
| 45 to 64 Years | 128 (53.6%) | $83,750 |
| 65+ Years | 47 (19.7%) | $49,688 |
| Total | 239 (100.0%) | $73,456 |
Poverty in Central City
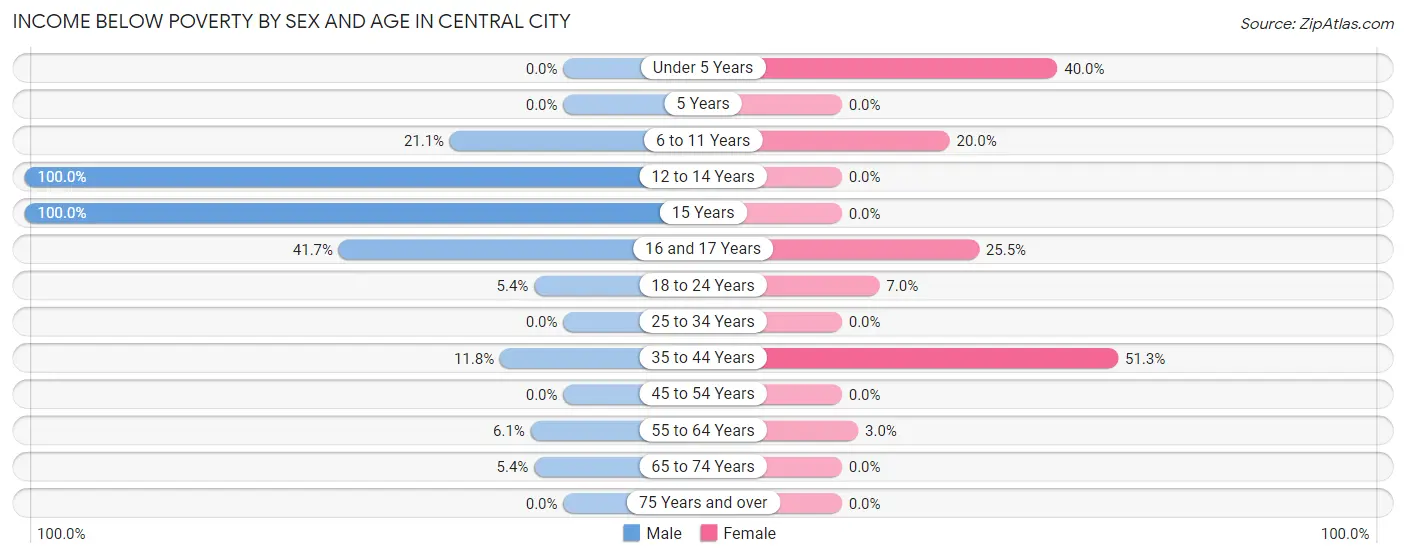
Income Below Poverty by Sex and Age in Central City
With 8.0% poverty level for males and 12.8% for females among the residents of Central City, 12 to 14 year old males and 35 to 44 year old females are the most vulnerable to poverty, with 4 males (100.0%) and 20 females (51.3%) in their respective age groups living below the poverty level.
| Age Bracket | Male | Female |
| Under 5 Years | 0 (0.0%) | 4 (40.0%) |
| 5 Years | 0 (0.0%) | 0 (0.0%) |
| 6 to 11 Years | 4 (21.0%) | 2 (20.0%) |
| 12 to 14 Years | 4 (100.0%) | 0 (0.0%) |
| 15 Years | 4 (100.0%) | 0 (0.0%) |
| 16 and 17 Years | 5 (41.7%) | 14 (25.5%) |
| 18 to 24 Years | 2 (5.4%) | 6 (7.0%) |
| 25 to 34 Years | 0 (0.0%) | 0 (0.0%) |
| 35 to 44 Years | 4 (11.8%) | 20 (51.3%) |
| 45 to 54 Years | 0 (0.0%) | 0 (0.0%) |
| 55 to 64 Years | 2 (6.1%) | 2 (3.0%) |
| 65 to 74 Years | 2 (5.4%) | 0 (0.0%) |
| 75 Years and over | 0 (0.0%) | 0 (0.0%) |
| Total | 27 (8.0%) | 48 (12.8%) |
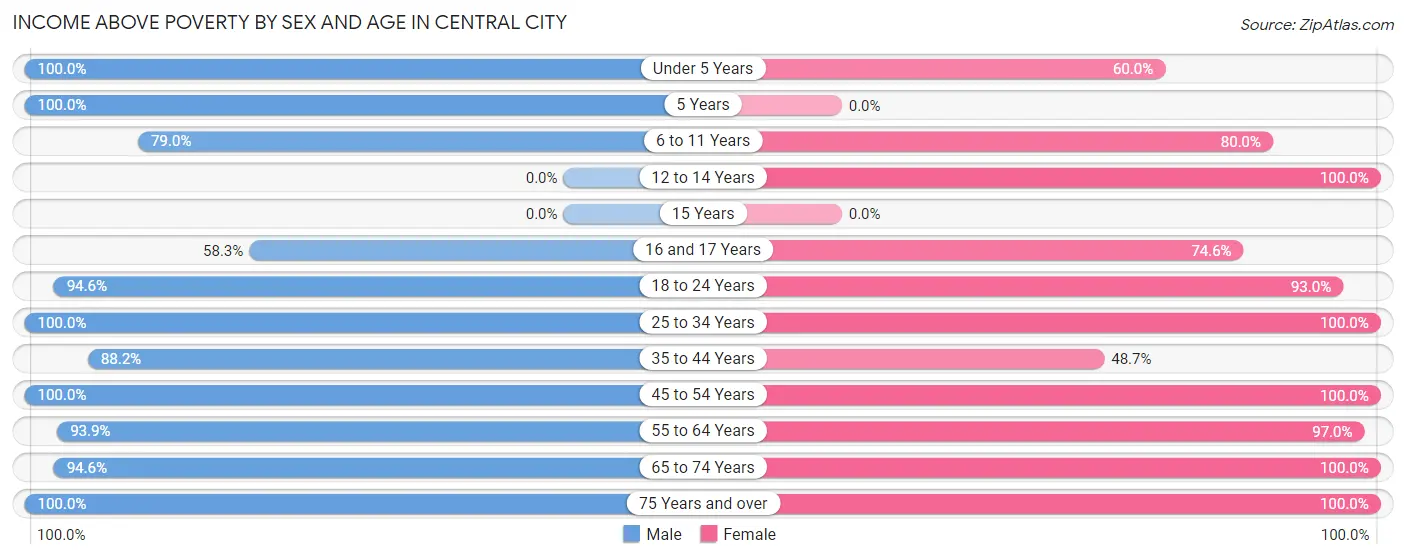
Income Above Poverty by Sex and Age in Central City
According to the poverty statistics in Central City, males aged under 5 years and females aged 12 to 14 years are the age groups that are most secure financially, with 100.0% of males and 100.0% of females in these age groups living above the poverty line.
| Age Bracket | Male | Female |
| Under 5 Years | 22 (100.0%) | 6 (60.0%) |
| 5 Years | 3 (100.0%) | 0 (0.0%) |
| 6 to 11 Years | 15 (78.9%) | 8 (80.0%) |
| 12 to 14 Years | 0 (0.0%) | 28 (100.0%) |
| 15 Years | 0 (0.0%) | 0 (0.0%) |
| 16 and 17 Years | 7 (58.3%) | 41 (74.6%) |
| 18 to 24 Years | 35 (94.6%) | 80 (93.0%) |
| 25 to 34 Years | 16 (100.0%) | 19 (100.0%) |
| 35 to 44 Years | 30 (88.2%) | 19 (48.7%) |
| 45 to 54 Years | 108 (100.0%) | 35 (100.0%) |
| 55 to 64 Years | 31 (93.9%) | 64 (97.0%) |
| 65 to 74 Years | 35 (94.6%) | 17 (100.0%) |
| 75 Years and over | 10 (100.0%) | 11 (100.0%) |
| Total | 312 (92.0%) | 328 (87.2%) |
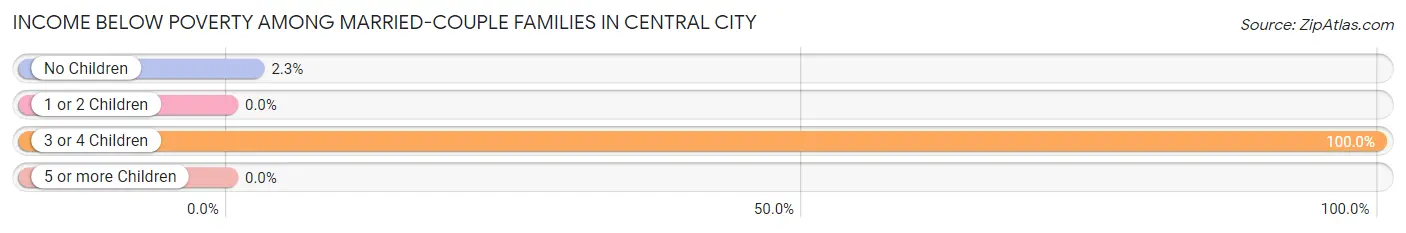
Income Below Poverty Among Married-Couple Families in Central City
The poverty statistics for married-couple families in Central City show that 4.6% or 7 of the total 151 families live below the poverty line. Families with 3 or 4 children have the highest poverty rate of 100.0%, comprising of 5 families. On the other hand, families with 1 or 2 children have the lowest poverty rate of 0.0%, which includes 0 families.
| Children | Above Poverty | Below Poverty |
| No Children | 85 (97.7%) | 2 (2.3%) |
| 1 or 2 Children | 59 (100.0%) | 0 (0.0%) |
| 3 or 4 Children | 0 (0.0%) | 5 (100.0%) |
| 5 or more Children | 0 (0.0%) | 0 (0.0%) |
| Total | 144 (95.4%) | 7 (4.6%) |
Income Below Poverty Among Single-Parent Households in Central City
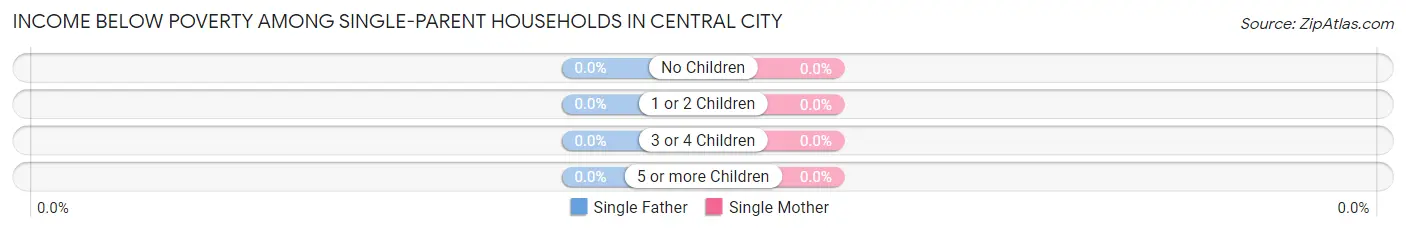
| Children | Single Father | Single Mother |
| No Children | 0 (0.0%) | 0 (0.0%) |
| 1 or 2 Children | 0 (0.0%) | 0 (0.0%) |
| 3 or 4 Children | 0 (0.0%) | 0 (0.0%) |
| 5 or more Children | 0 (0.0%) | 0 (0.0%) |
| Total | 0 (0.0%) | 0 (0.0%) |
Income Below Poverty Among Married-Couple vs Single-Parent Households in Central City
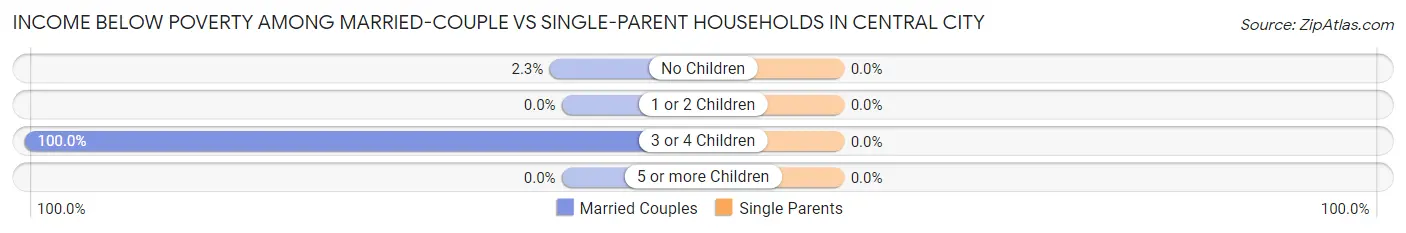
| Children | Married-Couple Families | Single-Parent Households |
| No Children | 2 (2.3%) | 0 (0.0%) |
| 1 or 2 Children | 0 (0.0%) | 0 (0.0%) |
| 3 or 4 Children | 5 (100.0%) | 0 (0.0%) |
| 5 or more Children | 0 (0.0%) | 0 (0.0%) |
| Total | 7 (4.6%) | 0 (0.0%) |
Employment Characteristics in Central City
Employment by Class of Employer in Central City
Among the 395 employed individuals in Central City, private company employees (293 | 74.2%), local government employees (32 | 8.1%), and self-employed (not incorporated) (22 | 5.6%) make up the most common classes of employment.
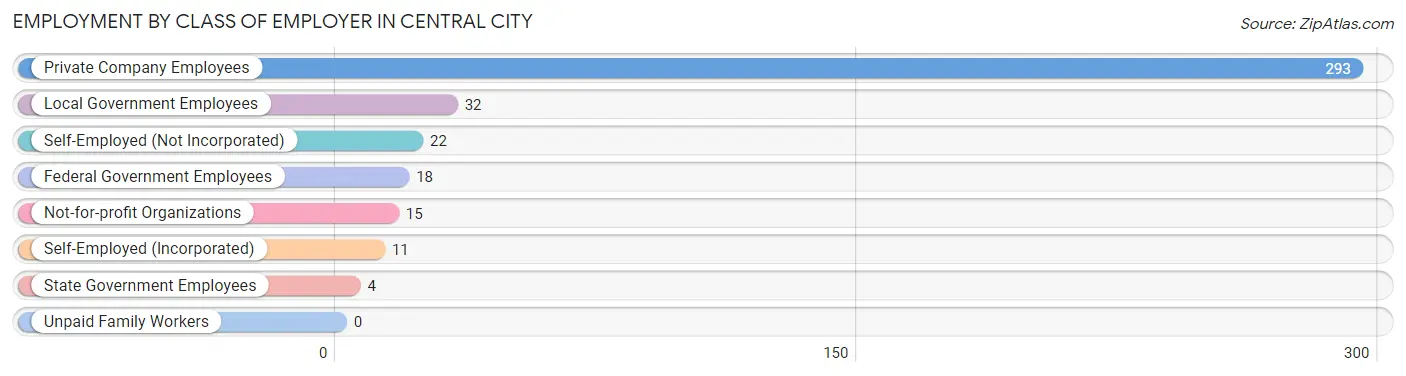
| Employer Class | # Employees | % Employees |
| Private Company Employees | 293 | 74.2% |
| Self-Employed (Incorporated) | 11 | 2.8% |
| Self-Employed (Not Incorporated) | 22 | 5.6% |
| Not-for-profit Organizations | 15 | 3.8% |
| Local Government Employees | 32 | 8.1% |
| State Government Employees | 4 | 1.0% |
| Federal Government Employees | 18 | 4.6% |
| Unpaid Family Workers | 0 | 0.0% |
| Total | 395 | 100.0% |
Employment Status by Age in Central City
According to the labor force statistics for Central City, out of the total population over 16 years of age (615), 67.6% or 416 individuals are in the labor force, with 5.0% or 21 of them unemployed. The age group with the highest labor force participation rate is 25 to 29 years, with 100.0% or 19 individuals in the labor force. Within the labor force, the 35 to 44 years age range has the highest percentage of unemployed individuals, with 23.3% or 14 of them being unemployed.
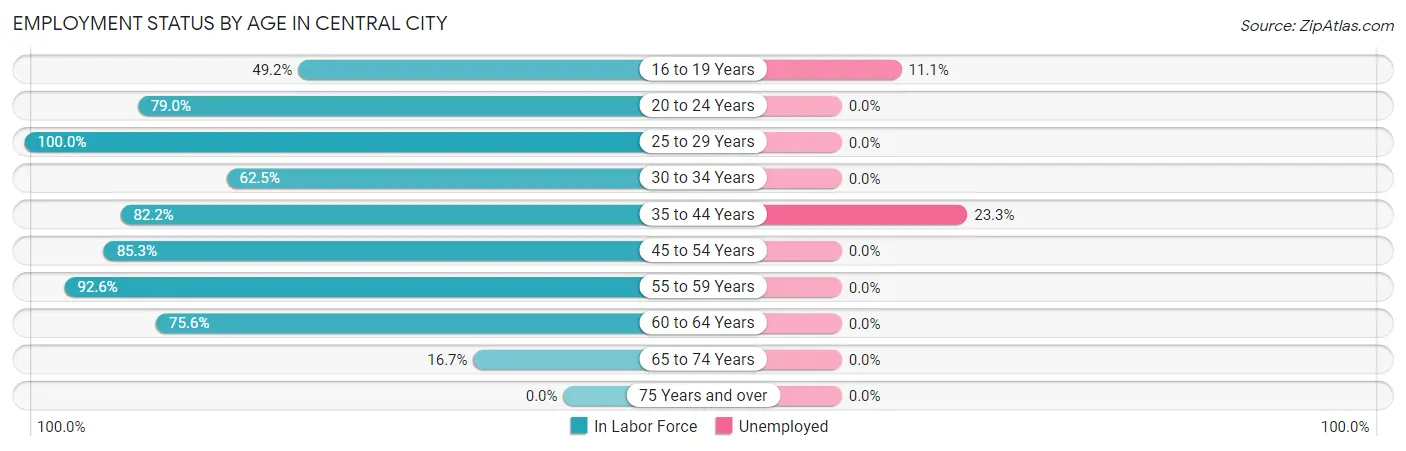
| Age Bracket | In Labor Force | Unemployed |
| 16 to 19 Years | 63 (49.2%) | 7 (11.1%) |
| 20 to 24 Years | 49 (79.0%) | 0 (0.0%) |
| 25 to 29 Years | 19 (100.0%) | 0 (0.0%) |
| 30 to 34 Years | 10 (62.5%) | 0 (0.0%) |
| 35 to 44 Years | 60 (82.2%) | 14 (23.3%) |
| 45 to 54 Years | 122 (85.3%) | 0 (0.0%) |
| 55 to 59 Years | 50 (92.6%) | 0 (0.0%) |
| 60 to 64 Years | 34 (75.6%) | 0 (0.0%) |
| 65 to 74 Years | 9 (16.7%) | 0 (0.0%) |
| 75 Years and over | 0 (0.0%) | 0 (0.0%) |
| Total | 416 (67.6%) | 21 (5.0%) |
Employment Status by Educational Attainment in Central City
According to labor force statistics for Central City, 84.3% of individuals (295) out of the total population between 25 and 64 years of age (350) are in the labor force, with 4.7% or 14 of them being unemployed. The group with the highest labor force participation rate are those with the educational attainment of less than high school, with 100.0% or 2 individuals in the labor force. Within the labor force, individuals with less than high school education have the highest percentage of unemployment, with 100.0% or 2 of them being unemployed.
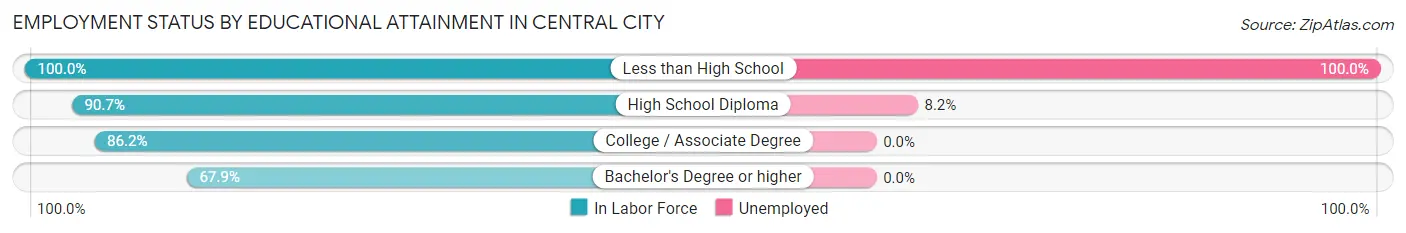
| Educational Attainment | In Labor Force | Unemployed |
| Less than High School | 2 (100.0%) | 2 (100.0%) |
| High School Diploma | 146 (90.7%) | 13 (8.2%) |
| College / Associate Degree | 94 (86.2%) | 0 (0.0%) |
| Bachelor's Degree or higher | 53 (67.9%) | 0 (0.0%) |
| Total | 295 (84.3%) | 16 (4.7%) |
Employment Occupations by Sex in Central City
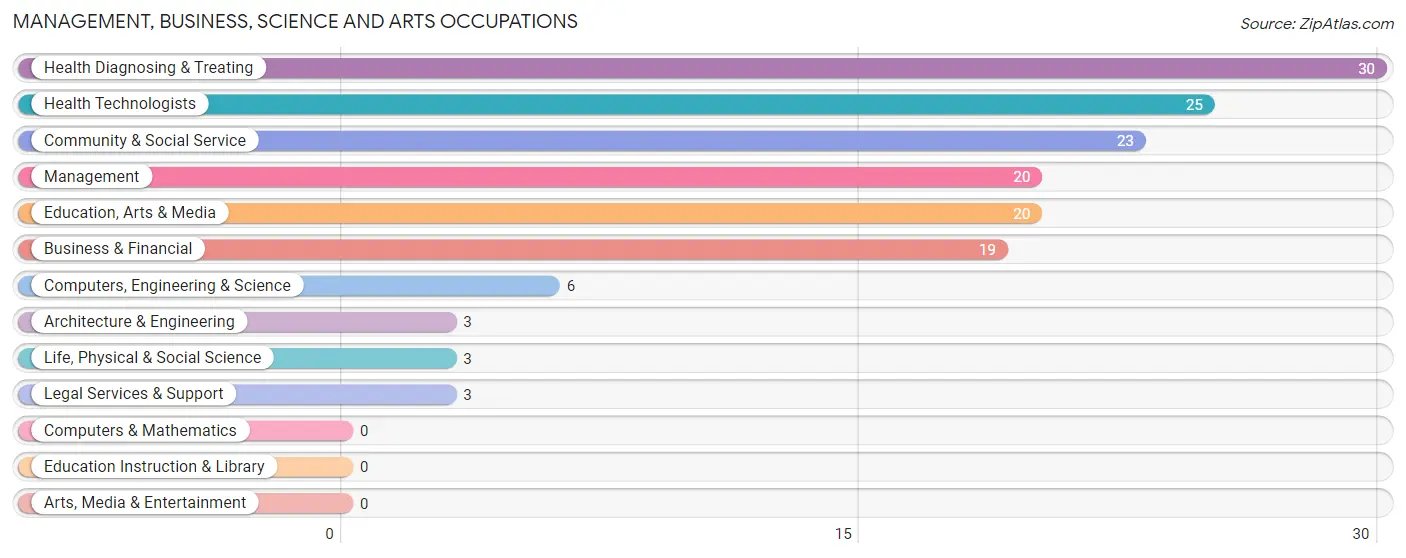
Management, Business, Science and Arts Occupations
The most common Management, Business, Science and Arts occupations in Central City are Health Diagnosing & Treating (30 | 7.6%), Health Technologists (25 | 6.3%), Community & Social Service (23 | 5.8%), Management (20 | 5.1%), and Education, Arts & Media (20 | 5.1%).
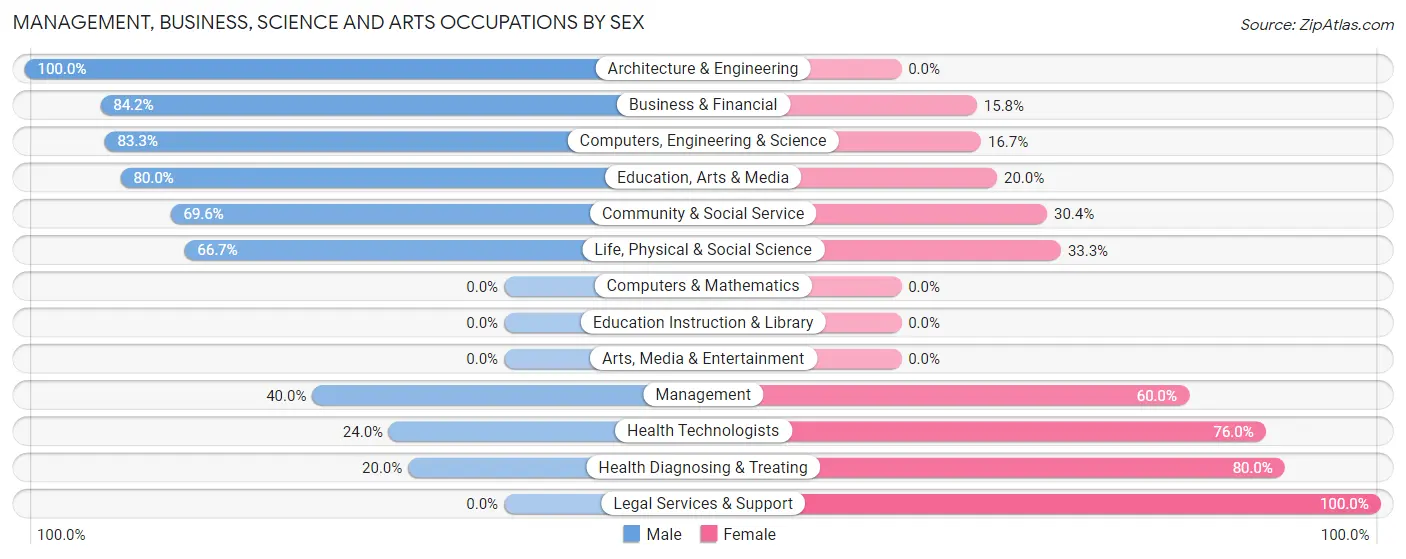
Management, Business, Science and Arts Occupations by Sex
Within the Management, Business, Science and Arts occupations in Central City, the most male-oriented occupations are Architecture & Engineering (100.0%), Business & Financial (84.2%), and Computers, Engineering & Science (83.3%), while the most female-oriented occupations are Legal Services & Support (100.0%), Health Diagnosing & Treating (80.0%), and Health Technologists (76.0%).
| Occupation | Male | Female |
| Management | 8 (40.0%) | 12 (60.0%) |
| Business & Financial | 16 (84.2%) | 3 (15.8%) |
| Computers, Engineering & Science | 5 (83.3%) | 1 (16.7%) |
| Computers & Mathematics | 0 (0.0%) | 0 (0.0%) |
| Architecture & Engineering | 3 (100.0%) | 0 (0.0%) |
| Life, Physical & Social Science | 2 (66.7%) | 1 (33.3%) |
| Community & Social Service | 16 (69.6%) | 7 (30.4%) |
| Education, Arts & Media | 16 (80.0%) | 4 (20.0%) |
| Legal Services & Support | 0 (0.0%) | 3 (100.0%) |
| Education Instruction & Library | 0 (0.0%) | 0 (0.0%) |
| Arts, Media & Entertainment | 0 (0.0%) | 0 (0.0%) |
| Health Diagnosing & Treating | 6 (20.0%) | 24 (80.0%) |
| Health Technologists | 6 (24.0%) | 19 (76.0%) |
| Total (Category) | 51 (52.0%) | 47 (48.0%) |
| Total (Overall) | 219 (55.4%) | 176 (44.6%) |
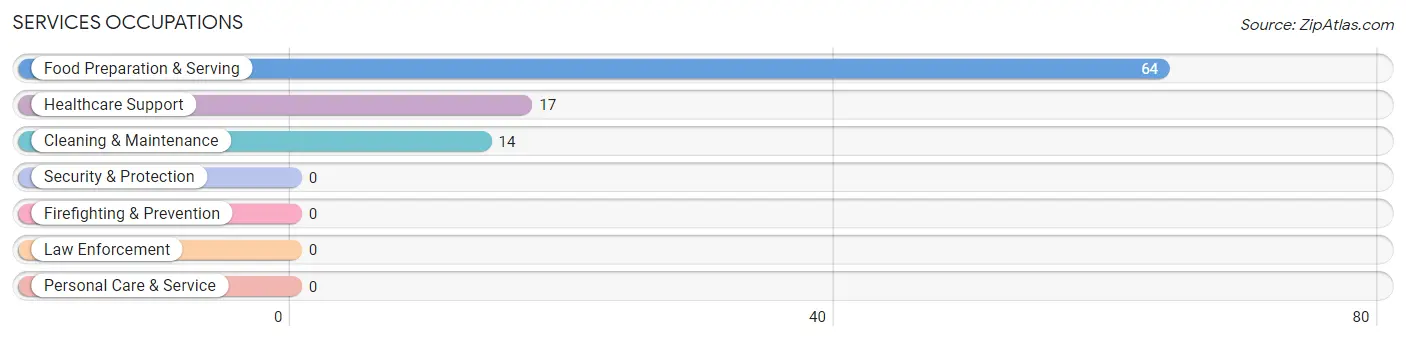
Services Occupations
The most common Services occupations in Central City are Food Preparation & Serving (64 | 16.2%), Healthcare Support (17 | 4.3%), and Cleaning & Maintenance (14 | 3.5%).
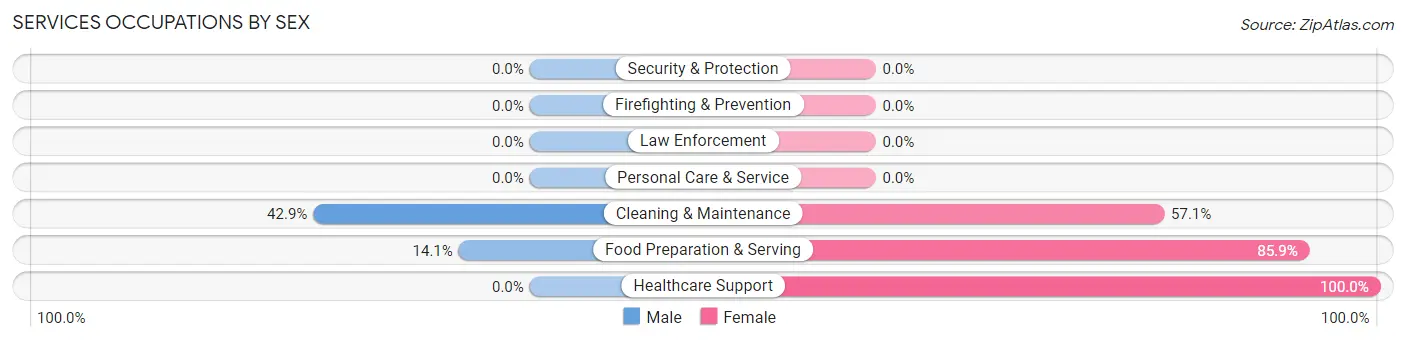
Services Occupations by Sex
Within the Services occupations in Central City, the most male-oriented occupations are Cleaning & Maintenance (42.9%), and Food Preparation & Serving (14.1%), while the most female-oriented occupations are Healthcare Support (100.0%), Food Preparation & Serving (85.9%), and Cleaning & Maintenance (57.1%).
| Occupation | Male | Female |
| Healthcare Support | 0 (0.0%) | 17 (100.0%) |
| Security & Protection | 0 (0.0%) | 0 (0.0%) |
| Firefighting & Prevention | 0 (0.0%) | 0 (0.0%) |
| Law Enforcement | 0 (0.0%) | 0 (0.0%) |
| Food Preparation & Serving | 9 (14.1%) | 55 (85.9%) |
| Cleaning & Maintenance | 6 (42.9%) | 8 (57.1%) |
| Personal Care & Service | 0 (0.0%) | 0 (0.0%) |
| Total (Category) | 15 (15.8%) | 80 (84.2%) |
| Total (Overall) | 219 (55.4%) | 176 (44.6%) |
Sales and Office Occupations
The most common Sales and Office occupations in Central City are Office & Administration (65 | 16.5%), and Sales & Related (20 | 5.1%).

Sales and Office Occupations by Sex

| Occupation | Male | Female |
| Sales & Related | 17 (85.0%) | 3 (15.0%) |
| Office & Administration | 24 (36.9%) | 41 (63.1%) |
| Total (Category) | 41 (48.2%) | 44 (51.8%) |
| Total (Overall) | 219 (55.4%) | 176 (44.6%) |
Natural Resources, Construction and Maintenance Occupations
The most common Natural Resources, Construction and Maintenance occupations in Central City are Installation, Maintenance & Repair (28 | 7.1%), and Construction & Extraction (8 | 2.0%).
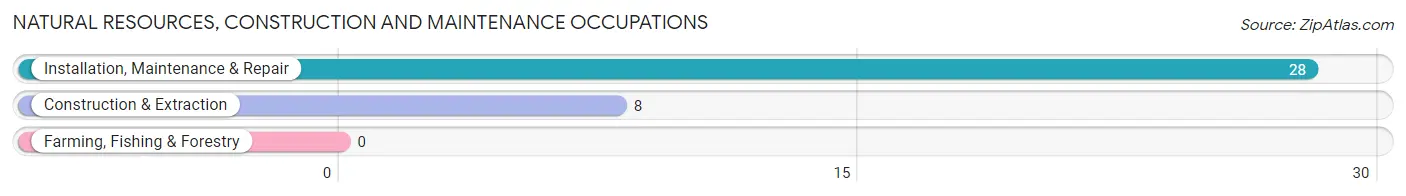
Natural Resources, Construction and Maintenance Occupations by Sex

| Occupation | Male | Female |
| Farming, Fishing & Forestry | 0 (0.0%) | 0 (0.0%) |
| Construction & Extraction | 8 (100.0%) | 0 (0.0%) |
| Installation, Maintenance & Repair | 28 (100.0%) | 0 (0.0%) |
| Total (Category) | 36 (100.0%) | 0 (0.0%) |
| Total (Overall) | 219 (55.4%) | 176 (44.6%) |
Production, Transportation and Moving Occupations
The most common Production, Transportation and Moving occupations in Central City are Transportation (55 | 13.9%), Production (25 | 6.3%), and Material Moving (1 | 0.3%).
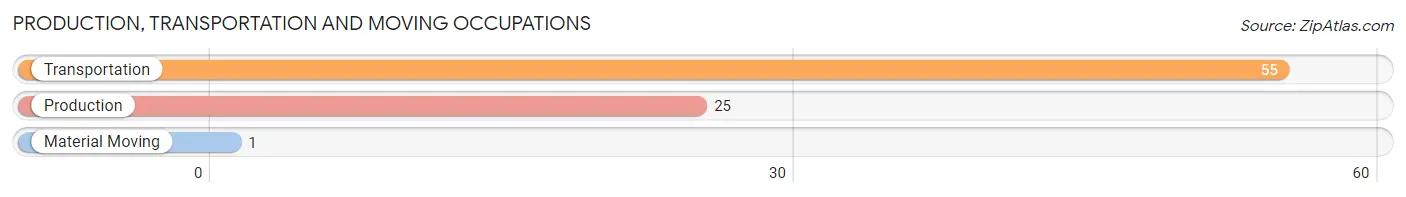
Production, Transportation and Moving Occupations by Sex
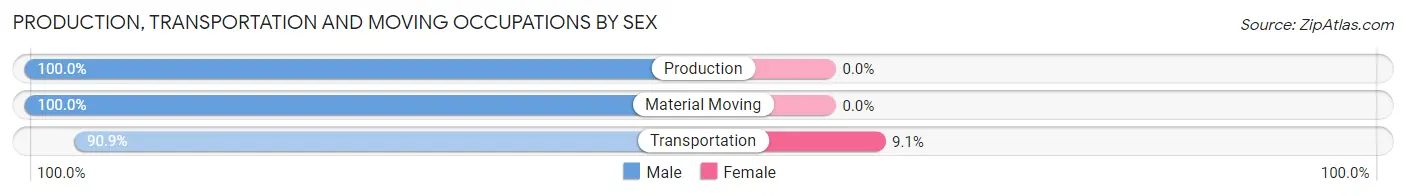
| Occupation | Male | Female |
| Production | 25 (100.0%) | 0 (0.0%) |
| Transportation | 50 (90.9%) | 5 (9.1%) |
| Material Moving | 1 (100.0%) | 0 (0.0%) |
| Total (Category) | 76 (93.8%) | 5 (6.2%) |
| Total (Overall) | 219 (55.4%) | 176 (44.6%) |
Employment Industries by Sex in Central City
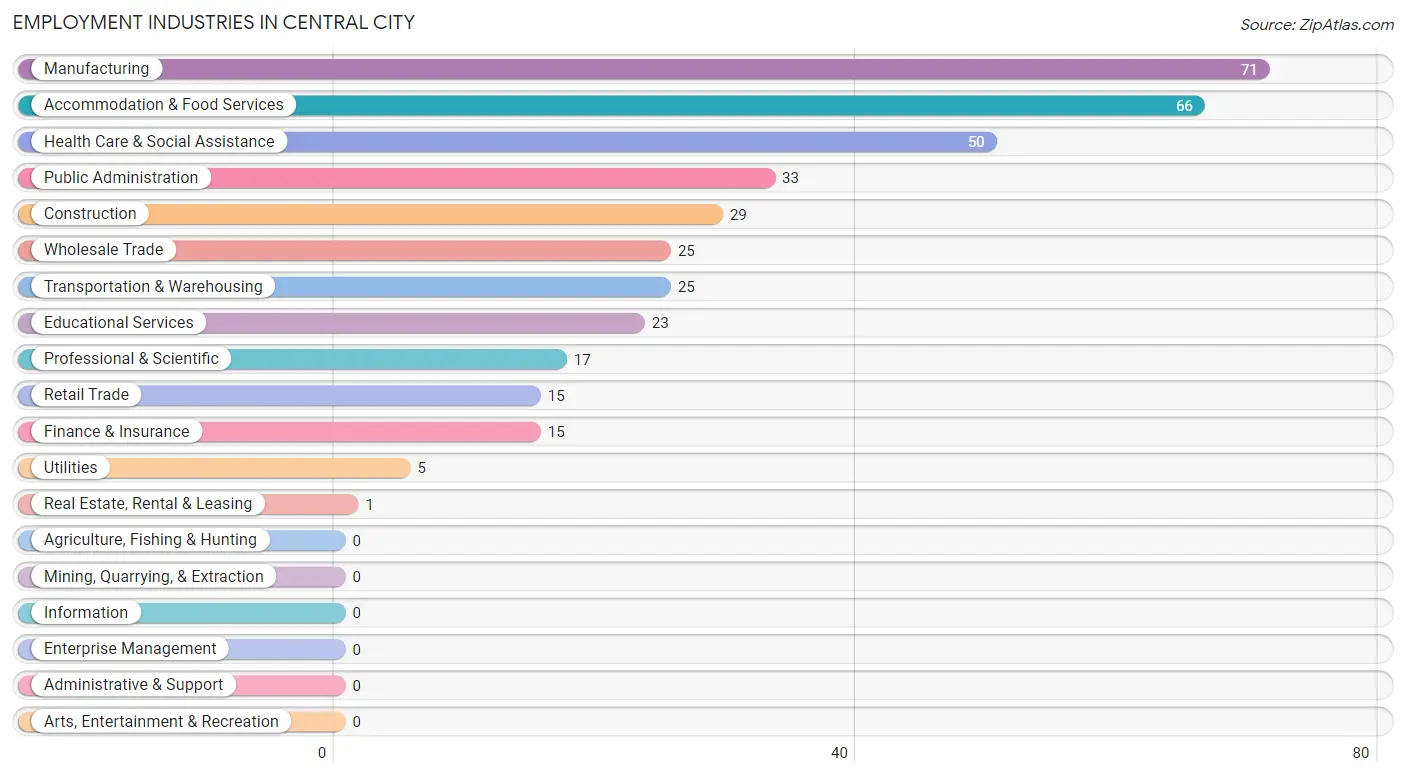
Employment Industries in Central City
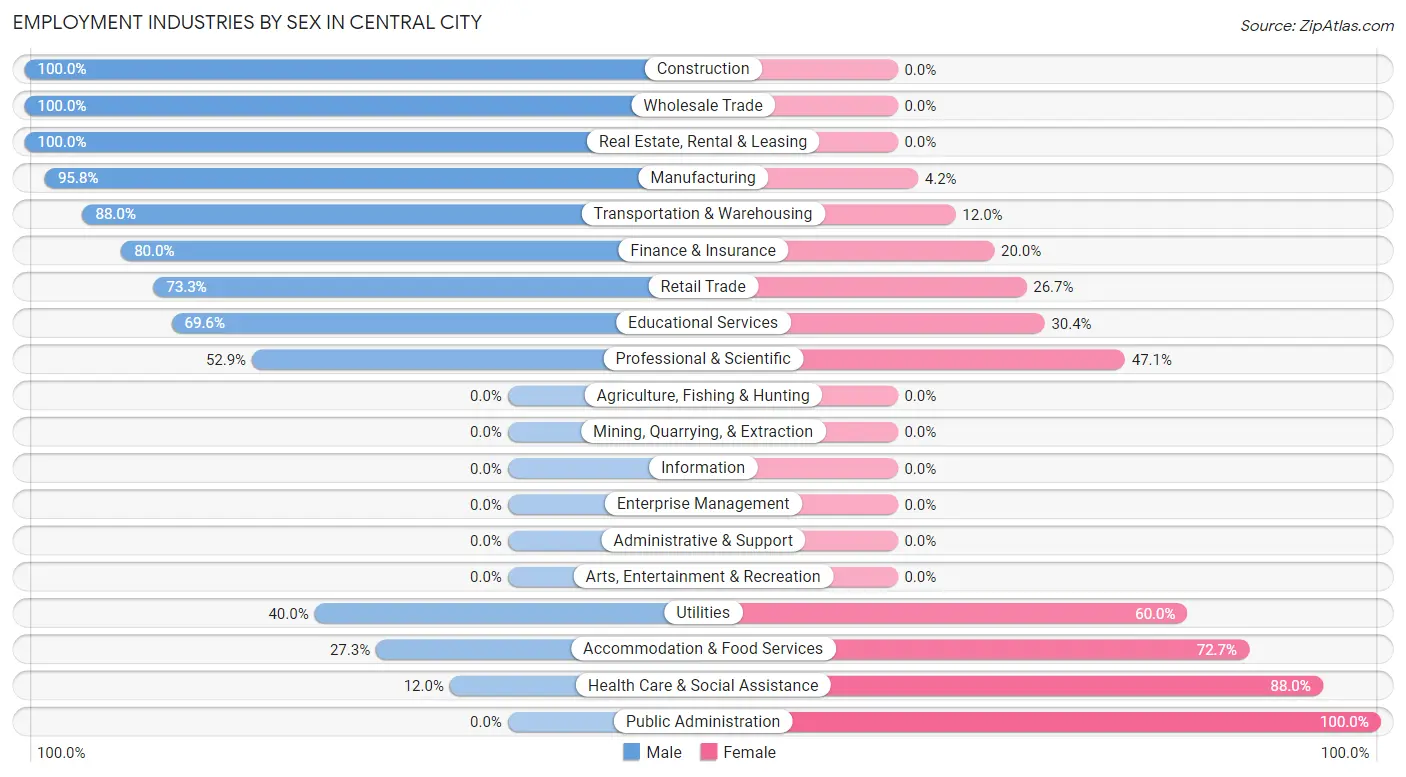
The major employment industries in Central City include Manufacturing (71 | 18.0%), Accommodation & Food Services (66 | 16.7%), Health Care & Social Assistance (50 | 12.7%), Public Administration (33 | 8.4%), and Construction (29 | 7.3%).
Employment Industries by Sex in Central City
The Central City industries that see more men than women are Construction (100.0%), Wholesale Trade (100.0%), and Real Estate, Rental & Leasing (100.0%), whereas the industries that tend to have a higher number of women are Public Administration (100.0%), Health Care & Social Assistance (88.0%), and Accommodation & Food Services (72.7%).
| Industry | Male | Female |
| Agriculture, Fishing & Hunting | 0 (0.0%) | 0 (0.0%) |
| Mining, Quarrying, & Extraction | 0 (0.0%) | 0 (0.0%) |
| Construction | 29 (100.0%) | 0 (0.0%) |
| Manufacturing | 68 (95.8%) | 3 (4.2%) |
| Wholesale Trade | 25 (100.0%) | 0 (0.0%) |
| Retail Trade | 11 (73.3%) | 4 (26.7%) |
| Transportation & Warehousing | 22 (88.0%) | 3 (12.0%) |
| Utilities | 2 (40.0%) | 3 (60.0%) |
| Information | 0 (0.0%) | 0 (0.0%) |
| Finance & Insurance | 12 (80.0%) | 3 (20.0%) |
| Real Estate, Rental & Leasing | 1 (100.0%) | 0 (0.0%) |
| Professional & Scientific | 9 (52.9%) | 8 (47.1%) |
| Enterprise Management | 0 (0.0%) | 0 (0.0%) |
| Administrative & Support | 0 (0.0%) | 0 (0.0%) |
| Educational Services | 16 (69.6%) | 7 (30.4%) |
| Health Care & Social Assistance | 6 (12.0%) | 44 (88.0%) |
| Arts, Entertainment & Recreation | 0 (0.0%) | 0 (0.0%) |
| Accommodation & Food Services | 18 (27.3%) | 48 (72.7%) |
| Public Administration | 0 (0.0%) | 33 (100.0%) |
| Total | 219 (55.4%) | 176 (44.6%) |
Education in Central City
School Enrollment in Central City
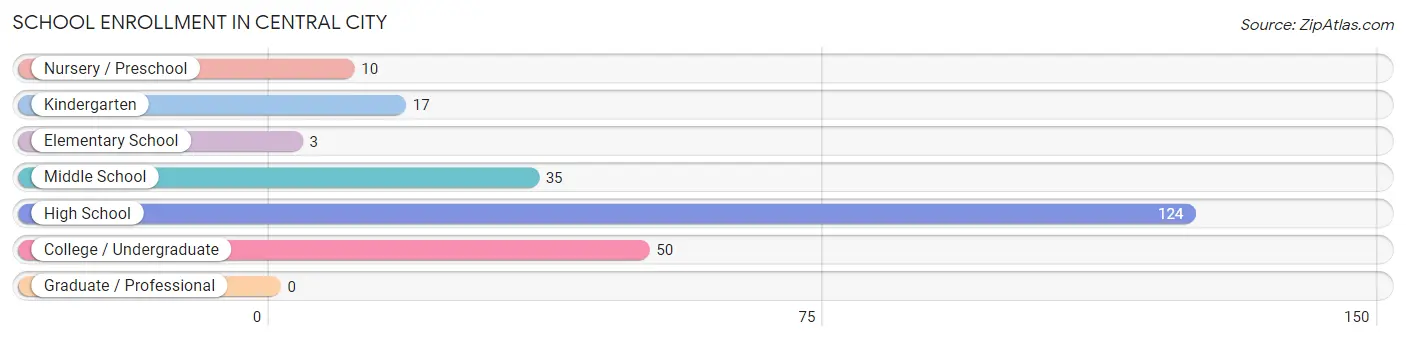
The most common levels of schooling among the 239 students in Central City are high school (124 | 51.9%), college / undergraduate (50 | 20.9%), and middle school (35 | 14.6%).
| School Level | # Students | % Students |
| Nursery / Preschool | 10 | 4.2% |
| Kindergarten | 17 | 7.1% |
| Elementary School | 3 | 1.3% |
| Middle School | 35 | 14.6% |
| High School | 124 | 51.9% |
| College / Undergraduate | 50 | 20.9% |
| Graduate / Professional | 0 | 0.0% |
| Total | 239 | 100.0% |
School Enrollment by Age by Funding Source in Central City
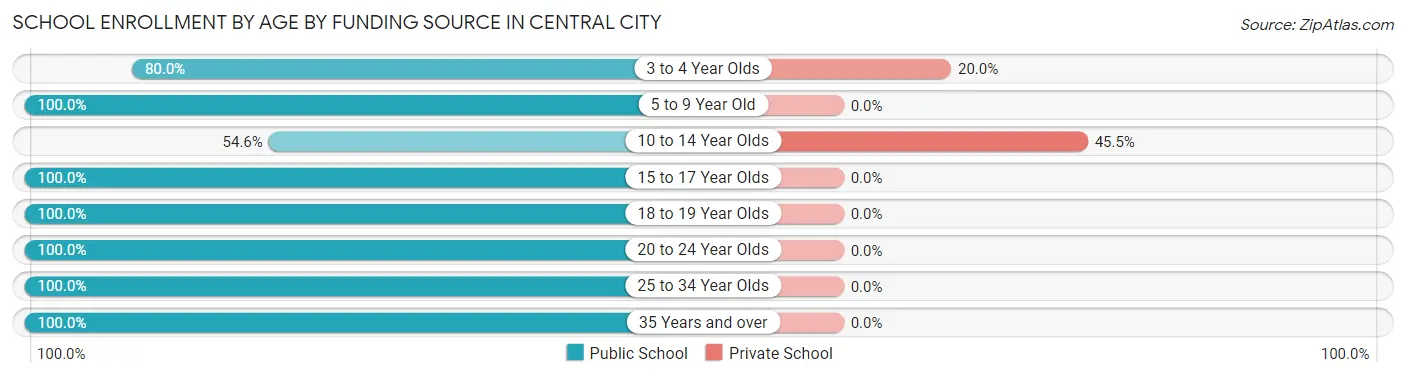
Out of a total of 239 students who are enrolled in schools in Central City, 22 (9.2%) attend a private institution, while the remaining 217 (90.8%) are enrolled in public schools. The age group of 10 to 14 year olds has the highest likelihood of being enrolled in private schools, with 20 (45.5% in the age bracket) enrolled. Conversely, the age group of 5 to 9 year old has the lowest likelihood of being enrolled in a private school, with 20 (100.0% in the age bracket) attending a public institution.
| Age Bracket | Public School | Private School |
| 3 to 4 Year Olds | 8 (80.0%) | 2 (20.0%) |
| 5 to 9 Year Old | 20 (100.0%) | 0 (0.0%) |
| 10 to 14 Year Olds | 24 (54.5%) | 20 (45.5%) |
| 15 to 17 Year Olds | 71 (100.0%) | 0 (0.0%) |
| 18 to 19 Year Olds | 56 (100.0%) | 0 (0.0%) |
| 20 to 24 Year Olds | 25 (100.0%) | 0 (0.0%) |
| 25 to 34 Year Olds | 3 (100.0%) | 0 (0.0%) |
| 35 Years and over | 10 (100.0%) | 0 (0.0%) |
| Total | 217 (90.8%) | 22 (9.2%) |
Educational Attainment by Field of Study in Central City
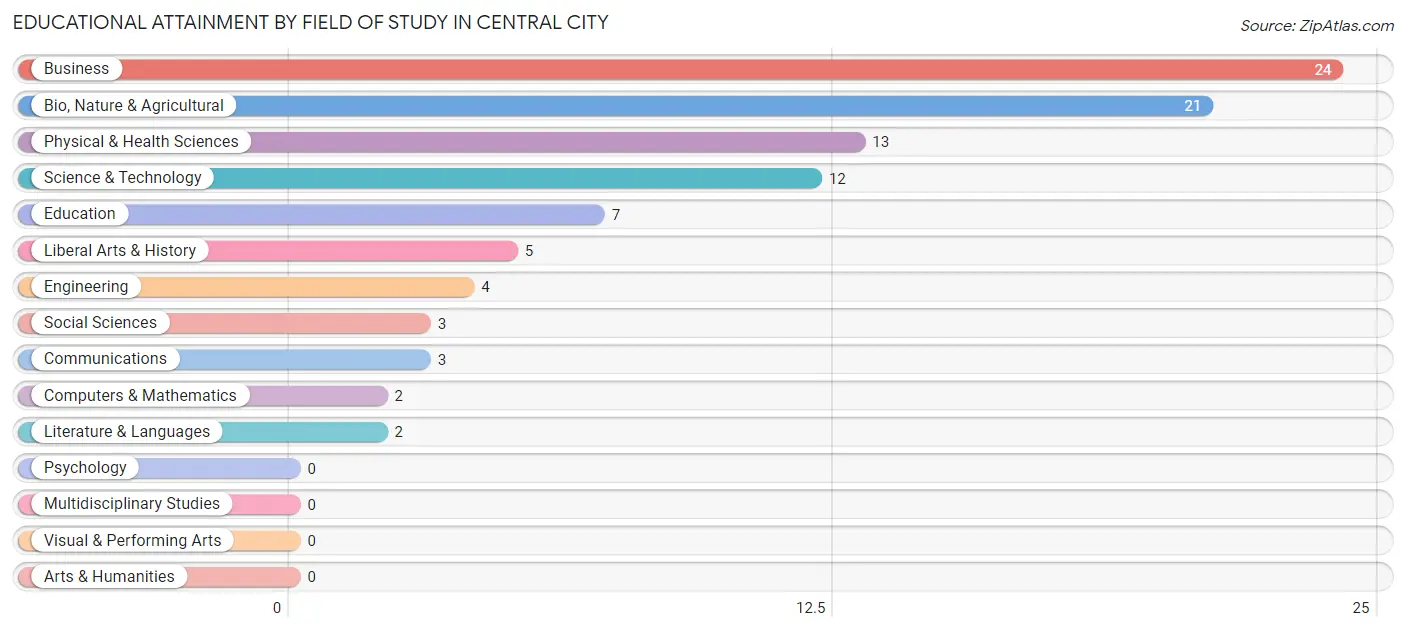
Business (24 | 25.0%), bio, nature & agricultural (21 | 21.9%), physical & health sciences (13 | 13.5%), science & technology (12 | 12.5%), and education (7 | 7.3%) are the most common fields of study among 96 individuals in Central City who have obtained a bachelor's degree or higher.
| Field of Study | # Graduates | % Graduates |
| Computers & Mathematics | 2 | 2.1% |
| Bio, Nature & Agricultural | 21 | 21.9% |
| Physical & Health Sciences | 13 | 13.5% |
| Psychology | 0 | 0.0% |
| Social Sciences | 3 | 3.1% |
| Engineering | 4 | 4.2% |
| Multidisciplinary Studies | 0 | 0.0% |
| Science & Technology | 12 | 12.5% |
| Business | 24 | 25.0% |
| Education | 7 | 7.3% |
| Literature & Languages | 2 | 2.1% |
| Liberal Arts & History | 5 | 5.2% |
| Visual & Performing Arts | 0 | 0.0% |
| Communications | 3 | 3.1% |
| Arts & Humanities | 0 | 0.0% |
| Total | 96 | 100.0% |
Transportation & Commute in Central City
Vehicle Availability by Sex in Central City
The most prevalent vehicle ownership categories in Central City are males with 3 vehicles (133, accounting for 60.7%) and females with 3 vehicles (106, making up 75.6%).
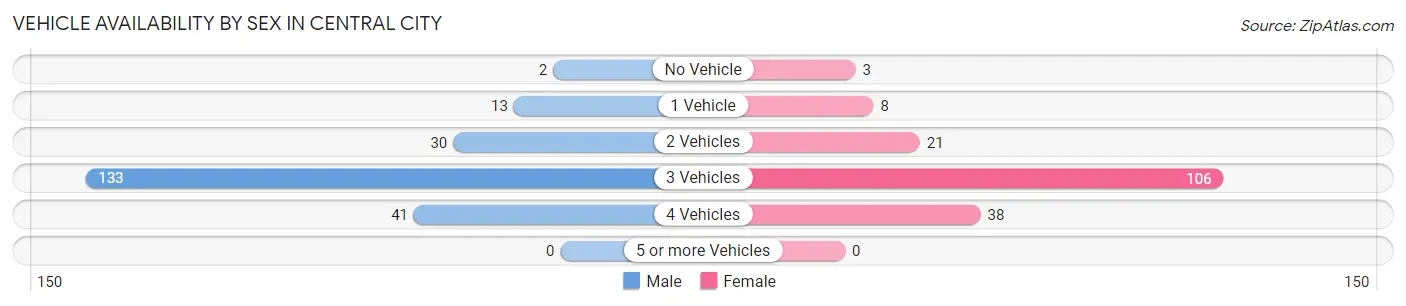
| Vehicles Available | Male | Female |
| No Vehicle | 2 (0.9%) | 3 (1.7%) |
| 1 Vehicle | 13 (5.9%) | 8 (4.5%) |
| 2 Vehicles | 30 (13.7%) | 21 (11.9%) |
| 3 Vehicles | 133 (60.7%) | 106 (60.2%) |
| 4 Vehicles | 41 (18.7%) | 38 (21.6%) |
| 5 or more Vehicles | 0 (0.0%) | 0 (0.0%) |
| Total | 219 (100.0%) | 176 (100.0%) |
Commute Time in Central City
The most frequently occuring commute durations in Central City are 20 to 24 minutes (158 commuters, 42.7%), 15 to 19 minutes (43 commuters, 11.6%), and 30 to 34 minutes (38 commuters, 10.3%).
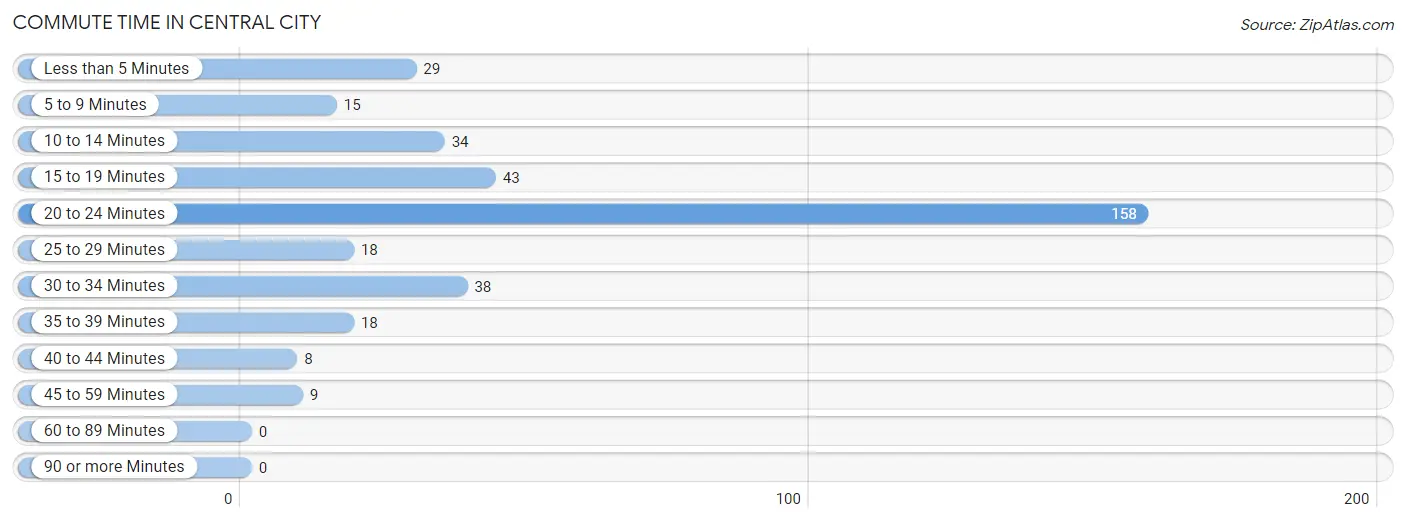
| Commute Time | # Commuters | % Commuters |
| Less than 5 Minutes | 29 | 7.8% |
| 5 to 9 Minutes | 15 | 4.1% |
| 10 to 14 Minutes | 34 | 9.2% |
| 15 to 19 Minutes | 43 | 11.6% |
| 20 to 24 Minutes | 158 | 42.7% |
| 25 to 29 Minutes | 18 | 4.9% |
| 30 to 34 Minutes | 38 | 10.3% |
| 35 to 39 Minutes | 18 | 4.9% |
| 40 to 44 Minutes | 8 | 2.2% |
| 45 to 59 Minutes | 9 | 2.4% |
| 60 to 89 Minutes | 0 | 0.0% |
| 90 or more Minutes | 0 | 0.0% |
Commute Time by Sex in Central City
The most common commute times in Central City are 20 to 24 minutes (94 commuters, 45.4%) for males and 20 to 24 minutes (64 commuters, 39.3%) for females.
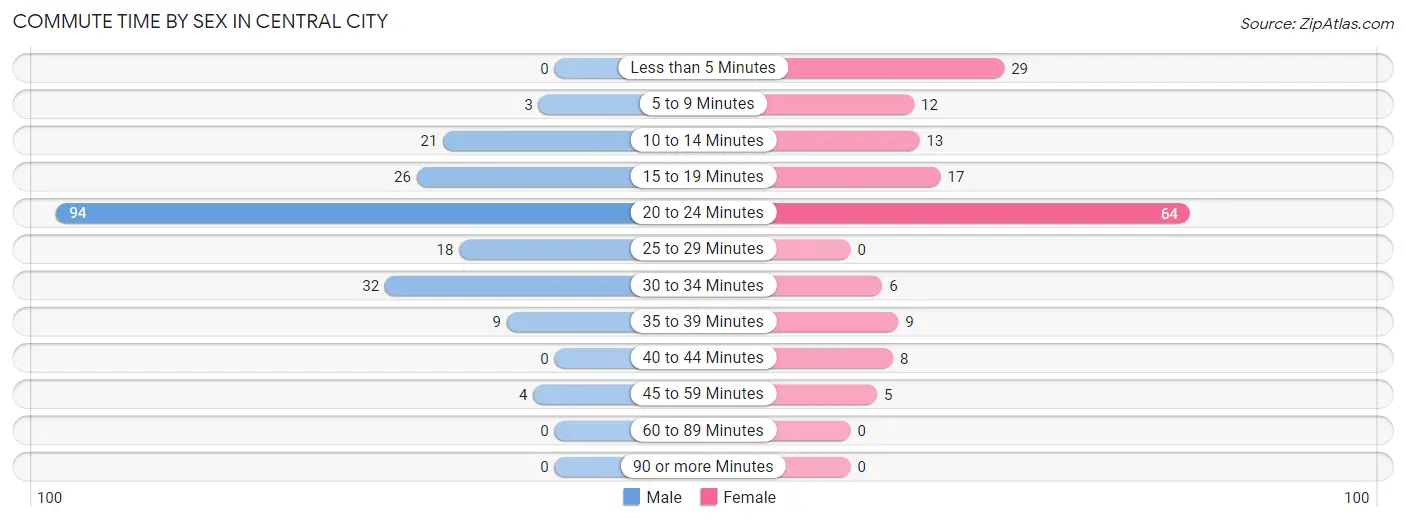
| Commute Time | Male | Female |
| Less than 5 Minutes | 0 (0.0%) | 29 (17.8%) |
| 5 to 9 Minutes | 3 (1.5%) | 12 (7.4%) |
| 10 to 14 Minutes | 21 (10.1%) | 13 (8.0%) |
| 15 to 19 Minutes | 26 (12.6%) | 17 (10.4%) |
| 20 to 24 Minutes | 94 (45.4%) | 64 (39.3%) |
| 25 to 29 Minutes | 18 (8.7%) | 0 (0.0%) |
| 30 to 34 Minutes | 32 (15.5%) | 6 (3.7%) |
| 35 to 39 Minutes | 9 (4.3%) | 9 (5.5%) |
| 40 to 44 Minutes | 0 (0.0%) | 8 (4.9%) |
| 45 to 59 Minutes | 4 (1.9%) | 5 (3.1%) |
| 60 to 89 Minutes | 0 (0.0%) | 0 (0.0%) |
| 90 or more Minutes | 0 (0.0%) | 0 (0.0%) |
Time of Departure to Work by Sex in Central City
The most frequent times of departure to work in Central City are 12:00 AM to 4:59 AM (49, 23.7%) for males and 4:00 PM to 11:59 PM (52, 31.9%) for females.
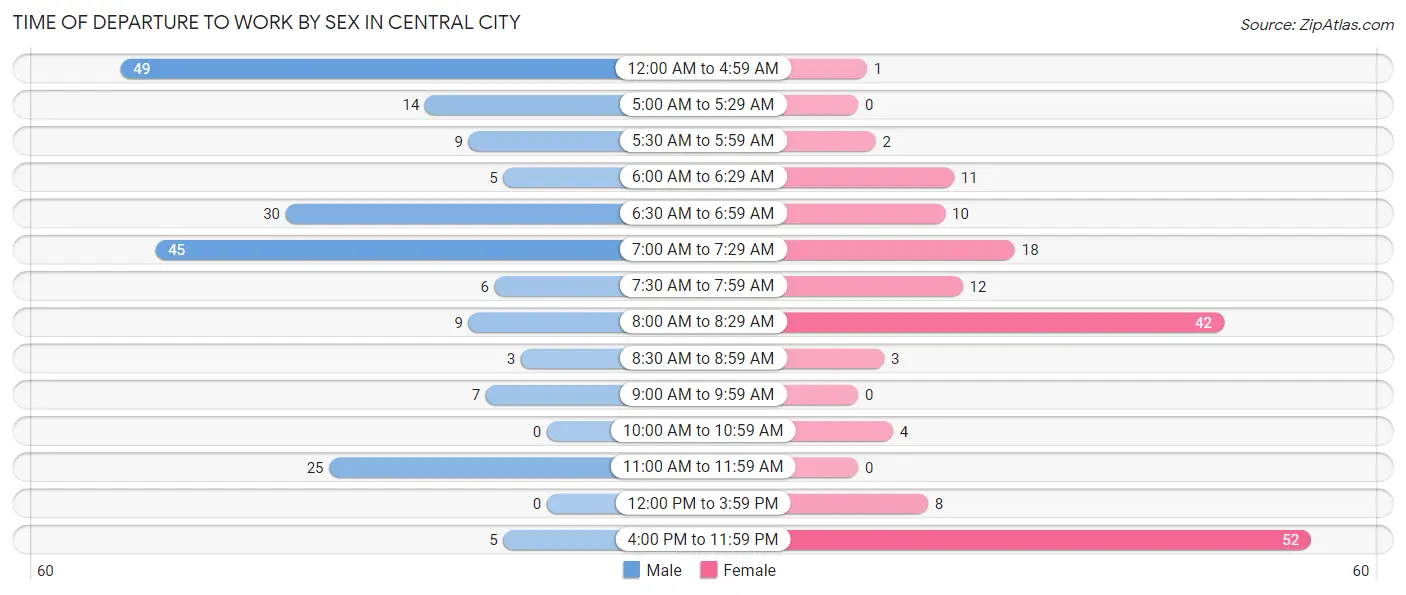
| Time of Departure | Male | Female |
| 12:00 AM to 4:59 AM | 49 (23.7%) | 1 (0.6%) |
| 5:00 AM to 5:29 AM | 14 (6.8%) | 0 (0.0%) |
| 5:30 AM to 5:59 AM | 9 (4.3%) | 2 (1.2%) |
| 6:00 AM to 6:29 AM | 5 (2.4%) | 11 (6.8%) |
| 6:30 AM to 6:59 AM | 30 (14.5%) | 10 (6.1%) |
| 7:00 AM to 7:29 AM | 45 (21.7%) | 18 (11.0%) |
| 7:30 AM to 7:59 AM | 6 (2.9%) | 12 (7.4%) |
| 8:00 AM to 8:29 AM | 9 (4.3%) | 42 (25.8%) |
| 8:30 AM to 8:59 AM | 3 (1.5%) | 3 (1.8%) |
| 9:00 AM to 9:59 AM | 7 (3.4%) | 0 (0.0%) |
| 10:00 AM to 10:59 AM | 0 (0.0%) | 4 (2.5%) |
| 11:00 AM to 11:59 AM | 25 (12.1%) | 0 (0.0%) |
| 12:00 PM to 3:59 PM | 0 (0.0%) | 8 (4.9%) |
| 4:00 PM to 11:59 PM | 5 (2.4%) | 52 (31.9%) |
| Total | 207 (100.0%) | 163 (100.0%) |
Housing Occupancy in Central City
Occupancy by Ownership in Central City
Of the total 239 dwellings in Central City, owner-occupied units account for 220 (92.0%), while renter-occupied units make up 19 (8.0%).
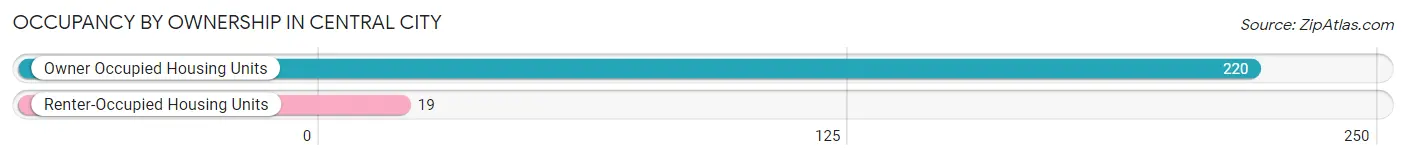
| Occupancy | # Housing Units | % Housing Units |
| Owner Occupied Housing Units | 220 | 92.0% |
| Renter-Occupied Housing Units | 19 | 8.0% |
| Total Occupied Housing Units | 239 | 100.0% |
Occupancy by Household Size in Central City
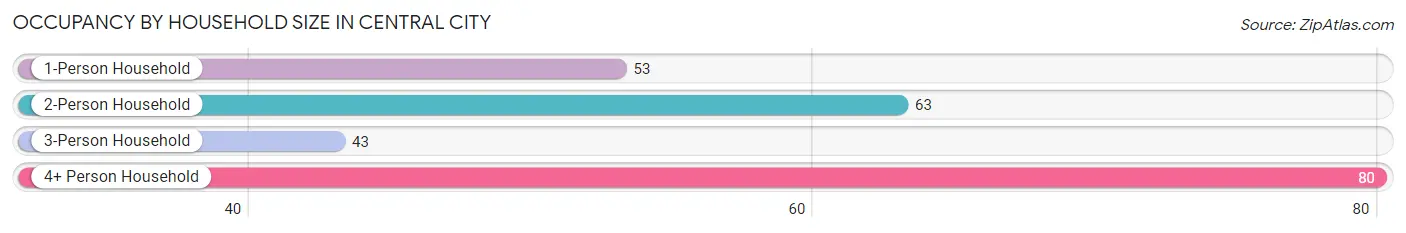
| Household Size | # Housing Units | % Housing Units |
| 1-Person Household | 53 | 22.2% |
| 2-Person Household | 63 | 26.4% |
| 3-Person Household | 43 | 18.0% |
| 4+ Person Household | 80 | 33.5% |
| Total Housing Units | 239 | 100.0% |
Occupancy by Ownership by Household Size in Central City
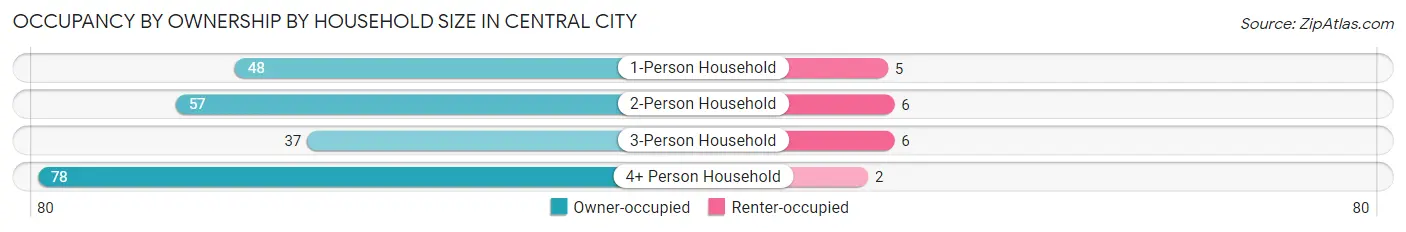
| Household Size | Owner-occupied | Renter-occupied |
| 1-Person Household | 48 (90.6%) | 5 (9.4%) |
| 2-Person Household | 57 (90.5%) | 6 (9.5%) |
| 3-Person Household | 37 (86.1%) | 6 (14.0%) |
| 4+ Person Household | 78 (97.5%) | 2 (2.5%) |
| Total Housing Units | 220 (92.0%) | 19 (8.0%) |
Occupancy by Educational Attainment in Central City
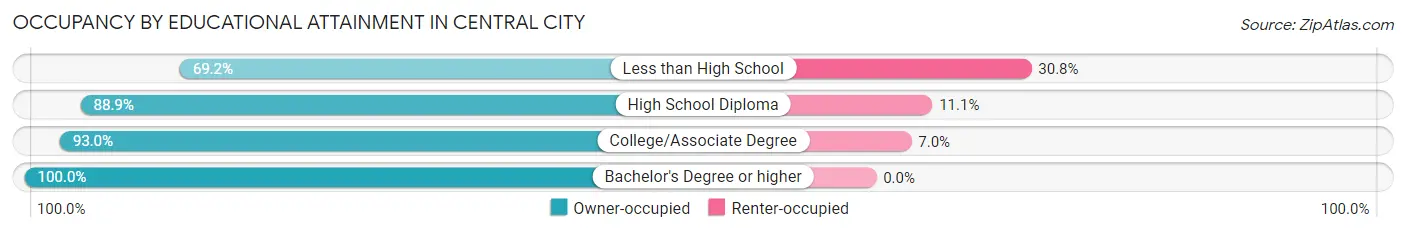
| Household Size | Owner-occupied | Renter-occupied |
| Less than High School | 9 (69.2%) | 4 (30.8%) |
| High School Diploma | 72 (88.9%) | 9 (11.1%) |
| College/Associate Degree | 80 (93.0%) | 6 (7.0%) |
| Bachelor's Degree or higher | 59 (100.0%) | 0 (0.0%) |
Occupancy by Age of Householder in Central City
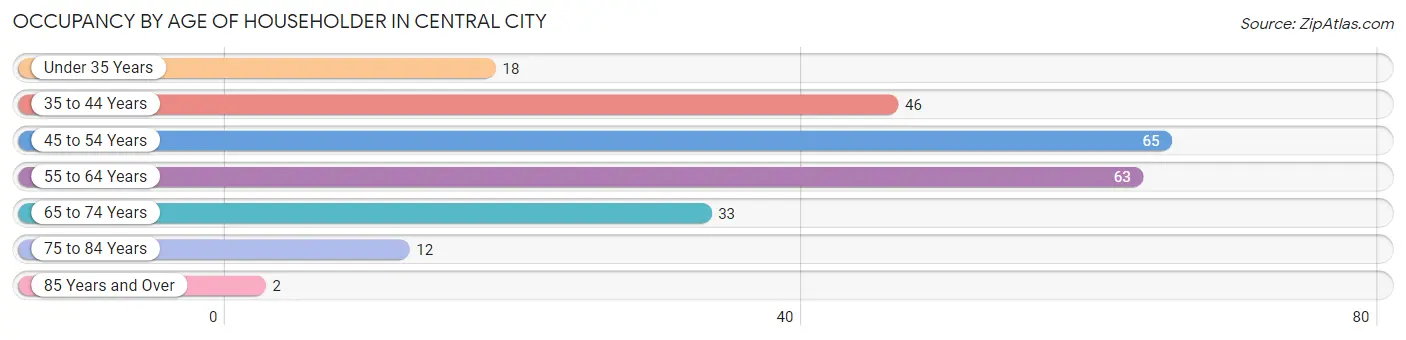
| Age Bracket | # Households | % Households |
| Under 35 Years | 18 | 7.5% |
| 35 to 44 Years | 46 | 19.3% |
| 45 to 54 Years | 65 | 27.2% |
| 55 to 64 Years | 63 | 26.4% |
| 65 to 74 Years | 33 | 13.8% |
| 75 to 84 Years | 12 | 5.0% |
| 85 Years and Over | 2 | 0.8% |
| Total | 239 | 100.0% |
Housing Finances in Central City
Median Income by Occupancy in Central City
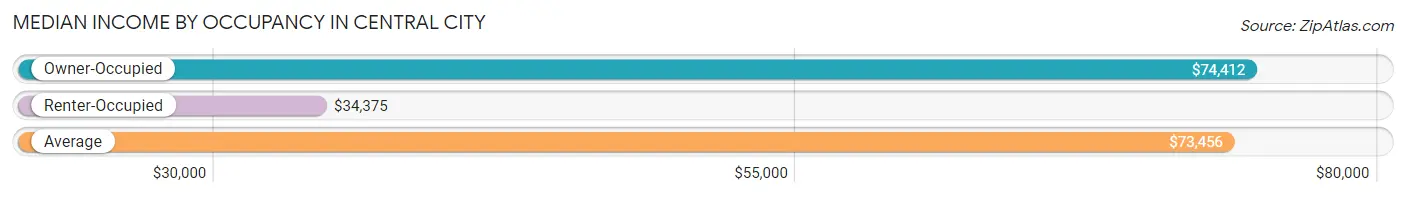
| Occupancy Type | # Households | Median Income |
| Owner-Occupied | 220 (92.0%) | $74,412 |
| Renter-Occupied | 19 (8.0%) | $34,375 |
| Average | 239 (100.0%) | $73,456 |
Occupancy by Householder Income Bracket in Central City
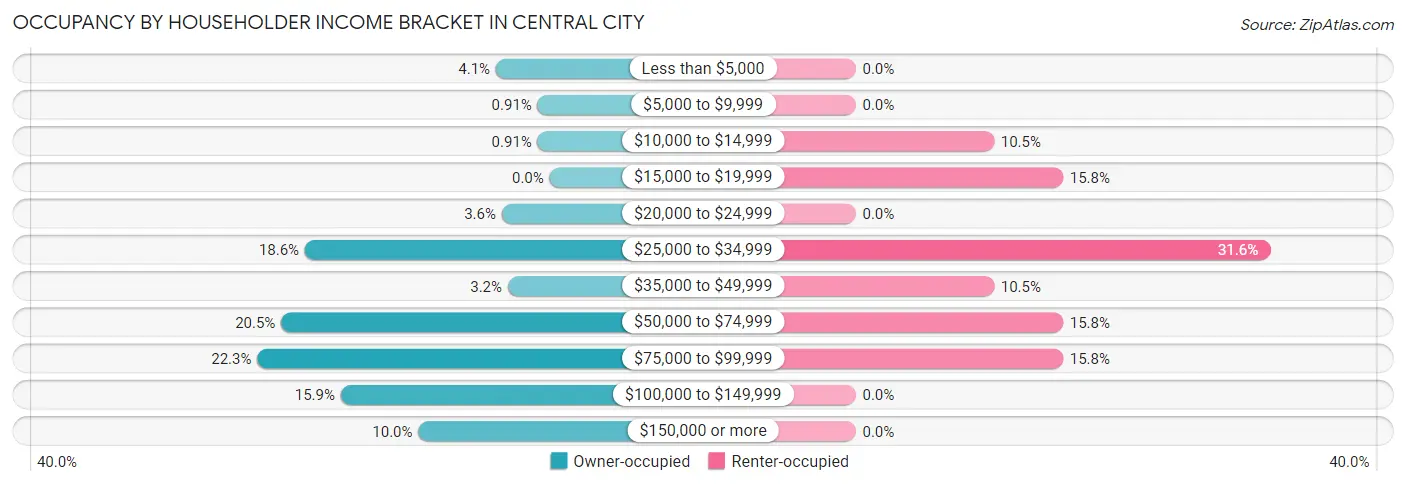
| Income Bracket | Owner-occupied | Renter-occupied |
| Less than $5,000 | 9 (4.1%) | 0 (0.0%) |
| $5,000 to $9,999 | 2 (0.9%) | 0 (0.0%) |
| $10,000 to $14,999 | 2 (0.9%) | 2 (10.5%) |
| $15,000 to $19,999 | 0 (0.0%) | 3 (15.8%) |
| $20,000 to $24,999 | 8 (3.6%) | 0 (0.0%) |
| $25,000 to $34,999 | 41 (18.6%) | 6 (31.6%) |
| $35,000 to $49,999 | 7 (3.2%) | 2 (10.5%) |
| $50,000 to $74,999 | 45 (20.4%) | 3 (15.8%) |
| $75,000 to $99,999 | 49 (22.3%) | 3 (15.8%) |
| $100,000 to $149,999 | 35 (15.9%) | 0 (0.0%) |
| $150,000 or more | 22 (10.0%) | 0 (0.0%) |
| Total | 220 (100.0%) | 19 (100.0%) |
Monthly Housing Cost Tiers in Central City
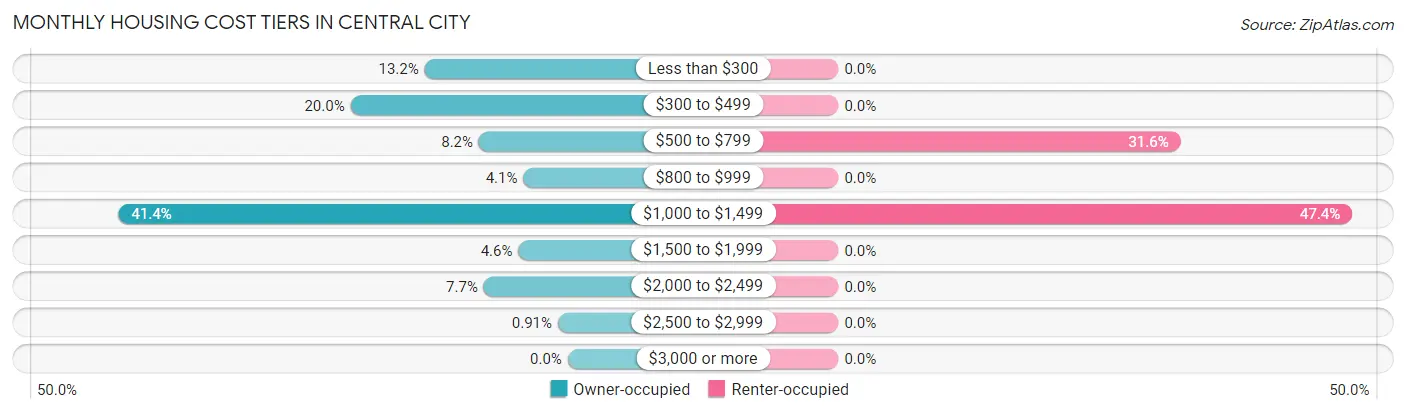
| Monthly Cost | Owner-occupied | Renter-occupied |
| Less than $300 | 29 (13.2%) | 0 (0.0%) |
| $300 to $499 | 44 (20.0%) | 0 (0.0%) |
| $500 to $799 | 18 (8.2%) | 6 (31.6%) |
| $800 to $999 | 9 (4.1%) | 0 (0.0%) |
| $1,000 to $1,499 | 91 (41.4%) | 9 (47.4%) |
| $1,500 to $1,999 | 10 (4.5%) | 0 (0.0%) |
| $2,000 to $2,499 | 17 (7.7%) | 0 (0.0%) |
| $2,500 to $2,999 | 2 (0.9%) | 0 (0.0%) |
| $3,000 or more | 0 (0.0%) | 0 (0.0%) |
| Total | 220 (100.0%) | 19 (100.0%) |
Physical Housing Characteristics in Central City
Housing Structures in Central City
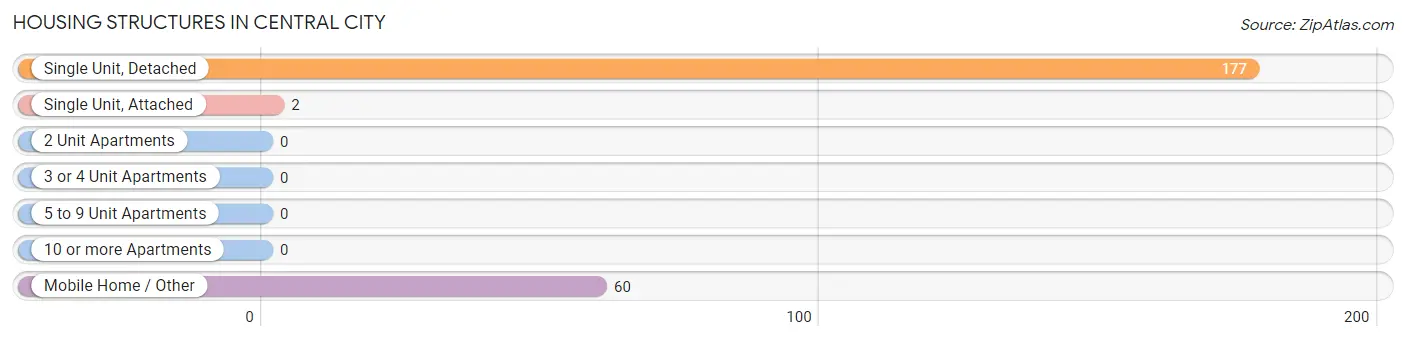
| Structure Type | # Housing Units | % Housing Units |
| Single Unit, Detached | 177 | 74.1% |
| Single Unit, Attached | 2 | 0.8% |
| 2 Unit Apartments | 0 | 0.0% |
| 3 or 4 Unit Apartments | 0 | 0.0% |
| 5 to 9 Unit Apartments | 0 | 0.0% |
| 10 or more Apartments | 0 | 0.0% |
| Mobile Home / Other | 60 | 25.1% |
| Total | 239 | 100.0% |
Housing Structures by Occupancy in Central City
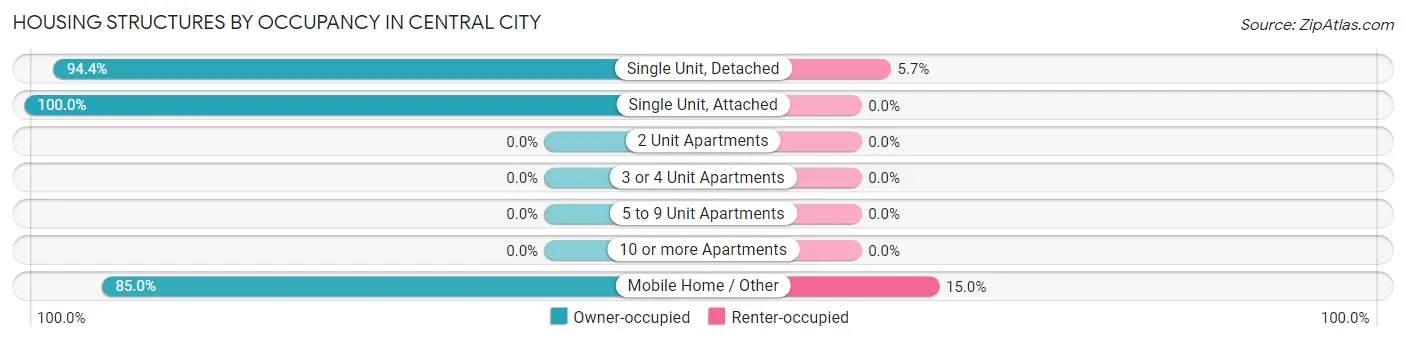
| Structure Type | Owner-occupied | Renter-occupied |
| Single Unit, Detached | 167 (94.4%) | 10 (5.7%) |
| Single Unit, Attached | 2 (100.0%) | 0 (0.0%) |
| 2 Unit Apartments | 0 (0.0%) | 0 (0.0%) |
| 3 or 4 Unit Apartments | 0 (0.0%) | 0 (0.0%) |
| 5 to 9 Unit Apartments | 0 (0.0%) | 0 (0.0%) |
| 10 or more Apartments | 0 (0.0%) | 0 (0.0%) |
| Mobile Home / Other | 51 (85.0%) | 9 (15.0%) |
| Total | 220 (92.0%) | 19 (8.0%) |
Housing Structures by Number of Rooms in Central City
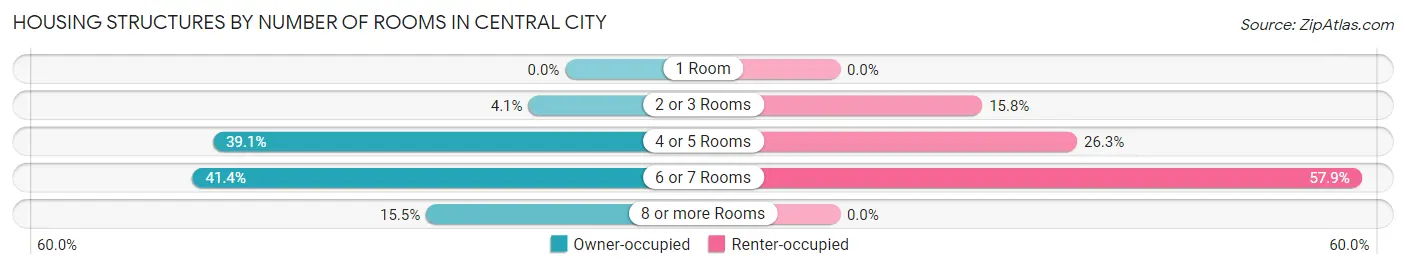
| Number of Rooms | Owner-occupied | Renter-occupied |
| 1 Room | 0 (0.0%) | 0 (0.0%) |
| 2 or 3 Rooms | 9 (4.1%) | 3 (15.8%) |
| 4 or 5 Rooms | 86 (39.1%) | 5 (26.3%) |
| 6 or 7 Rooms | 91 (41.4%) | 11 (57.9%) |
| 8 or more Rooms | 34 (15.4%) | 0 (0.0%) |
| Total | 220 (100.0%) | 19 (100.0%) |
Housing Structure by Heating Type in Central City
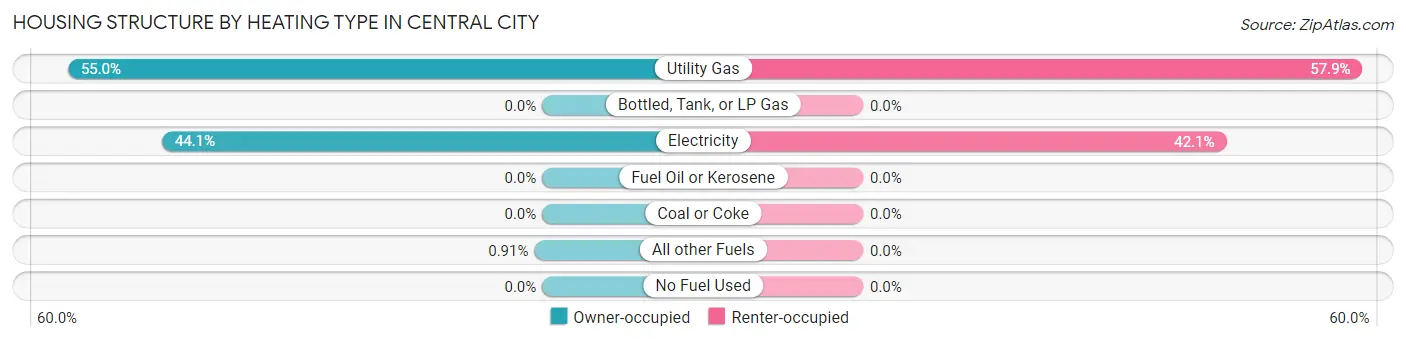
| Heating Type | Owner-occupied | Renter-occupied |
| Utility Gas | 121 (55.0%) | 11 (57.9%) |
| Bottled, Tank, or LP Gas | 0 (0.0%) | 0 (0.0%) |
| Electricity | 97 (44.1%) | 8 (42.1%) |
| Fuel Oil or Kerosene | 0 (0.0%) | 0 (0.0%) |
| Coal or Coke | 0 (0.0%) | 0 (0.0%) |
| All other Fuels | 2 (0.9%) | 0 (0.0%) |
| No Fuel Used | 0 (0.0%) | 0 (0.0%) |
| Total | 220 (100.0%) | 19 (100.0%) |
Household Vehicle Usage in Central City
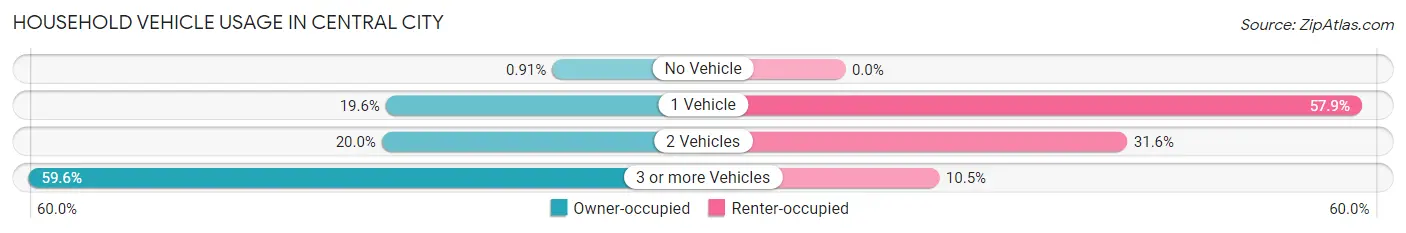
| Vehicles per Household | Owner-occupied | Renter-occupied |
| No Vehicle | 2 (0.9%) | 0 (0.0%) |
| 1 Vehicle | 43 (19.6%) | 11 (57.9%) |
| 2 Vehicles | 44 (20.0%) | 6 (31.6%) |
| 3 or more Vehicles | 131 (59.6%) | 2 (10.5%) |
| Total | 220 (100.0%) | 19 (100.0%) |
Real Estate & Mortgages in Central City
Real Estate and Mortgage Overview in Central City
| Characteristic | Without Mortgage | With Mortgage |
| Housing Units | 84 | 136 |
| Median Property Value | $109,700 | $201,200 |
| Median Household Income | $31,528 | $18 |
| Monthly Housing Costs | $424 | $0 |
| Real Estate Taxes | - | - |
Property Value by Mortgage Status in Central City
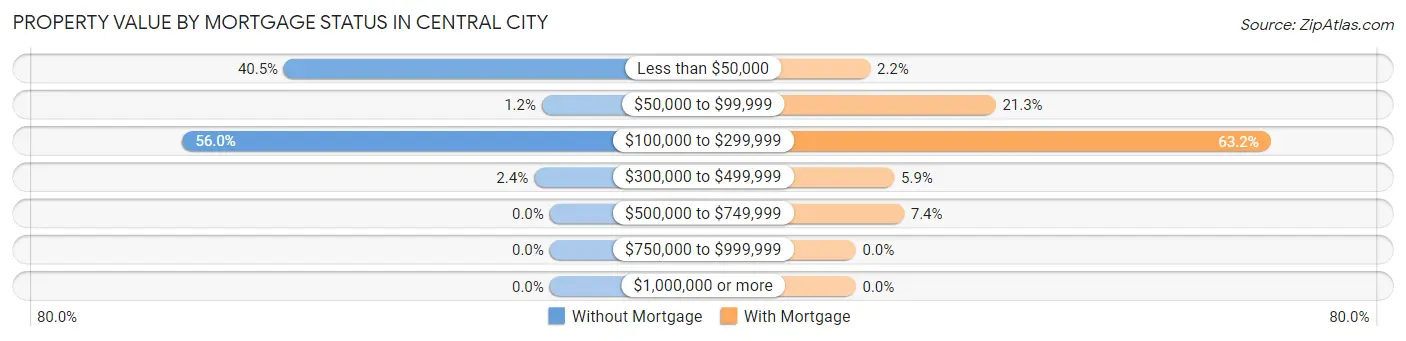
| Property Value | Without Mortgage | With Mortgage |
| Less than $50,000 | 34 (40.5%) | 3 (2.2%) |
| $50,000 to $99,999 | 1 (1.2%) | 29 (21.3%) |
| $100,000 to $299,999 | 47 (55.9%) | 86 (63.2%) |
| $300,000 to $499,999 | 2 (2.4%) | 8 (5.9%) |
| $500,000 to $749,999 | 0 (0.0%) | 10 (7.3%) |
| $750,000 to $999,999 | 0 (0.0%) | 0 (0.0%) |
| $1,000,000 or more | 0 (0.0%) | 0 (0.0%) |
| Total | 84 (100.0%) | 136 (100.0%) |
Household Income by Mortgage Status in Central City
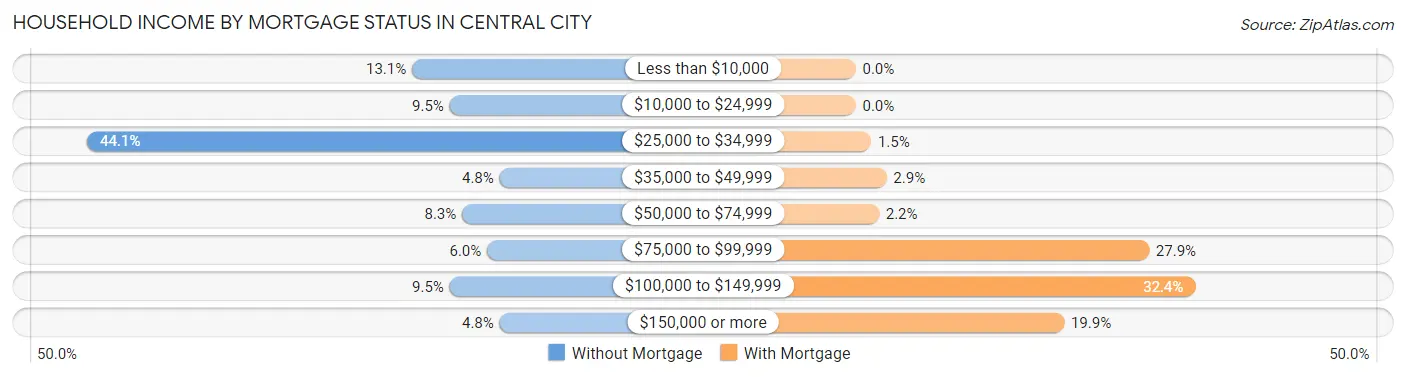
| Household Income | Without Mortgage | With Mortgage |
| Less than $10,000 | 11 (13.1%) | 0 (0.0%) |
| $10,000 to $24,999 | 8 (9.5%) | 0 (0.0%) |
| $25,000 to $34,999 | 37 (44.1%) | 2 (1.5%) |
| $35,000 to $49,999 | 4 (4.8%) | 4 (2.9%) |
| $50,000 to $74,999 | 7 (8.3%) | 3 (2.2%) |
| $75,000 to $99,999 | 5 (5.9%) | 38 (27.9%) |
| $100,000 to $149,999 | 8 (9.5%) | 44 (32.4%) |
| $150,000 or more | 4 (4.8%) | 27 (19.9%) |
| Total | 84 (100.0%) | 136 (100.0%) |
Property Value to Household Income Ratio in Central City
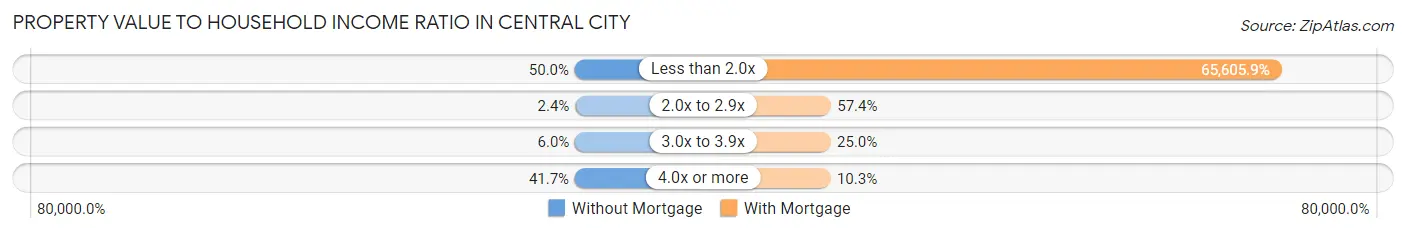
| Value-to-Income Ratio | Without Mortgage | With Mortgage |
| Less than 2.0x | 42 (50.0%) | 89,224 (65,605.9%) |
| 2.0x to 2.9x | 2 (2.4%) | 78 (57.4%) |
| 3.0x to 3.9x | 5 (5.9%) | 34 (25.0%) |
| 4.0x or more | 35 (41.7%) | 14 (10.3%) |
| Total | 84 (100.0%) | 136 (100.0%) |
Real Estate Taxes by Mortgage Status in Central City
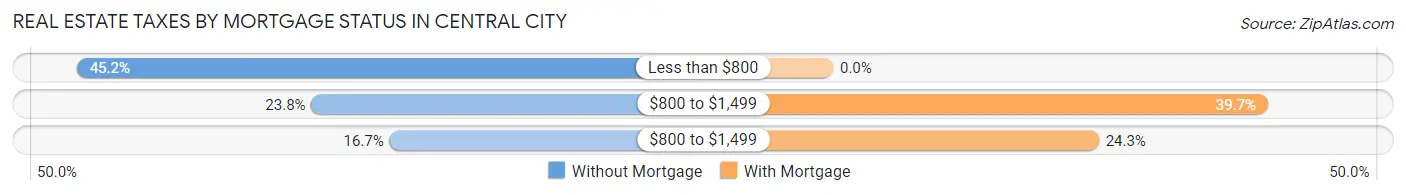
| Property Taxes | Without Mortgage | With Mortgage |
| Less than $800 | 38 (45.2%) | 0 (0.0%) |
| $800 to $1,499 | 20 (23.8%) | 54 (39.7%) |
| $800 to $1,499 | 14 (16.7%) | 33 (24.3%) |
| Total | 84 (100.0%) | 136 (100.0%) |
Health & Disability in Central City
Health Insurance Coverage by Age in Central City
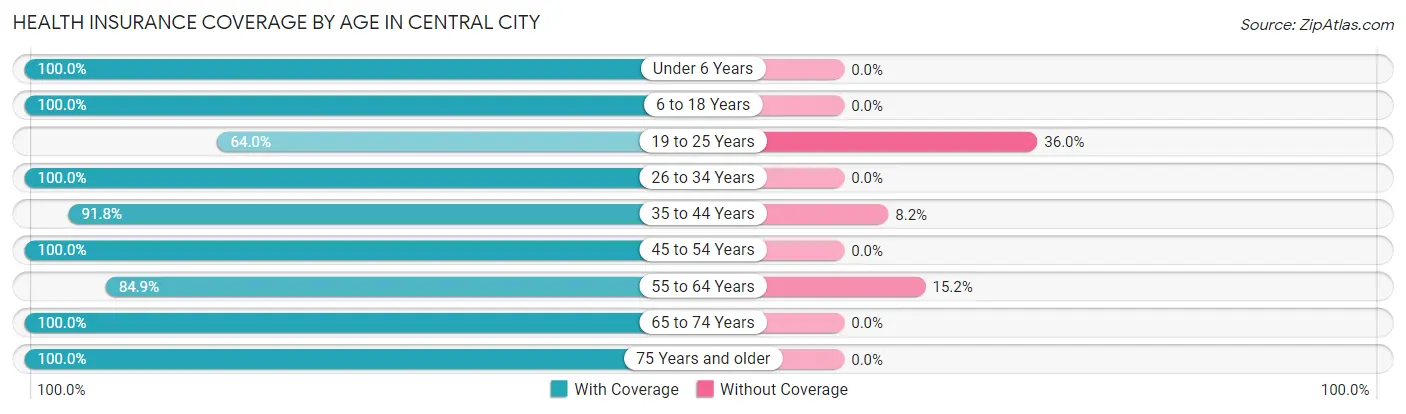
| Age Bracket | With Coverage | Without Coverage |
| Under 6 Years | 49 (100.0%) | 0 (0.0%) |
| 6 to 18 Years | 188 (100.0%) | 0 (0.0%) |
| 19 to 25 Years | 48 (64.0%) | 27 (36.0%) |
| 26 to 34 Years | 27 (100.0%) | 0 (0.0%) |
| 35 to 44 Years | 67 (91.8%) | 6 (8.2%) |
| 45 to 54 Years | 143 (100.0%) | 0 (0.0%) |
| 55 to 64 Years | 84 (84.9%) | 15 (15.1%) |
| 65 to 74 Years | 54 (100.0%) | 0 (0.0%) |
| 75 Years and older | 21 (100.0%) | 0 (0.0%) |
| Total | 681 (93.4%) | 48 (6.6%) |
Health Insurance Coverage by Citizenship Status in Central City
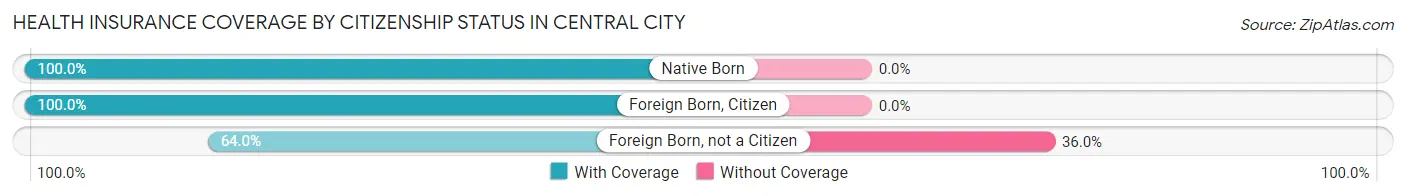
| Citizenship Status | With Coverage | Without Coverage |
| Native Born | 49 (100.0%) | 0 (0.0%) |
| Foreign Born, Citizen | 188 (100.0%) | 0 (0.0%) |
| Foreign Born, not a Citizen | 48 (64.0%) | 27 (36.0%) |
Health Insurance Coverage by Household Income in Central City
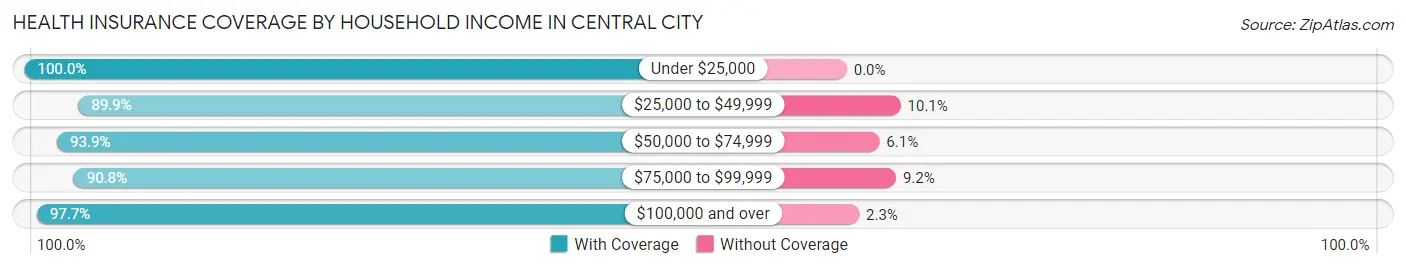
| Household Income | With Coverage | Without Coverage |
| Under $25,000 | 30 (100.0%) | 0 (0.0%) |
| $25,000 to $49,999 | 116 (89.9%) | 13 (10.1%) |
| $50,000 to $74,999 | 169 (93.9%) | 11 (6.1%) |
| $75,000 to $99,999 | 197 (90.8%) | 20 (9.2%) |
| $100,000 and over | 169 (97.7%) | 4 (2.3%) |
Public vs Private Health Insurance Coverage by Age in Central City
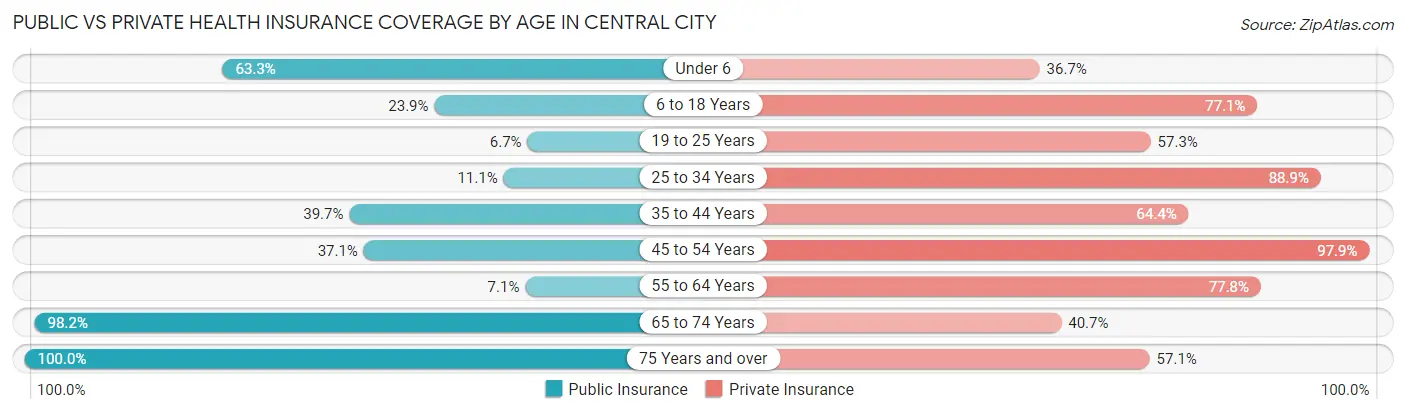
| Age Bracket | Public Insurance | Private Insurance |
| Under 6 | 31 (63.3%) | 18 (36.7%) |
| 6 to 18 Years | 45 (23.9%) | 145 (77.1%) |
| 19 to 25 Years | 5 (6.7%) | 43 (57.3%) |
| 25 to 34 Years | 3 (11.1%) | 24 (88.9%) |
| 35 to 44 Years | 29 (39.7%) | 47 (64.4%) |
| 45 to 54 Years | 53 (37.1%) | 140 (97.9%) |
| 55 to 64 Years | 7 (7.1%) | 77 (77.8%) |
| 65 to 74 Years | 53 (98.2%) | 22 (40.7%) |
| 75 Years and over | 21 (100.0%) | 12 (57.1%) |
| Total | 247 (33.9%) | 528 (72.4%) |
Disability Status by Sex by Age in Central City
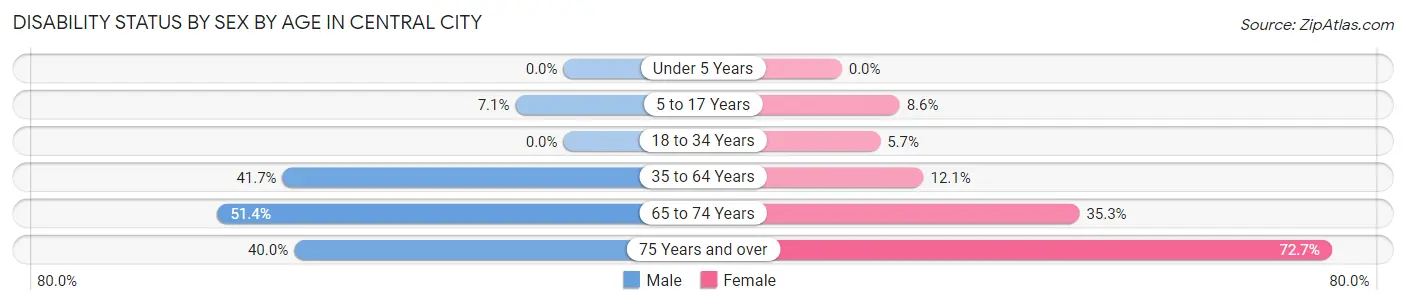
| Age Bracket | Male | Female |
| Under 5 Years | 0 (0.0%) | 0 (0.0%) |
| 5 to 17 Years | 3 (7.1%) | 8 (8.6%) |
| 18 to 34 Years | 0 (0.0%) | 6 (5.7%) |
| 35 to 64 Years | 73 (41.7%) | 17 (12.1%) |
| 65 to 74 Years | 19 (51.3%) | 6 (35.3%) |
| 75 Years and over | 4 (40.0%) | 8 (72.7%) |
Disability Class by Sex by Age in Central City
Disability Class: Hearing Difficulty
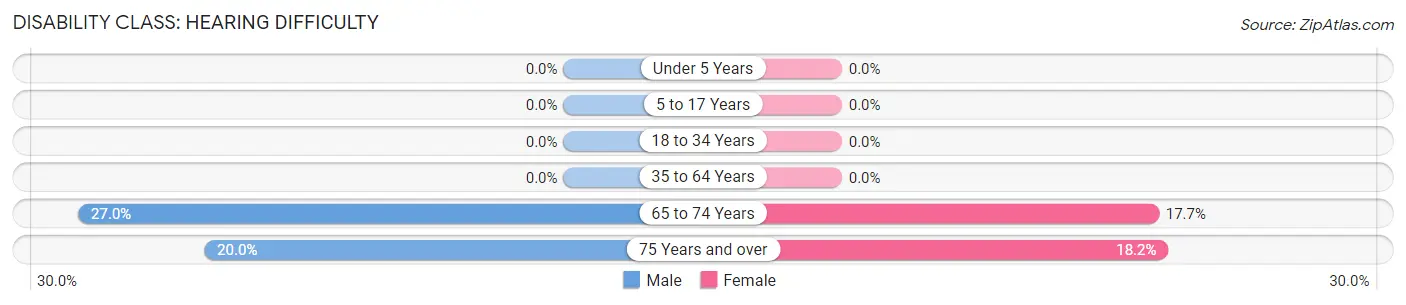
| Age Bracket | Male | Female |
| Under 5 Years | 0 (0.0%) | 0 (0.0%) |
| 5 to 17 Years | 0 (0.0%) | 0 (0.0%) |
| 18 to 34 Years | 0 (0.0%) | 0 (0.0%) |
| 35 to 64 Years | 0 (0.0%) | 0 (0.0%) |
| 65 to 74 Years | 10 (27.0%) | 3 (17.6%) |
| 75 Years and over | 2 (20.0%) | 2 (18.2%) |
Disability Class: Vision Difficulty
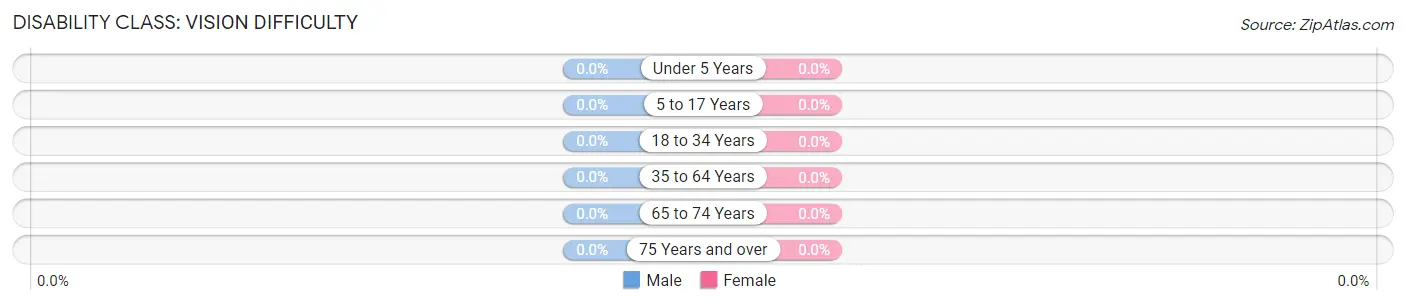
| Age Bracket | Male | Female |
| Under 5 Years | 0 (0.0%) | 0 (0.0%) |
| 5 to 17 Years | 0 (0.0%) | 0 (0.0%) |
| 18 to 34 Years | 0 (0.0%) | 0 (0.0%) |
| 35 to 64 Years | 0 (0.0%) | 0 (0.0%) |
| 65 to 74 Years | 0 (0.0%) | 0 (0.0%) |
| 75 Years and over | 0 (0.0%) | 0 (0.0%) |
Disability Class: Cognitive Difficulty
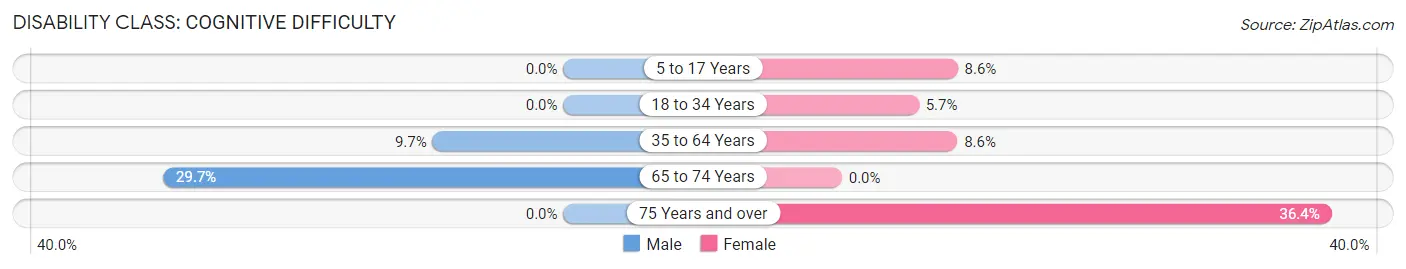
| Age Bracket | Male | Female |
| 5 to 17 Years | 0 (0.0%) | 8 (8.6%) |
| 18 to 34 Years | 0 (0.0%) | 6 (5.7%) |
| 35 to 64 Years | 17 (9.7%) | 12 (8.6%) |
| 65 to 74 Years | 11 (29.7%) | 0 (0.0%) |
| 75 Years and over | 0 (0.0%) | 4 (36.4%) |
Disability Class: Ambulatory Difficulty
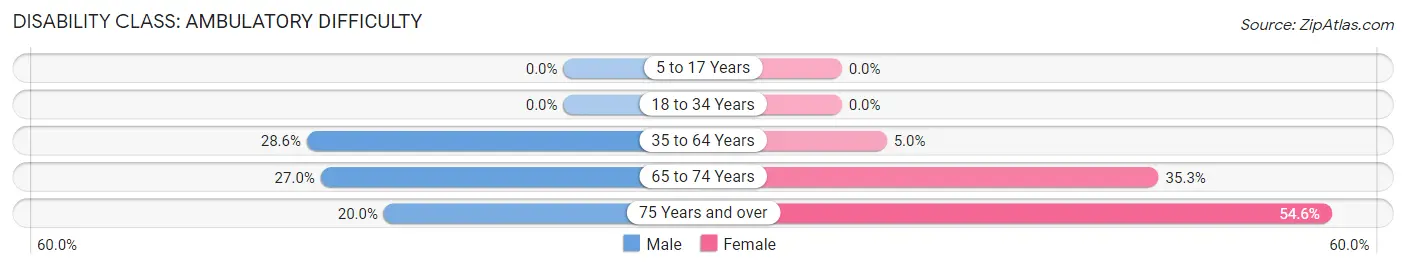
| Age Bracket | Male | Female |
| 5 to 17 Years | 0 (0.0%) | 0 (0.0%) |
| 18 to 34 Years | 0 (0.0%) | 0 (0.0%) |
| 35 to 64 Years | 50 (28.6%) | 7 (5.0%) |
| 65 to 74 Years | 10 (27.0%) | 6 (35.3%) |
| 75 Years and over | 2 (20.0%) | 6 (54.5%) |
Disability Class: Self-Care Difficulty
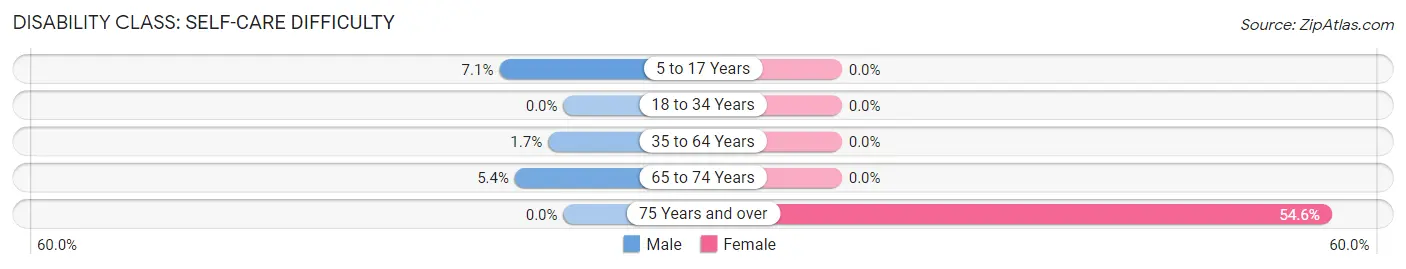
| Age Bracket | Male | Female |
| 5 to 17 Years | 3 (7.1%) | 0 (0.0%) |
| 18 to 34 Years | 0 (0.0%) | 0 (0.0%) |
| 35 to 64 Years | 3 (1.7%) | 0 (0.0%) |
| 65 to 74 Years | 2 (5.4%) | 0 (0.0%) |
| 75 Years and over | 0 (0.0%) | 6 (54.5%) |
Technology Access in Central City
Computing Device Access in Central City
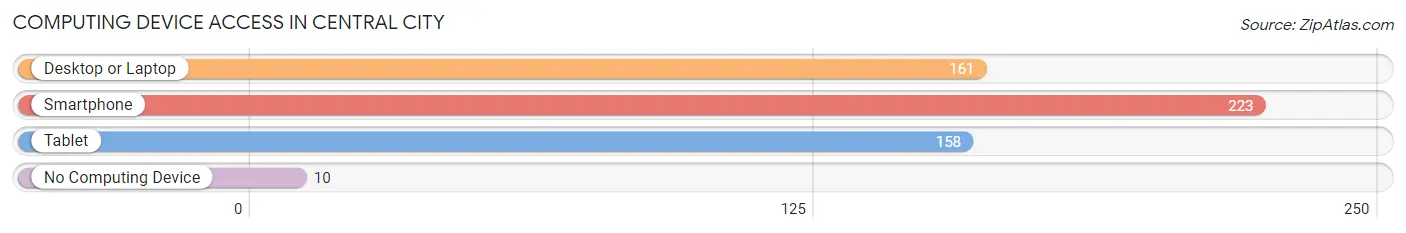
| Device Type | # Households | % Households |
| Desktop or Laptop | 161 | 67.4% |
| Smartphone | 223 | 93.3% |
| Tablet | 158 | 66.1% |
| No Computing Device | 10 | 4.2% |
| Total | 239 | 100.0% |
Internet Access in Central City
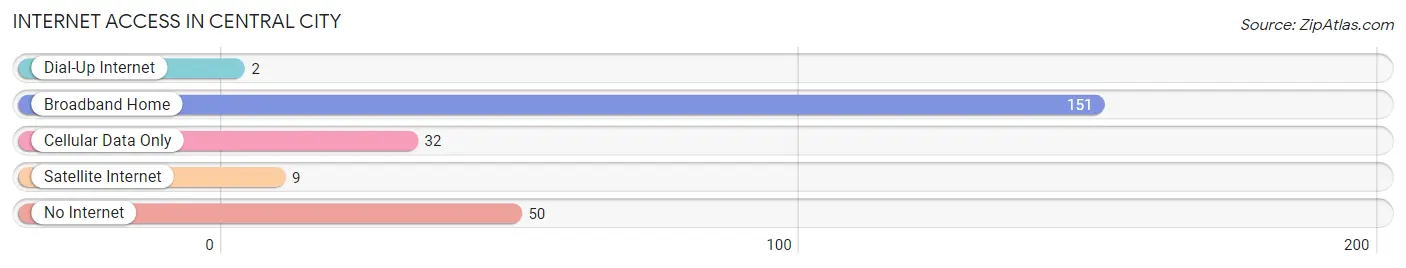
| Internet Type | # Households | % Households |
| Dial-Up Internet | 2 | 0.8% |
| Broadband Home | 151 | 63.2% |
| Cellular Data Only | 32 | 13.4% |
| Satellite Internet | 9 | 3.8% |
| No Internet | 50 | 20.9% |
| Total | 239 | 100.0% |
Central City Summary
Introduction
Central City is a small city located in the state of Arkansas. It is situated in the foothills of the Ozark Mountains and is part of the Little Rock-North Little Rock-Conway Metropolitan Statistical Area. The city has a population of approximately 2,000 people and is known for its rural charm and friendly atmosphere. Central City is a great place to live, work, and play, and offers a variety of activities and attractions for visitors and residents alike.
History
Central City was founded in 1872 by a group of settlers from the nearby town of Conway. The town was originally called “Central” because it was located at the intersection of two major roads. The town was later renamed Central City in 1883.
The city was an important stop on the St. Louis-Little Rock Railroad, which was built in 1882. This railroad connected Central City to the larger cities of Little Rock and St. Louis. The railroad was a major factor in the growth of the city, as it allowed for the transportation of goods and people.
The city was also an important stop on the Butterfield Overland Mail route, which ran from St. Louis to San Francisco. This route was used by many settlers who were traveling west in search of a new life.
Central City was incorporated in 1887 and has remained a small city ever since. The city has a rich history and is home to many historic buildings, including the Central City Opera House, which was built in 1891.
Geography
Central City is located in the foothills of the Ozark Mountains in the state of Arkansas. The city is situated in the Little Rock-North Little Rock-Conway Metropolitan Statistical Area. The city is located at the intersection of two major roads, Highway 64 and Highway 65.
The city is surrounded by rolling hills and lush forests. The city is also home to several lakes, including Lake Conway and Lake Maumelle. The city is located approximately 30 miles north of Little Rock and is a popular destination for outdoor activities such as fishing, camping, and hiking.
Economy
Central City is a small city with a population of approximately 2,000 people. The city’s economy is largely based on agriculture and tourism. The city is home to several farms and ranches, which produce a variety of crops and livestock.
The city is also home to several small businesses, including restaurants, shops, and other services. The city is also home to several manufacturing companies, which produce a variety of products.
The city is also a popular destination for tourists, as it is home to several attractions, including the Central City Opera House, the Central City Museum, and the Central City Zoo. The city is also home to several festivals and events throughout the year, which attract visitors from all over the state.
Demographics
According to the 2010 census, the population of Central City was 2,000 people. The city is predominantly white, with approximately 95% of the population being white. The remaining 5% of the population is made up of African Americans, Hispanics, and other races.
The median household income in Central City is $35,000, which is slightly lower than the national average. The city has a poverty rate of approximately 15%, which is slightly higher than the national average.
Conclusion
Central City is a small city located in the state of Arkansas. The city has a population of approximately 2,000 people and is known for its rural charm and friendly atmosphere. The city is home to several farms and ranches, which produce a variety of crops and livestock. The city is also home to several small businesses, manufacturing companies, and attractions. The city is a popular destination for tourists and is home to several festivals and events throughout the year. The city has a predominantly white population, with a median household income of $35,000 and a poverty rate of approximately 15%.
Common Questions
What is the Total Population of Central City?
Total Population of Central City is 729.
What is the Total Male Population of Central City?
Total Male Population of Central City is 339.
What is the Total Female Population of Central City?
Total Female Population of Central City is 390.
What is the Ratio of Males per 100 Females in Central City?
There are 86.92 Males per 100 Females in Central City.
What is the Ratio of Females per 100 Males in Central City?
There are 115.04 Females per 100 Males in Central City.
What is the Median Population Age in Central City?
Median Population Age in Central City is 41.0 Years.
What is the Average Family Size in Central City
Average Family Size in Central City is 3.4 People.
What is the Average Household Size in Central City
Average Household Size in Central City is 3.0 People.
What is Per Capita Income in Central City?
Per Capita income in Central City is $29,728.
What is the Median Family Income in Central City?
Median Family Income in Central City is $88,000.
What is the Median Household income in Central City?
Median Household Income in Central City is $73,456.
What is Income or Wage Gap in Central City?
Income or Wage Gap in Central City is 39.5%.
Women in Central City earn 60.5 cents for every dollar earned by a man.
What is Family Income Deficit in Central City?
Family Income Deficit in Central City is $7,300.
Families that are below poverty line in Central City earn $7,300 less on average than the poverty threshold level.
What is Inequality or Gini Index in Central City?
Inequality or Gini Index in Central City is 0.41.
How Large is the Labor Force in Central City?
There are 416 People in the Labor Forcein in Central City.
What is the Percentage of People in the Labor Force in Central City?
67.6% of People are in the Labor Force in Central City.
What is the Unemployment Rate in Central City?
Unemployment Rate in Central City is 5.0%.