Dyer, AR Map & Demographics
Dyer Map
Dyer Overview
$27,926
PER CAPITA INCOME
$89,844
AVG FAMILY INCOME
$71,250
AVG HOUSEHOLD INCOME
24.2%
WAGE / INCOME GAP [ % ]
75.8¢/ $1
WAGE / INCOME GAP [ $ ]
0.38
INEQUALITY / GINI INDEX
917
TOTAL POPULATION
505
MALE POPULATION
412
FEMALE POPULATION
122.57
MALES / 100 FEMALES
81.58
FEMALES / 100 MALES
47.0
MEDIAN AGE
2.7
AVG FAMILY SIZE
2.5
AVG HOUSEHOLD SIZE
392
LABOR FORCE [ PEOPLE ]
49.8%
PERCENT IN LABOR FORCE
6.6%
UNEMPLOYMENT RATE
Dyer Zip Codes
Dyer Area Codes
Income in Dyer
Income Overview in Dyer
Per Capita Income in Dyer is $27,926, while median incomes of families and households are $89,844 and $71,250 respectively.
| Characteristic | Number | Measure |
| Per Capita Income | 917 | $27,926 |
| Median Family Income | 315 | $89,844 |
| Mean Family Income | 315 | $85,315 |
| Median Household Income | 372 | $71,250 |
| Mean Household Income | 372 | $78,289 |
| Income Deficit | 315 | $0 |
| Wage / Income Gap (%) | 917 | 24.16% |
| Wage / Income Gap ($) | 917 | 75.84¢ per $1 |
| Gini / Inequality Index | 917 | 0.38 |
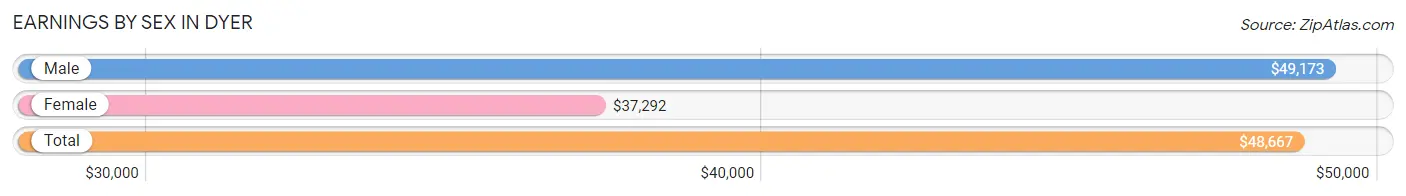
Earnings by Sex in Dyer
Average Earnings in Dyer are $48,667, $49,173 for men and $37,292 for women, a difference of 24.2%.
| Sex | Number | Average Earnings |
| Male | 289 (77.3%) | $49,173 |
| Female | 85 (22.7%) | $37,292 |
| Total | 374 (100.0%) | $48,667 |
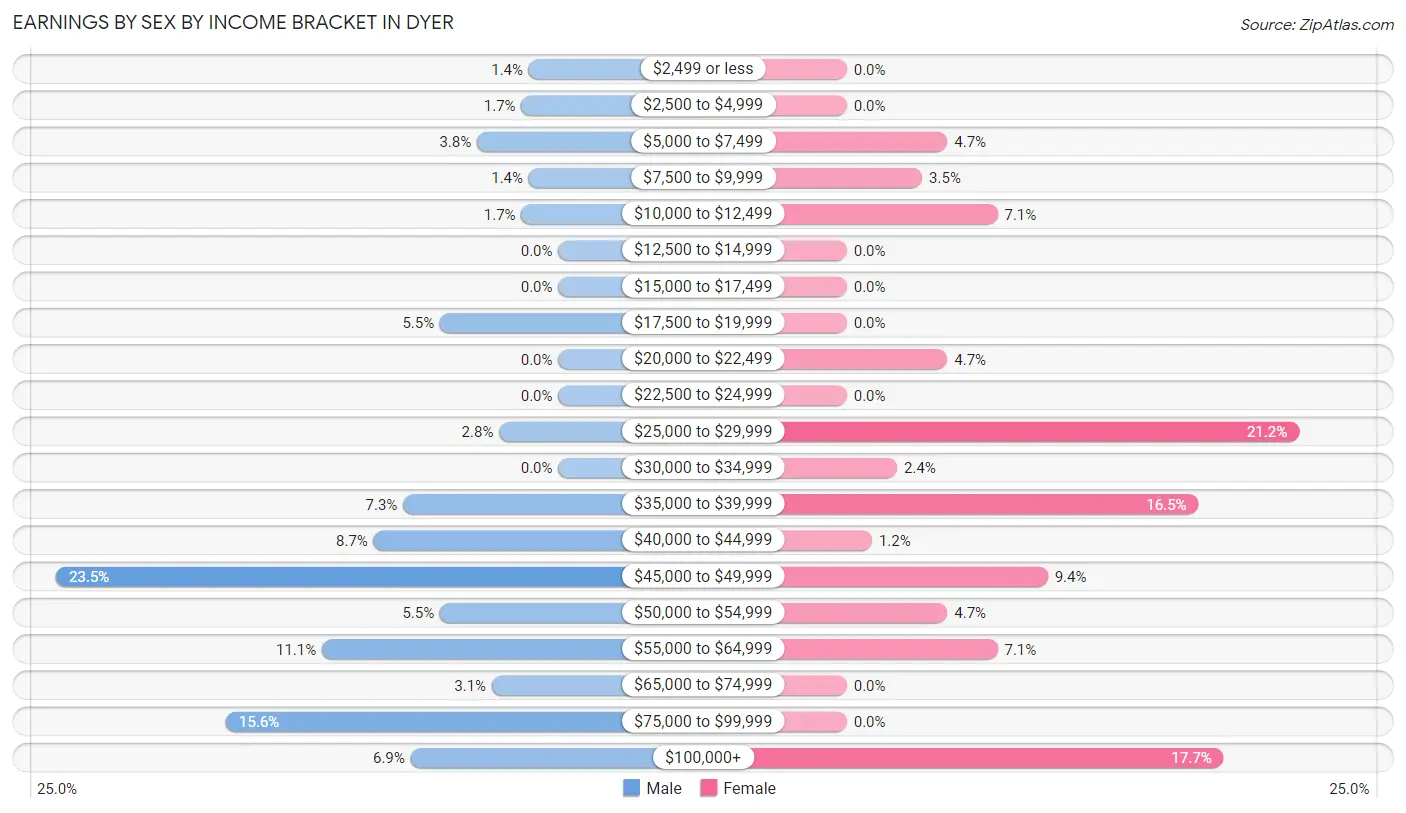
Earnings by Sex by Income Bracket in Dyer
The most common earnings brackets in Dyer are $45,000 to $49,999 for men (68 | 23.5%) and $25,000 to $29,999 for women (18 | 21.2%).
| Income | Male | Female |
| $2,499 or less | 4 (1.4%) | 0 (0.0%) |
| $2,500 to $4,999 | 5 (1.7%) | 0 (0.0%) |
| $5,000 to $7,499 | 11 (3.8%) | 4 (4.7%) |
| $7,500 to $9,999 | 4 (1.4%) | 3 (3.5%) |
| $10,000 to $12,499 | 5 (1.7%) | 6 (7.1%) |
| $12,500 to $14,999 | 0 (0.0%) | 0 (0.0%) |
| $15,000 to $17,499 | 0 (0.0%) | 0 (0.0%) |
| $17,500 to $19,999 | 16 (5.5%) | 0 (0.0%) |
| $20,000 to $22,499 | 0 (0.0%) | 4 (4.7%) |
| $22,500 to $24,999 | 0 (0.0%) | 0 (0.0%) |
| $25,000 to $29,999 | 8 (2.8%) | 18 (21.2%) |
| $30,000 to $34,999 | 0 (0.0%) | 2 (2.4%) |
| $35,000 to $39,999 | 21 (7.3%) | 14 (16.5%) |
| $40,000 to $44,999 | 25 (8.6%) | 1 (1.2%) |
| $45,000 to $49,999 | 68 (23.5%) | 8 (9.4%) |
| $50,000 to $54,999 | 16 (5.5%) | 4 (4.7%) |
| $55,000 to $64,999 | 32 (11.1%) | 6 (7.1%) |
| $65,000 to $74,999 | 9 (3.1%) | 0 (0.0%) |
| $75,000 to $99,999 | 45 (15.6%) | 0 (0.0%) |
| $100,000+ | 20 (6.9%) | 15 (17.6%) |
| Total | 289 (100.0%) | 85 (100.0%) |
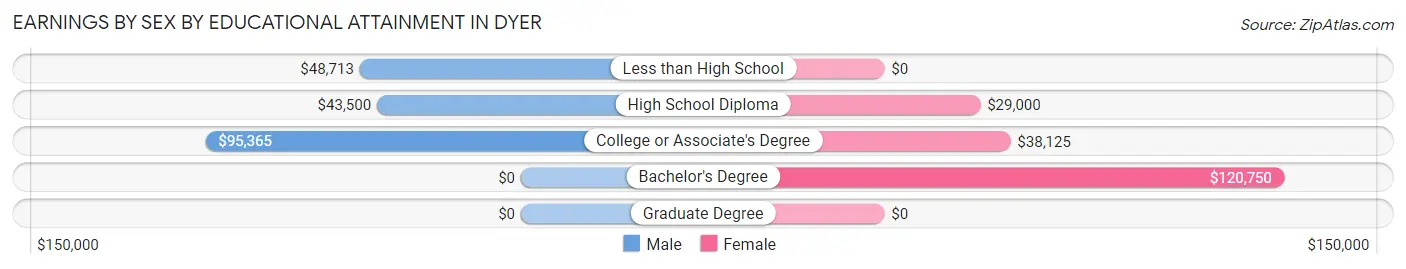
Earnings by Sex by Educational Attainment in Dyer
Average earnings in Dyer are $49,926 for men and $38,281 for women, a difference of 23.3%. Men with an educational attainment of college or associate's degree enjoy the highest average annual earnings of $95,365, while those with high school diploma education earn the least with $43,500. Women with an educational attainment of bachelor's degree earn the most with the average annual earnings of $120,750, while those with high school diploma education have the smallest earnings of $29,000.
| Educational Attainment | Male Income | Female Income |
| Less than High School | $48,713 | $0 |
| High School Diploma | $43,500 | $29,000 |
| College or Associate's Degree | $95,365 | $38,125 |
| Bachelor's Degree | - | - |
| Graduate Degree | - | - |
| Total | $49,926 | $38,281 |
Family Income in Dyer
Family Income Brackets in Dyer
According to the Dyer family income data, there are 105 families falling into the $100,000 to $149,999 income range, which is the most common income bracket and makes up 33.3% of all families. Conversely, the less than $10,000 income bracket is the least frequent group with only 10 families (3.2%) belonging to this category.
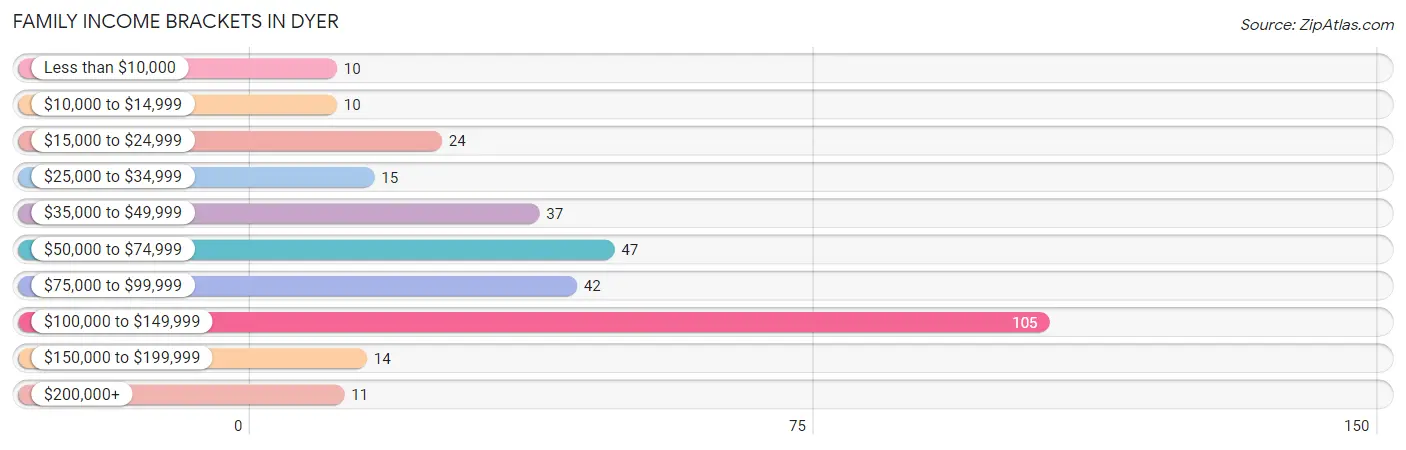
| Income Bracket | # Families | % Families |
| Less than $10,000 | 10 | 3.2% |
| $10,000 to $14,999 | 10 | 3.2% |
| $15,000 to $24,999 | 24 | 7.6% |
| $25,000 to $34,999 | 15 | 4.8% |
| $35,000 to $49,999 | 37 | 11.7% |
| $50,000 to $74,999 | 47 | 14.9% |
| $75,000 to $99,999 | 42 | 13.3% |
| $100,000 to $149,999 | 105 | 33.3% |
| $150,000 to $199,999 | 14 | 4.4% |
| $200,000+ | 11 | 3.5% |
Family Income by Famaliy Size in Dyer
3-person families (117 | 37.1%) account for the highest median family income in Dyer with $113,438 per family, while 3-person families (117 | 37.1%) have the highest median income of $37,813 per family member.
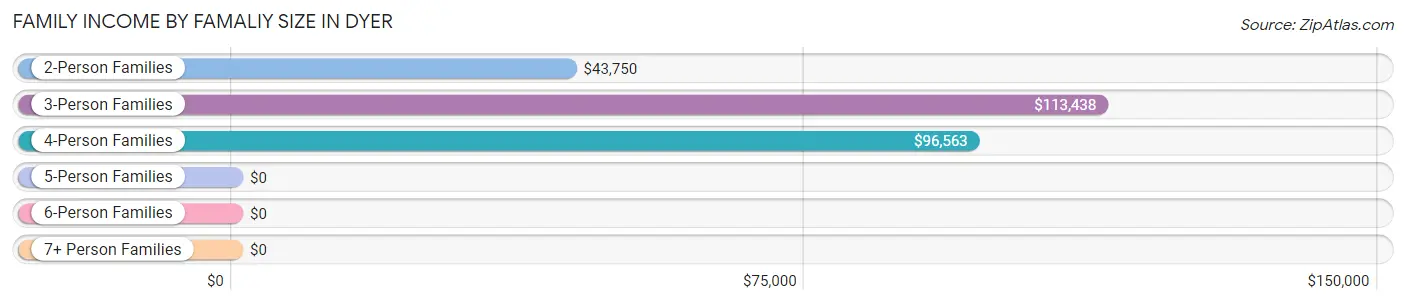
| Income Bracket | # Families | Median Income |
| 2-Person Families | 101 (32.1%) | $43,750 |
| 3-Person Families | 117 (37.1%) | $113,438 |
| 4-Person Families | 74 (23.5%) | $96,563 |
| 5-Person Families | 9 (2.9%) | $0 |
| 6-Person Families | 8 (2.5%) | $0 |
| 7+ Person Families | 6 (1.9%) | $0 |
| Total | 315 (100.0%) | $89,844 |
Family Income by Number of Earners in Dyer
The median family income in Dyer is $89,844, with families comprising 2 earners (51) having the highest median family income of $119,688, while families with no earners (82) have the lowest median family income of $26,786, accounting for 16.2% and 26.0% of families, respectively.
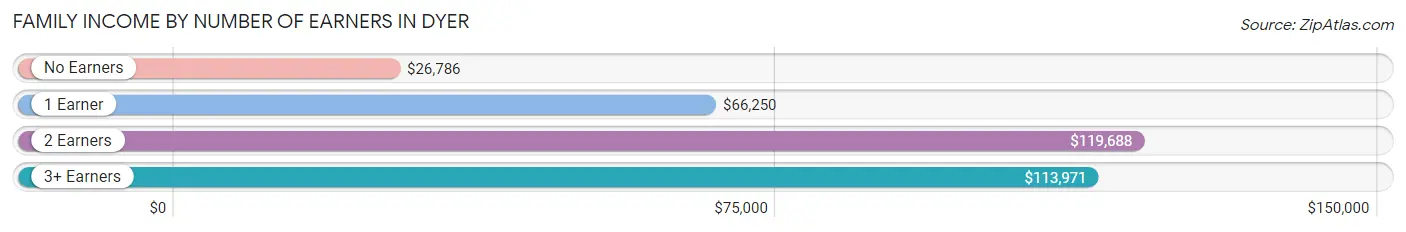
| Number of Earners | # Families | Median Income |
| No Earners | 82 (26.0%) | $26,786 |
| 1 Earner | 102 (32.4%) | $66,250 |
| 2 Earners | 51 (16.2%) | $119,688 |
| 3+ Earners | 80 (25.4%) | $113,971 |
| Total | 315 (100.0%) | $89,844 |
Household Income in Dyer
Household Income Brackets in Dyer
With 107 households falling in the category, the $100,000 to $149,999 income range is the most frequent in Dyer, accounting for 28.8% of all households. In contrast, only 11 households (3.0%) fall into the $200,000+ income bracket, making it the least populous group.
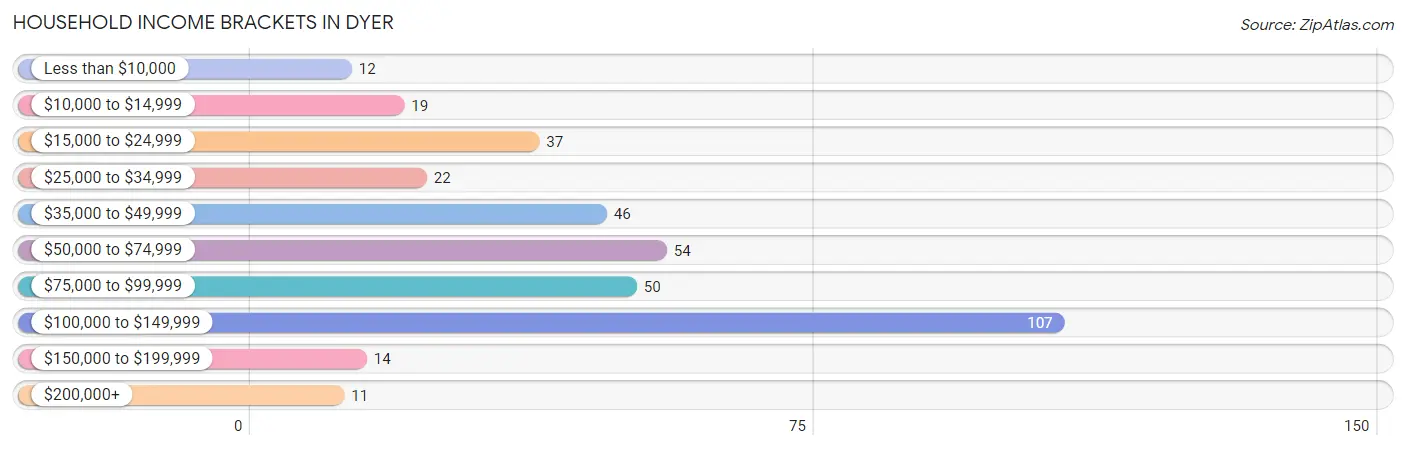
| Income Bracket | # Households | % Households |
| Less than $10,000 | 12 | 3.2% |
| $10,000 to $14,999 | 19 | 5.1% |
| $15,000 to $24,999 | 37 | 9.9% |
| $25,000 to $34,999 | 22 | 5.9% |
| $35,000 to $49,999 | 46 | 12.4% |
| $50,000 to $74,999 | 54 | 14.5% |
| $75,000 to $99,999 | 50 | 13.4% |
| $100,000 to $149,999 | 107 | 28.8% |
| $150,000 to $199,999 | 14 | 3.8% |
| $200,000+ | 11 | 3.0% |
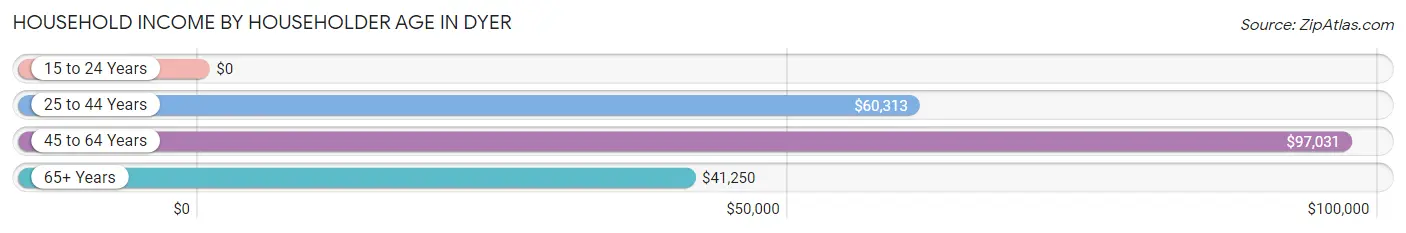
Household Income by Householder Age in Dyer
The median household income in Dyer is $71,250, with the highest median household income of $97,031 found in the 45 to 64 years age bracket for the primary householder. A total of 227 households (61.0%) fall into this category. Meanwhile, the 15 to 24 years age bracket for the primary householder has the lowest median household income of $0, with 7 households (1.9%) in this group.
| Income Bracket | # Households | Median Income |
| 15 to 24 Years | 7 (1.9%) | $0 |
| 25 to 44 Years | 53 (14.2%) | $60,313 |
| 45 to 64 Years | 227 (61.0%) | $97,031 |
| 65+ Years | 85 (22.9%) | $41,250 |
| Total | 372 (100.0%) | $71,250 |
Poverty in Dyer
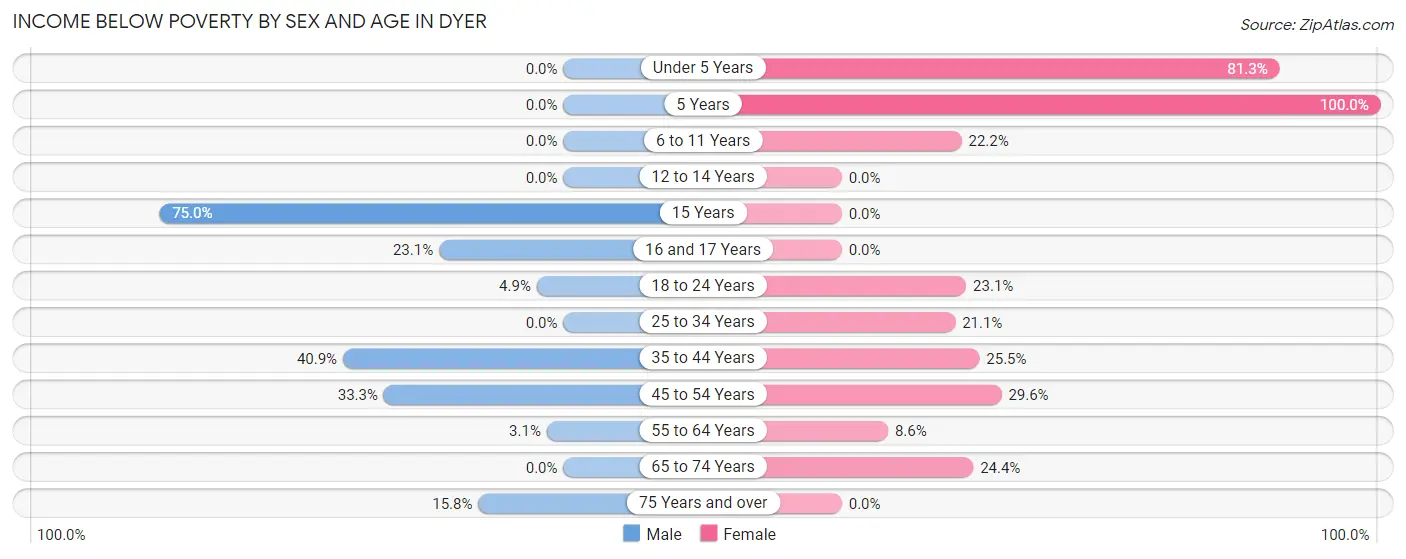
Income Below Poverty by Sex and Age in Dyer
With 14.8% poverty level for males and 24.0% for females among the residents of Dyer, 15 year old males and 5 year old females are the most vulnerable to poverty, with 6 males (75.0%) and 6 females (100.0%) in their respective age groups living below the poverty level.
| Age Bracket | Male | Female |
| Under 5 Years | 0 (0.0%) | 13 (81.2%) |
| 5 Years | 0 (0.0%) | 6 (100.0%) |
| 6 to 11 Years | 0 (0.0%) | 12 (22.2%) |
| 12 to 14 Years | 0 (0.0%) | 0 (0.0%) |
| 15 Years | 6 (75.0%) | 0 (0.0%) |
| 16 and 17 Years | 3 (23.1%) | 0 (0.0%) |
| 18 to 24 Years | 4 (4.9%) | 15 (23.1%) |
| 25 to 34 Years | 0 (0.0%) | 4 (21.0%) |
| 35 to 44 Years | 18 (40.9%) | 12 (25.5%) |
| 45 to 54 Years | 34 (33.3%) | 24 (29.6%) |
| 55 to 64 Years | 4 (3.1%) | 3 (8.6%) |
| 65 to 74 Years | 0 (0.0%) | 10 (24.4%) |
| 75 Years and over | 6 (15.8%) | 0 (0.0%) |
| Total | 75 (14.8%) | 99 (24.0%) |
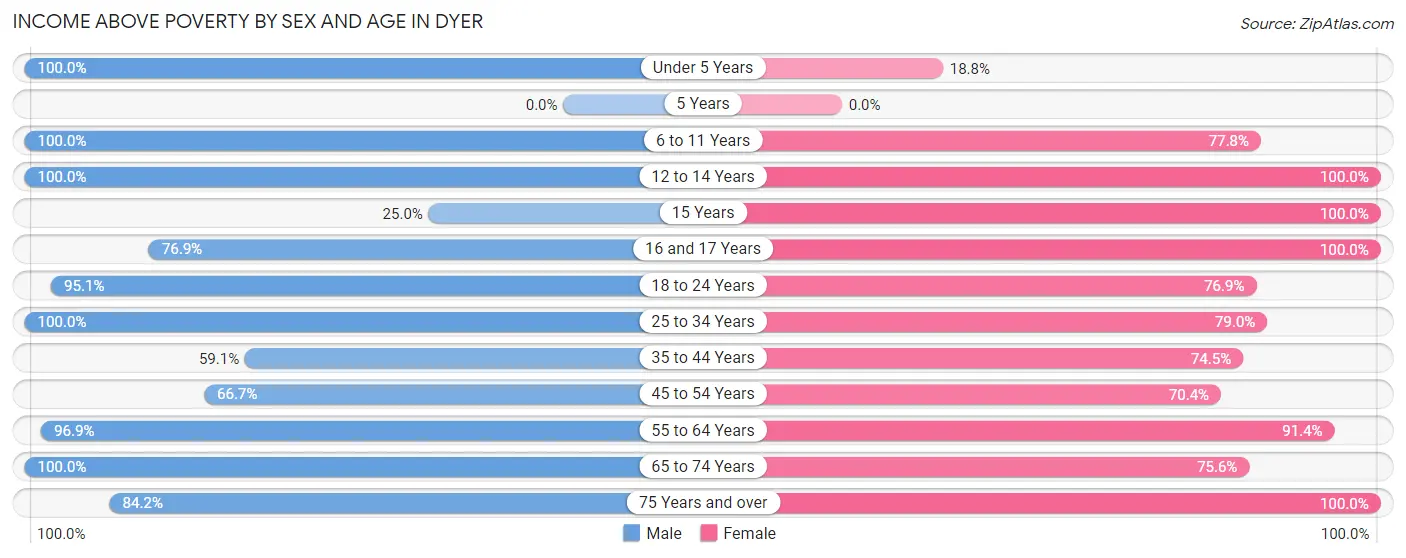
Income Above Poverty by Sex and Age in Dyer
According to the poverty statistics in Dyer, males aged under 5 years and females aged 12 to 14 years are the age groups that are most secure financially, with 100.0% of males and 100.0% of females in these age groups living above the poverty line.
| Age Bracket | Male | Female |
| Under 5 Years | 15 (100.0%) | 3 (18.8%) |
| 5 Years | 0 (0.0%) | 0 (0.0%) |
| 6 to 11 Years | 9 (100.0%) | 42 (77.8%) |
| 12 to 14 Years | 10 (100.0%) | 5 (100.0%) |
| 15 Years | 2 (25.0%) | 7 (100.0%) |
| 16 and 17 Years | 10 (76.9%) | 16 (100.0%) |
| 18 to 24 Years | 77 (95.1%) | 50 (76.9%) |
| 25 to 34 Years | 21 (100.0%) | 15 (78.9%) |
| 35 to 44 Years | 26 (59.1%) | 35 (74.5%) |
| 45 to 54 Years | 68 (66.7%) | 57 (70.4%) |
| 55 to 64 Years | 126 (96.9%) | 32 (91.4%) |
| 65 to 74 Years | 34 (100.0%) | 31 (75.6%) |
| 75 Years and over | 32 (84.2%) | 20 (100.0%) |
| Total | 430 (85.2%) | 313 (76.0%) |
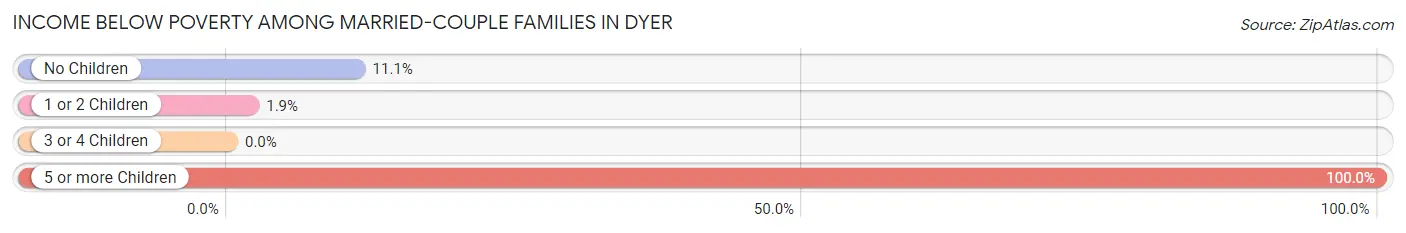
Income Below Poverty Among Married-Couple Families in Dyer
The poverty statistics for married-couple families in Dyer show that 10.6% or 31 of the total 292 families live below the poverty line. Families with 5 or more children have the highest poverty rate of 100.0%, comprising of 6 families. On the other hand, families with 3 or 4 children have the lowest poverty rate of 0.0%, which includes 0 families.
| Children | Above Poverty | Below Poverty |
| No Children | 192 (88.9%) | 24 (11.1%) |
| 1 or 2 Children | 53 (98.2%) | 1 (1.8%) |
| 3 or 4 Children | 16 (100.0%) | 0 (0.0%) |
| 5 or more Children | 0 (0.0%) | 6 (100.0%) |
| Total | 261 (89.4%) | 31 (10.6%) |
Income Below Poverty Among Single-Parent Households in Dyer
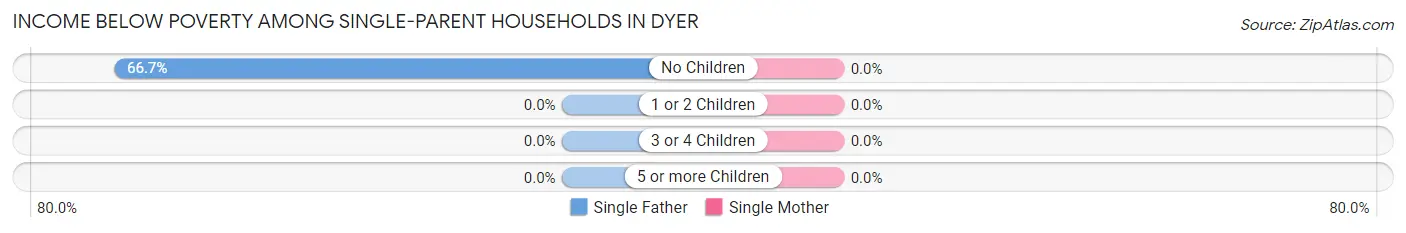
| Children | Single Father | Single Mother |
| No Children | 8 (66.7%) | 0 (0.0%) |
| 1 or 2 Children | 0 (0.0%) | 0 (0.0%) |
| 3 or 4 Children | 0 (0.0%) | 0 (0.0%) |
| 5 or more Children | 0 (0.0%) | 0 (0.0%) |
| Total | 8 (36.4%) | 0 (0.0%) |
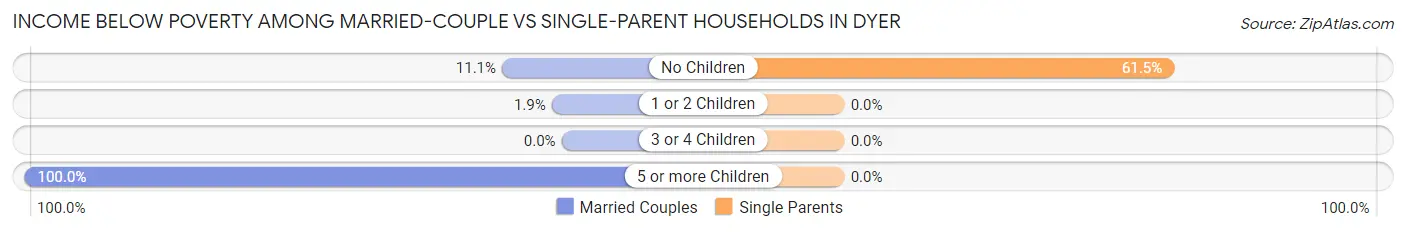
Income Below Poverty Among Married-Couple vs Single-Parent Households in Dyer
The poverty data for Dyer shows that 31 of the married-couple family households (10.6%) and 8 of the single-parent households (34.8%) are living below the poverty level. Within the married-couple family households, those with 5 or more children have the highest poverty rate, with 6 households (100.0%) falling below the poverty line. Among the single-parent households, those with no children have the highest poverty rate, with 8 household (61.5%) living below poverty.
| Children | Married-Couple Families | Single-Parent Households |
| No Children | 24 (11.1%) | 8 (61.5%) |
| 1 or 2 Children | 1 (1.8%) | 0 (0.0%) |
| 3 or 4 Children | 0 (0.0%) | 0 (0.0%) |
| 5 or more Children | 6 (100.0%) | 0 (0.0%) |
| Total | 31 (10.6%) | 8 (34.8%) |
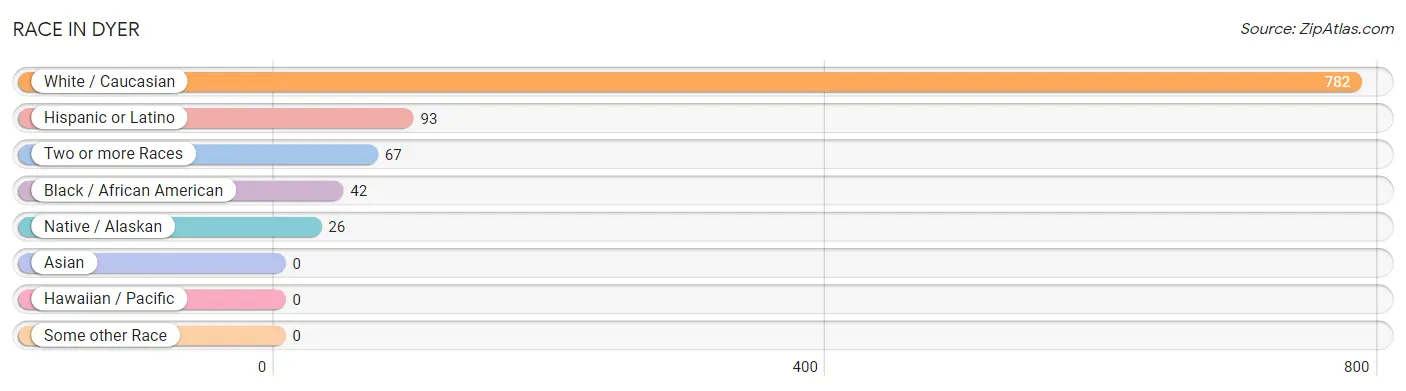
Race in Dyer
The most populous races in Dyer are White / Caucasian (782 | 85.3%), Hispanic or Latino (93 | 10.1%), and Two or more Races (67 | 7.3%).
| Race | # Population | % Population |
| Asian | 0 | 0.0% |
| Black / African American | 42 | 4.6% |
| Hawaiian / Pacific | 0 | 0.0% |
| Hispanic or Latino | 93 | 10.1% |
| Native / Alaskan | 26 | 2.8% |
| White / Caucasian | 782 | 85.3% |
| Two or more Races | 67 | 7.3% |
| Some other Race | 0 | 0.0% |
| Total | 917 | 100.0% |
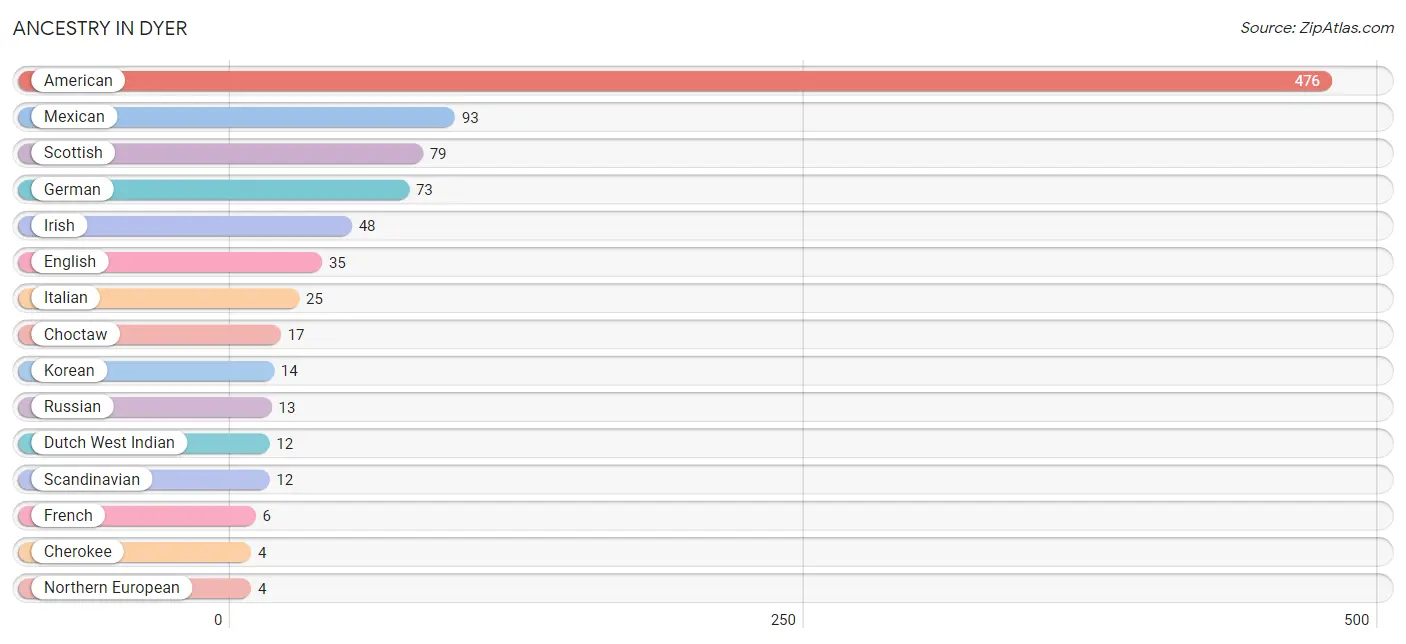
Ancestry in Dyer
The most populous ancestries reported in Dyer are American (476 | 51.9%), Mexican (93 | 10.1%), Scottish (79 | 8.6%), German (73 | 8.0%), and Irish (48 | 5.2%), together accounting for 83.9% of all Dyer residents.
| Ancestry | # Population | % Population |
| American | 476 | 51.9% |
| Cherokee | 4 | 0.4% |
| Choctaw | 17 | 1.8% |
| Danish | 2 | 0.2% |
| Dutch West Indian | 12 | 1.3% |
| English | 35 | 3.8% |
| European | 2 | 0.2% |
| French | 6 | 0.6% |
| German | 73 | 8.0% |
| Irish | 48 | 5.2% |
| Italian | 25 | 2.7% |
| Korean | 14 | 1.5% |
| Mexican | 93 | 10.1% |
| Northern European | 4 | 0.4% |
| Polish | 3 | 0.3% |
| Potawatomi | 1 | 0.1% |
| Russian | 13 | 1.4% |
| Scandinavian | 12 | 1.3% |
| Scottish | 79 | 8.6% | View All 19 Rows |
Immigrants in Dyer

| Immigration Origin | # Population | % Population | View All 0 Rows |
Sex and Age in Dyer
Sex and Age in Dyer
The most populous age groups in Dyer are 55 to 59 Years (111 | 22.0%) for men and 15 to 19 Years (46 | 11.2%) for women.
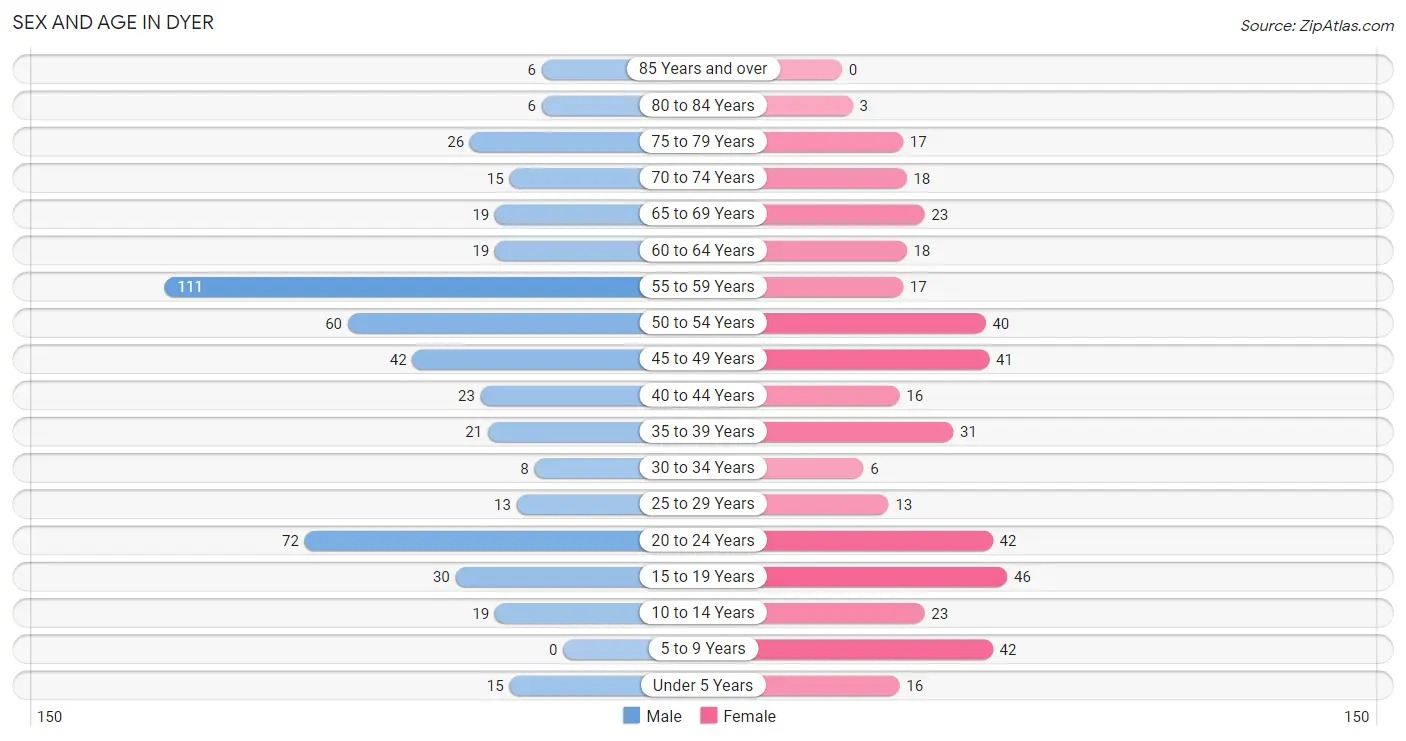
| Age Bracket | Male | Female |
| Under 5 Years | 15 (3.0%) | 16 (3.9%) |
| 5 to 9 Years | 0 (0.0%) | 42 (10.2%) |
| 10 to 14 Years | 19 (3.8%) | 23 (5.6%) |
| 15 to 19 Years | 30 (5.9%) | 46 (11.2%) |
| 20 to 24 Years | 72 (14.3%) | 42 (10.2%) |
| 25 to 29 Years | 13 (2.6%) | 13 (3.2%) |
| 30 to 34 Years | 8 (1.6%) | 6 (1.5%) |
| 35 to 39 Years | 21 (4.2%) | 31 (7.5%) |
| 40 to 44 Years | 23 (4.5%) | 16 (3.9%) |
| 45 to 49 Years | 42 (8.3%) | 41 (10.0%) |
| 50 to 54 Years | 60 (11.9%) | 40 (9.7%) |
| 55 to 59 Years | 111 (22.0%) | 17 (4.1%) |
| 60 to 64 Years | 19 (3.8%) | 18 (4.4%) |
| 65 to 69 Years | 19 (3.8%) | 23 (5.6%) |
| 70 to 74 Years | 15 (3.0%) | 18 (4.4%) |
| 75 to 79 Years | 26 (5.1%) | 17 (4.1%) |
| 80 to 84 Years | 6 (1.2%) | 3 (0.7%) |
| 85 Years and over | 6 (1.2%) | 0 (0.0%) |
| Total | 505 (100.0%) | 412 (100.0%) |
Families and Households in Dyer
Median Family Size in Dyer
The median family size in Dyer is 2.67 persons per family, with single female/mother families (1 | 0.3%) accounting for the largest median family size of 8 persons per family. On the other hand, married-couple families (292 | 92.7%) represent the smallest median family size with 2.61 persons per family.
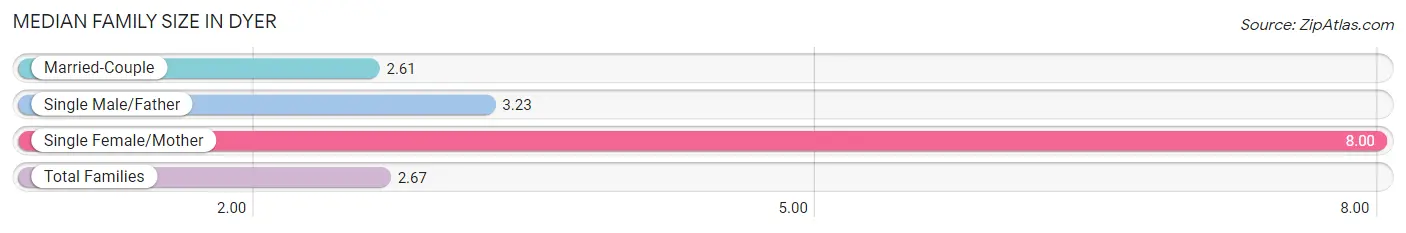
| Family Type | # Families | Family Size |
| Married-Couple | 292 (92.7%) | 2.61 |
| Single Male/Father | 22 (7.0%) | 3.23 |
| Single Female/Mother | 1 (0.3%) | 8.00 |
| Total Families | 315 (100.0%) | 2.67 |
Median Household Size in Dyer
The median household size in Dyer is 2.47 persons per household, with single female/mother households (1 | 0.3%) accounting for the largest median household size of 8 persons per household. non-family households (57 | 15.3%) represent the smallest median household size with 1.18 persons per household.
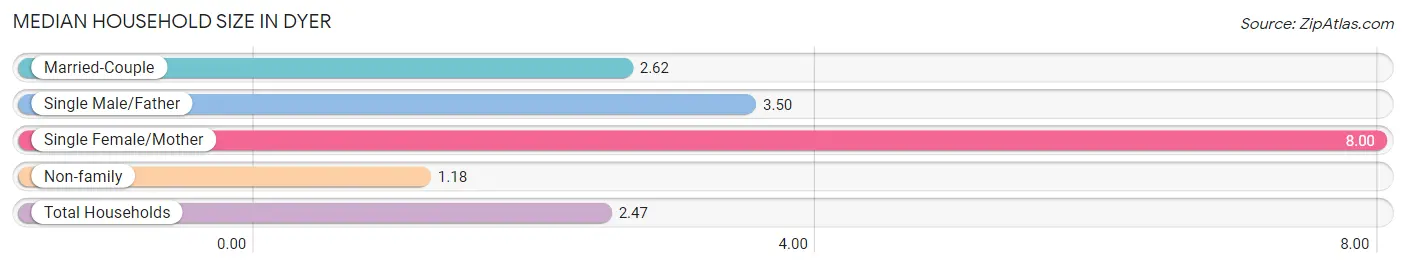
| Household Type | # Households | Household Size |
| Married-Couple | 292 (78.5%) | 2.62 |
| Single Male/Father | 22 (5.9%) | 3.50 |
| Single Female/Mother | 1 (0.3%) | 8.00 |
| Non-family | 57 (15.3%) | 1.18 |
| Total Households | 372 (100.0%) | 2.47 |
Household Size by Marriage Status in Dyer
Out of a total of 372 households in Dyer, 315 (84.7%) are family households, while 57 (15.3%) are nonfamily households. The most numerous type of family households are 3-person households, comprising 121, and the most common type of nonfamily households are 1-person households, comprising 42.
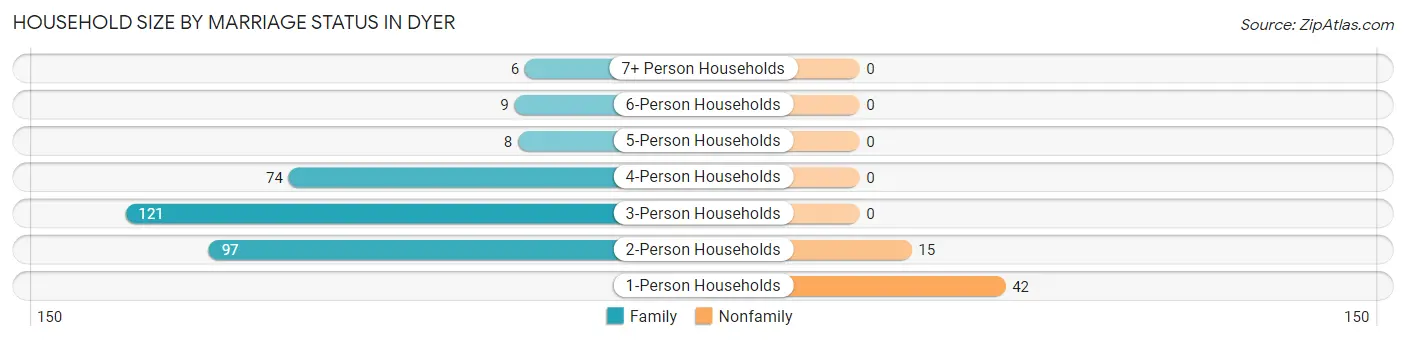
| Household Size | Family Households | Nonfamily Households |
| 1-Person Households | - | 42 (11.3%) |
| 2-Person Households | 97 (26.1%) | 15 (4.0%) |
| 3-Person Households | 121 (32.5%) | 0 (0.0%) |
| 4-Person Households | 74 (19.9%) | 0 (0.0%) |
| 5-Person Households | 8 (2.1%) | 0 (0.0%) |
| 6-Person Households | 9 (2.4%) | 0 (0.0%) |
| 7+ Person Households | 6 (1.6%) | 0 (0.0%) |
| Total | 315 (84.7%) | 57 (15.3%) |
Female Fertility in Dyer
Fertility by Age in Dyer
| Age Bracket | Women with Births | Births / 1,000 Women |
| 15 to 19 years | 0 (0.0%) | 0.0 |
| 20 to 34 years | 0 (0.0%) | 0.0 |
| 35 to 50 years | 0 (0.0%) | 0.0 |
| Total | 0 (0.0%) | 0.0 |
Fertility by Age by Marriage Status in Dyer
| Age Bracket | Married | Unmarried |
| 15 to 19 years | 0 (0.0%) | 0 (0.0%) |
| 20 to 34 years | 0 (0.0%) | 0 (0.0%) |
| 35 to 50 years | 0 (0.0%) | 0 (0.0%) |
| Total | 0 (0.0%) | 0 (0.0%) |
Fertility by Education in Dyer
| Educational Attainment | Women with Births | Births / 1,000 Women |
| Less than High School | 0 (0.0%) | 0.0 |
| High School Diploma | 0 (0.0%) | 0.0 |
| College or Associate's Degree | 0 (0.0%) | 0.0 |
| Bachelor's Degree | 0 (0.0%) | 0.0 |
| Graduate Degree | 0 (0.0%) | 0.0 |
| Total | 0 (0.0%) | 0.0 |
Fertility by Education by Marriage Status in Dyer
| Educational Attainment | Married | Unmarried |
| Less than High School | 0 (0.0%) | 0 (0.0%) |
| High School Diploma | 0 (0.0%) | 0 (0.0%) |
| College or Associate's Degree | 0 (0.0%) | 0 (0.0%) |
| Bachelor's Degree | 0 (0.0%) | 0 (0.0%) |
| Graduate Degree | 0 (0.0%) | 0 (0.0%) |
| Total | 0 (0.0%) | 0 (0.0%) |
Employment Characteristics in Dyer
Employment by Class of Employer in Dyer
Among the 357 employed individuals in Dyer, private company employees (241 | 67.5%), self-employed (not incorporated) (68 | 19.1%), and local government employees (23 | 6.4%) make up the most common classes of employment.
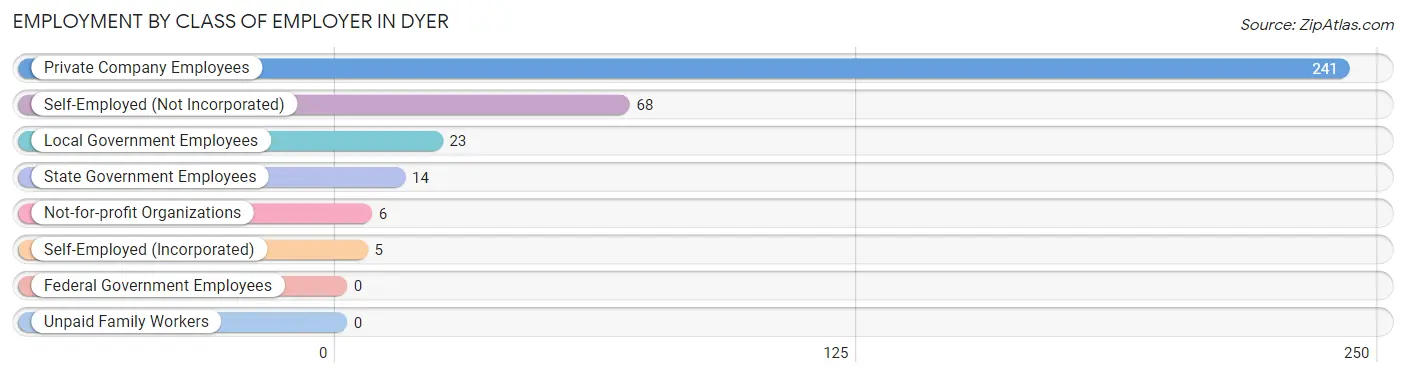
| Employer Class | # Employees | % Employees |
| Private Company Employees | 241 | 67.5% |
| Self-Employed (Incorporated) | 5 | 1.4% |
| Self-Employed (Not Incorporated) | 68 | 19.1% |
| Not-for-profit Organizations | 6 | 1.7% |
| Local Government Employees | 23 | 6.4% |
| State Government Employees | 14 | 3.9% |
| Federal Government Employees | 0 | 0.0% |
| Unpaid Family Workers | 0 | 0.0% |
| Total | 357 | 100.0% |
Employment Status by Age in Dyer
According to the labor force statistics for Dyer, out of the total population over 16 years of age (787), 49.8% or 392 individuals are in the labor force, with 6.6% or 26 of them unemployed. The age group with the highest labor force participation rate is 55 to 59 years, with 84.4% or 108 individuals in the labor force. Within the labor force, the 20 to 24 years age range has the highest percentage of unemployed individuals, with 36.1% or 26 of them being unemployed.
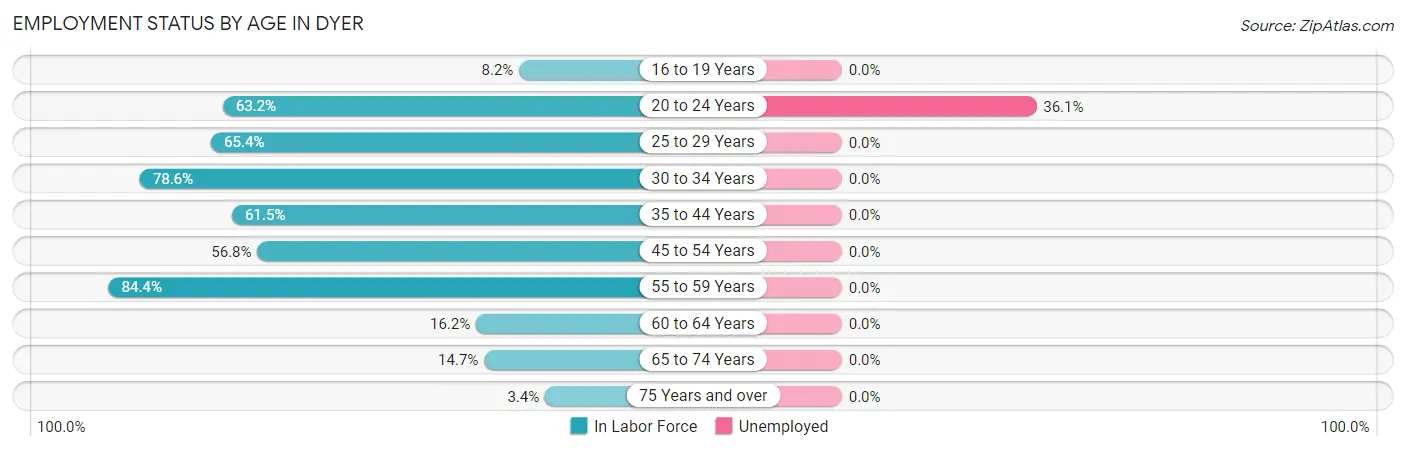
| Age Bracket | In Labor Force | Unemployed |
| 16 to 19 Years | 5 (8.2%) | 0 (0.0%) |
| 20 to 24 Years | 72 (63.2%) | 26 (36.1%) |
| 25 to 29 Years | 17 (65.4%) | 0 (0.0%) |
| 30 to 34 Years | 11 (78.6%) | 0 (0.0%) |
| 35 to 44 Years | 56 (61.5%) | 0 (0.0%) |
| 45 to 54 Years | 104 (56.8%) | 0 (0.0%) |
| 55 to 59 Years | 108 (84.4%) | 0 (0.0%) |
| 60 to 64 Years | 6 (16.2%) | 0 (0.0%) |
| 65 to 74 Years | 11 (14.7%) | 0 (0.0%) |
| 75 Years and over | 2 (3.4%) | 0 (0.0%) |
| Total | 392 (49.8%) | 26 (6.6%) |
Employment Status by Educational Attainment in Dyer
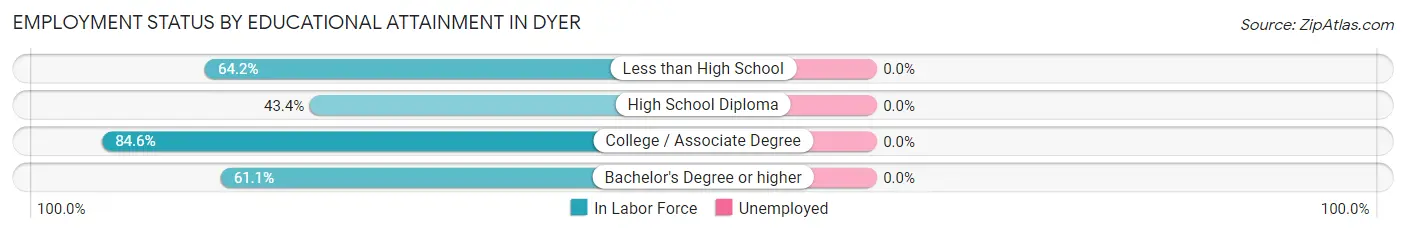
| Educational Attainment | In Labor Force | Unemployed |
| Less than High School | 95 (64.2%) | 0 (0.0%) |
| High School Diploma | 59 (43.4%) | 0 (0.0%) |
| College / Associate Degree | 104 (84.6%) | 0 (0.0%) |
| Bachelor's Degree or higher | 44 (61.1%) | 0 (0.0%) |
| Total | 302 (63.0%) | 0 (0.0%) |
Employment Occupations by Sex in Dyer
Management, Business, Science and Arts Occupations
The most common Management, Business, Science and Arts occupations in Dyer are Management (55 | 15.0%), Health Diagnosing & Treating (24 | 6.6%), Business & Financial (22 | 6.0%), Community & Social Service (19 | 5.2%), and Education Instruction & Library (16 | 4.4%).
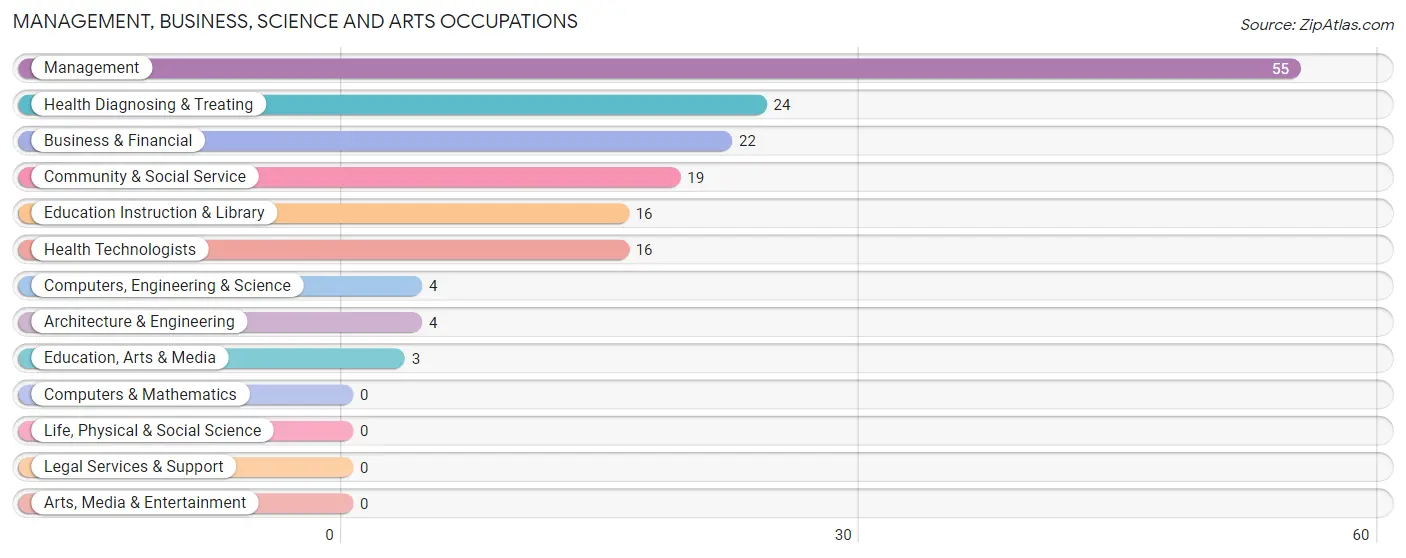
Management, Business, Science and Arts Occupations by Sex
Within the Management, Business, Science and Arts occupations in Dyer, the most male-oriented occupations are Computers, Engineering & Science (100.0%), Architecture & Engineering (100.0%), and Education, Arts & Media (100.0%), while the most female-oriented occupations are Health Diagnosing & Treating (100.0%), Health Technologists (100.0%), and Education Instruction & Library (50.0%).
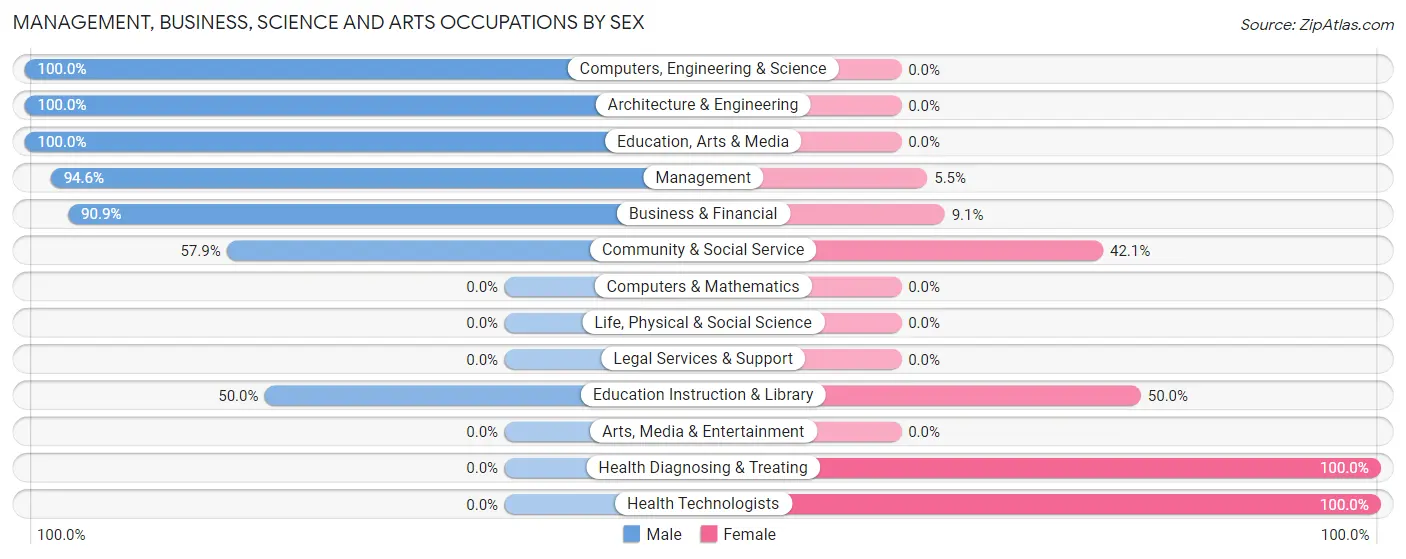
| Occupation | Male | Female |
| Management | 52 (94.6%) | 3 (5.4%) |
| Business & Financial | 20 (90.9%) | 2 (9.1%) |
| Computers, Engineering & Science | 4 (100.0%) | 0 (0.0%) |
| Computers & Mathematics | 0 (0.0%) | 0 (0.0%) |
| Architecture & Engineering | 4 (100.0%) | 0 (0.0%) |
| Life, Physical & Social Science | 0 (0.0%) | 0 (0.0%) |
| Community & Social Service | 11 (57.9%) | 8 (42.1%) |
| Education, Arts & Media | 3 (100.0%) | 0 (0.0%) |
| Legal Services & Support | 0 (0.0%) | 0 (0.0%) |
| Education Instruction & Library | 8 (50.0%) | 8 (50.0%) |
| Arts, Media & Entertainment | 0 (0.0%) | 0 (0.0%) |
| Health Diagnosing & Treating | 0 (0.0%) | 24 (100.0%) |
| Health Technologists | 0 (0.0%) | 16 (100.0%) |
| Total (Category) | 87 (70.2%) | 37 (29.8%) |
| Total (Overall) | 284 (77.6%) | 82 (22.4%) |
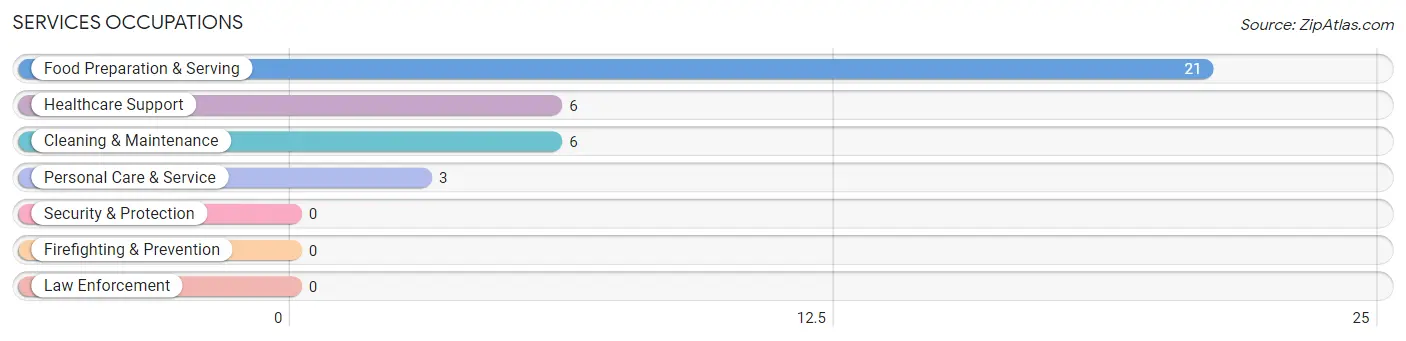
Services Occupations
The most common Services occupations in Dyer are Food Preparation & Serving (21 | 5.7%), Healthcare Support (6 | 1.6%), Cleaning & Maintenance (6 | 1.6%), and Personal Care & Service (3 | 0.8%).
Services Occupations by Sex
Within the Services occupations in Dyer, the most male-oriented occupations are Cleaning & Maintenance (100.0%), Food Preparation & Serving (71.4%), and Healthcare Support (50.0%), while the most female-oriented occupations are Personal Care & Service (100.0%), Healthcare Support (50.0%), and Food Preparation & Serving (28.6%).
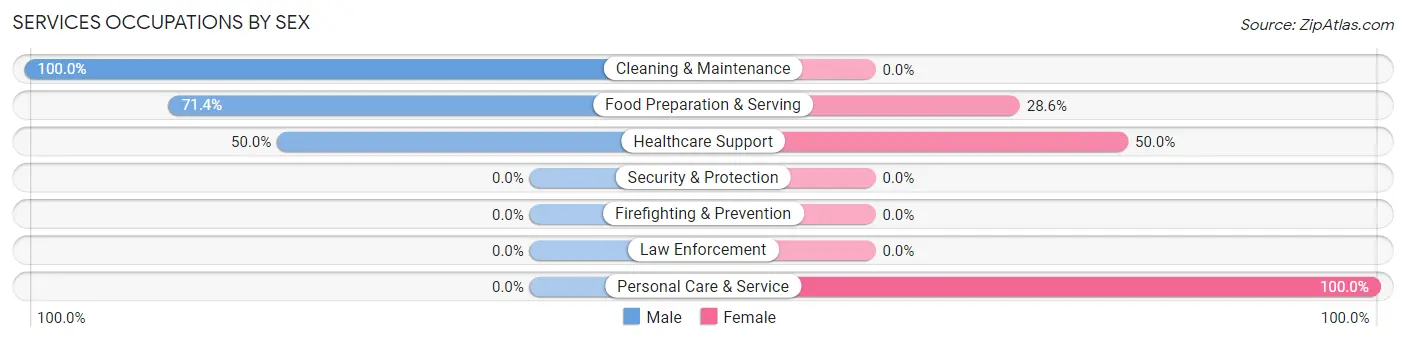
| Occupation | Male | Female |
| Healthcare Support | 3 (50.0%) | 3 (50.0%) |
| Security & Protection | 0 (0.0%) | 0 (0.0%) |
| Firefighting & Prevention | 0 (0.0%) | 0 (0.0%) |
| Law Enforcement | 0 (0.0%) | 0 (0.0%) |
| Food Preparation & Serving | 15 (71.4%) | 6 (28.6%) |
| Cleaning & Maintenance | 6 (100.0%) | 0 (0.0%) |
| Personal Care & Service | 0 (0.0%) | 3 (100.0%) |
| Total (Category) | 24 (66.7%) | 12 (33.3%) |
| Total (Overall) | 284 (77.6%) | 82 (22.4%) |
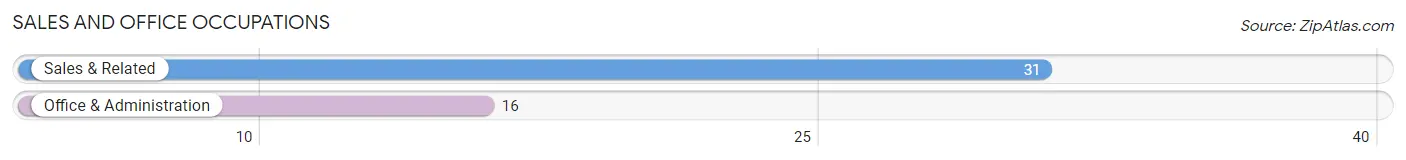
Sales and Office Occupations
The most common Sales and Office occupations in Dyer are Sales & Related (31 | 8.5%), and Office & Administration (16 | 4.4%).
Sales and Office Occupations by Sex
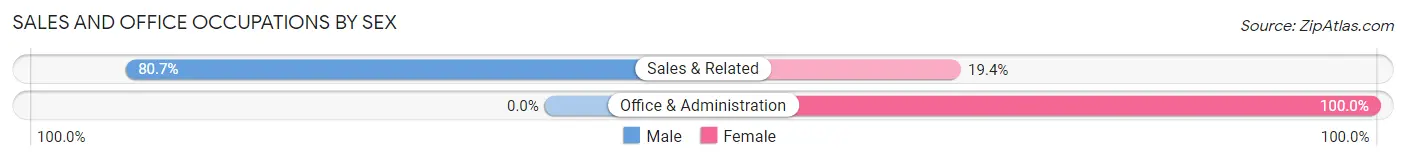
| Occupation | Male | Female |
| Sales & Related | 25 (80.6%) | 6 (19.4%) |
| Office & Administration | 0 (0.0%) | 16 (100.0%) |
| Total (Category) | 25 (53.2%) | 22 (46.8%) |
| Total (Overall) | 284 (77.6%) | 82 (22.4%) |
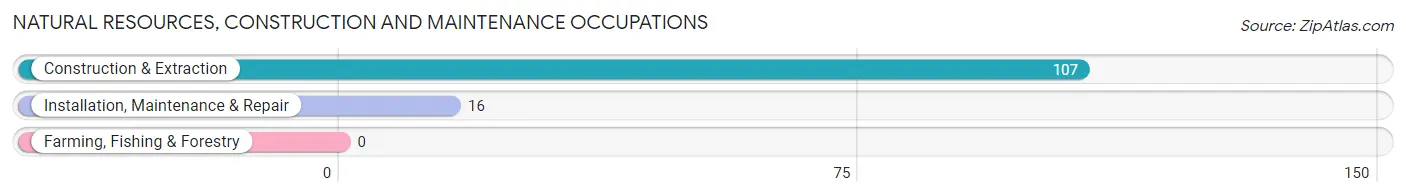
Natural Resources, Construction and Maintenance Occupations
The most common Natural Resources, Construction and Maintenance occupations in Dyer are Construction & Extraction (107 | 29.2%), and Installation, Maintenance & Repair (16 | 4.4%).
Natural Resources, Construction and Maintenance Occupations by Sex
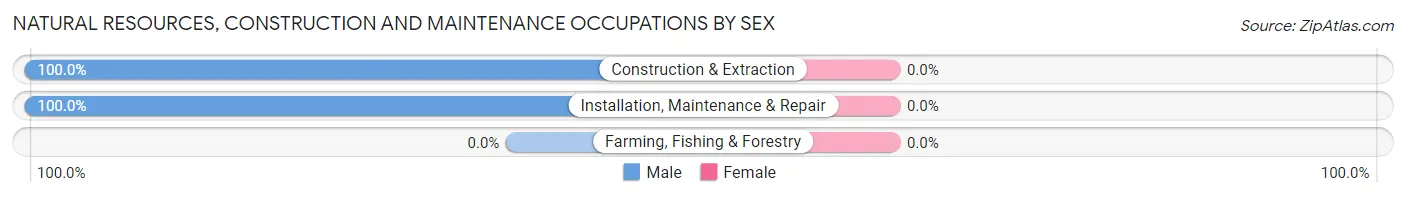
| Occupation | Male | Female |
| Farming, Fishing & Forestry | 0 (0.0%) | 0 (0.0%) |
| Construction & Extraction | 107 (100.0%) | 0 (0.0%) |
| Installation, Maintenance & Repair | 16 (100.0%) | 0 (0.0%) |
| Total (Category) | 123 (100.0%) | 0 (0.0%) |
| Total (Overall) | 284 (77.6%) | 82 (22.4%) |
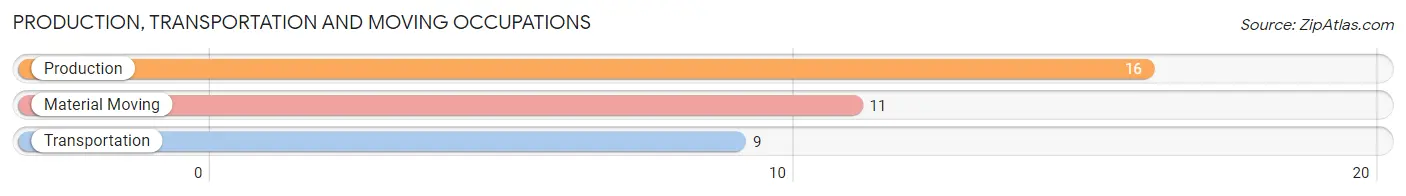
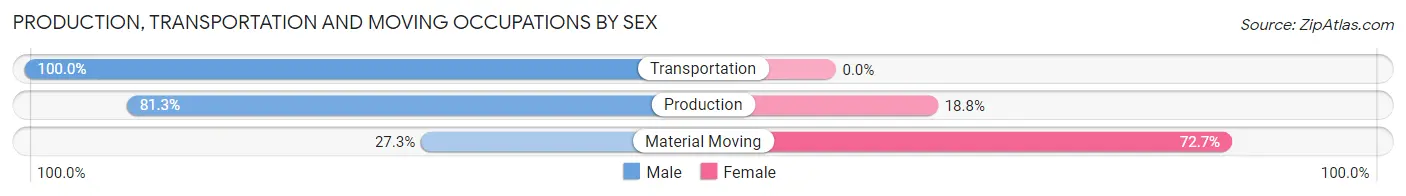
Production, Transportation and Moving Occupations
The most common Production, Transportation and Moving occupations in Dyer are Production (16 | 4.4%), Material Moving (11 | 3.0%), and Transportation (9 | 2.5%).
Production, Transportation and Moving Occupations by Sex
| Occupation | Male | Female |
| Production | 13 (81.2%) | 3 (18.8%) |
| Transportation | 9 (100.0%) | 0 (0.0%) |
| Material Moving | 3 (27.3%) | 8 (72.7%) |
| Total (Category) | 25 (69.4%) | 11 (30.6%) |
| Total (Overall) | 284 (77.6%) | 82 (22.4%) |
Employment Industries by Sex in Dyer
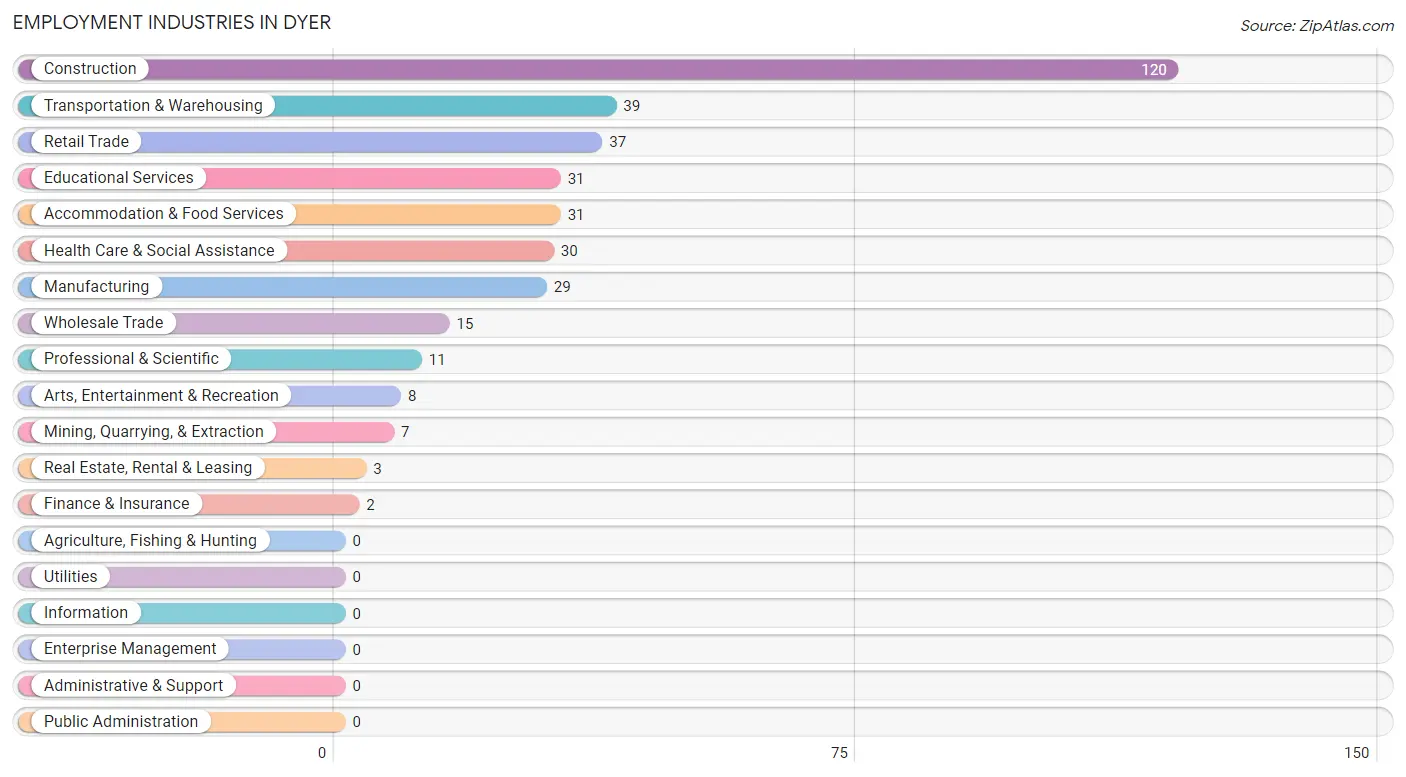
Employment Industries in Dyer
The major employment industries in Dyer include Construction (120 | 32.8%), Transportation & Warehousing (39 | 10.7%), Retail Trade (37 | 10.1%), Educational Services (31 | 8.5%), and Accommodation & Food Services (31 | 8.5%).
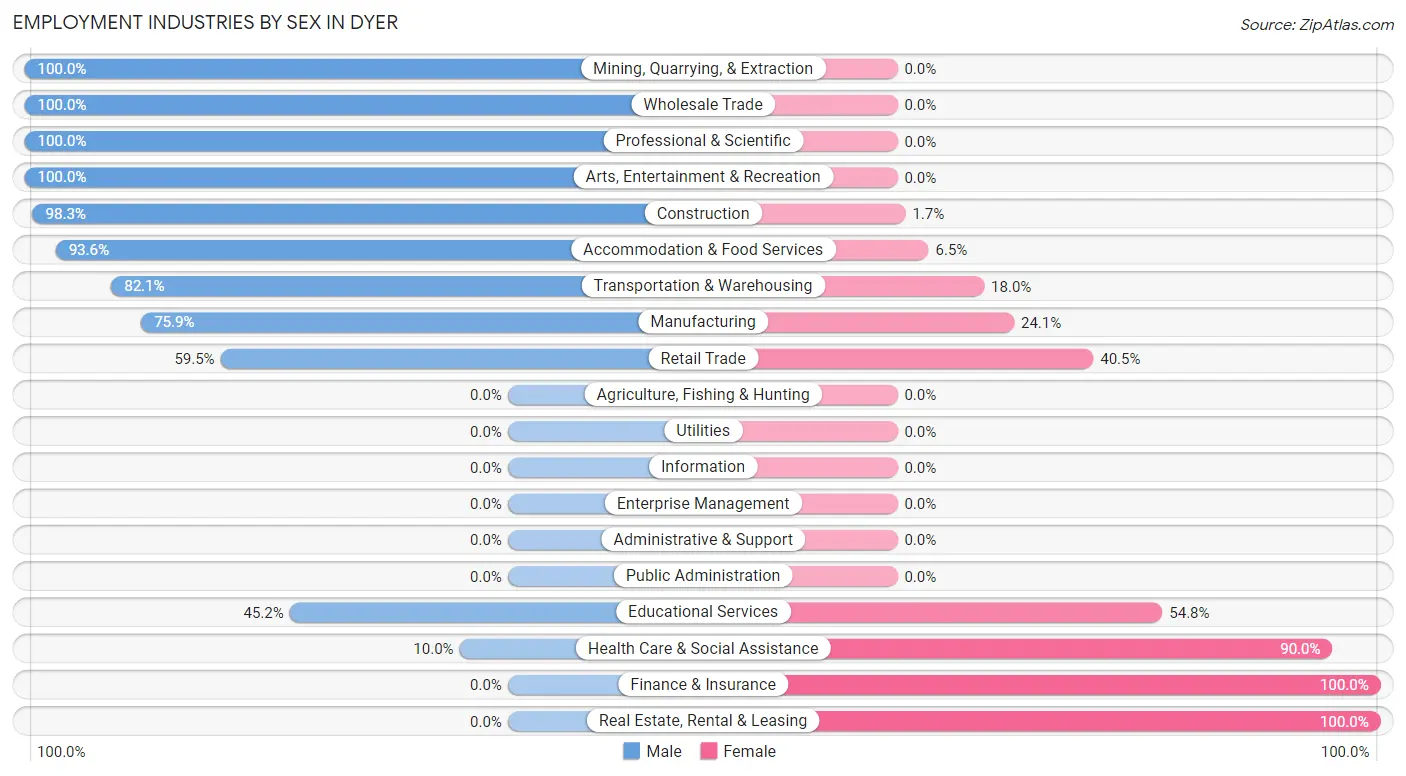
Employment Industries by Sex in Dyer
The Dyer industries that see more men than women are Mining, Quarrying, & Extraction (100.0%), Wholesale Trade (100.0%), and Professional & Scientific (100.0%), whereas the industries that tend to have a higher number of women are Finance & Insurance (100.0%), Real Estate, Rental & Leasing (100.0%), and Health Care & Social Assistance (90.0%).
| Industry | Male | Female |
| Agriculture, Fishing & Hunting | 0 (0.0%) | 0 (0.0%) |
| Mining, Quarrying, & Extraction | 7 (100.0%) | 0 (0.0%) |
| Construction | 118 (98.3%) | 2 (1.7%) |
| Manufacturing | 22 (75.9%) | 7 (24.1%) |
| Wholesale Trade | 15 (100.0%) | 0 (0.0%) |
| Retail Trade | 22 (59.5%) | 15 (40.5%) |
| Transportation & Warehousing | 32 (82.1%) | 7 (17.9%) |
| Utilities | 0 (0.0%) | 0 (0.0%) |
| Information | 0 (0.0%) | 0 (0.0%) |
| Finance & Insurance | 0 (0.0%) | 2 (100.0%) |
| Real Estate, Rental & Leasing | 0 (0.0%) | 3 (100.0%) |
| Professional & Scientific | 11 (100.0%) | 0 (0.0%) |
| Enterprise Management | 0 (0.0%) | 0 (0.0%) |
| Administrative & Support | 0 (0.0%) | 0 (0.0%) |
| Educational Services | 14 (45.2%) | 17 (54.8%) |
| Health Care & Social Assistance | 3 (10.0%) | 27 (90.0%) |
| Arts, Entertainment & Recreation | 8 (100.0%) | 0 (0.0%) |
| Accommodation & Food Services | 29 (93.5%) | 2 (6.5%) |
| Public Administration | 0 (0.0%) | 0 (0.0%) |
| Total | 284 (77.6%) | 82 (22.4%) |
Education in Dyer
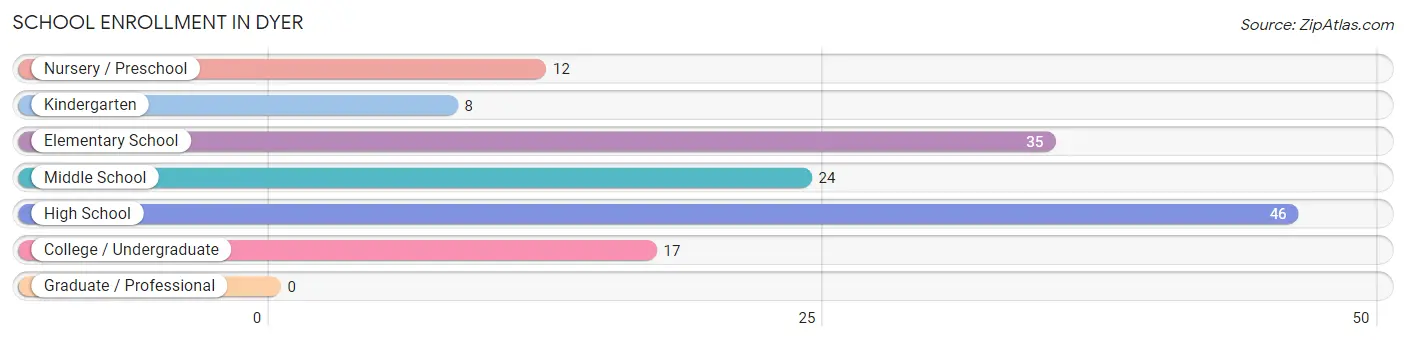
School Enrollment in Dyer
The most common levels of schooling among the 142 students in Dyer are high school (46 | 32.4%), elementary school (35 | 24.6%), and middle school (24 | 16.9%).
| School Level | # Students | % Students |
| Nursery / Preschool | 12 | 8.5% |
| Kindergarten | 8 | 5.6% |
| Elementary School | 35 | 24.6% |
| Middle School | 24 | 16.9% |
| High School | 46 | 32.4% |
| College / Undergraduate | 17 | 12.0% |
| Graduate / Professional | 0 | 0.0% |
| Total | 142 | 100.0% |
School Enrollment by Age by Funding Source in Dyer
Out of a total of 142 students who are enrolled in schools in Dyer, 12 (8.5%) attend a private institution, while the remaining 130 (91.5%) are enrolled in public schools. The age group of 3 to 4 year olds has the highest likelihood of being enrolled in private schools, with 12 (100.0% in the age bracket) enrolled. Conversely, the age group of 5 to 9 year old has the lowest likelihood of being enrolled in a private school, with 30 (100.0% in the age bracket) attending a public institution.
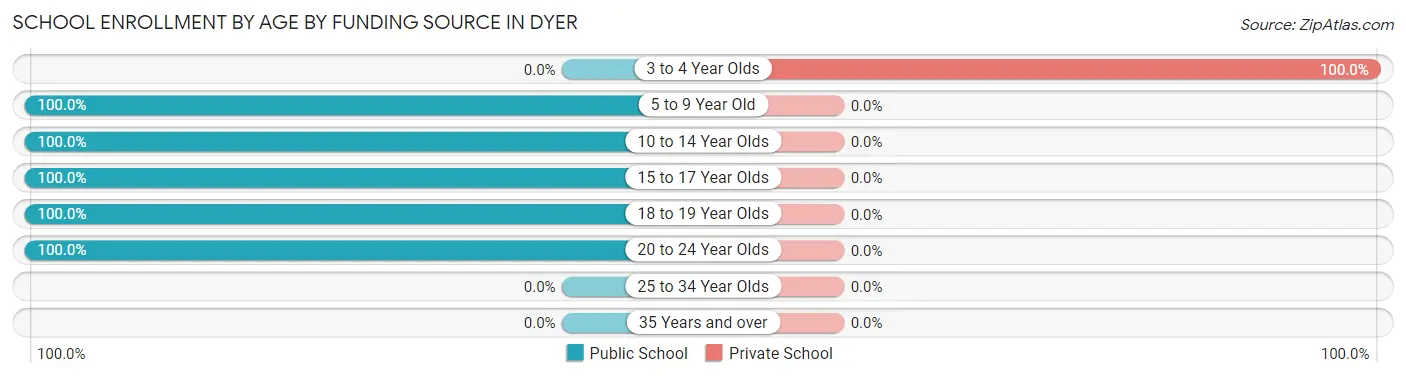
| Age Bracket | Public School | Private School |
| 3 to 4 Year Olds | 0 (0.0%) | 12 (100.0%) |
| 5 to 9 Year Old | 30 (100.0%) | 0 (0.0%) |
| 10 to 14 Year Olds | 37 (100.0%) | 0 (0.0%) |
| 15 to 17 Year Olds | 38 (100.0%) | 0 (0.0%) |
| 18 to 19 Year Olds | 13 (100.0%) | 0 (0.0%) |
| 20 to 24 Year Olds | 12 (100.0%) | 0 (0.0%) |
| 25 to 34 Year Olds | 0 (0.0%) | 0 (0.0%) |
| 35 Years and over | 0 (0.0%) | 0 (0.0%) |
| Total | 130 (91.5%) | 12 (8.5%) |
Educational Attainment by Field of Study in Dyer
Education (32 | 31.4%), business (22 | 21.6%), science & technology (12 | 11.8%), liberal arts & history (11 | 10.8%), and engineering (10 | 9.8%) are the most common fields of study among 102 individuals in Dyer who have obtained a bachelor's degree or higher.
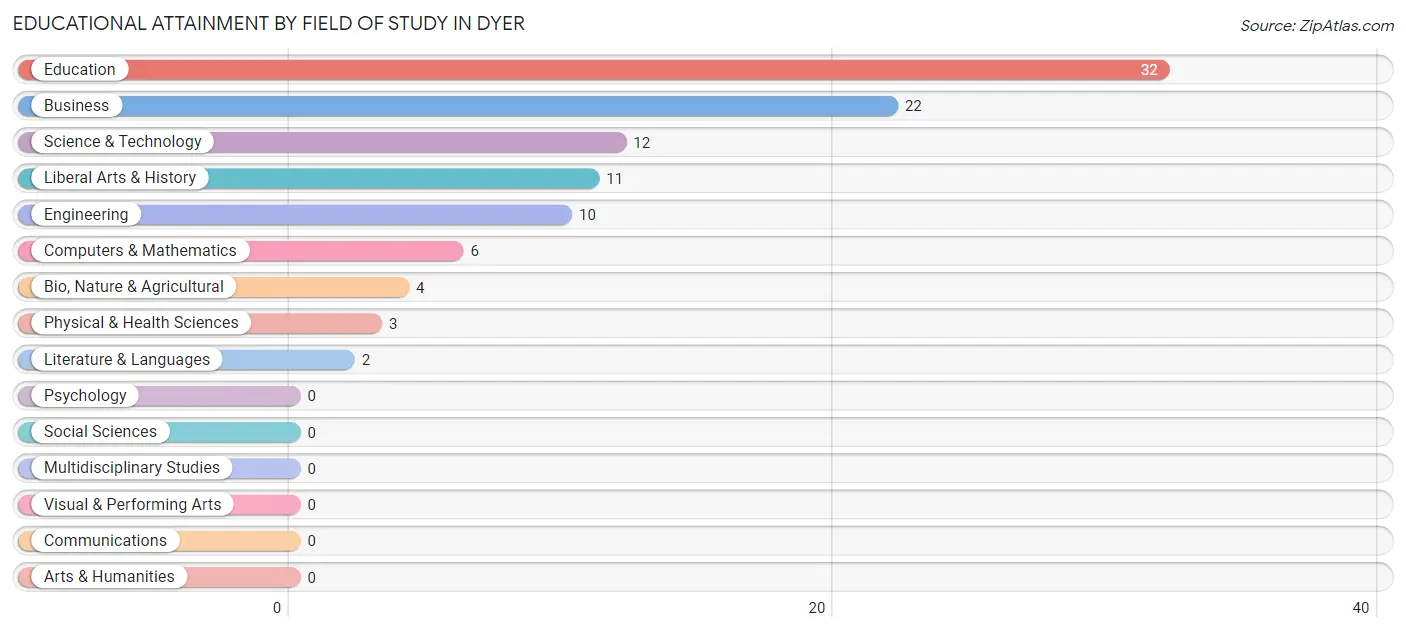
| Field of Study | # Graduates | % Graduates |
| Computers & Mathematics | 6 | 5.9% |
| Bio, Nature & Agricultural | 4 | 3.9% |
| Physical & Health Sciences | 3 | 2.9% |
| Psychology | 0 | 0.0% |
| Social Sciences | 0 | 0.0% |
| Engineering | 10 | 9.8% |
| Multidisciplinary Studies | 0 | 0.0% |
| Science & Technology | 12 | 11.8% |
| Business | 22 | 21.6% |
| Education | 32 | 31.4% |
| Literature & Languages | 2 | 2.0% |
| Liberal Arts & History | 11 | 10.8% |
| Visual & Performing Arts | 0 | 0.0% |
| Communications | 0 | 0.0% |
| Arts & Humanities | 0 | 0.0% |
| Total | 102 | 100.0% |
Transportation & Commute in Dyer
Vehicle Availability by Sex in Dyer
The most prevalent vehicle ownership categories in Dyer are males with 5 or more vehicles (84, accounting for 30.1%) and females with 5 or more vehicles (6, making up 107.7%).
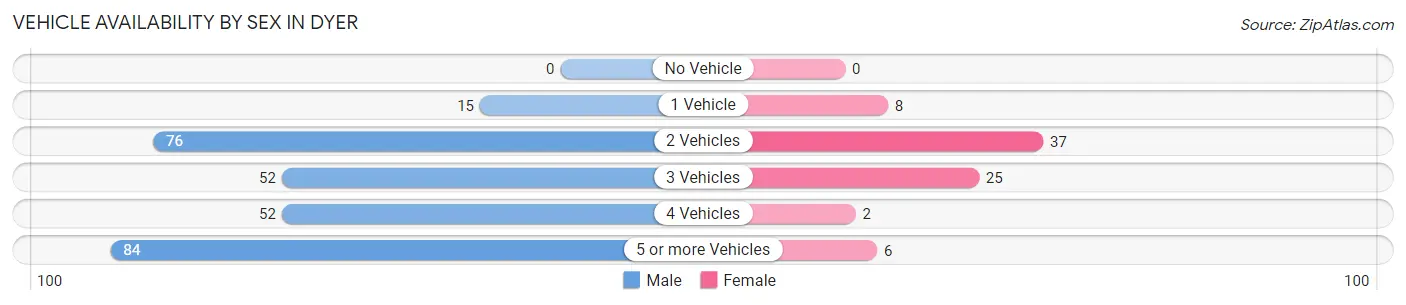
| Vehicles Available | Male | Female |
| No Vehicle | 0 (0.0%) | 0 (0.0%) |
| 1 Vehicle | 15 (5.4%) | 8 (10.3%) |
| 2 Vehicles | 76 (27.2%) | 37 (47.4%) |
| 3 Vehicles | 52 (18.6%) | 25 (32.1%) |
| 4 Vehicles | 52 (18.6%) | 2 (2.6%) |
| 5 or more Vehicles | 84 (30.1%) | 6 (7.7%) |
| Total | 279 (100.0%) | 78 (100.0%) |
Commute Time in Dyer
The most frequently occuring commute durations in Dyer are 15 to 19 minutes (110 commuters, 31.0%), 25 to 29 minutes (86 commuters, 24.2%), and 30 to 34 minutes (44 commuters, 12.4%).
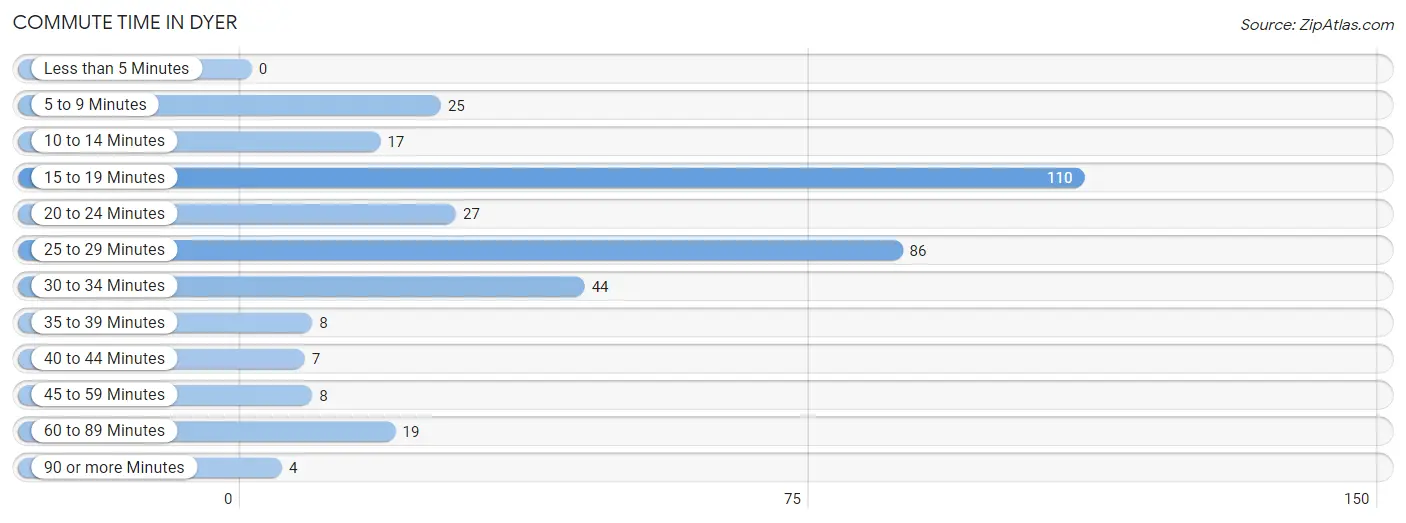
| Commute Time | # Commuters | % Commuters |
| Less than 5 Minutes | 0 | 0.0% |
| 5 to 9 Minutes | 25 | 7.0% |
| 10 to 14 Minutes | 17 | 4.8% |
| 15 to 19 Minutes | 110 | 31.0% |
| 20 to 24 Minutes | 27 | 7.6% |
| 25 to 29 Minutes | 86 | 24.2% |
| 30 to 34 Minutes | 44 | 12.4% |
| 35 to 39 Minutes | 8 | 2.2% |
| 40 to 44 Minutes | 7 | 2.0% |
| 45 to 59 Minutes | 8 | 2.2% |
| 60 to 89 Minutes | 19 | 5.3% |
| 90 or more Minutes | 4 | 1.1% |
Commute Time by Sex in Dyer
The most common commute times in Dyer are 25 to 29 minutes (83 commuters, 30.0%) for males and 15 to 19 minutes (28 commuters, 35.9%) for females.
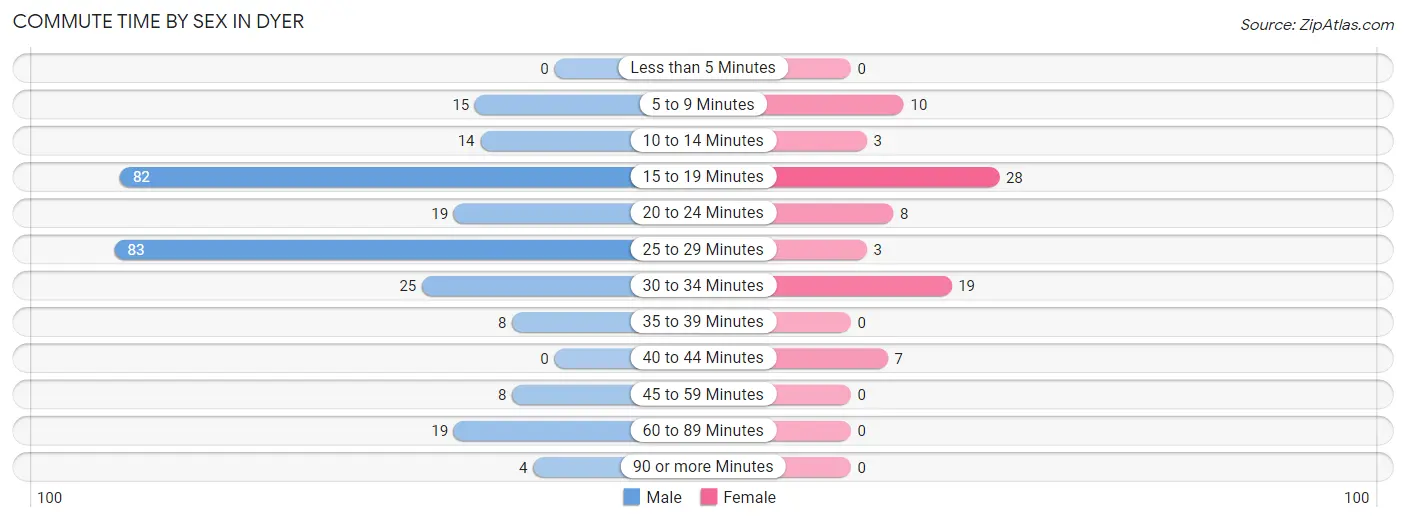
| Commute Time | Male | Female |
| Less than 5 Minutes | 0 (0.0%) | 0 (0.0%) |
| 5 to 9 Minutes | 15 (5.4%) | 10 (12.8%) |
| 10 to 14 Minutes | 14 (5.1%) | 3 (3.8%) |
| 15 to 19 Minutes | 82 (29.6%) | 28 (35.9%) |
| 20 to 24 Minutes | 19 (6.9%) | 8 (10.3%) |
| 25 to 29 Minutes | 83 (30.0%) | 3 (3.8%) |
| 30 to 34 Minutes | 25 (9.0%) | 19 (24.4%) |
| 35 to 39 Minutes | 8 (2.9%) | 0 (0.0%) |
| 40 to 44 Minutes | 0 (0.0%) | 7 (9.0%) |
| 45 to 59 Minutes | 8 (2.9%) | 0 (0.0%) |
| 60 to 89 Minutes | 19 (6.9%) | 0 (0.0%) |
| 90 or more Minutes | 4 (1.4%) | 0 (0.0%) |
Time of Departure to Work by Sex in Dyer
The most frequent times of departure to work in Dyer are 6:00 AM to 6:29 AM (99, 35.7%) for males and 7:30 AM to 7:59 AM (25, 32.1%) for females.
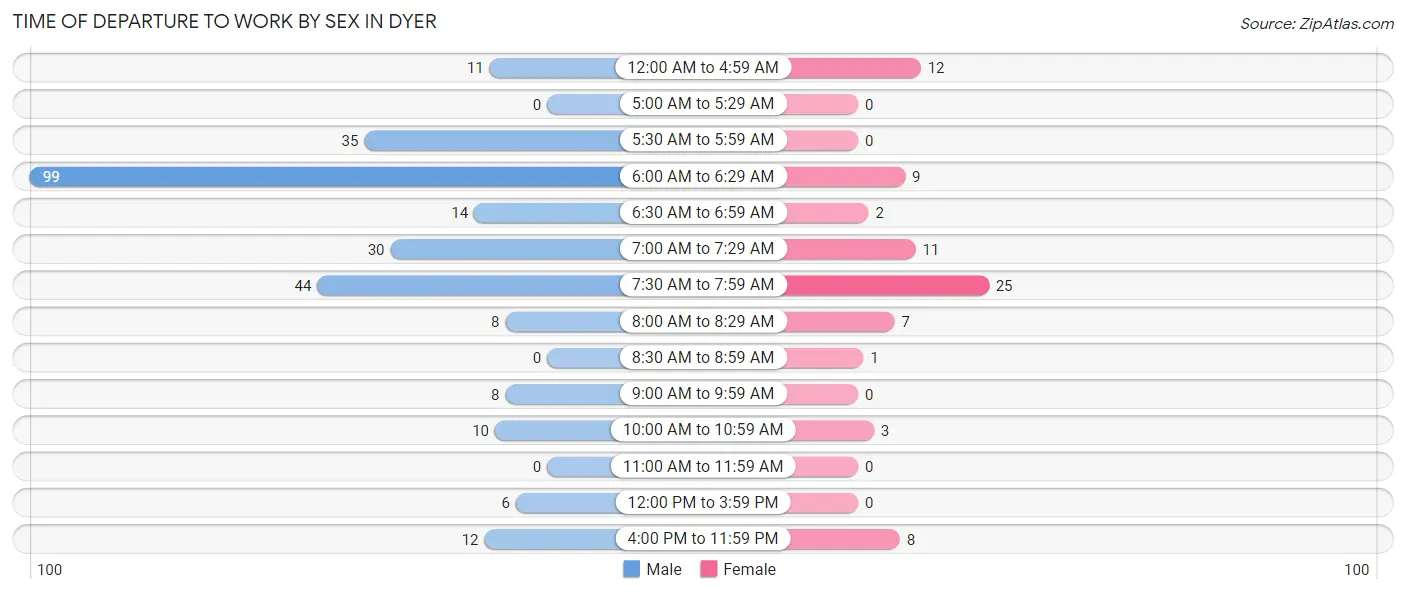
| Time of Departure | Male | Female |
| 12:00 AM to 4:59 AM | 11 (4.0%) | 12 (15.4%) |
| 5:00 AM to 5:29 AM | 0 (0.0%) | 0 (0.0%) |
| 5:30 AM to 5:59 AM | 35 (12.6%) | 0 (0.0%) |
| 6:00 AM to 6:29 AM | 99 (35.7%) | 9 (11.5%) |
| 6:30 AM to 6:59 AM | 14 (5.1%) | 2 (2.6%) |
| 7:00 AM to 7:29 AM | 30 (10.8%) | 11 (14.1%) |
| 7:30 AM to 7:59 AM | 44 (15.9%) | 25 (32.1%) |
| 8:00 AM to 8:29 AM | 8 (2.9%) | 7 (9.0%) |
| 8:30 AM to 8:59 AM | 0 (0.0%) | 1 (1.3%) |
| 9:00 AM to 9:59 AM | 8 (2.9%) | 0 (0.0%) |
| 10:00 AM to 10:59 AM | 10 (3.6%) | 3 (3.8%) |
| 11:00 AM to 11:59 AM | 0 (0.0%) | 0 (0.0%) |
| 12:00 PM to 3:59 PM | 6 (2.2%) | 0 (0.0%) |
| 4:00 PM to 11:59 PM | 12 (4.3%) | 8 (10.3%) |
| Total | 277 (100.0%) | 78 (100.0%) |
Housing Occupancy in Dyer
Occupancy by Ownership in Dyer
Of the total 372 dwellings in Dyer, owner-occupied units account for 299 (80.4%), while renter-occupied units make up 73 (19.6%).
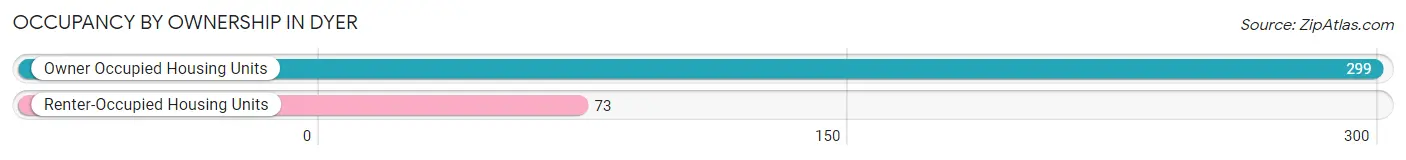
| Occupancy | # Housing Units | % Housing Units |
| Owner Occupied Housing Units | 299 | 80.4% |
| Renter-Occupied Housing Units | 73 | 19.6% |
| Total Occupied Housing Units | 372 | 100.0% |
Occupancy by Household Size in Dyer
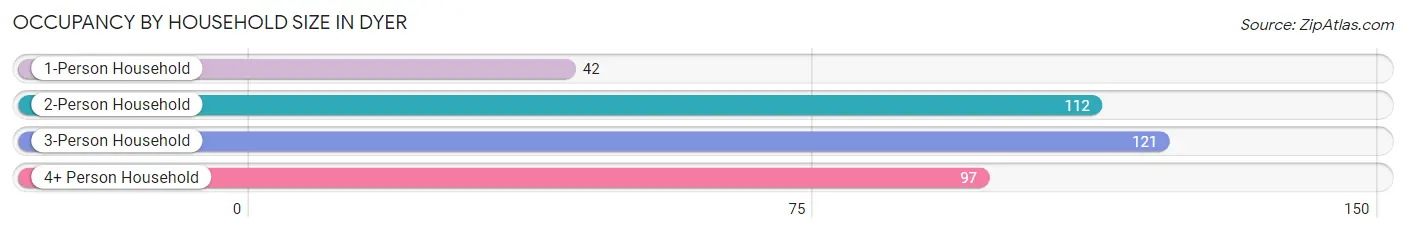
| Household Size | # Housing Units | % Housing Units |
| 1-Person Household | 42 | 11.3% |
| 2-Person Household | 112 | 30.1% |
| 3-Person Household | 121 | 32.5% |
| 4+ Person Household | 97 | 26.1% |
| Total Housing Units | 372 | 100.0% |
Occupancy by Ownership by Household Size in Dyer
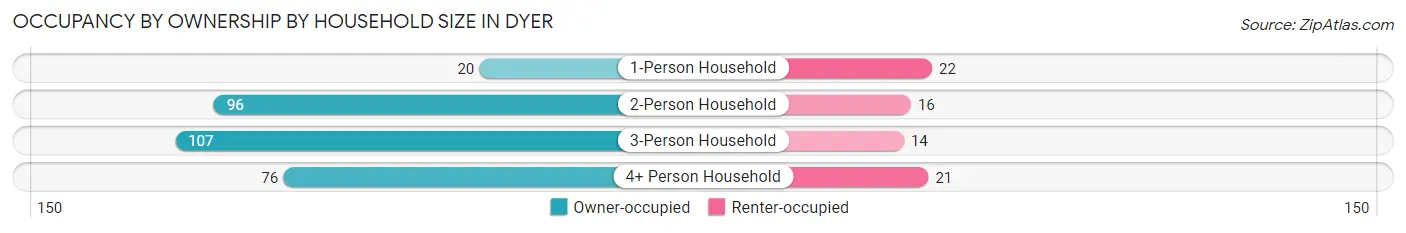
| Household Size | Owner-occupied | Renter-occupied |
| 1-Person Household | 20 (47.6%) | 22 (52.4%) |
| 2-Person Household | 96 (85.7%) | 16 (14.3%) |
| 3-Person Household | 107 (88.4%) | 14 (11.6%) |
| 4+ Person Household | 76 (78.3%) | 21 (21.6%) |
| Total Housing Units | 299 (80.4%) | 73 (19.6%) |
Occupancy by Educational Attainment in Dyer
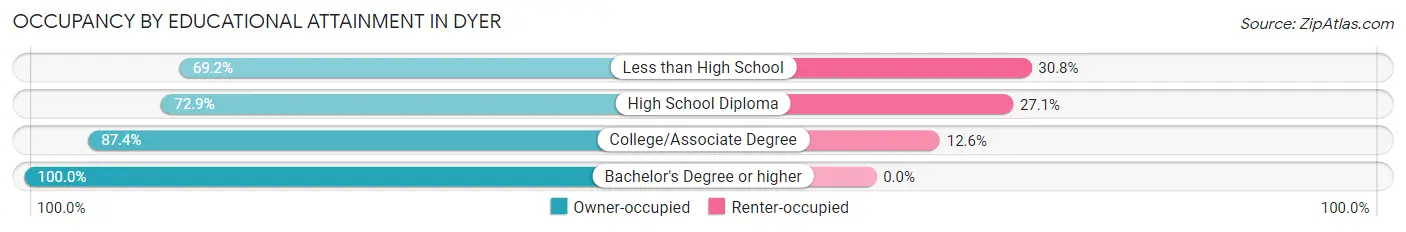
| Household Size | Owner-occupied | Renter-occupied |
| Less than High School | 99 (69.2%) | 44 (30.8%) |
| High School Diploma | 43 (72.9%) | 16 (27.1%) |
| College/Associate Degree | 90 (87.4%) | 13 (12.6%) |
| Bachelor's Degree or higher | 67 (100.0%) | 0 (0.0%) |
Occupancy by Age of Householder in Dyer
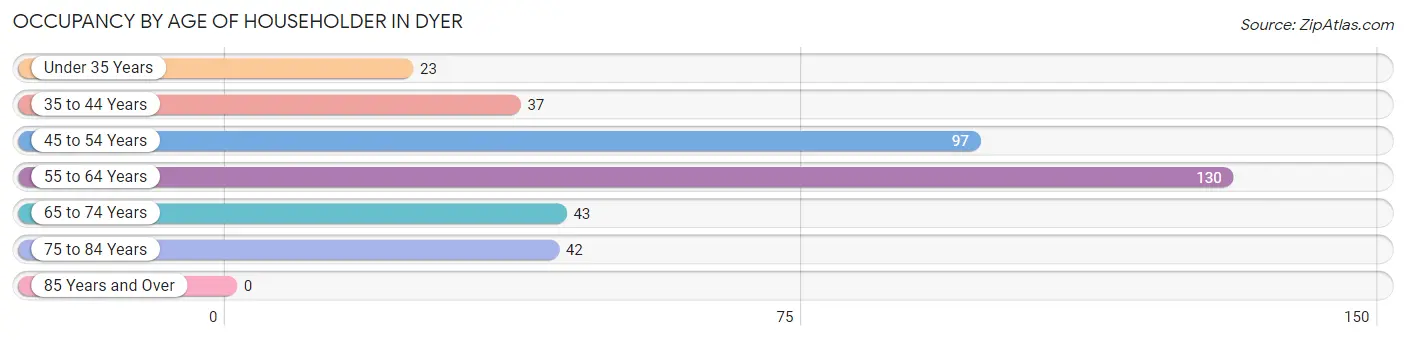
| Age Bracket | # Households | % Households |
| Under 35 Years | 23 | 6.2% |
| 35 to 44 Years | 37 | 10.0% |
| 45 to 54 Years | 97 | 26.1% |
| 55 to 64 Years | 130 | 34.9% |
| 65 to 74 Years | 43 | 11.6% |
| 75 to 84 Years | 42 | 11.3% |
| 85 Years and Over | 0 | 0.0% |
| Total | 372 | 100.0% |
Housing Finances in Dyer
Median Income by Occupancy in Dyer
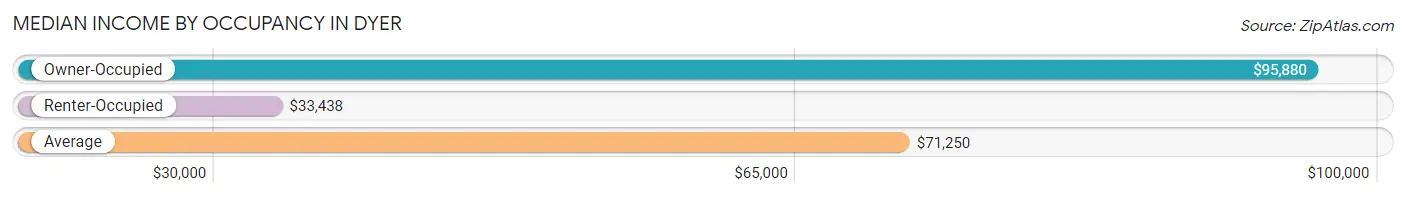
| Occupancy Type | # Households | Median Income |
| Owner-Occupied | 299 (80.4%) | $95,880 |
| Renter-Occupied | 73 (19.6%) | $33,438 |
| Average | 372 (100.0%) | $71,250 |
Occupancy by Householder Income Bracket in Dyer
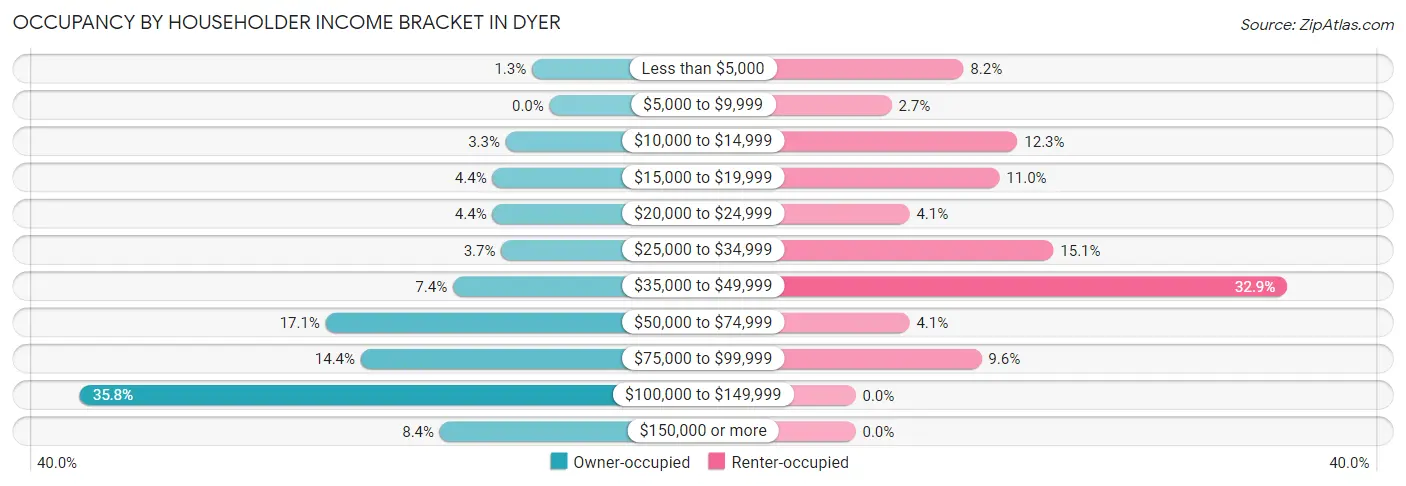
| Income Bracket | Owner-occupied | Renter-occupied |
| Less than $5,000 | 4 (1.3%) | 6 (8.2%) |
| $5,000 to $9,999 | 0 (0.0%) | 2 (2.7%) |
| $10,000 to $14,999 | 10 (3.3%) | 9 (12.3%) |
| $15,000 to $19,999 | 13 (4.3%) | 8 (11.0%) |
| $20,000 to $24,999 | 13 (4.3%) | 3 (4.1%) |
| $25,000 to $34,999 | 11 (3.7%) | 11 (15.1%) |
| $35,000 to $49,999 | 22 (7.4%) | 24 (32.9%) |
| $50,000 to $74,999 | 51 (17.1%) | 3 (4.1%) |
| $75,000 to $99,999 | 43 (14.4%) | 7 (9.6%) |
| $100,000 to $149,999 | 107 (35.8%) | 0 (0.0%) |
| $150,000 or more | 25 (8.4%) | 0 (0.0%) |
| Total | 299 (100.0%) | 73 (100.0%) |
Monthly Housing Cost Tiers in Dyer
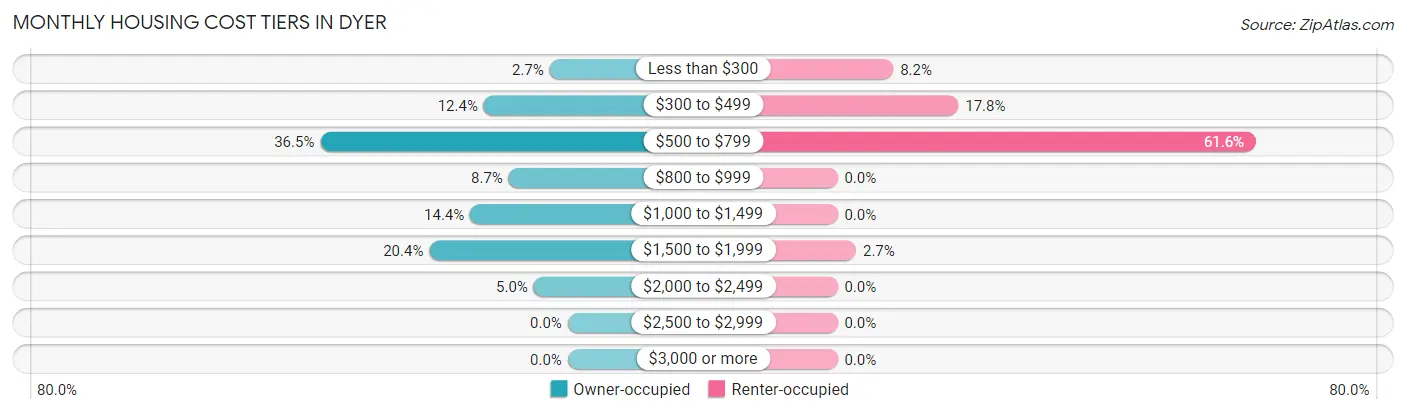
| Monthly Cost | Owner-occupied | Renter-occupied |
| Less than $300 | 8 (2.7%) | 6 (8.2%) |
| $300 to $499 | 37 (12.4%) | 13 (17.8%) |
| $500 to $799 | 109 (36.4%) | 45 (61.6%) |
| $800 to $999 | 26 (8.7%) | 0 (0.0%) |
| $1,000 to $1,499 | 43 (14.4%) | 0 (0.0%) |
| $1,500 to $1,999 | 61 (20.4%) | 2 (2.7%) |
| $2,000 to $2,499 | 15 (5.0%) | 0 (0.0%) |
| $2,500 to $2,999 | 0 (0.0%) | 0 (0.0%) |
| $3,000 or more | 0 (0.0%) | 0 (0.0%) |
| Total | 299 (100.0%) | 73 (100.0%) |
Physical Housing Characteristics in Dyer
Housing Structures in Dyer
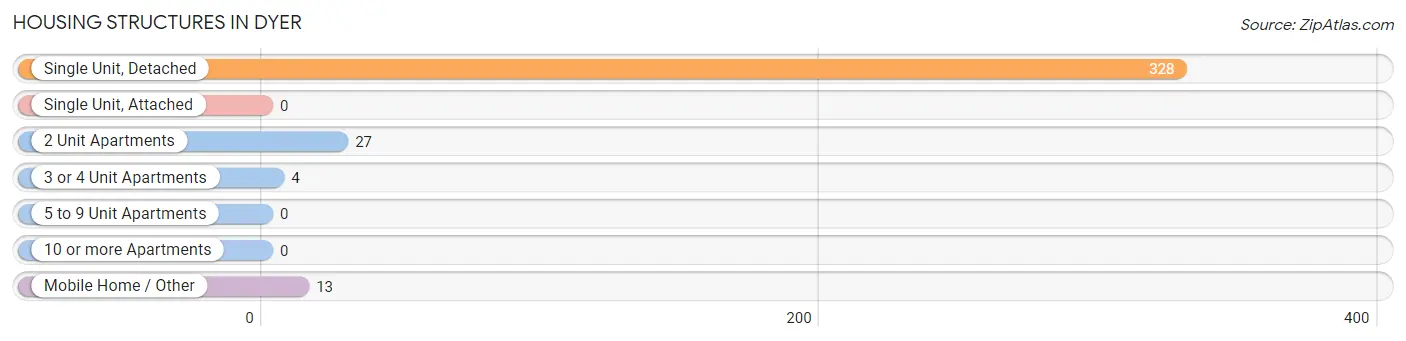
| Structure Type | # Housing Units | % Housing Units |
| Single Unit, Detached | 328 | 88.2% |
| Single Unit, Attached | 0 | 0.0% |
| 2 Unit Apartments | 27 | 7.3% |
| 3 or 4 Unit Apartments | 4 | 1.1% |
| 5 to 9 Unit Apartments | 0 | 0.0% |
| 10 or more Apartments | 0 | 0.0% |
| Mobile Home / Other | 13 | 3.5% |
| Total | 372 | 100.0% |
Housing Structures by Occupancy in Dyer
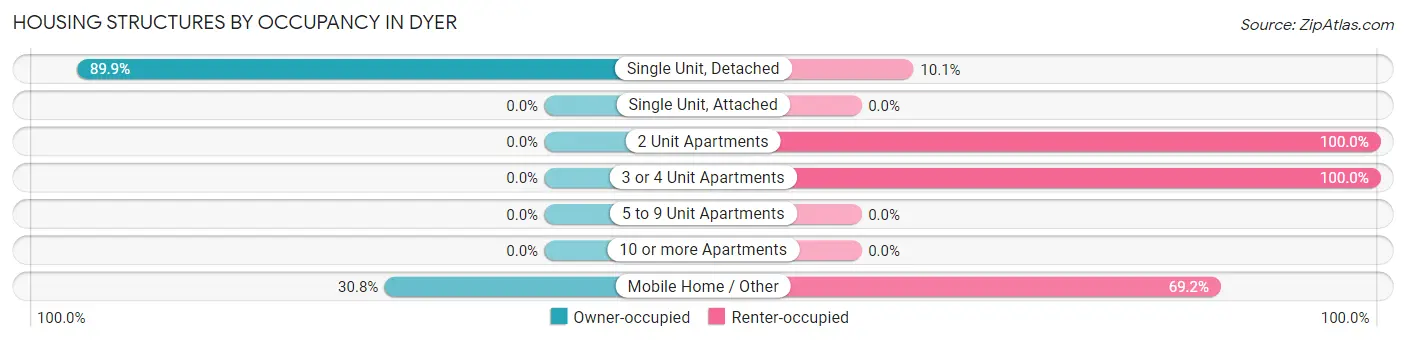
| Structure Type | Owner-occupied | Renter-occupied |
| Single Unit, Detached | 295 (89.9%) | 33 (10.1%) |
| Single Unit, Attached | 0 (0.0%) | 0 (0.0%) |
| 2 Unit Apartments | 0 (0.0%) | 27 (100.0%) |
| 3 or 4 Unit Apartments | 0 (0.0%) | 4 (100.0%) |
| 5 to 9 Unit Apartments | 0 (0.0%) | 0 (0.0%) |
| 10 or more Apartments | 0 (0.0%) | 0 (0.0%) |
| Mobile Home / Other | 4 (30.8%) | 9 (69.2%) |
| Total | 299 (80.4%) | 73 (19.6%) |
Housing Structures by Number of Rooms in Dyer
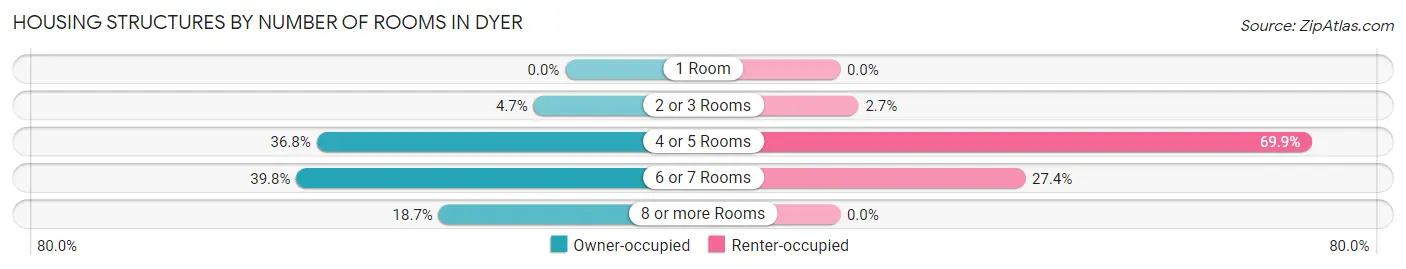
| Number of Rooms | Owner-occupied | Renter-occupied |
| 1 Room | 0 (0.0%) | 0 (0.0%) |
| 2 or 3 Rooms | 14 (4.7%) | 2 (2.7%) |
| 4 or 5 Rooms | 110 (36.8%) | 51 (69.9%) |
| 6 or 7 Rooms | 119 (39.8%) | 20 (27.4%) |
| 8 or more Rooms | 56 (18.7%) | 0 (0.0%) |
| Total | 299 (100.0%) | 73 (100.0%) |
Housing Structure by Heating Type in Dyer
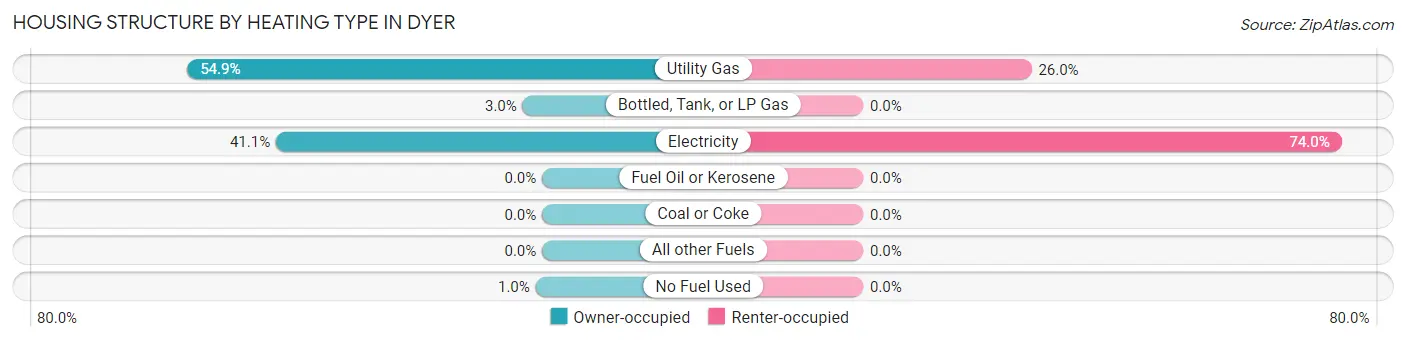
| Heating Type | Owner-occupied | Renter-occupied |
| Utility Gas | 164 (54.8%) | 19 (26.0%) |
| Bottled, Tank, or LP Gas | 9 (3.0%) | 0 (0.0%) |
| Electricity | 123 (41.1%) | 54 (74.0%) |
| Fuel Oil or Kerosene | 0 (0.0%) | 0 (0.0%) |
| Coal or Coke | 0 (0.0%) | 0 (0.0%) |
| All other Fuels | 0 (0.0%) | 0 (0.0%) |
| No Fuel Used | 3 (1.0%) | 0 (0.0%) |
| Total | 299 (100.0%) | 73 (100.0%) |
Household Vehicle Usage in Dyer
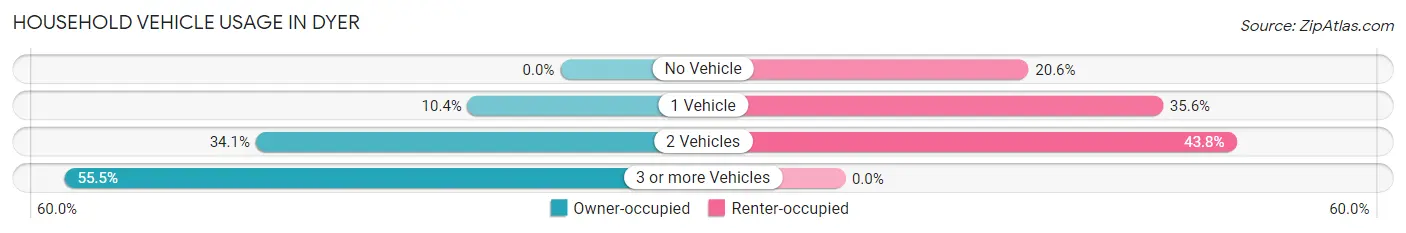
| Vehicles per Household | Owner-occupied | Renter-occupied |
| No Vehicle | 0 (0.0%) | 15 (20.5%) |
| 1 Vehicle | 31 (10.4%) | 26 (35.6%) |
| 2 Vehicles | 102 (34.1%) | 32 (43.8%) |
| 3 or more Vehicles | 166 (55.5%) | 0 (0.0%) |
| Total | 299 (100.0%) | 73 (100.0%) |
Real Estate & Mortgages in Dyer
Real Estate and Mortgage Overview in Dyer
| Characteristic | Without Mortgage | With Mortgage |
| Housing Units | 160 | 139 |
| Median Property Value | $167,700 | $232,000 |
| Median Household Income | $111,250 | $17 |
| Monthly Housing Costs | $541 | $0 |
| Real Estate Taxes | $1,212 | $0 |
Property Value by Mortgage Status in Dyer
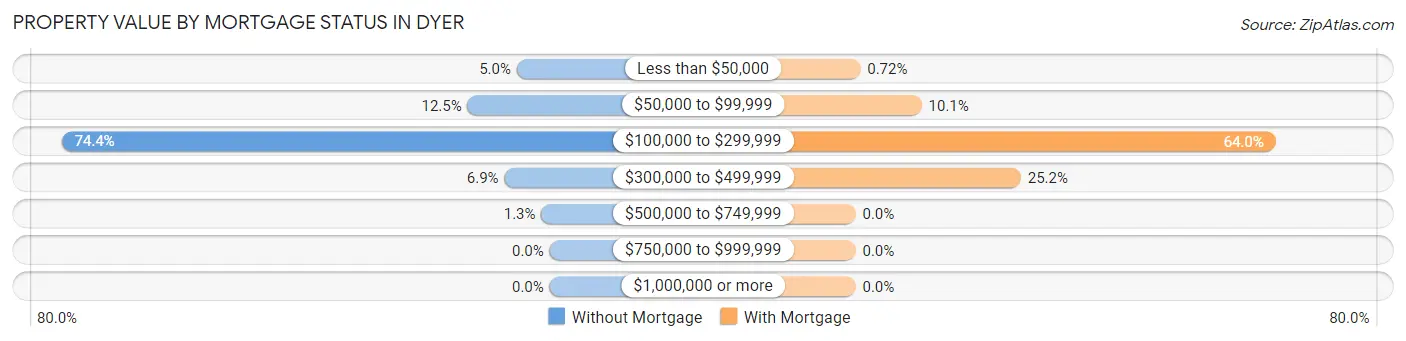
| Property Value | Without Mortgage | With Mortgage |
| Less than $50,000 | 8 (5.0%) | 1 (0.7%) |
| $50,000 to $99,999 | 20 (12.5%) | 14 (10.1%) |
| $100,000 to $299,999 | 119 (74.4%) | 89 (64.0%) |
| $300,000 to $499,999 | 11 (6.9%) | 35 (25.2%) |
| $500,000 to $749,999 | 2 (1.3%) | 0 (0.0%) |
| $750,000 to $999,999 | 0 (0.0%) | 0 (0.0%) |
| $1,000,000 or more | 0 (0.0%) | 0 (0.0%) |
| Total | 160 (100.0%) | 139 (100.0%) |
Household Income by Mortgage Status in Dyer
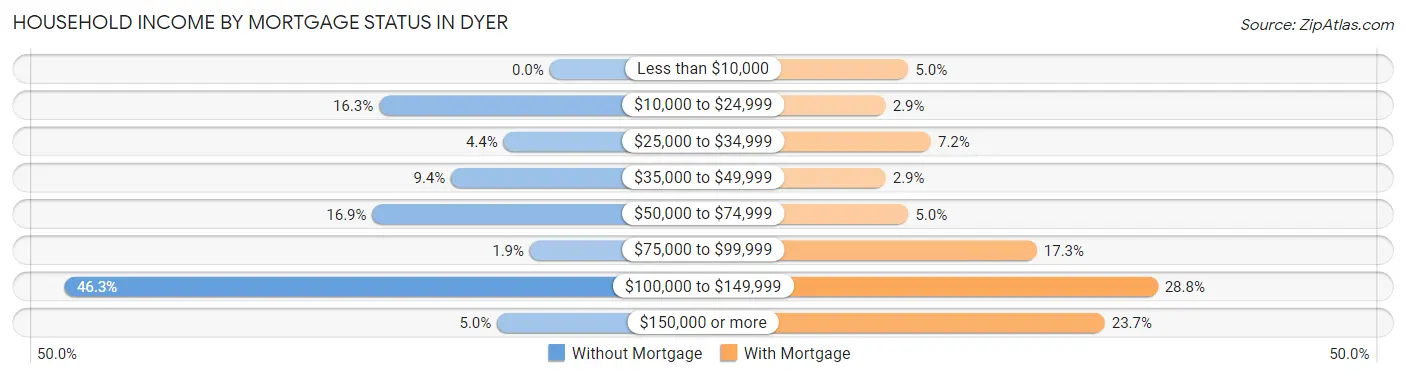
| Household Income | Without Mortgage | With Mortgage |
| Less than $10,000 | 0 (0.0%) | 7 (5.0%) |
| $10,000 to $24,999 | 26 (16.3%) | 4 (2.9%) |
| $25,000 to $34,999 | 7 (4.4%) | 10 (7.2%) |
| $35,000 to $49,999 | 15 (9.4%) | 4 (2.9%) |
| $50,000 to $74,999 | 27 (16.9%) | 7 (5.0%) |
| $75,000 to $99,999 | 3 (1.9%) | 24 (17.3%) |
| $100,000 to $149,999 | 74 (46.3%) | 40 (28.8%) |
| $150,000 or more | 8 (5.0%) | 33 (23.7%) |
| Total | 160 (100.0%) | 139 (100.0%) |
Property Value to Household Income Ratio in Dyer
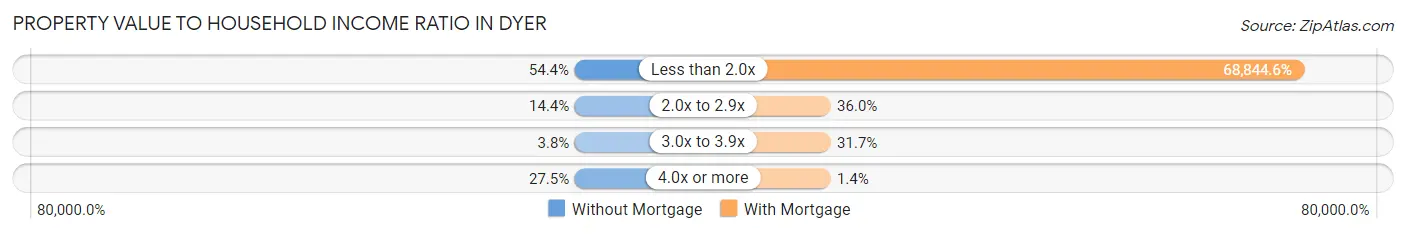
| Value-to-Income Ratio | Without Mortgage | With Mortgage |
| Less than 2.0x | 87 (54.4%) | 95,694 (68,844.6%) |
| 2.0x to 2.9x | 23 (14.4%) | 50 (36.0%) |
| 3.0x to 3.9x | 6 (3.7%) | 44 (31.7%) |
| 4.0x or more | 44 (27.5%) | 2 (1.4%) |
| Total | 160 (100.0%) | 139 (100.0%) |
Real Estate Taxes by Mortgage Status in Dyer
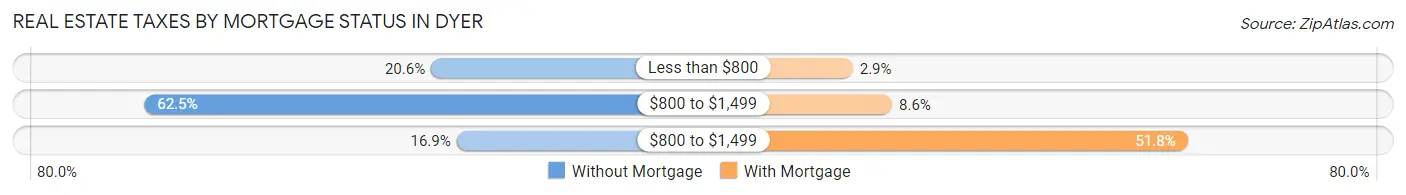
| Property Taxes | Without Mortgage | With Mortgage |
| Less than $800 | 33 (20.6%) | 4 (2.9%) |
| $800 to $1,499 | 100 (62.5%) | 12 (8.6%) |
| $800 to $1,499 | 27 (16.9%) | 72 (51.8%) |
| Total | 160 (100.0%) | 139 (100.0%) |
Health & Disability in Dyer
Health Insurance Coverage by Age in Dyer
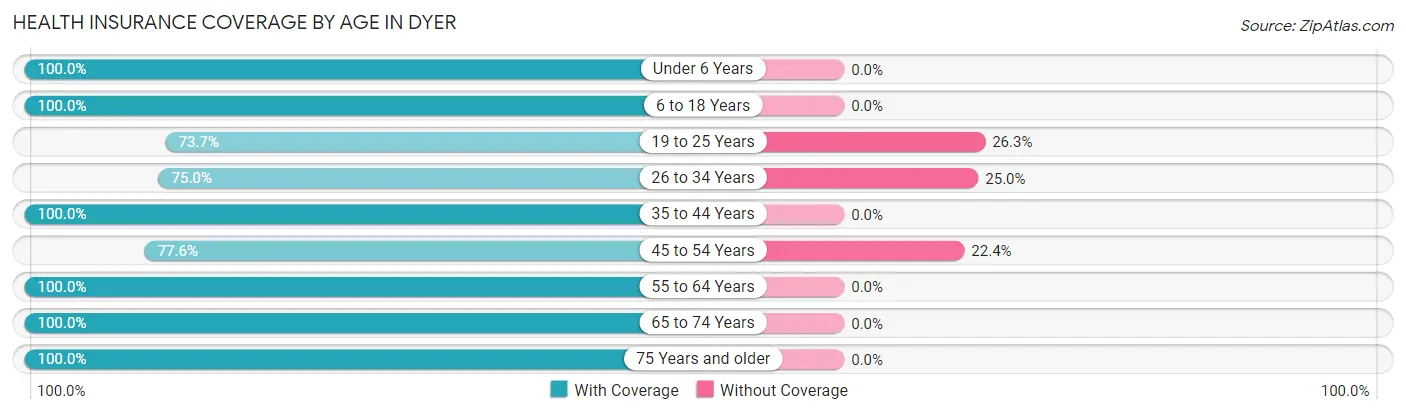
| Age Bracket | With Coverage | Without Coverage |
| Under 6 Years | 37 (100.0%) | 0 (0.0%) |
| 6 to 18 Years | 131 (100.0%) | 0 (0.0%) |
| 19 to 25 Years | 101 (73.7%) | 36 (26.3%) |
| 26 to 34 Years | 30 (75.0%) | 10 (25.0%) |
| 35 to 44 Years | 91 (100.0%) | 0 (0.0%) |
| 45 to 54 Years | 142 (77.6%) | 41 (22.4%) |
| 55 to 64 Years | 165 (100.0%) | 0 (0.0%) |
| 65 to 74 Years | 75 (100.0%) | 0 (0.0%) |
| 75 Years and older | 58 (100.0%) | 0 (0.0%) |
| Total | 830 (90.5%) | 87 (9.5%) |
Health Insurance Coverage by Citizenship Status in Dyer
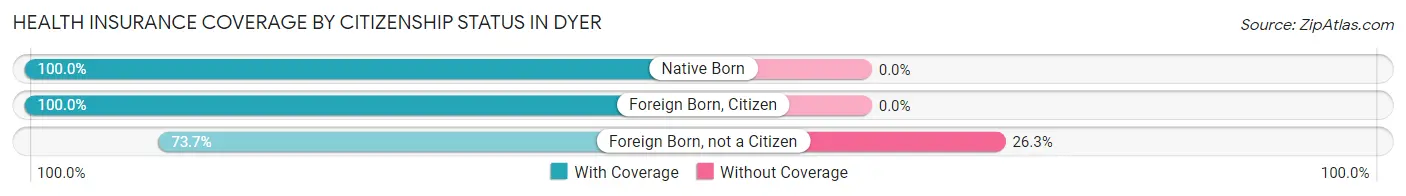
| Citizenship Status | With Coverage | Without Coverage |
| Native Born | 37 (100.0%) | 0 (0.0%) |
| Foreign Born, Citizen | 131 (100.0%) | 0 (0.0%) |
| Foreign Born, not a Citizen | 101 (73.7%) | 36 (26.3%) |
Health Insurance Coverage by Household Income in Dyer
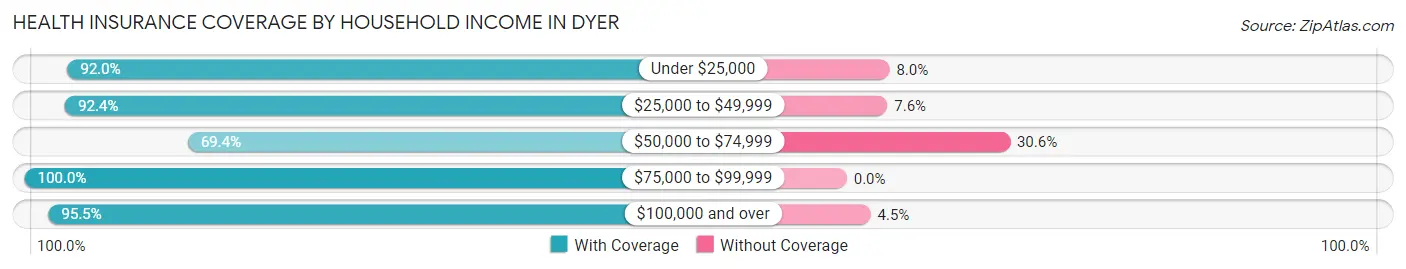
| Household Income | With Coverage | Without Coverage |
| Under $25,000 | 138 (92.0%) | 12 (8.0%) |
| $25,000 to $49,999 | 158 (92.4%) | 13 (7.6%) |
| $50,000 to $74,999 | 109 (69.4%) | 48 (30.6%) |
| $75,000 to $99,999 | 125 (100.0%) | 0 (0.0%) |
| $100,000 and over | 300 (95.5%) | 14 (4.5%) |
Public vs Private Health Insurance Coverage by Age in Dyer
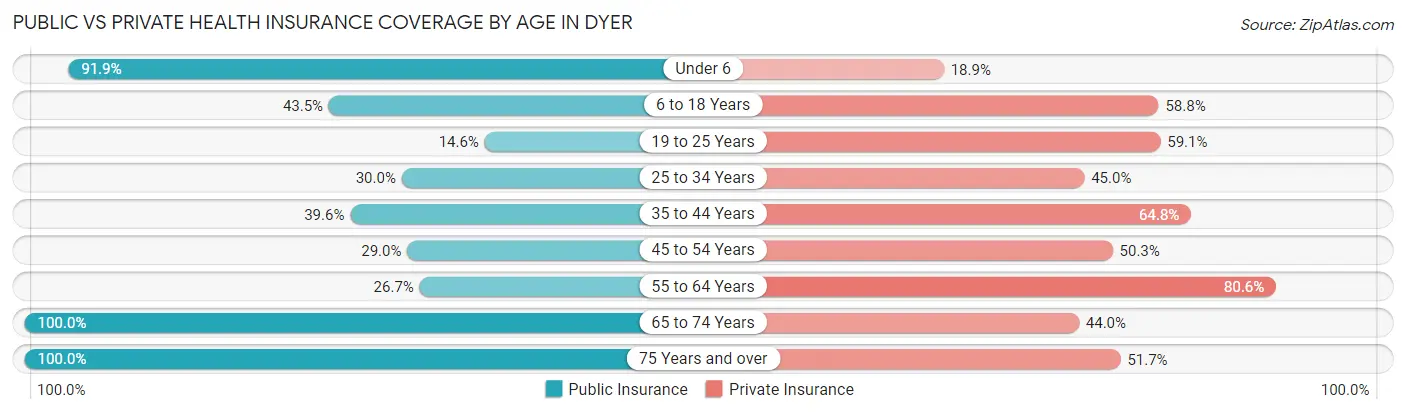
| Age Bracket | Public Insurance | Private Insurance |
| Under 6 | 34 (91.9%) | 7 (18.9%) |
| 6 to 18 Years | 57 (43.5%) | 77 (58.8%) |
| 19 to 25 Years | 20 (14.6%) | 81 (59.1%) |
| 25 to 34 Years | 12 (30.0%) | 18 (45.0%) |
| 35 to 44 Years | 36 (39.6%) | 59 (64.8%) |
| 45 to 54 Years | 53 (29.0%) | 92 (50.3%) |
| 55 to 64 Years | 44 (26.7%) | 133 (80.6%) |
| 65 to 74 Years | 75 (100.0%) | 33 (44.0%) |
| 75 Years and over | 58 (100.0%) | 30 (51.7%) |
| Total | 389 (42.4%) | 530 (57.8%) |
Disability Status by Sex by Age in Dyer
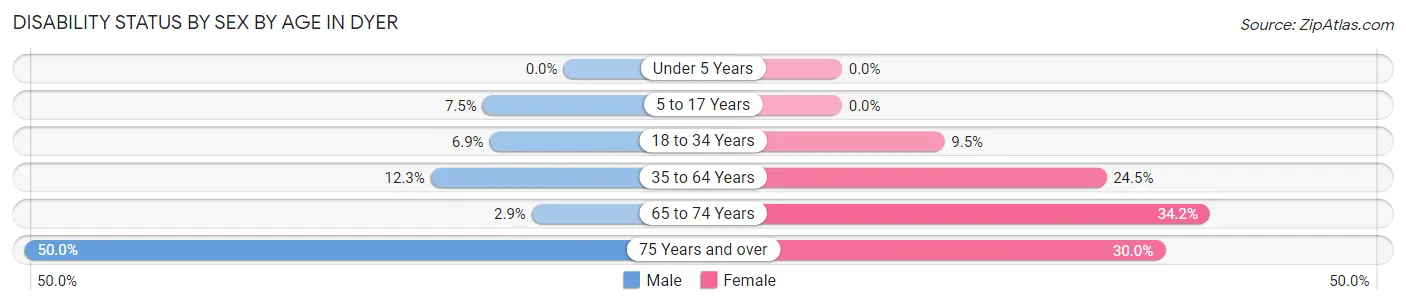
| Age Bracket | Male | Female |
| Under 5 Years | 0 (0.0%) | 0 (0.0%) |
| 5 to 17 Years | 3 (7.5%) | 0 (0.0%) |
| 18 to 34 Years | 7 (6.9%) | 8 (9.5%) |
| 35 to 64 Years | 34 (12.3%) | 40 (24.5%) |
| 65 to 74 Years | 1 (2.9%) | 14 (34.2%) |
| 75 Years and over | 19 (50.0%) | 6 (30.0%) |
Disability Class by Sex by Age in Dyer
Disability Class: Hearing Difficulty
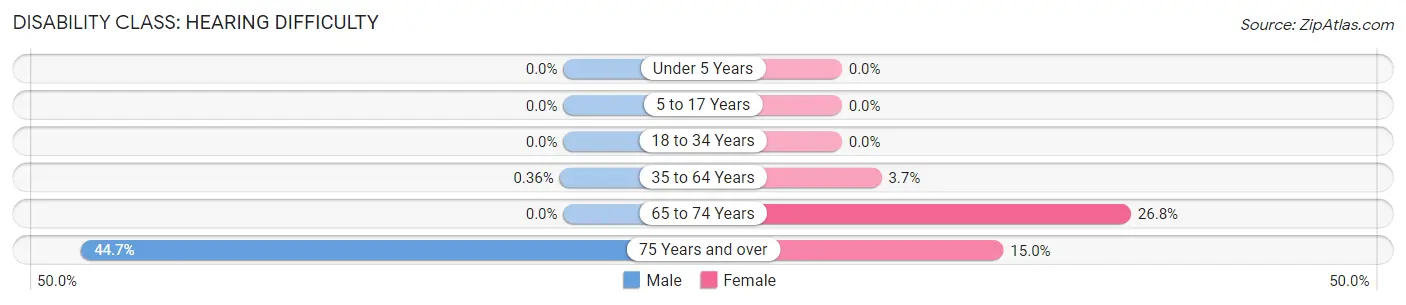
| Age Bracket | Male | Female |
| Under 5 Years | 0 (0.0%) | 0 (0.0%) |
| 5 to 17 Years | 0 (0.0%) | 0 (0.0%) |
| 18 to 34 Years | 0 (0.0%) | 0 (0.0%) |
| 35 to 64 Years | 1 (0.4%) | 6 (3.7%) |
| 65 to 74 Years | 0 (0.0%) | 11 (26.8%) |
| 75 Years and over | 17 (44.7%) | 3 (15.0%) |
Disability Class: Vision Difficulty
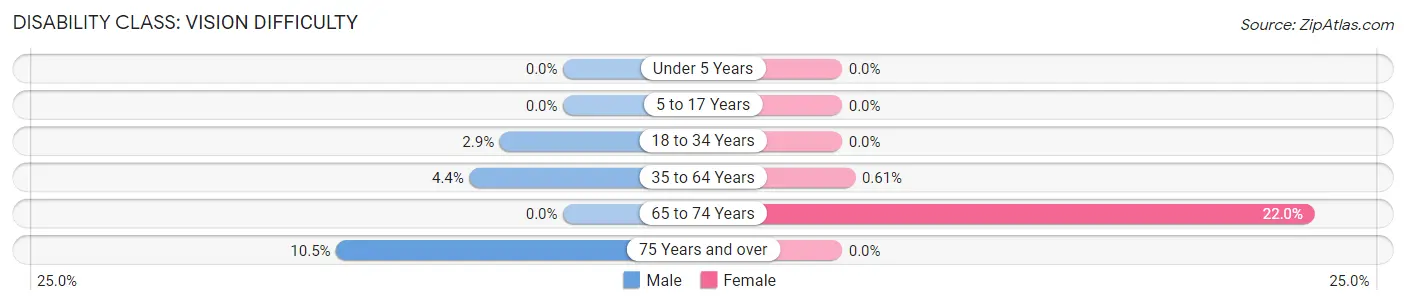
| Age Bracket | Male | Female |
| Under 5 Years | 0 (0.0%) | 0 (0.0%) |
| 5 to 17 Years | 0 (0.0%) | 0 (0.0%) |
| 18 to 34 Years | 3 (2.9%) | 0 (0.0%) |
| 35 to 64 Years | 12 (4.3%) | 1 (0.6%) |
| 65 to 74 Years | 0 (0.0%) | 9 (22.0%) |
| 75 Years and over | 4 (10.5%) | 0 (0.0%) |
Disability Class: Cognitive Difficulty
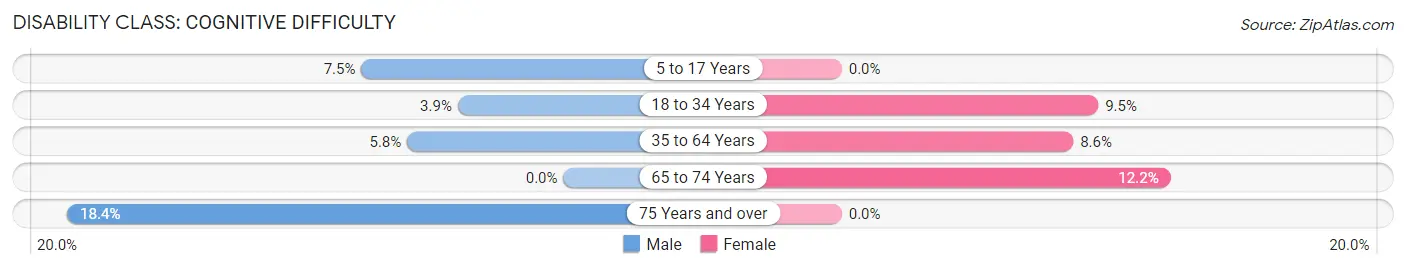
| Age Bracket | Male | Female |
| 5 to 17 Years | 3 (7.5%) | 0 (0.0%) |
| 18 to 34 Years | 4 (3.9%) | 8 (9.5%) |
| 35 to 64 Years | 16 (5.8%) | 14 (8.6%) |
| 65 to 74 Years | 0 (0.0%) | 5 (12.2%) |
| 75 Years and over | 7 (18.4%) | 0 (0.0%) |
Disability Class: Ambulatory Difficulty
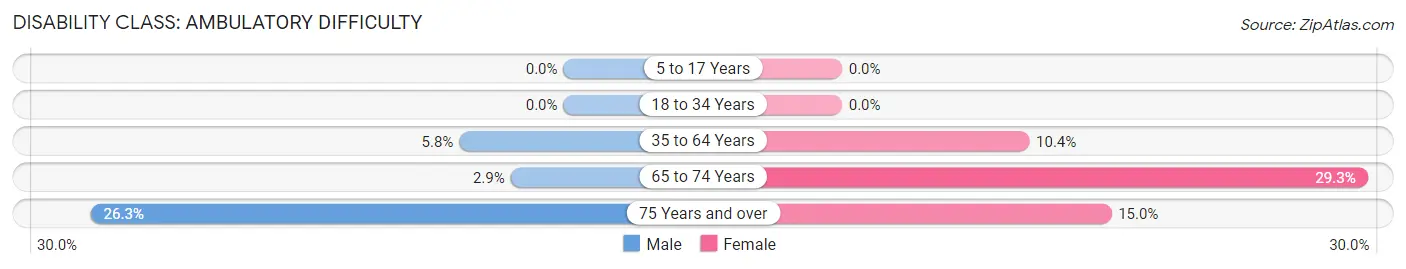
| Age Bracket | Male | Female |
| 5 to 17 Years | 0 (0.0%) | 0 (0.0%) |
| 18 to 34 Years | 0 (0.0%) | 0 (0.0%) |
| 35 to 64 Years | 16 (5.8%) | 17 (10.4%) |
| 65 to 74 Years | 1 (2.9%) | 12 (29.3%) |
| 75 Years and over | 10 (26.3%) | 3 (15.0%) |
Disability Class: Self-Care Difficulty
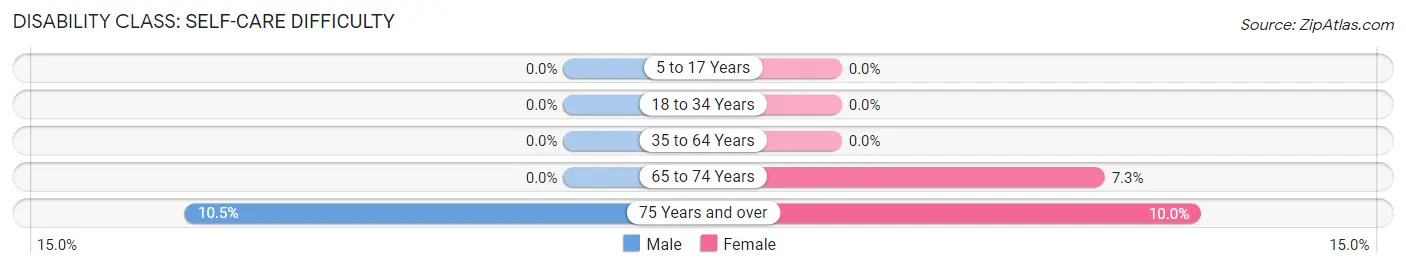
| Age Bracket | Male | Female |
| 5 to 17 Years | 0 (0.0%) | 0 (0.0%) |
| 18 to 34 Years | 0 (0.0%) | 0 (0.0%) |
| 35 to 64 Years | 0 (0.0%) | 0 (0.0%) |
| 65 to 74 Years | 0 (0.0%) | 3 (7.3%) |
| 75 Years and over | 4 (10.5%) | 2 (10.0%) |
Technology Access in Dyer
Computing Device Access in Dyer
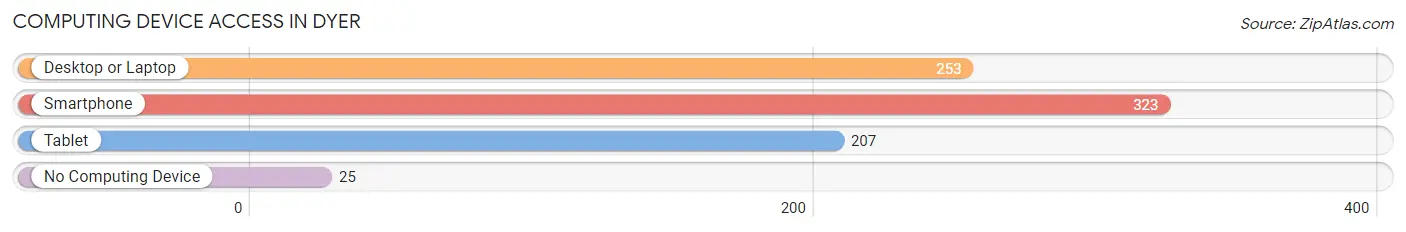
| Device Type | # Households | % Households |
| Desktop or Laptop | 253 | 68.0% |
| Smartphone | 323 | 86.8% |
| Tablet | 207 | 55.6% |
| No Computing Device | 25 | 6.7% |
| Total | 372 | 100.0% |
Internet Access in Dyer
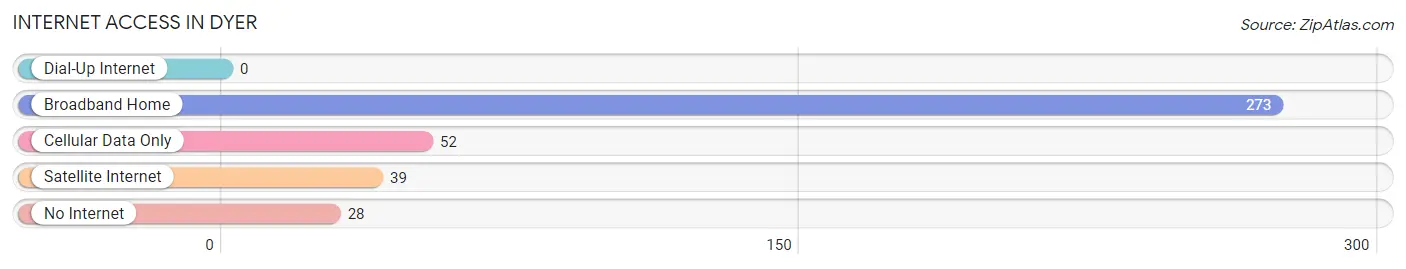
| Internet Type | # Households | % Households |
| Dial-Up Internet | 0 | 0.0% |
| Broadband Home | 273 | 73.4% |
| Cellular Data Only | 52 | 14.0% |
| Satellite Internet | 39 | 10.5% |
| No Internet | 28 | 7.5% |
| Total | 372 | 100.0% |
Dyer Summary
Dyer is a small town located in the northwest corner of Arkansas in the Ozark Mountains. It is part of the Fayetteville-Springdale-Rogers Metropolitan Statistical Area and is the county seat of Washington County. The town has a population of 1,845 people as of the 2010 census.
History
Dyer was founded in 1871 by William Dyer, a former Confederate soldier. The town was originally known as Dyer's Station, and was a stop on the St. Louis and San Francisco Railroad. The town was incorporated in 1881 and the name was changed to Dyer.
Geography
Dyer is located in the northwest corner of Arkansas in the Ozark Mountains. It is situated at the intersection of US Highways 412 and 71. The town is located about 20 miles east of the Oklahoma border and about 40 miles south of the Missouri border. The town is situated in a valley surrounded by hills and mountains. The nearest major city is Fayetteville, which is about 25 miles to the south.
Climate
Dyer has a humid subtropical climate, with hot summers and mild winters. The average annual temperature is around 60°F, with an average high of around 80°F in the summer and an average low of around 40°F in the winter. The town receives an average of around 45 inches of precipitation per year, with most of it falling in the spring and summer months.
Economy
The economy of Dyer is largely based on agriculture and tourism. The town is home to several farms, which produce a variety of crops, including corn, soybeans, wheat, and hay. The town is also home to several small businesses, including restaurants, shops, and a few manufacturing plants. Tourism is also an important part of the local economy, with visitors coming to the area to enjoy the scenic beauty of the Ozark Mountains.
Demographics
As of the 2010 census, the population of Dyer was 1,845 people. The racial makeup of the town was 95.3% White, 0.7% African American, 0.3% Native American, 0.2% Asian, 0.1% Pacific Islander, 1.7% from other races, and 1.9% from two or more races. Hispanic or Latino of any race were 3.2% of the population.
The median household income in Dyer was $37,917, and the median family income was $45,938. The per capita income was $19,945. About 11.3% of the population was below the poverty line.
Conclusion
Dyer is a small town located in the northwest corner of Arkansas in the Ozark Mountains. It has a population of 1,845 people as of the 2010 census and is part of the Fayetteville-Springdale-Rogers Metropolitan Statistical Area. The town has a humid subtropical climate and is home to several farms and small businesses. The economy of Dyer is largely based on agriculture and tourism. The racial makeup of the town is mostly White, with a small percentage of African American, Native American, Asian, and Pacific Islander residents. The median household income in Dyer is $37,917 and the per capita income is $19,945.
Common Questions
What is Per Capita Income in Dyer?
Per Capita income in Dyer is $27,926.
What is the Median Family Income in Dyer?
Median Family Income in Dyer is $89,844.
What is the Median Household income in Dyer?
Median Household Income in Dyer is $71,250.
What is Income or Wage Gap in Dyer?
Income or Wage Gap in Dyer is 24.2%.
Women in Dyer earn 75.8 cents for every dollar earned by a man.
What is Inequality or Gini Index in Dyer?
Inequality or Gini Index in Dyer is 0.38.
What is the Total Population of Dyer?
Total Population of Dyer is 917.
What is the Total Male Population of Dyer?
Total Male Population of Dyer is 505.
What is the Total Female Population of Dyer?
Total Female Population of Dyer is 412.
What is the Ratio of Males per 100 Females in Dyer?
There are 122.57 Males per 100 Females in Dyer.
What is the Ratio of Females per 100 Males in Dyer?
There are 81.58 Females per 100 Males in Dyer.
What is the Median Population Age in Dyer?
Median Population Age in Dyer is 47.0 Years.
What is the Average Family Size in Dyer
Average Family Size in Dyer is 2.7 People.
What is the Average Household Size in Dyer
Average Household Size in Dyer is 2.5 People.
How Large is the Labor Force in Dyer?
There are 392 People in the Labor Forcein in Dyer.
What is the Percentage of People in the Labor Force in Dyer?
49.8% of People are in the Labor Force in Dyer.
What is the Unemployment Rate in Dyer?
Unemployment Rate in Dyer is 6.6%.