Greenwood, AR Map & Demographics
Greenwood Map
Greenwood Overview
$30,011
PER CAPITA INCOME
$73,047
AVG FAMILY INCOME
$63,232
AVG HOUSEHOLD INCOME
17.6%
WAGE / INCOME GAP [ % ]
82.4¢/ $1
WAGE / INCOME GAP [ $ ]
0.39
INEQUALITY / GINI INDEX
9,544
TOTAL POPULATION
4,584
MALE POPULATION
4,960
FEMALE POPULATION
92.42
MALES / 100 FEMALES
108.20
FEMALES / 100 MALES
37.1
MEDIAN AGE
2.8
AVG FAMILY SIZE
2.4
AVG HOUSEHOLD SIZE
4,638
LABOR FORCE [ PEOPLE ]
62.1%
PERCENT IN LABOR FORCE
3.3%
UNEMPLOYMENT RATE
Greenwood Zip Codes
Greenwood Area Codes
Income in Greenwood
Income Overview in Greenwood
Per Capita Income in Greenwood is $30,011, while median incomes of families and households are $73,047 and $63,232 respectively.
| Characteristic | Number | Measure |
| Per Capita Income | 9,544 | $30,011 |
| Median Family Income | 2,827 | $73,047 |
| Mean Family Income | 2,827 | $86,337 |
| Median Household Income | 3,953 | $63,232 |
| Mean Household Income | 3,953 | $73,008 |
| Income Deficit | 2,827 | $0 |
| Wage / Income Gap (%) | 9,544 | 17.57% |
| Wage / Income Gap ($) | 9,544 | 82.43¢ per $1 |
| Gini / Inequality Index | 9,544 | 0.39 |
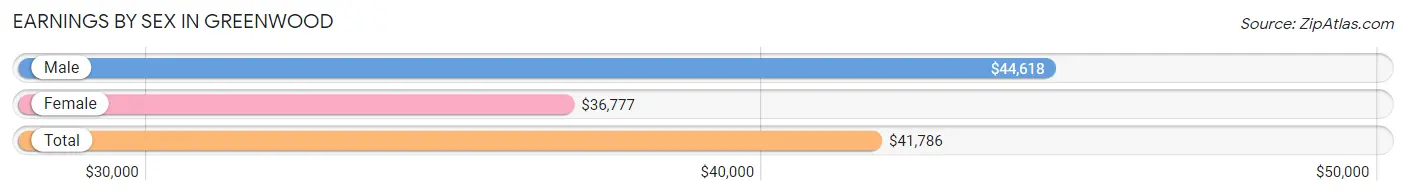
Earnings by Sex in Greenwood
Average Earnings in Greenwood are $41,786, $44,618 for men and $36,777 for women, a difference of 17.6%.
| Sex | Number | Average Earnings |
| Male | 2,587 (53.6%) | $44,618 |
| Female | 2,235 (46.4%) | $36,777 |
| Total | 4,822 (100.0%) | $41,786 |
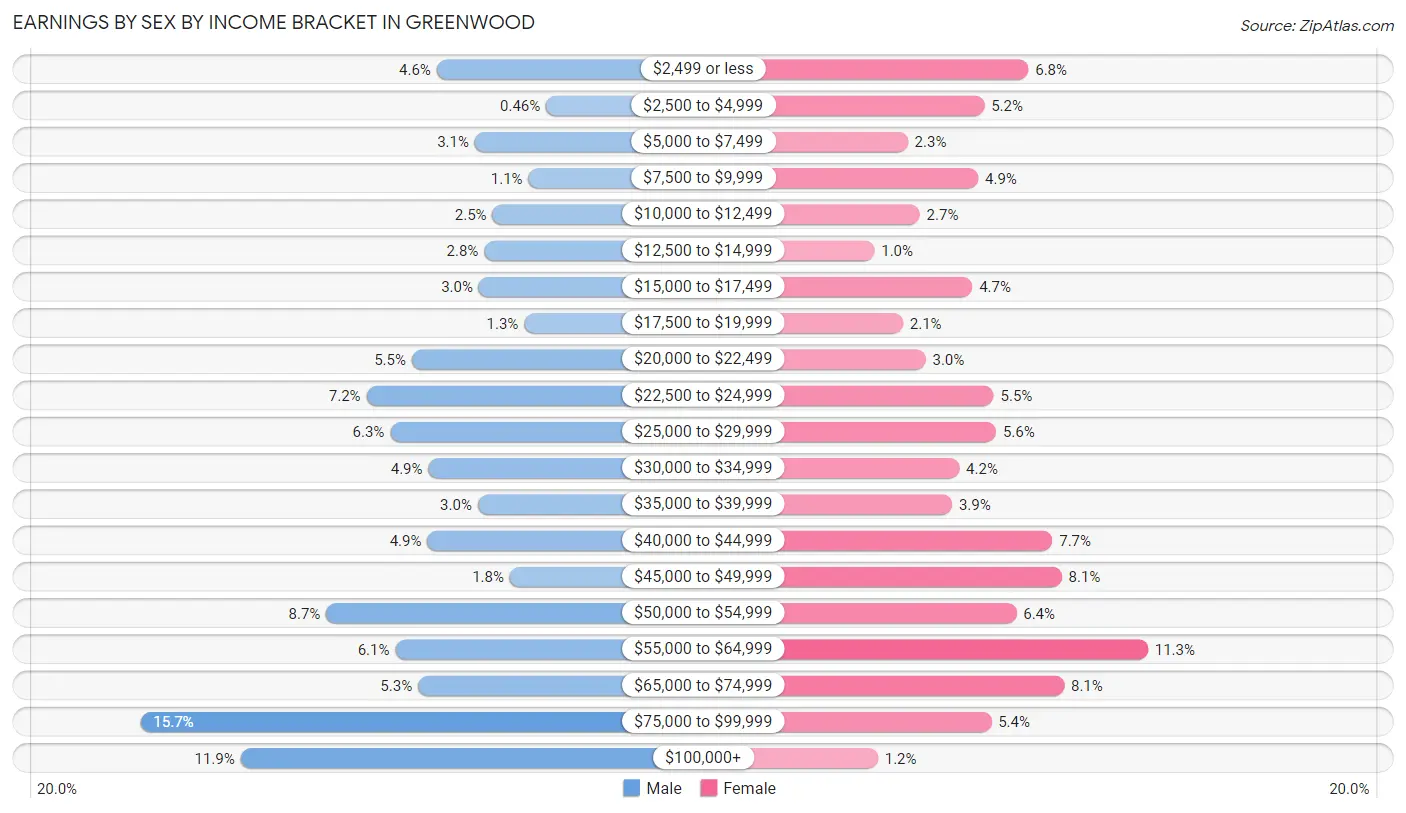
Earnings by Sex by Income Bracket in Greenwood
The most common earnings brackets in Greenwood are $75,000 to $99,999 for men (405 | 15.7%) and $55,000 to $64,999 for women (252 | 11.3%).
| Income | Male | Female |
| $2,499 or less | 118 (4.6%) | 152 (6.8%) |
| $2,500 to $4,999 | 12 (0.5%) | 115 (5.1%) |
| $5,000 to $7,499 | 81 (3.1%) | 51 (2.3%) |
| $7,500 to $9,999 | 29 (1.1%) | 110 (4.9%) |
| $10,000 to $12,499 | 64 (2.5%) | 61 (2.7%) |
| $12,500 to $14,999 | 72 (2.8%) | 23 (1.0%) |
| $15,000 to $17,499 | 77 (3.0%) | 105 (4.7%) |
| $17,500 to $19,999 | 33 (1.3%) | 47 (2.1%) |
| $20,000 to $22,499 | 142 (5.5%) | 66 (2.9%) |
| $22,500 to $24,999 | 186 (7.2%) | 123 (5.5%) |
| $25,000 to $29,999 | 163 (6.3%) | 125 (5.6%) |
| $30,000 to $34,999 | 126 (4.9%) | 94 (4.2%) |
| $35,000 to $39,999 | 78 (3.0%) | 88 (3.9%) |
| $40,000 to $44,999 | 127 (4.9%) | 172 (7.7%) |
| $45,000 to $49,999 | 47 (1.8%) | 180 (8.1%) |
| $50,000 to $54,999 | 225 (8.7%) | 142 (6.4%) |
| $55,000 to $64,999 | 158 (6.1%) | 252 (11.3%) |
| $65,000 to $74,999 | 136 (5.3%) | 182 (8.1%) |
| $75,000 to $99,999 | 405 (15.7%) | 121 (5.4%) |
| $100,000+ | 308 (11.9%) | 26 (1.2%) |
| Total | 2,587 (100.0%) | 2,235 (100.0%) |
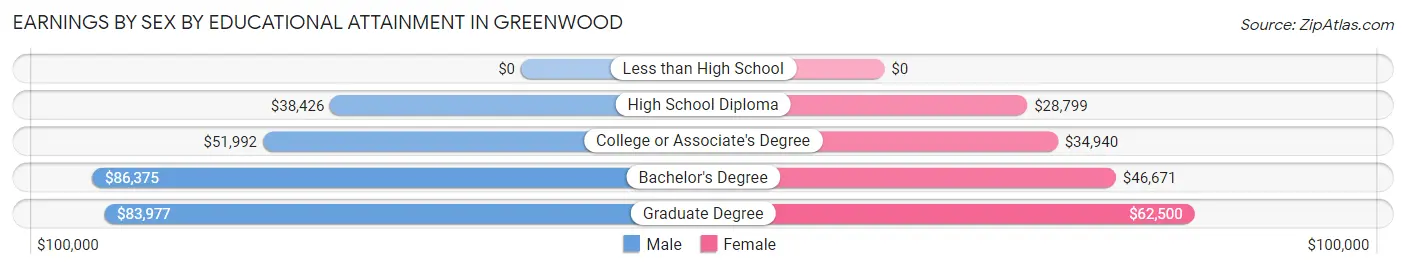
Earnings by Sex by Educational Attainment in Greenwood
Average earnings in Greenwood are $52,398 for men and $43,544 for women, a difference of 16.9%. Men with an educational attainment of bachelor's degree enjoy the highest average annual earnings of $86,375, while those with high school diploma education earn the least with $38,426. Women with an educational attainment of graduate degree earn the most with the average annual earnings of $62,500, while those with high school diploma education have the smallest earnings of $28,799.
| Educational Attainment | Male Income | Female Income |
| Less than High School | - | - |
| High School Diploma | $38,426 | $28,799 |
| College or Associate's Degree | $51,992 | $34,940 |
| Bachelor's Degree | $86,375 | $46,671 |
| Graduate Degree | $83,977 | $62,500 |
| Total | $52,398 | $43,544 |
Family Income in Greenwood
Family Income Brackets in Greenwood
According to the Greenwood family income data, there are 721 families falling into the $50,000 to $74,999 income range, which is the most common income bracket and makes up 25.5% of all families. Conversely, the $10,000 to $14,999 income bracket is the least frequent group with only 14 families (0.5%) belonging to this category.
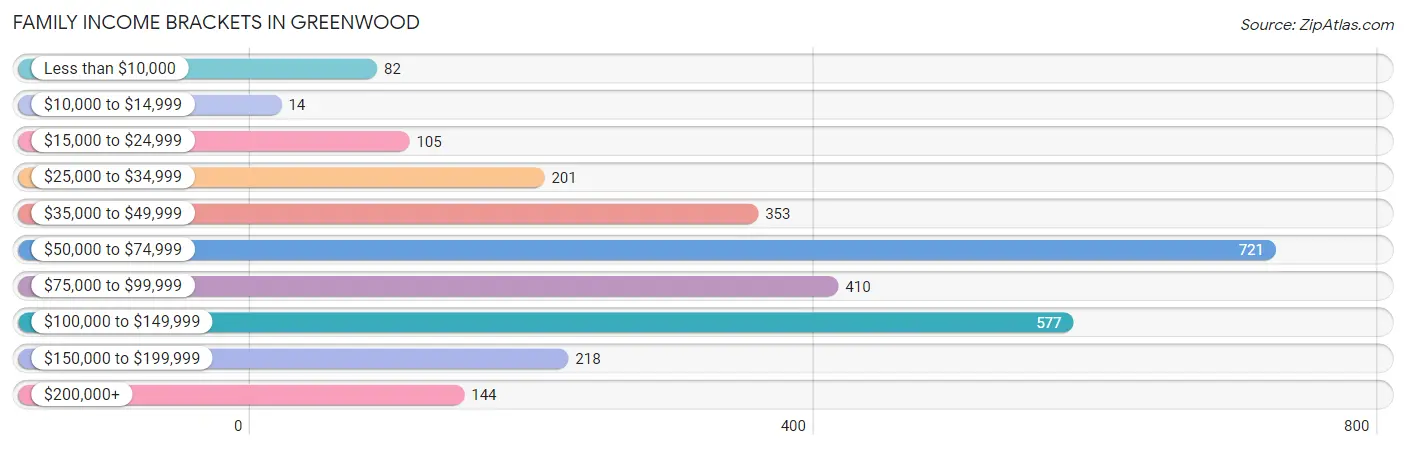
| Income Bracket | # Families | % Families |
| Less than $10,000 | 82 | 2.9% |
| $10,000 to $14,999 | 14 | 0.5% |
| $15,000 to $24,999 | 105 | 3.7% |
| $25,000 to $34,999 | 201 | 7.1% |
| $35,000 to $49,999 | 353 | 12.5% |
| $50,000 to $74,999 | 721 | 25.5% |
| $75,000 to $99,999 | 410 | 14.5% |
| $100,000 to $149,999 | 577 | 20.4% |
| $150,000 to $199,999 | 218 | 7.7% |
| $200,000+ | 144 | 5.1% |
Family Income by Famaliy Size in Greenwood
5-person families (154 | 5.4%) account for the highest median family income in Greenwood with $92,273 per family, while 2-person families (1,386 | 49.0%) have the highest median income of $32,812 per family member.
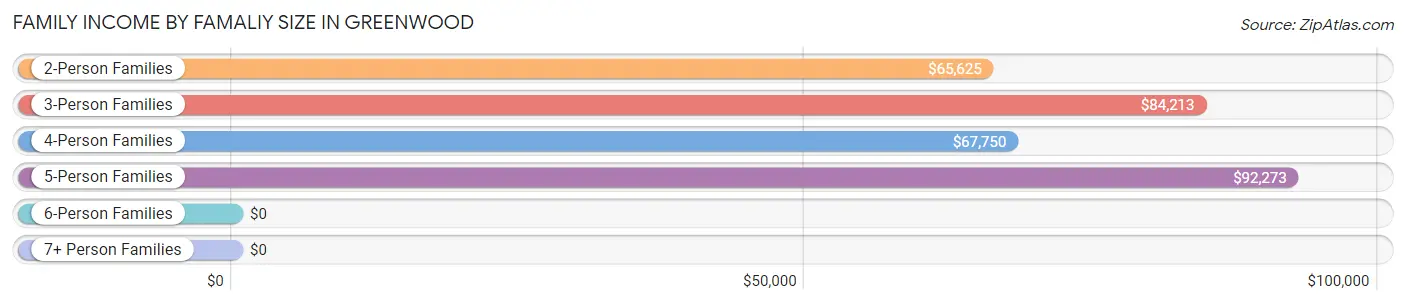
| Income Bracket | # Families | Median Income |
| 2-Person Families | 1,386 (49.0%) | $65,625 |
| 3-Person Families | 559 (19.8%) | $84,213 |
| 4-Person Families | 623 (22.0%) | $67,750 |
| 5-Person Families | 154 (5.4%) | $92,273 |
| 6-Person Families | 104 (3.7%) | $0 |
| 7+ Person Families | 1 (0.0%) | $0 |
| Total | 2,827 (100.0%) | $73,047 |
Family Income by Number of Earners in Greenwood
The median family income in Greenwood is $73,047, with families comprising 3+ earners (215) having the highest median family income of $114,145, while families with no earners (451) have the lowest median family income of $43,864, accounting for 7.6% and 16.0% of families, respectively.
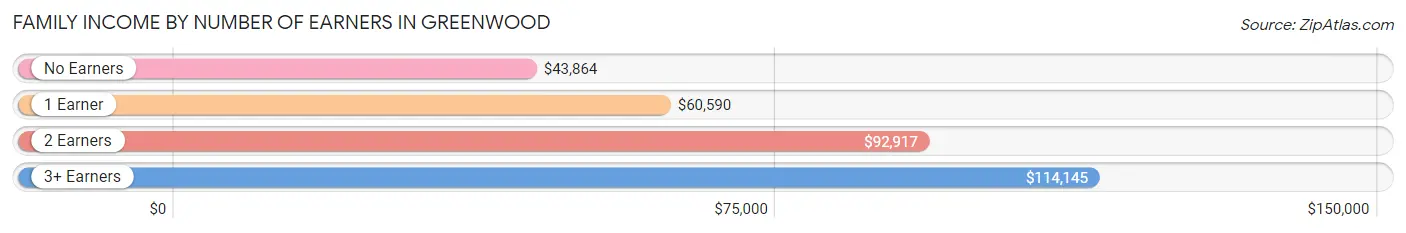
| Number of Earners | # Families | Median Income |
| No Earners | 451 (16.0%) | $43,864 |
| 1 Earner | 771 (27.3%) | $60,590 |
| 2 Earners | 1,390 (49.2%) | $92,917 |
| 3+ Earners | 215 (7.6%) | $114,145 |
| Total | 2,827 (100.0%) | $73,047 |
Household Income in Greenwood
Household Income Brackets in Greenwood
With 822 households falling in the category, the $50,000 to $74,999 income range is the most frequent in Greenwood, accounting for 20.8% of all households. In contrast, only 55 households (1.4%) fall into the $10,000 to $14,999 income bracket, making it the least populous group.
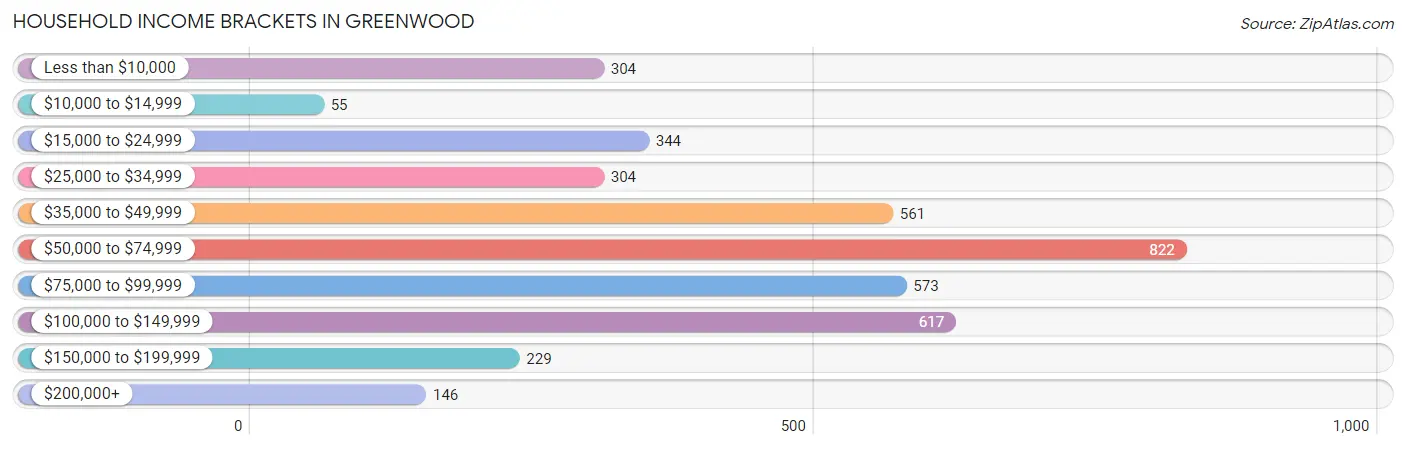
| Income Bracket | # Households | % Households |
| Less than $10,000 | 304 | 7.7% |
| $10,000 to $14,999 | 55 | 1.4% |
| $15,000 to $24,999 | 344 | 8.7% |
| $25,000 to $34,999 | 304 | 7.7% |
| $35,000 to $49,999 | 561 | 14.2% |
| $50,000 to $74,999 | 822 | 20.8% |
| $75,000 to $99,999 | 573 | 14.5% |
| $100,000 to $149,999 | 617 | 15.6% |
| $150,000 to $199,999 | 229 | 5.8% |
| $200,000+ | 146 | 3.7% |
Household Income by Householder Age in Greenwood
The median household income in Greenwood is $63,232, with the highest median household income of $83,162 found in the 45 to 64 years age bracket for the primary householder. A total of 1,083 households (27.4%) fall into this category. Meanwhile, the 15 to 24 years age bracket for the primary householder has the lowest median household income of $32,857, with 268 households (6.8%) in this group.
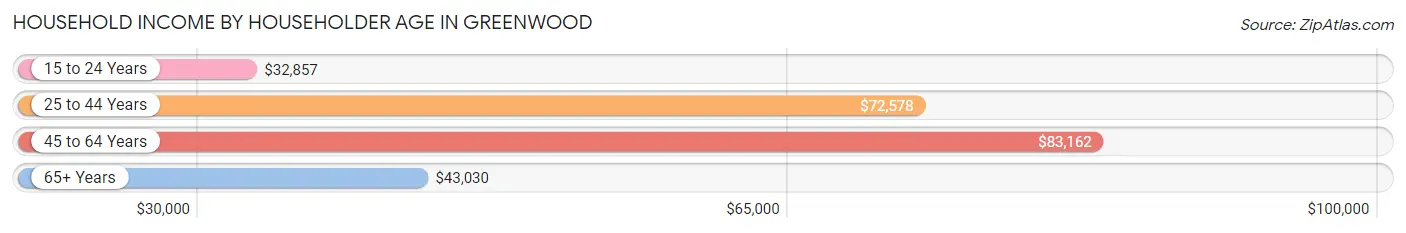
| Income Bracket | # Households | Median Income |
| 15 to 24 Years | 268 (6.8%) | $32,857 |
| 25 to 44 Years | 1,430 (36.2%) | $72,578 |
| 45 to 64 Years | 1,083 (27.4%) | $83,162 |
| 65+ Years | 1,172 (29.6%) | $43,030 |
| Total | 3,953 (100.0%) | $63,232 |
Poverty in Greenwood
Income Below Poverty by Sex and Age in Greenwood
With 10.4% poverty level for males and 12.6% for females among the residents of Greenwood, 5 year old males and 5 year old females are the most vulnerable to poverty, with 57 males (50.4%) and 34 females (47.9%) in their respective age groups living below the poverty level.
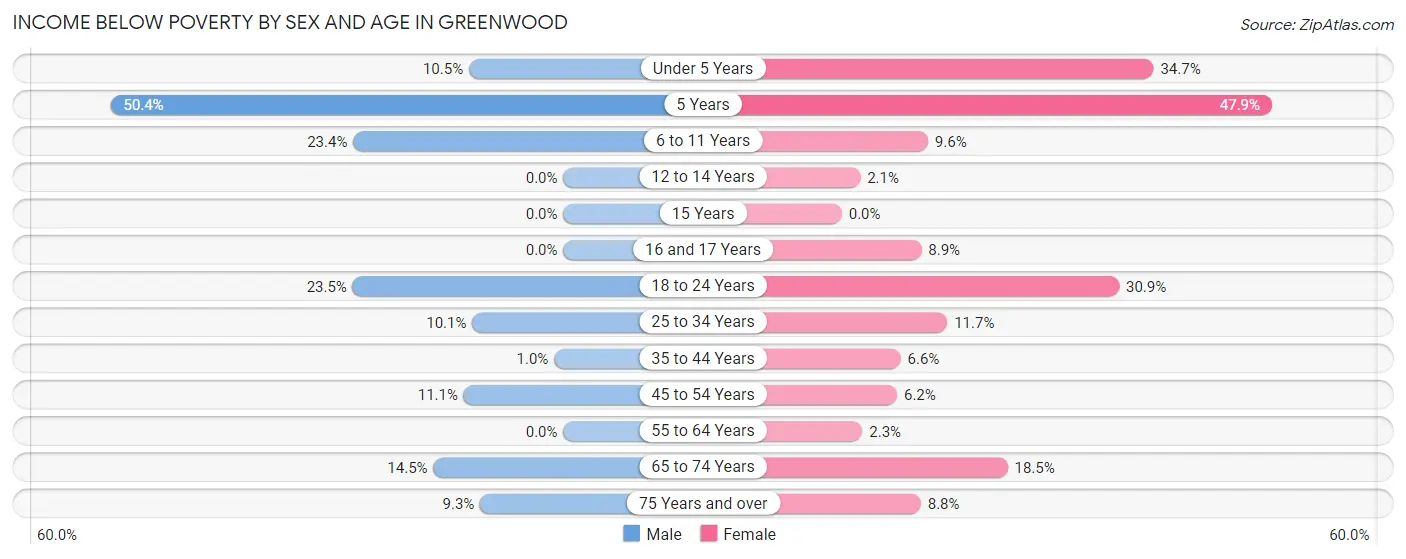
| Age Bracket | Male | Female |
| Under 5 Years | 31 (10.5%) | 109 (34.7%) |
| 5 Years | 57 (50.4%) | 34 (47.9%) |
| 6 to 11 Years | 66 (23.4%) | 40 (9.6%) |
| 12 to 14 Years | 0 (0.0%) | 6 (2.1%) |
| 15 Years | 0 (0.0%) | 0 (0.0%) |
| 16 and 17 Years | 0 (0.0%) | 7 (8.9%) |
| 18 to 24 Years | 84 (23.5%) | 105 (30.9%) |
| 25 to 34 Years | 74 (10.1%) | 75 (11.7%) |
| 35 to 44 Years | 7 (1.0%) | 37 (6.6%) |
| 45 to 54 Years | 66 (11.1%) | 41 (6.1%) |
| 55 to 64 Years | 0 (0.0%) | 9 (2.3%) |
| 65 to 74 Years | 57 (14.5%) | 115 (18.5%) |
| 75 Years and over | 25 (9.3%) | 39 (8.8%) |
| Total | 467 (10.4%) | 617 (12.6%) |
Income Above Poverty by Sex and Age in Greenwood
According to the poverty statistics in Greenwood, males aged 12 to 14 years and females aged 15 years are the age groups that are most secure financially, with 100.0% of males and 100.0% of females in these age groups living above the poverty line.
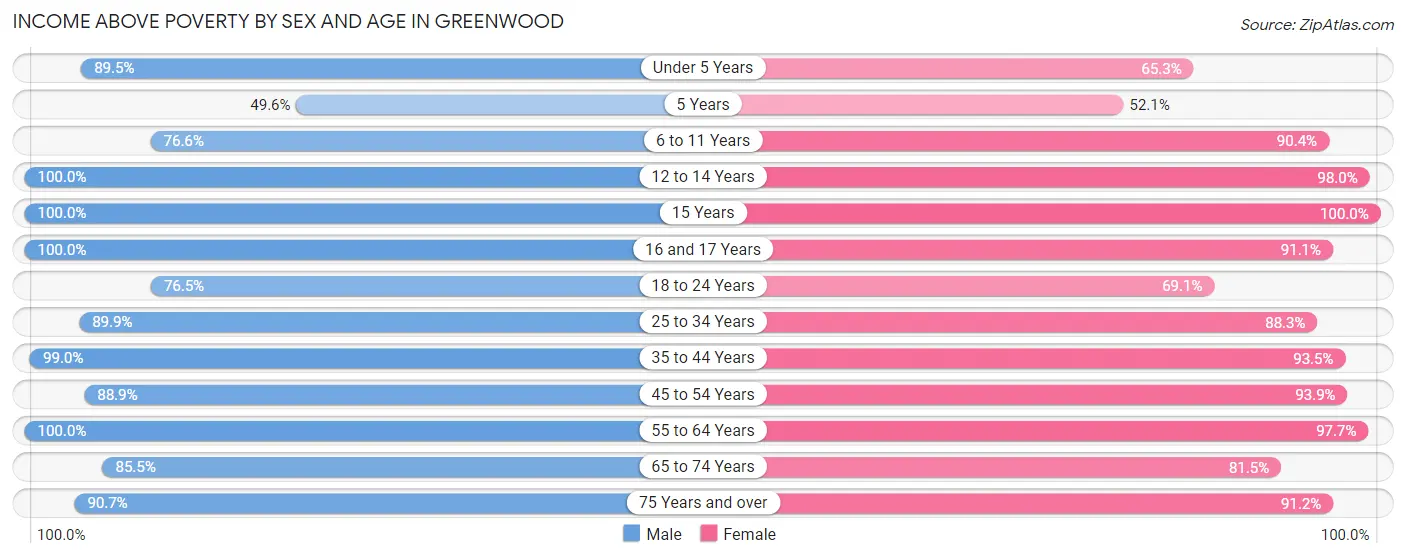
| Age Bracket | Male | Female |
| Under 5 Years | 264 (89.5%) | 205 (65.3%) |
| 5 Years | 56 (49.6%) | 37 (52.1%) |
| 6 to 11 Years | 216 (76.6%) | 377 (90.4%) |
| 12 to 14 Years | 135 (100.0%) | 287 (98.0%) |
| 15 Years | 91 (100.0%) | 37 (100.0%) |
| 16 and 17 Years | 271 (100.0%) | 72 (91.1%) |
| 18 to 24 Years | 274 (76.5%) | 235 (69.1%) |
| 25 to 34 Years | 656 (89.9%) | 564 (88.3%) |
| 35 to 44 Years | 676 (99.0%) | 528 (93.4%) |
| 45 to 54 Years | 529 (88.9%) | 626 (93.9%) |
| 55 to 64 Years | 276 (100.0%) | 384 (97.7%) |
| 65 to 74 Years | 337 (85.5%) | 508 (81.5%) |
| 75 Years and over | 245 (90.7%) | 404 (91.2%) |
| Total | 4,026 (89.6%) | 4,264 (87.4%) |
Income Below Poverty Among Married-Couple Families in Greenwood
The poverty statistics for married-couple families in Greenwood show that 4.2% or 98 of the total 2,364 families live below the poverty line. Families with 3 or 4 children have the highest poverty rate of 28.4%, comprising of 66 families. On the other hand, families with 1 or 2 children have the lowest poverty rate of 0.0%, which includes 0 families.
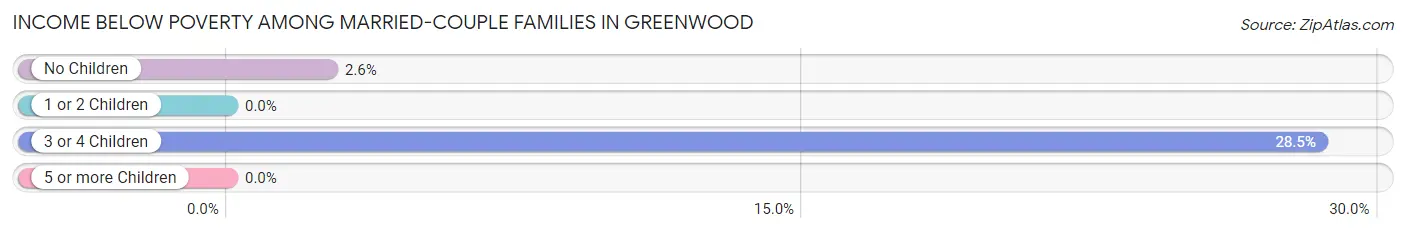
| Children | Above Poverty | Below Poverty |
| No Children | 1,193 (97.4%) | 32 (2.6%) |
| 1 or 2 Children | 907 (100.0%) | 0 (0.0%) |
| 3 or 4 Children | 166 (71.6%) | 66 (28.4%) |
| 5 or more Children | 0 (0.0%) | 0 (0.0%) |
| Total | 2,266 (95.9%) | 98 (4.2%) |
Income Below Poverty Among Single-Parent Households in Greenwood
According to the poverty data in Greenwood, 59.4% or 41 single-father households and 22.3% or 88 single-mother households are living below the poverty line. Among single-father households, those with 1 or 2 children have the highest poverty rate, with 41 households (59.4%) experiencing poverty. Likewise, among single-mother households, those with 1 or 2 children have the highest poverty rate, with 88 households (33.2%) falling below the poverty line.
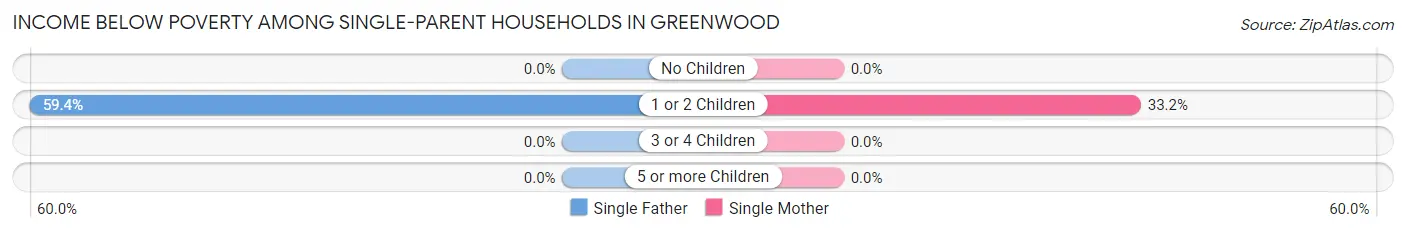
| Children | Single Father | Single Mother |
| No Children | 0 (0.0%) | 0 (0.0%) |
| 1 or 2 Children | 41 (59.4%) | 88 (33.2%) |
| 3 or 4 Children | 0 (0.0%) | 0 (0.0%) |
| 5 or more Children | 0 (0.0%) | 0 (0.0%) |
| Total | 41 (59.4%) | 88 (22.3%) |
Income Below Poverty Among Married-Couple vs Single-Parent Households in Greenwood
The poverty data for Greenwood shows that 98 of the married-couple family households (4.2%) and 129 of the single-parent households (27.9%) are living below the poverty level. Within the married-couple family households, those with 3 or 4 children have the highest poverty rate, with 66 households (28.4%) falling below the poverty line. Among the single-parent households, those with 1 or 2 children have the highest poverty rate, with 129 household (38.6%) living below poverty.
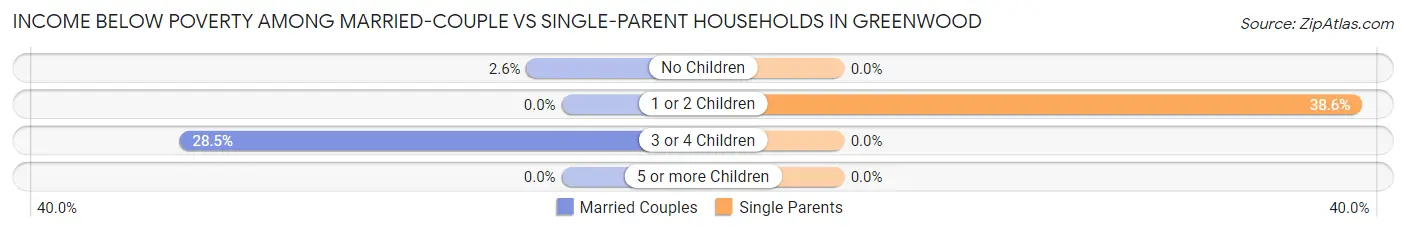
| Children | Married-Couple Families | Single-Parent Households |
| No Children | 32 (2.6%) | 0 (0.0%) |
| 1 or 2 Children | 0 (0.0%) | 129 (38.6%) |
| 3 or 4 Children | 66 (28.4%) | 0 (0.0%) |
| 5 or more Children | 0 (0.0%) | 0 (0.0%) |
| Total | 98 (4.2%) | 129 (27.9%) |
Race in Greenwood
The most populous races in Greenwood are White / Caucasian (8,429 | 88.3%), Hispanic or Latino (783 | 8.2%), and Two or more Races (548 | 5.7%).
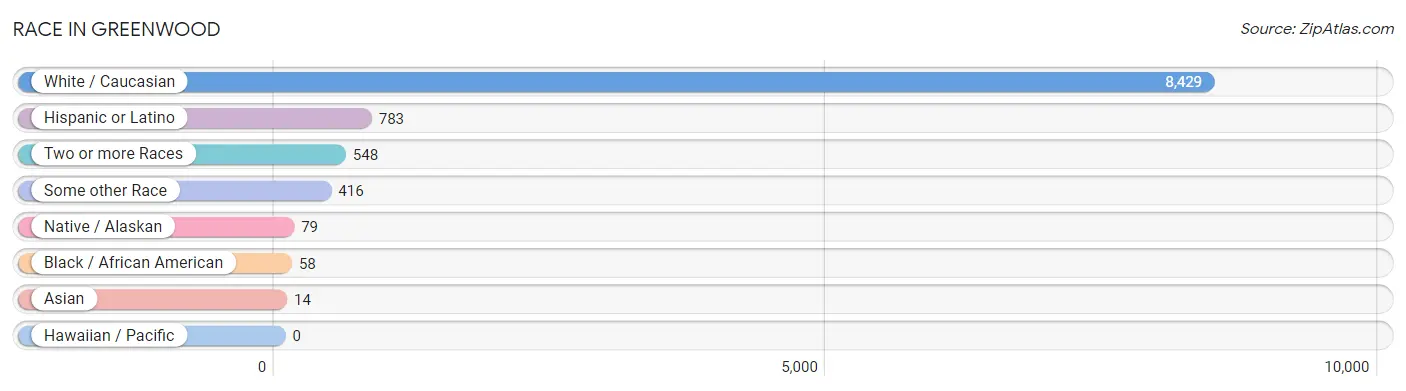
| Race | # Population | % Population |
| Asian | 14 | 0.2% |
| Black / African American | 58 | 0.6% |
| Hawaiian / Pacific | 0 | 0.0% |
| Hispanic or Latino | 783 | 8.2% |
| Native / Alaskan | 79 | 0.8% |
| White / Caucasian | 8,429 | 88.3% |
| Two or more Races | 548 | 5.7% |
| Some other Race | 416 | 4.4% |
| Total | 9,544 | 100.0% |
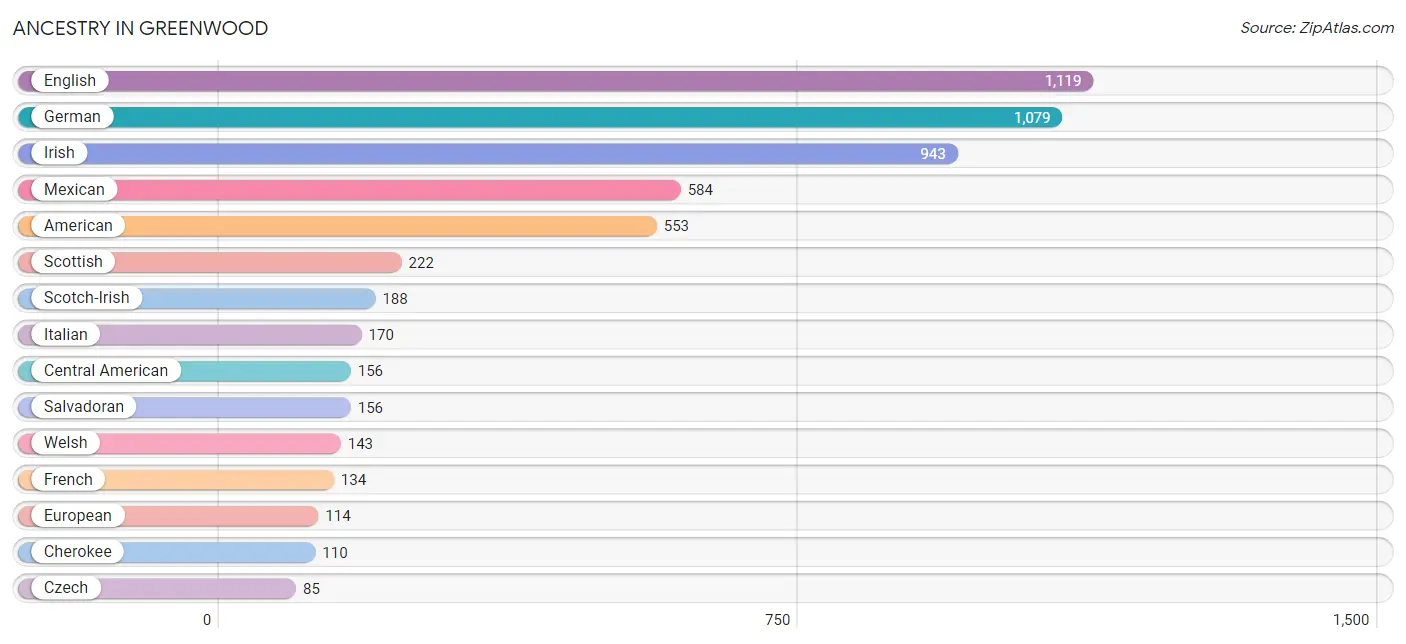
Ancestry in Greenwood
The most populous ancestries reported in Greenwood are English (1,119 | 11.7%), German (1,079 | 11.3%), Irish (943 | 9.9%), Mexican (584 | 6.1%), and American (553 | 5.8%), together accounting for 44.8% of all Greenwood residents.
| Ancestry | # Population | % Population |
| American | 553 | 5.8% |
| Arab | 9 | 0.1% |
| Austrian | 67 | 0.7% |
| Burmese | 9 | 0.1% |
| Central American | 156 | 1.6% |
| Central American Indian | 33 | 0.4% |
| Cherokee | 110 | 1.1% |
| Choctaw | 15 | 0.2% |
| Colombian | 35 | 0.4% |
| Creek | 10 | 0.1% |
| Czech | 85 | 0.9% |
| Czechoslovakian | 11 | 0.1% |
| Dutch | 47 | 0.5% |
| English | 1,119 | 11.7% |
| European | 114 | 1.2% |
| Finnish | 20 | 0.2% |
| French | 134 | 1.4% |
| French Canadian | 17 | 0.2% |
| German | 1,079 | 11.3% |
| Hungarian | 15 | 0.2% |
| Indian (Asian) | 49 | 0.5% |
| Irish | 943 | 9.9% |
| Italian | 170 | 1.8% |
| Korean | 9 | 0.1% |
| Mexican | 584 | 6.1% |
| Mexican American Indian | 50 | 0.5% |
| Native Hawaiian | 19 | 0.2% |
| Northern European | 42 | 0.4% |
| Norwegian | 39 | 0.4% |
| Polish | 47 | 0.5% |
| Romanian | 21 | 0.2% |
| Russian | 53 | 0.6% |
| Salvadoran | 156 | 1.6% |
| Scandinavian | 8 | 0.1% |
| Scotch-Irish | 188 | 2.0% |
| Scottish | 222 | 2.3% |
| Serbian | 21 | 0.2% |
| South American | 35 | 0.4% |
| Sri Lankan | 9 | 0.1% |
| Swedish | 19 | 0.2% |
| Swiss | 38 | 0.4% |
| Syrian | 9 | 0.1% |
| Thai | 9 | 0.1% |
| Welsh | 143 | 1.5% | View All 44 Rows |
Immigrants in Greenwood
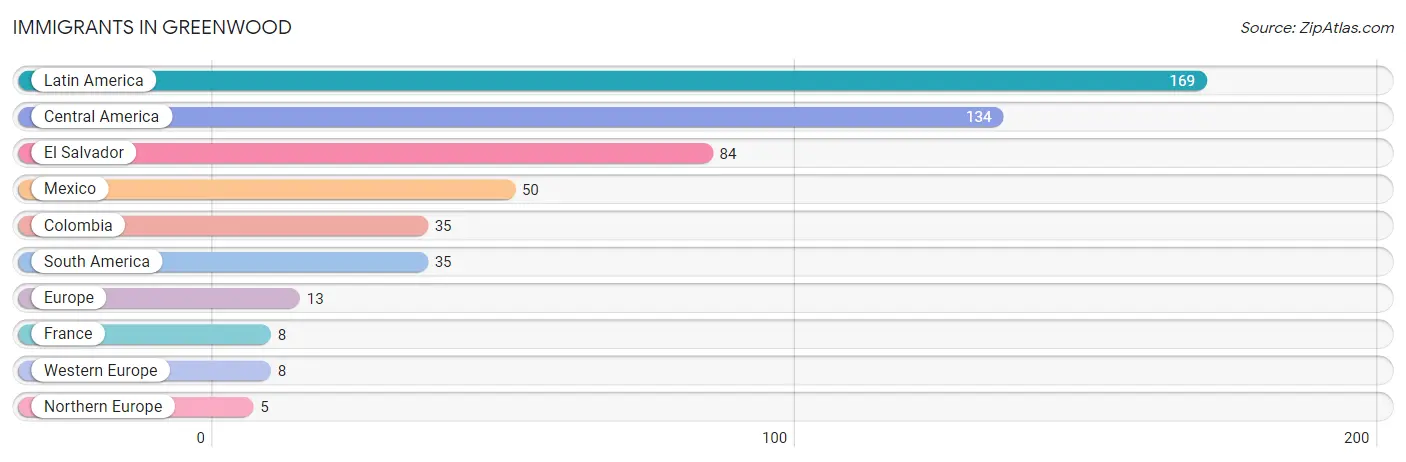
The most numerous immigrant groups reported in Greenwood came from Latin America (169 | 1.8%), Central America (134 | 1.4%), El Salvador (84 | 0.9%), Mexico (50 | 0.5%), and Colombia (35 | 0.4%), together accounting for 4.9% of all Greenwood residents.
| Immigration Origin | # Population | % Population |
| Central America | 134 | 1.4% |
| Colombia | 35 | 0.4% |
| El Salvador | 84 | 0.9% |
| Europe | 13 | 0.1% |
| France | 8 | 0.1% |
| Latin America | 169 | 1.8% |
| Mexico | 50 | 0.5% |
| Northern Europe | 5 | 0.1% |
| South America | 35 | 0.4% |
| Western Europe | 8 | 0.1% | View All 10 Rows |
Sex and Age in Greenwood
Sex and Age in Greenwood
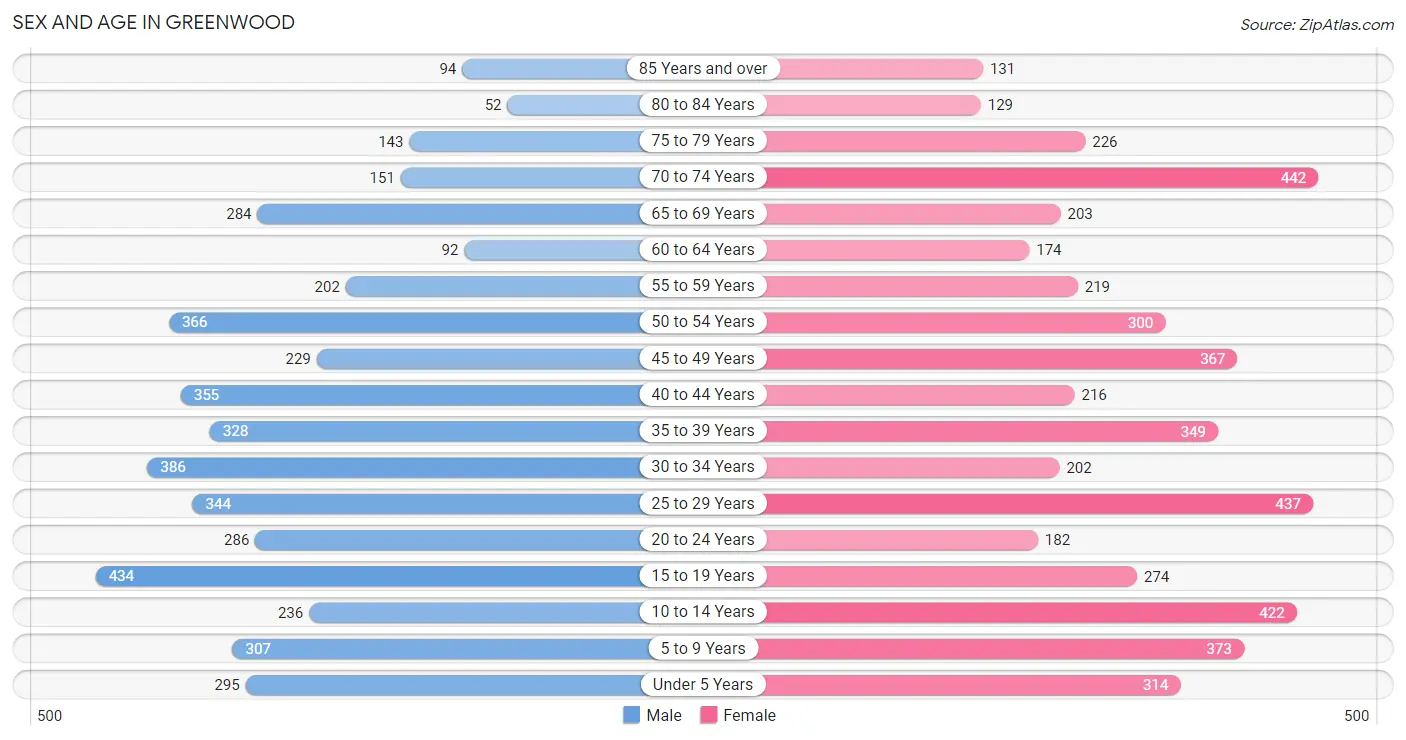
The most populous age groups in Greenwood are 15 to 19 Years (434 | 9.5%) for men and 70 to 74 Years (442 | 8.9%) for women.
| Age Bracket | Male | Female |
| Under 5 Years | 295 (6.4%) | 314 (6.3%) |
| 5 to 9 Years | 307 (6.7%) | 373 (7.5%) |
| 10 to 14 Years | 236 (5.1%) | 422 (8.5%) |
| 15 to 19 Years | 434 (9.5%) | 274 (5.5%) |
| 20 to 24 Years | 286 (6.2%) | 182 (3.7%) |
| 25 to 29 Years | 344 (7.5%) | 437 (8.8%) |
| 30 to 34 Years | 386 (8.4%) | 202 (4.1%) |
| 35 to 39 Years | 328 (7.2%) | 349 (7.0%) |
| 40 to 44 Years | 355 (7.7%) | 216 (4.3%) |
| 45 to 49 Years | 229 (5.0%) | 367 (7.4%) |
| 50 to 54 Years | 366 (8.0%) | 300 (6.0%) |
| 55 to 59 Years | 202 (4.4%) | 219 (4.4%) |
| 60 to 64 Years | 92 (2.0%) | 174 (3.5%) |
| 65 to 69 Years | 284 (6.2%) | 203 (4.1%) |
| 70 to 74 Years | 151 (3.3%) | 442 (8.9%) |
| 75 to 79 Years | 143 (3.1%) | 226 (4.6%) |
| 80 to 84 Years | 52 (1.1%) | 129 (2.6%) |
| 85 Years and over | 94 (2.1%) | 131 (2.6%) |
| Total | 4,584 (100.0%) | 4,960 (100.0%) |
Families and Households in Greenwood
Median Family Size in Greenwood
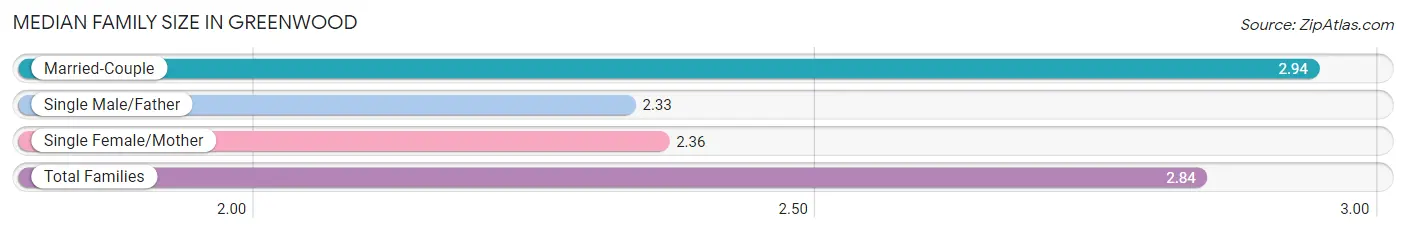
The median family size in Greenwood is 2.84 persons per family, with married-couple families (2,364 | 83.6%) accounting for the largest median family size of 2.94 persons per family. On the other hand, single male/father families (69 | 2.4%) represent the smallest median family size with 2.33 persons per family.
| Family Type | # Families | Family Size |
| Married-Couple | 2,364 (83.6%) | 2.94 |
| Single Male/Father | 69 (2.4%) | 2.33 |
| Single Female/Mother | 394 (13.9%) | 2.36 |
| Total Families | 2,827 (100.0%) | 2.84 |
Median Household Size in Greenwood
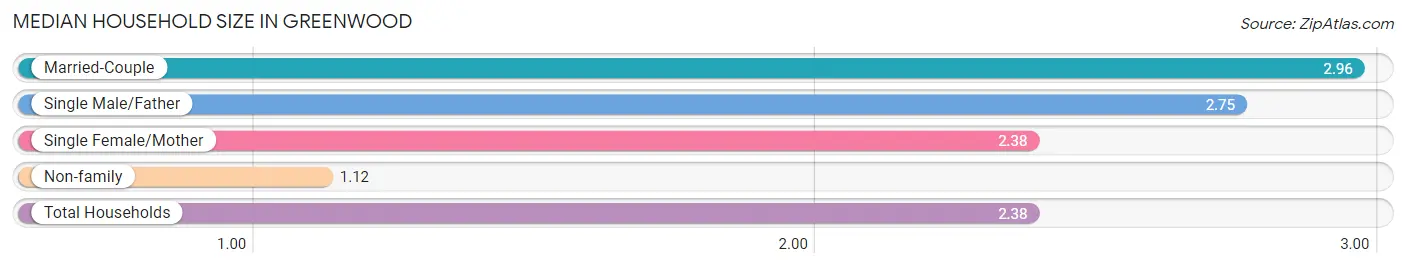
The median household size in Greenwood is 2.38 persons per household, with married-couple households (2,364 | 59.8%) accounting for the largest median household size of 2.96 persons per household. non-family households (1,126 | 28.5%) represent the smallest median household size with 1.12 persons per household.
| Household Type | # Households | Household Size |
| Married-Couple | 2,364 (59.8%) | 2.96 |
| Single Male/Father | 69 (1.8%) | 2.75 |
| Single Female/Mother | 394 (10.0%) | 2.38 |
| Non-family | 1,126 (28.5%) | 1.12 |
| Total Households | 3,953 (100.0%) | 2.38 |
Household Size by Marriage Status in Greenwood
Out of a total of 3,953 households in Greenwood, 2,827 (71.5%) are family households, while 1,126 (28.5%) are nonfamily households. The most numerous type of family households are 2-person households, comprising 1,358, and the most common type of nonfamily households are 1-person households, comprising 1,011.
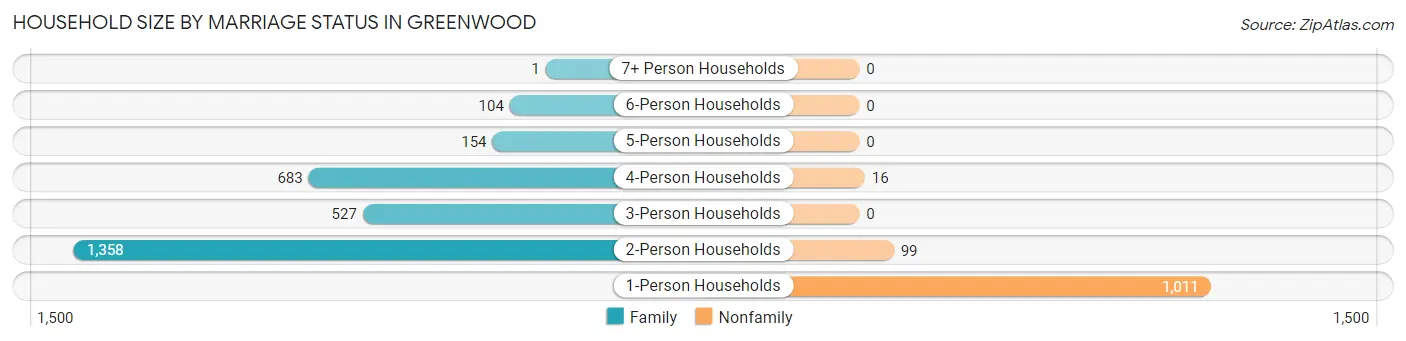
| Household Size | Family Households | Nonfamily Households |
| 1-Person Households | - | 1,011 (25.6%) |
| 2-Person Households | 1,358 (34.4%) | 99 (2.5%) |
| 3-Person Households | 527 (13.3%) | 0 (0.0%) |
| 4-Person Households | 683 (17.3%) | 16 (0.4%) |
| 5-Person Households | 154 (3.9%) | 0 (0.0%) |
| 6-Person Households | 104 (2.6%) | 0 (0.0%) |
| 7+ Person Households | 1 (0.0%) | 0 (0.0%) |
| Total | 2,827 (71.5%) | 1,126 (28.5%) |
Female Fertility in Greenwood
Fertility by Age in Greenwood
Average fertility rate in Greenwood is 58.0 births per 1,000 women. Women in the age bracket of 20 to 34 years have the highest fertility rate with 124.0 births per 1,000 women. Women in the age bracket of 20 to 34 years acount for 81.6% of all women with births.
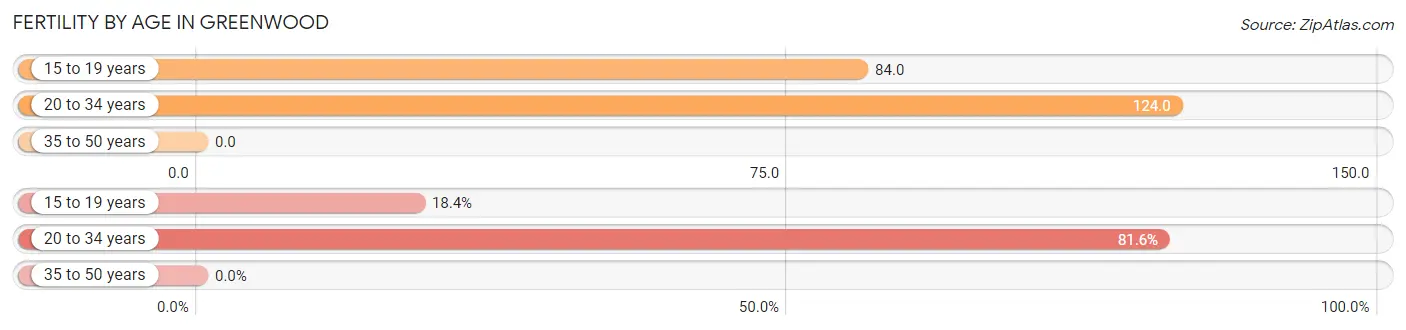
| Age Bracket | Women with Births | Births / 1,000 Women |
| 15 to 19 years | 23 (18.4%) | 84.0 |
| 20 to 34 years | 102 (81.6%) | 124.0 |
| 35 to 50 years | 0 (0.0%) | 0.0 |
| Total | 125 (100.0%) | 58.0 |
Fertility by Age by Marriage Status in Greenwood
84.8% of women with births (125) in Greenwood are married. The highest percentage of unmarried women with births falls into 20 to 34 years age bracket with 18.6% of them unmarried at the time of birth, while the lowest percentage of unmarried women with births belong to 15 to 19 years age bracket with 0.0% of them unmarried.
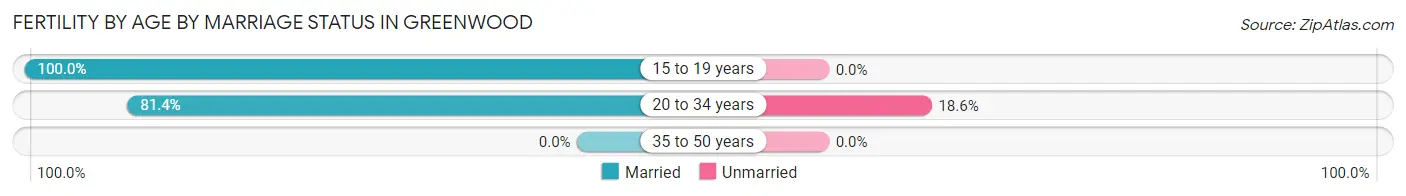
| Age Bracket | Married | Unmarried |
| 15 to 19 years | 23 (100.0%) | 0 (0.0%) |
| 20 to 34 years | 83 (81.4%) | 19 (18.6%) |
| 35 to 50 years | 0 (0.0%) | 0 (0.0%) |
| Total | 106 (84.8%) | 19 (15.2%) |
Fertility by Education in Greenwood
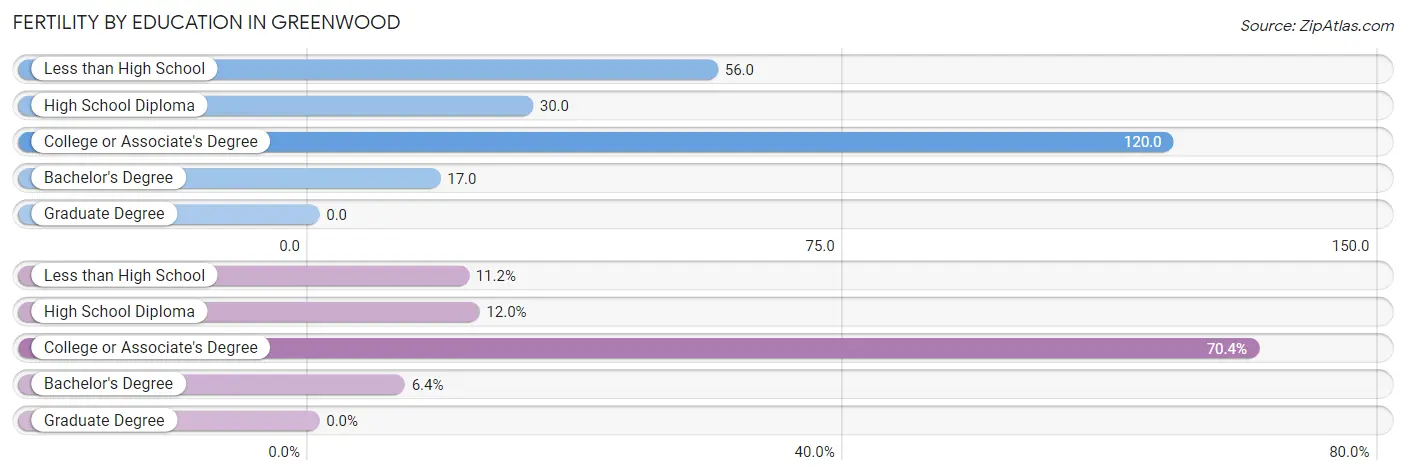
| Educational Attainment | Women with Births | Births / 1,000 Women |
| Less than High School | 14 (11.2%) | 56.0 |
| High School Diploma | 15 (12.0%) | 30.0 |
| College or Associate's Degree | 88 (70.4%) | 120.0 |
| Bachelor's Degree | 8 (6.4%) | 17.0 |
| Graduate Degree | 0 (0.0%) | 0.0 |
| Total | 125 (100.0%) | 58.0 |
Fertility by Education by Marriage Status in Greenwood
15.2% of women with births in Greenwood are unmarried. Women with the educational attainment of less than high school are most likely to be married with 100.0% of them married at childbirth, while women with the educational attainment of college or associate's degree are least likely to be married with 21.6% of them unmarried at childbirth.
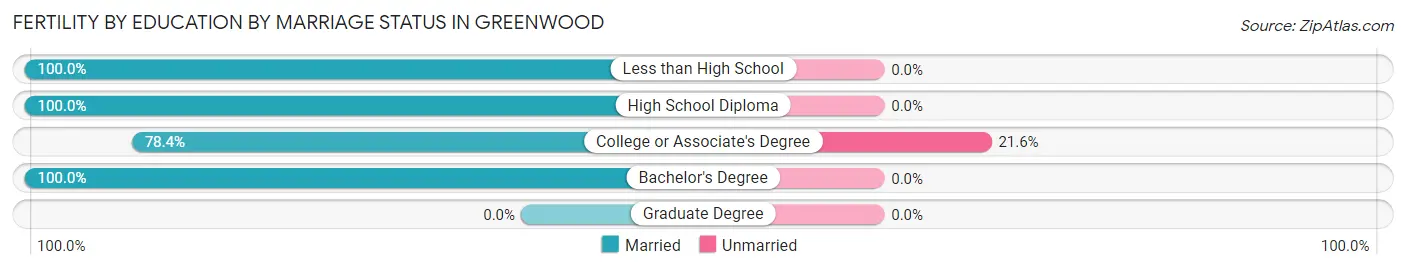
| Educational Attainment | Married | Unmarried |
| Less than High School | 14 (100.0%) | 0 (0.0%) |
| High School Diploma | 15 (100.0%) | 0 (0.0%) |
| College or Associate's Degree | 69 (78.4%) | 19 (21.6%) |
| Bachelor's Degree | 8 (100.0%) | 0 (0.0%) |
| Graduate Degree | 0 (0.0%) | 0 (0.0%) |
| Total | 106 (84.8%) | 19 (15.2%) |
Employment Characteristics in Greenwood
Employment by Class of Employer in Greenwood
Among the 4,303 employed individuals in Greenwood, private company employees (2,547 | 59.2%), not-for-profit organizations (412 | 9.6%), and local government employees (412 | 9.6%) make up the most common classes of employment.
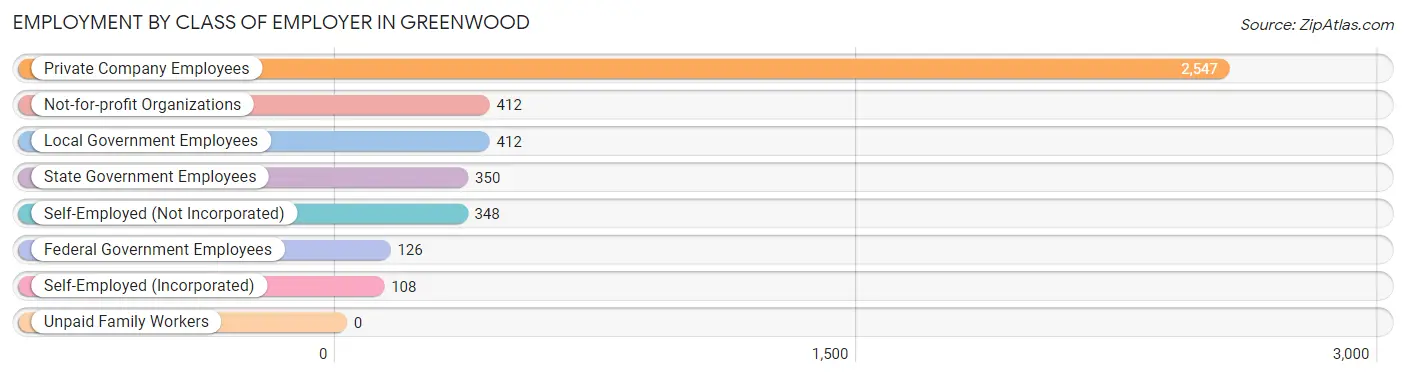
| Employer Class | # Employees | % Employees |
| Private Company Employees | 2,547 | 59.2% |
| Self-Employed (Incorporated) | 108 | 2.5% |
| Self-Employed (Not Incorporated) | 348 | 8.1% |
| Not-for-profit Organizations | 412 | 9.6% |
| Local Government Employees | 412 | 9.6% |
| State Government Employees | 350 | 8.1% |
| Federal Government Employees | 126 | 2.9% |
| Unpaid Family Workers | 0 | 0.0% |
| Total | 4,303 | 100.0% |
Employment Status by Age in Greenwood
According to the labor force statistics for Greenwood, out of the total population over 16 years of age (7,469), 62.1% or 4,638 individuals are in the labor force, with 3.3% or 153 of them unemployed. The age group with the highest labor force participation rate is 20 to 24 years, with 97.6% or 457 individuals in the labor force. Within the labor force, the 60 to 64 years age range has the highest percentage of unemployed individuals, with 8.3% or 18 of them being unemployed.
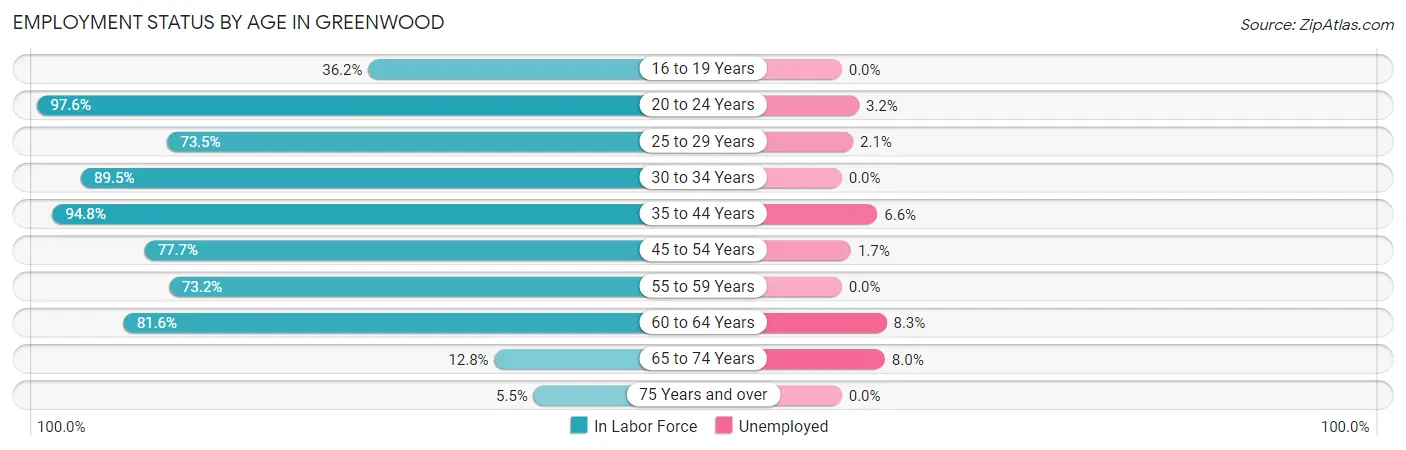
| Age Bracket | In Labor Force | Unemployed |
| 16 to 19 Years | 210 (36.2%) | 0 (0.0%) |
| 20 to 24 Years | 457 (97.6%) | 15 (3.2%) |
| 25 to 29 Years | 574 (73.5%) | 12 (2.1%) |
| 30 to 34 Years | 526 (89.5%) | 0 (0.0%) |
| 35 to 44 Years | 1,183 (94.8%) | 78 (6.6%) |
| 45 to 54 Years | 981 (77.7%) | 17 (1.7%) |
| 55 to 59 Years | 308 (73.2%) | 0 (0.0%) |
| 60 to 64 Years | 217 (81.6%) | 18 (8.3%) |
| 65 to 74 Years | 138 (12.8%) | 11 (8.0%) |
| 75 Years and over | 43 (5.5%) | 0 (0.0%) |
| Total | 4,638 (62.1%) | 153 (3.3%) |
Employment Status by Educational Attainment in Greenwood
According to labor force statistics for Greenwood, 83.0% of individuals (3,790) out of the total population between 25 and 64 years of age (4,566) are in the labor force, with 3.3% or 125 of them being unemployed. The group with the highest labor force participation rate are those with the educational attainment of bachelor's degree or higher, with 92.5% or 1,370 individuals in the labor force. Within the labor force, individuals with college / associate degree education have the highest percentage of unemployment, with 3.6% or 52 of them being unemployed.
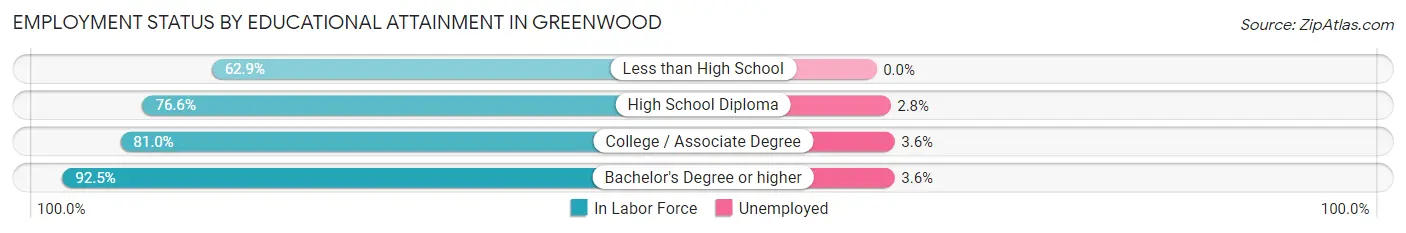
| Educational Attainment | In Labor Force | Unemployed |
| Less than High School | 105 (62.9%) | 0 (0.0%) |
| High School Diploma | 879 (76.6%) | 32 (2.8%) |
| College / Associate Degree | 1,435 (81.0%) | 64 (3.6%) |
| Bachelor's Degree or higher | 1,370 (92.5%) | 53 (3.6%) |
| Total | 3,790 (83.0%) | 151 (3.3%) |
Employment Occupations by Sex in Greenwood
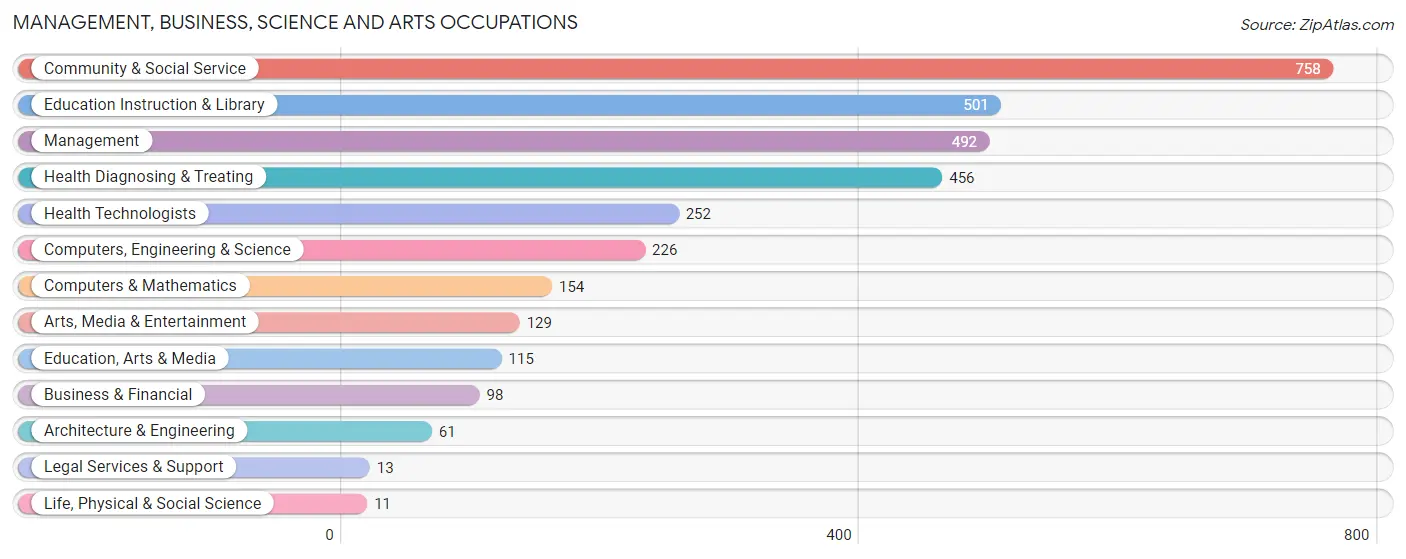
Management, Business, Science and Arts Occupations
The most common Management, Business, Science and Arts occupations in Greenwood are Community & Social Service (758 | 17.2%), Education Instruction & Library (501 | 11.3%), Management (492 | 11.1%), Health Diagnosing & Treating (456 | 10.3%), and Health Technologists (252 | 5.7%).
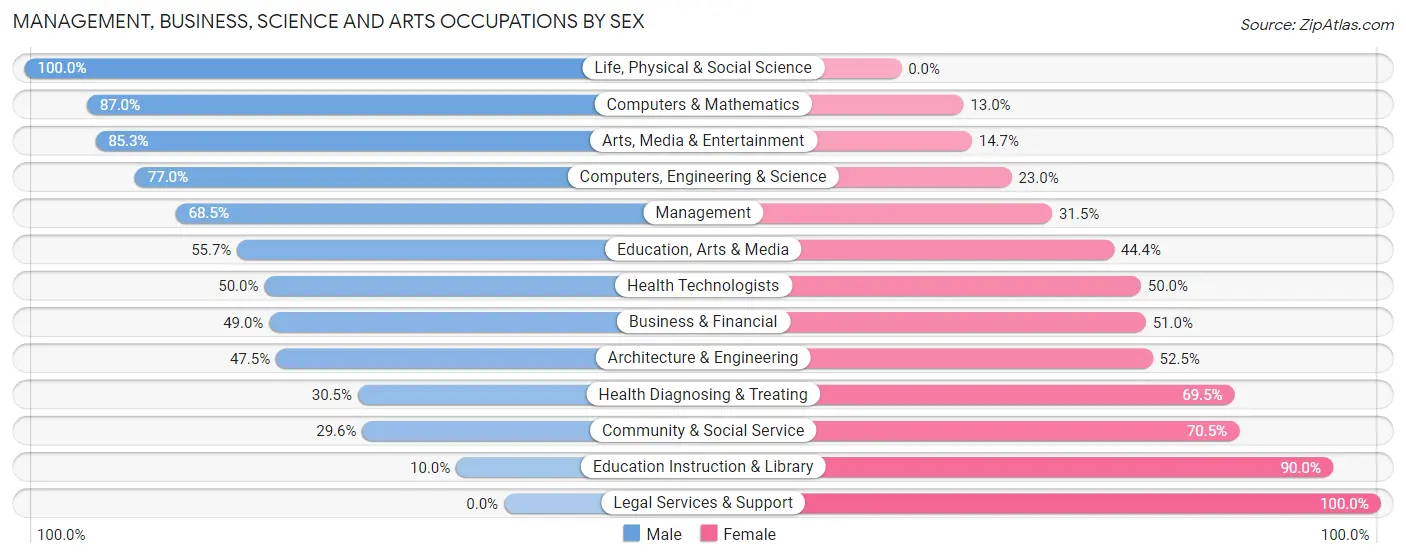
Management, Business, Science and Arts Occupations by Sex
Within the Management, Business, Science and Arts occupations in Greenwood, the most male-oriented occupations are Life, Physical & Social Science (100.0%), Computers & Mathematics (87.0%), and Arts, Media & Entertainment (85.3%), while the most female-oriented occupations are Legal Services & Support (100.0%), Education Instruction & Library (90.0%), and Community & Social Service (70.5%).
| Occupation | Male | Female |
| Management | 337 (68.5%) | 155 (31.5%) |
| Business & Financial | 48 (49.0%) | 50 (51.0%) |
| Computers, Engineering & Science | 174 (77.0%) | 52 (23.0%) |
| Computers & Mathematics | 134 (87.0%) | 20 (13.0%) |
| Architecture & Engineering | 29 (47.5%) | 32 (52.5%) |
| Life, Physical & Social Science | 11 (100.0%) | 0 (0.0%) |
| Community & Social Service | 224 (29.5%) | 534 (70.5%) |
| Education, Arts & Media | 64 (55.6%) | 51 (44.4%) |
| Legal Services & Support | 0 (0.0%) | 13 (100.0%) |
| Education Instruction & Library | 50 (10.0%) | 451 (90.0%) |
| Arts, Media & Entertainment | 110 (85.3%) | 19 (14.7%) |
| Health Diagnosing & Treating | 139 (30.5%) | 317 (69.5%) |
| Health Technologists | 126 (50.0%) | 126 (50.0%) |
| Total (Category) | 922 (45.4%) | 1,108 (54.6%) |
| Total (Overall) | 2,407 (54.5%) | 2,011 (45.5%) |
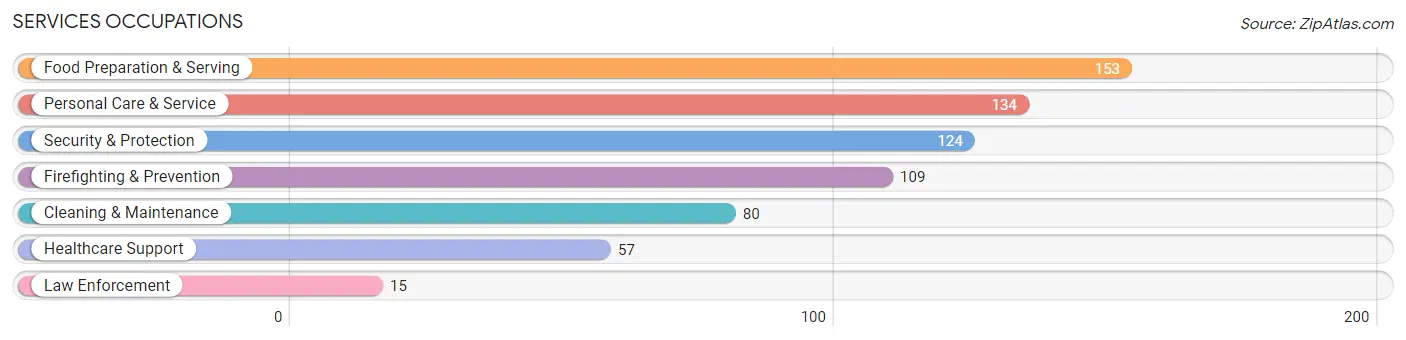
Services Occupations
The most common Services occupations in Greenwood are Food Preparation & Serving (153 | 3.5%), Personal Care & Service (134 | 3.0%), Security & Protection (124 | 2.8%), Firefighting & Prevention (109 | 2.5%), and Cleaning & Maintenance (80 | 1.8%).
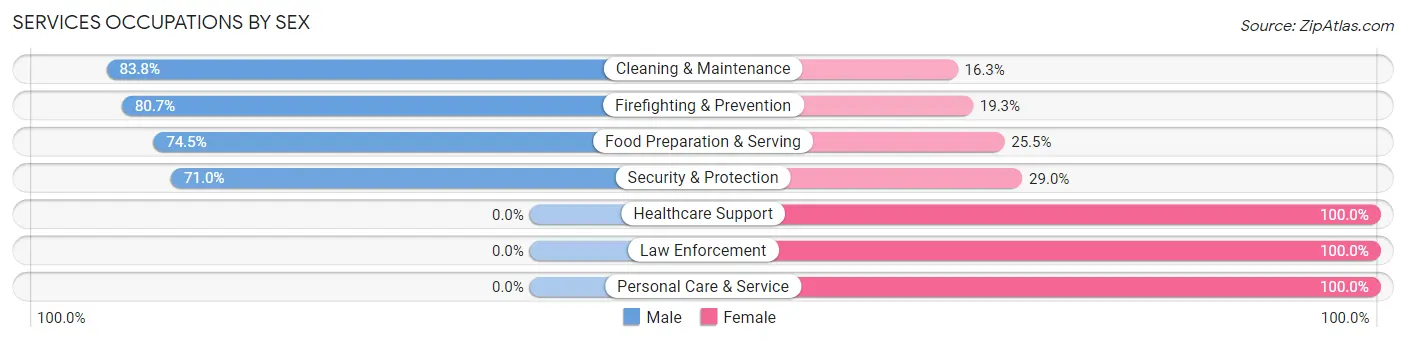
Services Occupations by Sex
Within the Services occupations in Greenwood, the most male-oriented occupations are Cleaning & Maintenance (83.8%), Firefighting & Prevention (80.7%), and Food Preparation & Serving (74.5%), while the most female-oriented occupations are Healthcare Support (100.0%), Law Enforcement (100.0%), and Personal Care & Service (100.0%).
| Occupation | Male | Female |
| Healthcare Support | 0 (0.0%) | 57 (100.0%) |
| Security & Protection | 88 (71.0%) | 36 (29.0%) |
| Firefighting & Prevention | 88 (80.7%) | 21 (19.3%) |
| Law Enforcement | 0 (0.0%) | 15 (100.0%) |
| Food Preparation & Serving | 114 (74.5%) | 39 (25.5%) |
| Cleaning & Maintenance | 67 (83.8%) | 13 (16.3%) |
| Personal Care & Service | 0 (0.0%) | 134 (100.0%) |
| Total (Category) | 269 (49.1%) | 279 (50.9%) |
| Total (Overall) | 2,407 (54.5%) | 2,011 (45.5%) |
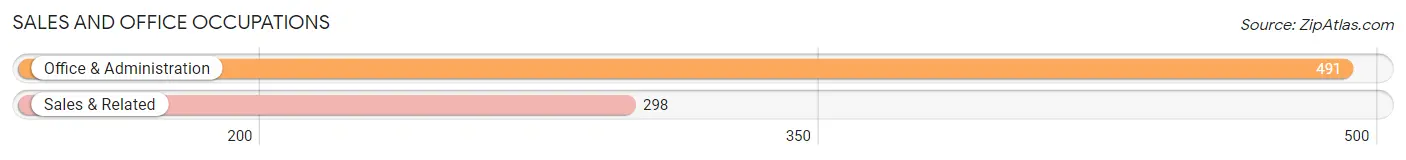
Sales and Office Occupations
The most common Sales and Office occupations in Greenwood are Office & Administration (491 | 11.1%), and Sales & Related (298 | 6.8%).
Sales and Office Occupations by Sex
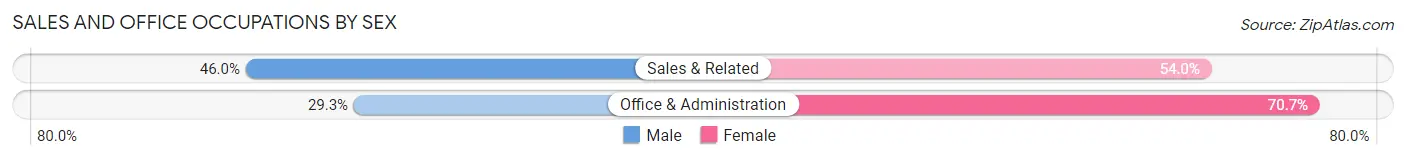
| Occupation | Male | Female |
| Sales & Related | 137 (46.0%) | 161 (54.0%) |
| Office & Administration | 144 (29.3%) | 347 (70.7%) |
| Total (Category) | 281 (35.6%) | 508 (64.4%) |
| Total (Overall) | 2,407 (54.5%) | 2,011 (45.5%) |
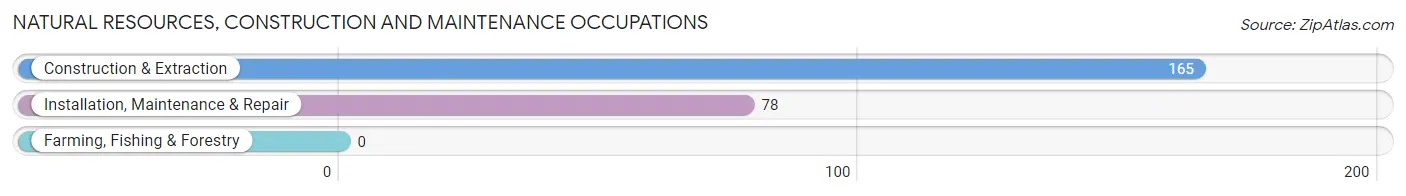
Natural Resources, Construction and Maintenance Occupations
The most common Natural Resources, Construction and Maintenance occupations in Greenwood are Construction & Extraction (165 | 3.7%), and Installation, Maintenance & Repair (78 | 1.8%).
Natural Resources, Construction and Maintenance Occupations by Sex
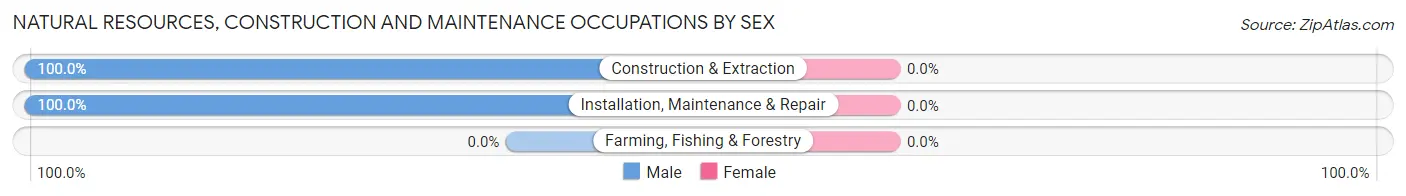
| Occupation | Male | Female |
| Farming, Fishing & Forestry | 0 (0.0%) | 0 (0.0%) |
| Construction & Extraction | 165 (100.0%) | 0 (0.0%) |
| Installation, Maintenance & Repair | 78 (100.0%) | 0 (0.0%) |
| Total (Category) | 243 (100.0%) | 0 (0.0%) |
| Total (Overall) | 2,407 (54.5%) | 2,011 (45.5%) |
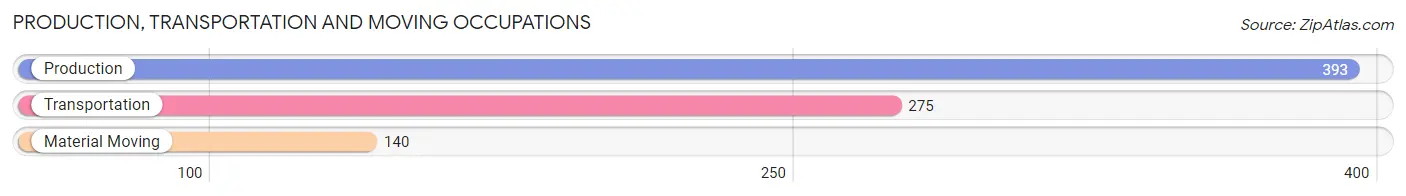
Production, Transportation and Moving Occupations
The most common Production, Transportation and Moving occupations in Greenwood are Production (393 | 8.9%), Transportation (275 | 6.2%), and Material Moving (140 | 3.2%).
Production, Transportation and Moving Occupations by Sex
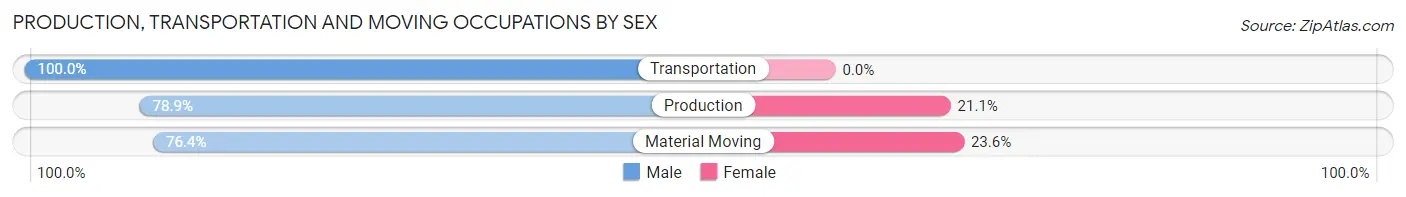
| Occupation | Male | Female |
| Production | 310 (78.9%) | 83 (21.1%) |
| Transportation | 275 (100.0%) | 0 (0.0%) |
| Material Moving | 107 (76.4%) | 33 (23.6%) |
| Total (Category) | 692 (85.6%) | 116 (14.4%) |
| Total (Overall) | 2,407 (54.5%) | 2,011 (45.5%) |
Employment Industries by Sex in Greenwood
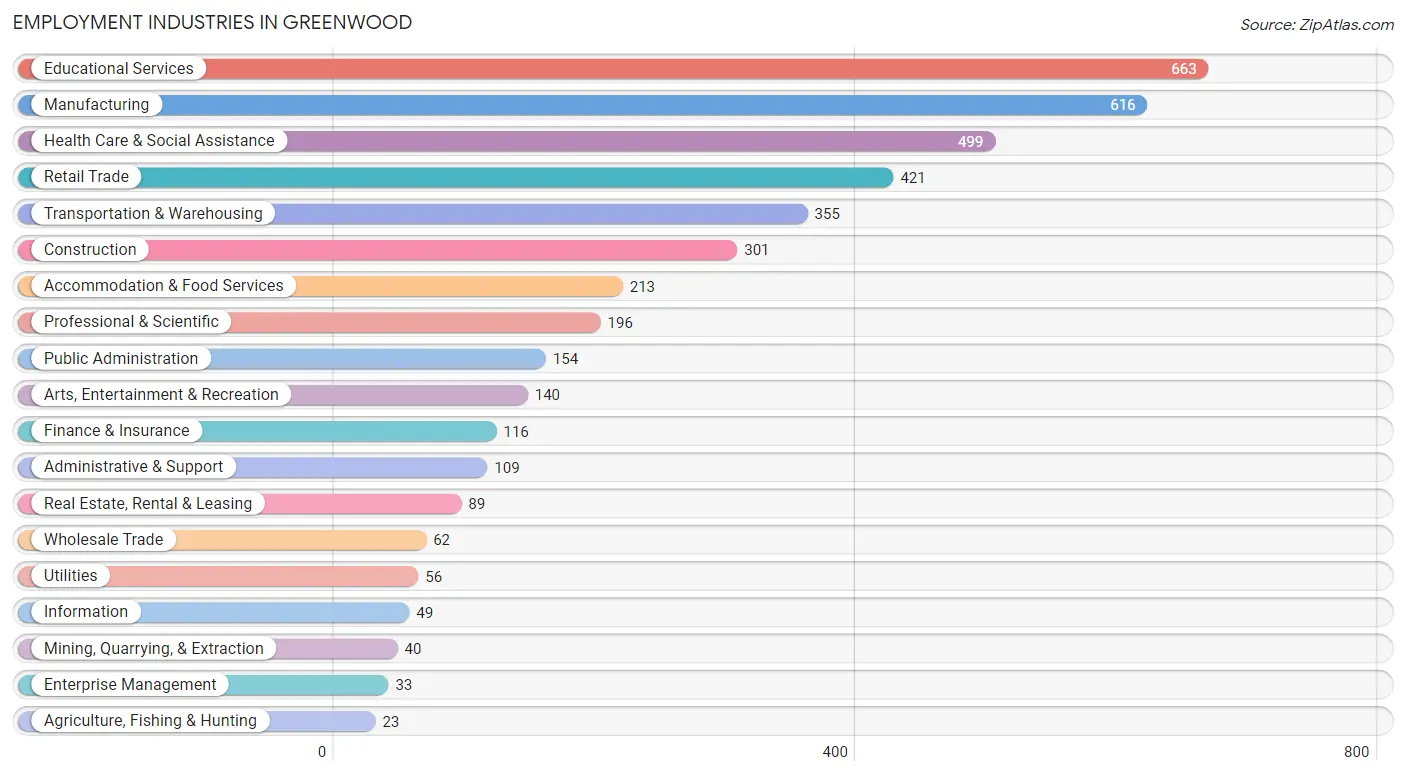
Employment Industries in Greenwood
The major employment industries in Greenwood include Educational Services (663 | 15.0%), Manufacturing (616 | 13.9%), Health Care & Social Assistance (499 | 11.3%), Retail Trade (421 | 9.5%), and Transportation & Warehousing (355 | 8.0%).
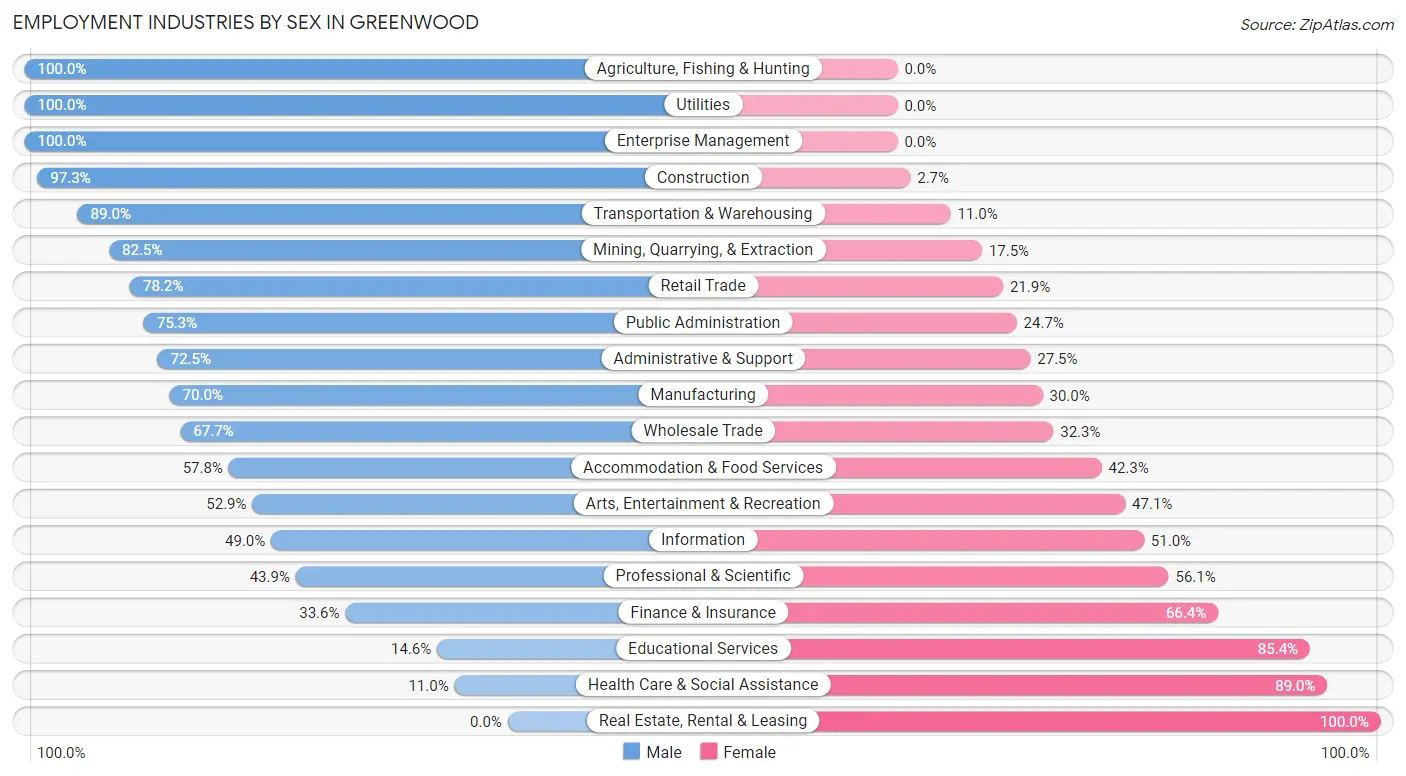
Employment Industries by Sex in Greenwood
The Greenwood industries that see more men than women are Agriculture, Fishing & Hunting (100.0%), Utilities (100.0%), and Enterprise Management (100.0%), whereas the industries that tend to have a higher number of women are Real Estate, Rental & Leasing (100.0%), Health Care & Social Assistance (89.0%), and Educational Services (85.4%).
| Industry | Male | Female |
| Agriculture, Fishing & Hunting | 23 (100.0%) | 0 (0.0%) |
| Mining, Quarrying, & Extraction | 33 (82.5%) | 7 (17.5%) |
| Construction | 293 (97.3%) | 8 (2.7%) |
| Manufacturing | 431 (70.0%) | 185 (30.0%) |
| Wholesale Trade | 42 (67.7%) | 20 (32.3%) |
| Retail Trade | 329 (78.1%) | 92 (21.8%) |
| Transportation & Warehousing | 316 (89.0%) | 39 (11.0%) |
| Utilities | 56 (100.0%) | 0 (0.0%) |
| Information | 24 (49.0%) | 25 (51.0%) |
| Finance & Insurance | 39 (33.6%) | 77 (66.4%) |
| Real Estate, Rental & Leasing | 0 (0.0%) | 89 (100.0%) |
| Professional & Scientific | 86 (43.9%) | 110 (56.1%) |
| Enterprise Management | 33 (100.0%) | 0 (0.0%) |
| Administrative & Support | 79 (72.5%) | 30 (27.5%) |
| Educational Services | 97 (14.6%) | 566 (85.4%) |
| Health Care & Social Assistance | 55 (11.0%) | 444 (89.0%) |
| Arts, Entertainment & Recreation | 74 (52.9%) | 66 (47.1%) |
| Accommodation & Food Services | 123 (57.8%) | 90 (42.2%) |
| Public Administration | 116 (75.3%) | 38 (24.7%) |
| Total | 2,407 (54.5%) | 2,011 (45.5%) |
Education in Greenwood
School Enrollment in Greenwood
The most common levels of schooling among the 2,360 students in Greenwood are high school (660 | 28.0%), elementary school (587 | 24.9%), and middle school (385 | 16.3%).
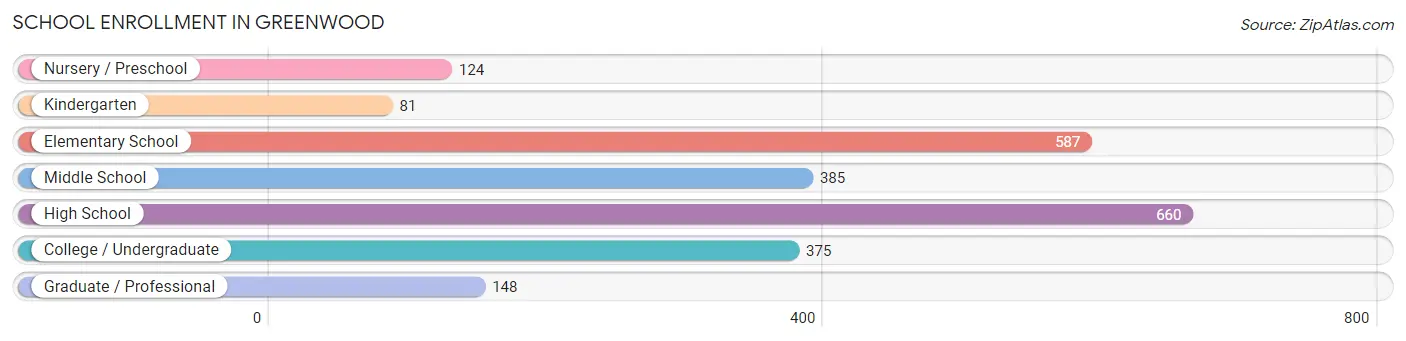
| School Level | # Students | % Students |
| Nursery / Preschool | 124 | 5.2% |
| Kindergarten | 81 | 3.4% |
| Elementary School | 587 | 24.9% |
| Middle School | 385 | 16.3% |
| High School | 660 | 28.0% |
| College / Undergraduate | 375 | 15.9% |
| Graduate / Professional | 148 | 6.3% |
| Total | 2,360 | 100.0% |
School Enrollment by Age by Funding Source in Greenwood
Out of a total of 2,360 students who are enrolled in schools in Greenwood, 274 (11.6%) attend a private institution, while the remaining 2,086 (88.4%) are enrolled in public schools. The age group of 25 to 34 year olds has the highest likelihood of being enrolled in private schools, with 29 (31.2% in the age bracket) enrolled. Conversely, the age group of 18 to 19 year olds has the lowest likelihood of being enrolled in a private school, with 176 (100.0% in the age bracket) attending a public institution.
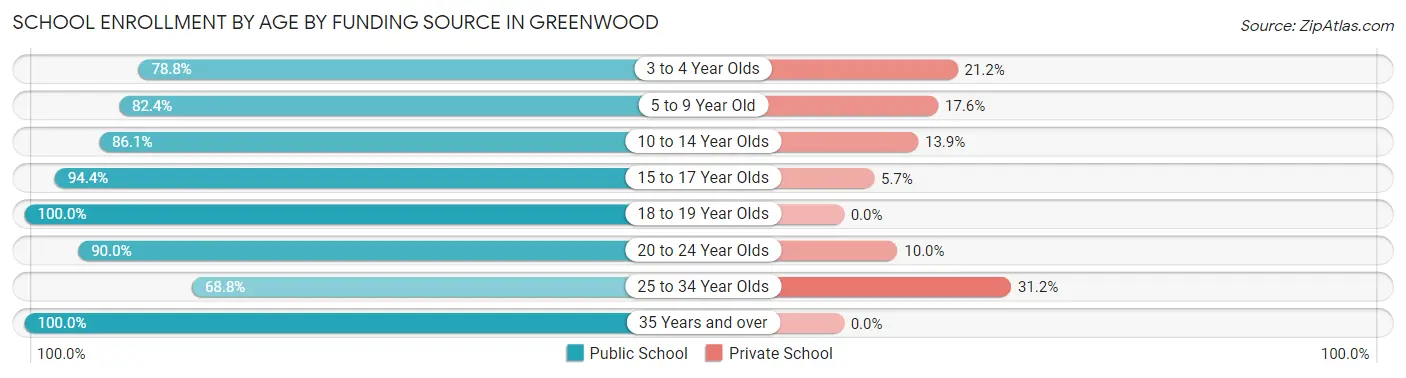
| Age Bracket | Public School | Private School |
| 3 to 4 Year Olds | 26 (78.8%) | 7 (21.2%) |
| 5 to 9 Year Old | 525 (82.4%) | 112 (17.6%) |
| 10 to 14 Year Olds | 547 (86.1%) | 88 (13.9%) |
| 15 to 17 Year Olds | 451 (94.4%) | 27 (5.7%) |
| 18 to 19 Year Olds | 176 (100.0%) | 0 (0.0%) |
| 20 to 24 Year Olds | 90 (90.0%) | 10 (10.0%) |
| 25 to 34 Year Olds | 64 (68.8%) | 29 (31.2%) |
| 35 Years and over | 208 (100.0%) | 0 (0.0%) |
| Total | 2,086 (88.4%) | 274 (11.6%) |
Educational Attainment by Field of Study in Greenwood
Education (431 | 24.0%), business (289 | 16.1%), science & technology (275 | 15.3%), communications (117 | 6.5%), and arts & humanities (99 | 5.5%) are the most common fields of study among 1,792 individuals in Greenwood who have obtained a bachelor's degree or higher.
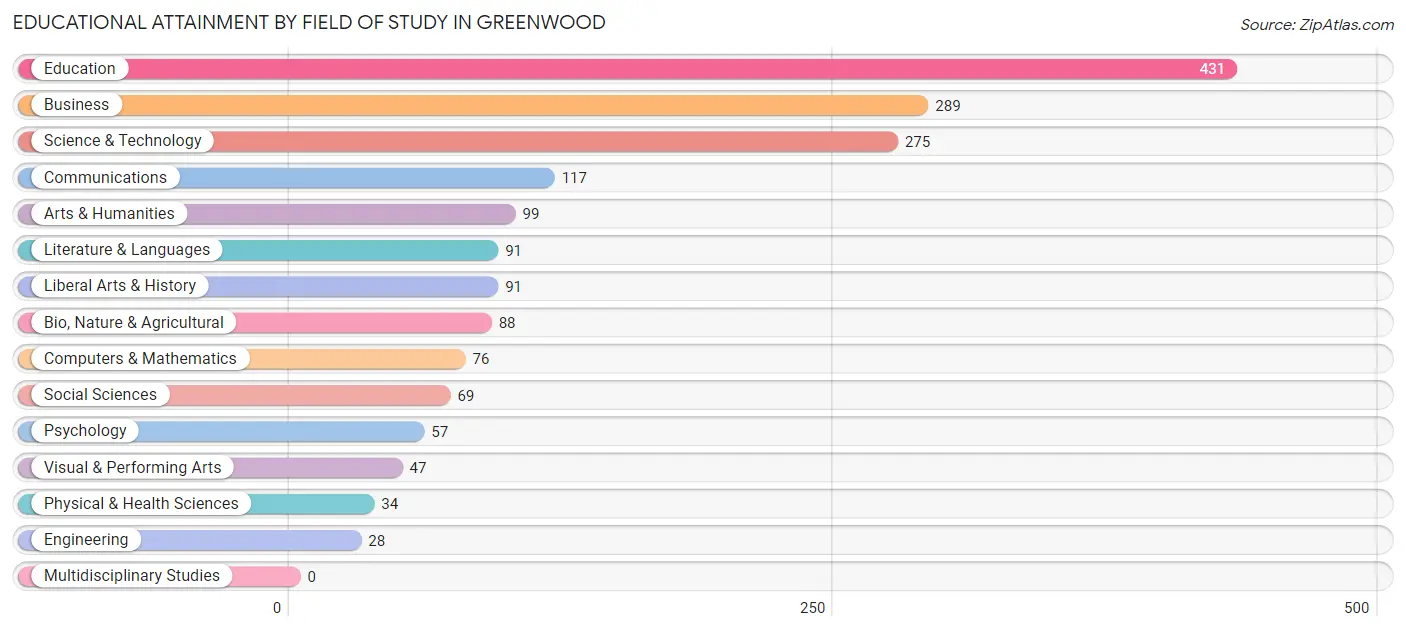
| Field of Study | # Graduates | % Graduates |
| Computers & Mathematics | 76 | 4.2% |
| Bio, Nature & Agricultural | 88 | 4.9% |
| Physical & Health Sciences | 34 | 1.9% |
| Psychology | 57 | 3.2% |
| Social Sciences | 69 | 3.8% |
| Engineering | 28 | 1.6% |
| Multidisciplinary Studies | 0 | 0.0% |
| Science & Technology | 275 | 15.3% |
| Business | 289 | 16.1% |
| Education | 431 | 24.0% |
| Literature & Languages | 91 | 5.1% |
| Liberal Arts & History | 91 | 5.1% |
| Visual & Performing Arts | 47 | 2.6% |
| Communications | 117 | 6.5% |
| Arts & Humanities | 99 | 5.5% |
| Total | 1,792 | 100.0% |
Transportation & Commute in Greenwood
Vehicle Availability by Sex in Greenwood
The most prevalent vehicle ownership categories in Greenwood are males with 2 vehicles (1,153, accounting for 49.0%) and females with 2 vehicles (931, making up 59.2%).
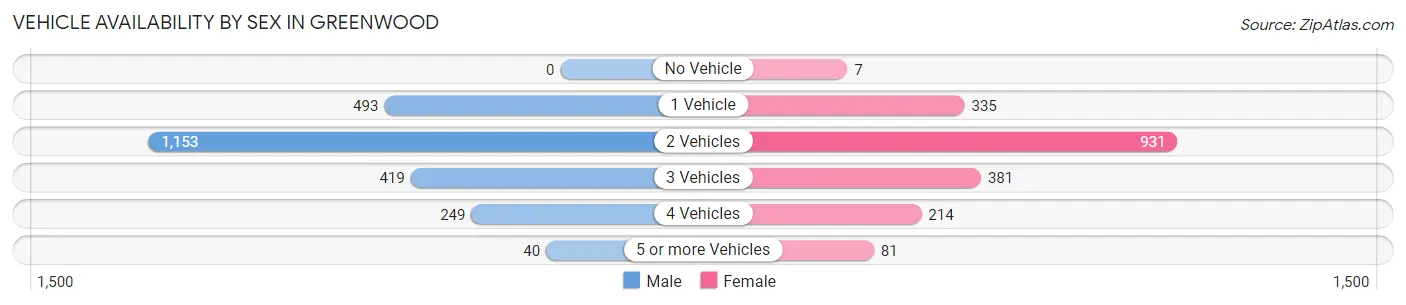
| Vehicles Available | Male | Female |
| No Vehicle | 0 (0.0%) | 7 (0.4%) |
| 1 Vehicle | 493 (20.9%) | 335 (17.2%) |
| 2 Vehicles | 1,153 (49.0%) | 931 (47.8%) |
| 3 Vehicles | 419 (17.8%) | 381 (19.6%) |
| 4 Vehicles | 249 (10.6%) | 214 (11.0%) |
| 5 or more Vehicles | 40 (1.7%) | 81 (4.2%) |
| Total | 2,354 (100.0%) | 1,949 (100.0%) |
Commute Time in Greenwood
The most frequently occuring commute durations in Greenwood are 30 to 34 minutes (1,147 commuters, 28.5%), 20 to 24 minutes (729 commuters, 18.1%), and 25 to 29 minutes (522 commuters, 13.0%).
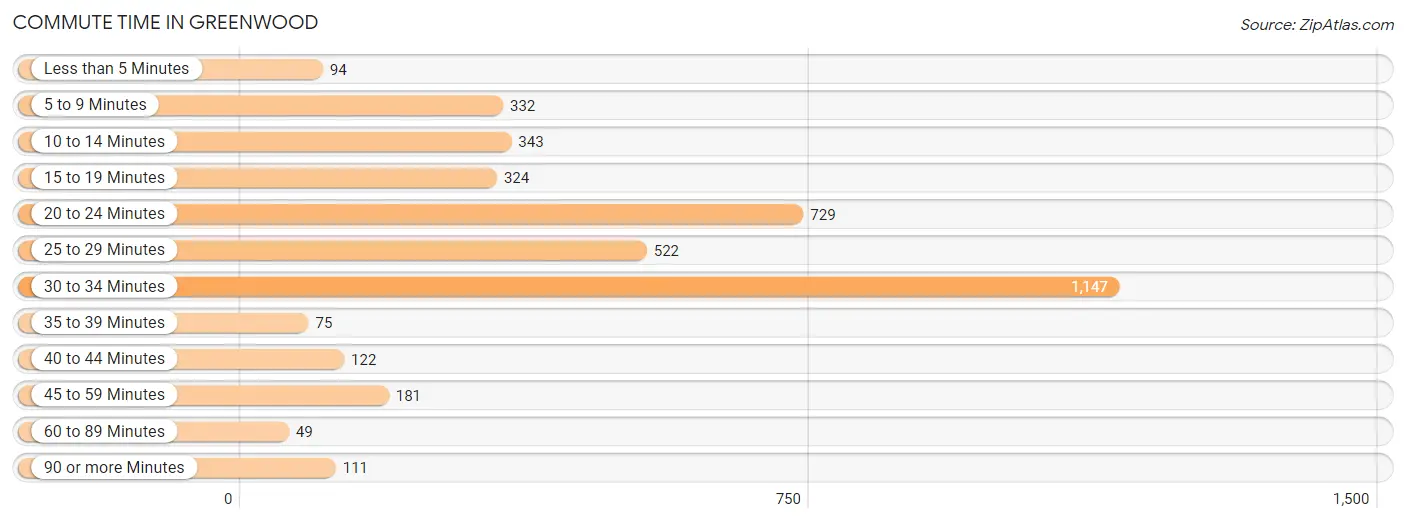
| Commute Time | # Commuters | % Commuters |
| Less than 5 Minutes | 94 | 2.3% |
| 5 to 9 Minutes | 332 | 8.2% |
| 10 to 14 Minutes | 343 | 8.5% |
| 15 to 19 Minutes | 324 | 8.0% |
| 20 to 24 Minutes | 729 | 18.1% |
| 25 to 29 Minutes | 522 | 13.0% |
| 30 to 34 Minutes | 1,147 | 28.5% |
| 35 to 39 Minutes | 75 | 1.9% |
| 40 to 44 Minutes | 122 | 3.0% |
| 45 to 59 Minutes | 181 | 4.5% |
| 60 to 89 Minutes | 49 | 1.2% |
| 90 or more Minutes | 111 | 2.8% |
Commute Time by Sex in Greenwood
The most common commute times in Greenwood are 30 to 34 minutes (592 commuters, 26.5%) for males and 30 to 34 minutes (555 commuters, 30.9%) for females.
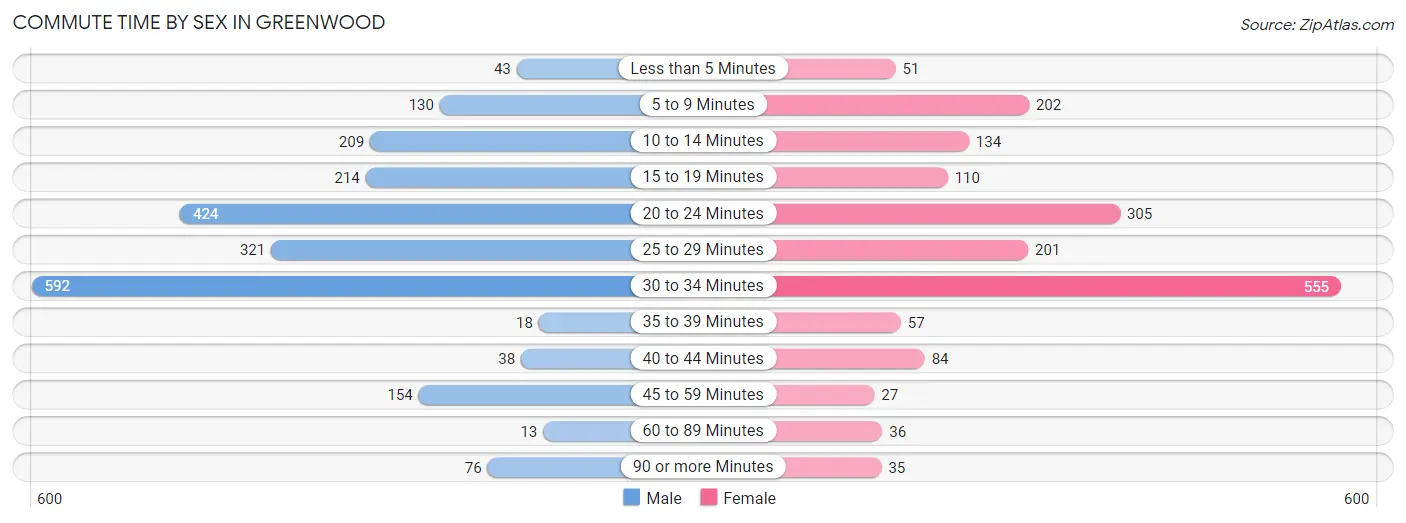
| Commute Time | Male | Female |
| Less than 5 Minutes | 43 (1.9%) | 51 (2.8%) |
| 5 to 9 Minutes | 130 (5.8%) | 202 (11.2%) |
| 10 to 14 Minutes | 209 (9.4%) | 134 (7.5%) |
| 15 to 19 Minutes | 214 (9.6%) | 110 (6.1%) |
| 20 to 24 Minutes | 424 (19.0%) | 305 (17.0%) |
| 25 to 29 Minutes | 321 (14.4%) | 201 (11.2%) |
| 30 to 34 Minutes | 592 (26.5%) | 555 (30.9%) |
| 35 to 39 Minutes | 18 (0.8%) | 57 (3.2%) |
| 40 to 44 Minutes | 38 (1.7%) | 84 (4.7%) |
| 45 to 59 Minutes | 154 (6.9%) | 27 (1.5%) |
| 60 to 89 Minutes | 13 (0.6%) | 36 (2.0%) |
| 90 or more Minutes | 76 (3.4%) | 35 (1.9%) |
Time of Departure to Work by Sex in Greenwood
The most frequent times of departure to work in Greenwood are 7:00 AM to 7:29 AM (694, 31.1%) for males and 7:00 AM to 7:29 AM (407, 22.7%) for females.
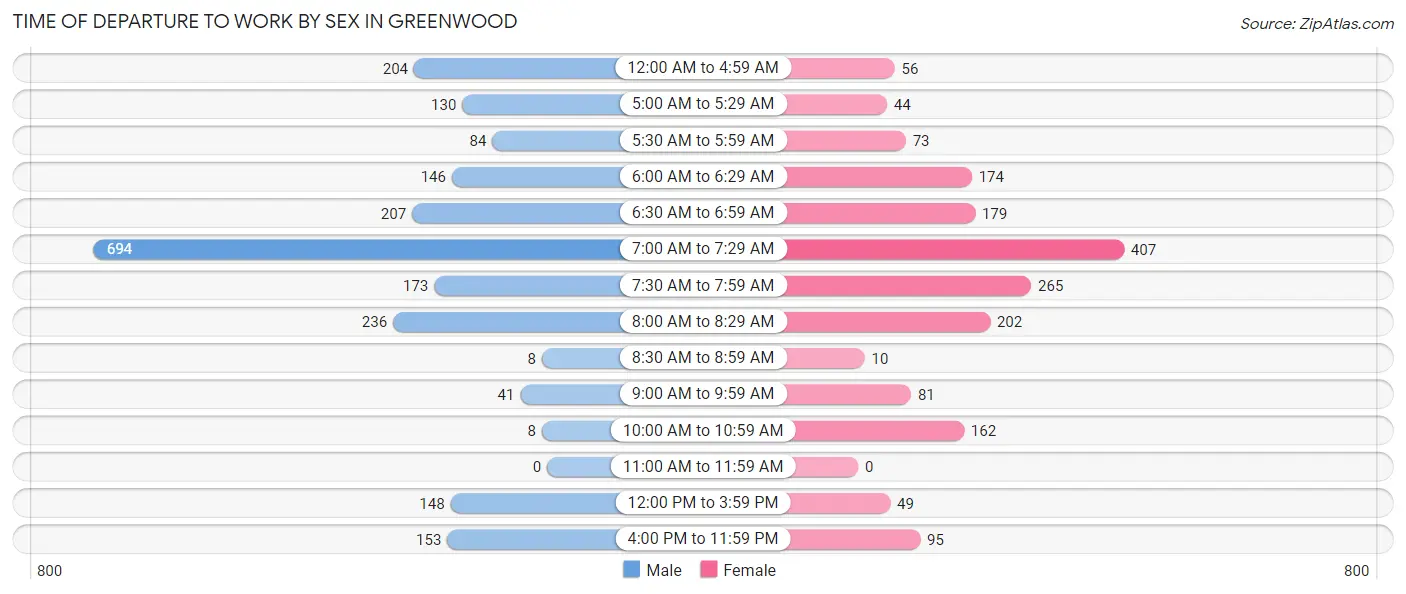
| Time of Departure | Male | Female |
| 12:00 AM to 4:59 AM | 204 (9.1%) | 56 (3.1%) |
| 5:00 AM to 5:29 AM | 130 (5.8%) | 44 (2.5%) |
| 5:30 AM to 5:59 AM | 84 (3.8%) | 73 (4.1%) |
| 6:00 AM to 6:29 AM | 146 (6.5%) | 174 (9.7%) |
| 6:30 AM to 6:59 AM | 207 (9.3%) | 179 (10.0%) |
| 7:00 AM to 7:29 AM | 694 (31.1%) | 407 (22.7%) |
| 7:30 AM to 7:59 AM | 173 (7.7%) | 265 (14.7%) |
| 8:00 AM to 8:29 AM | 236 (10.6%) | 202 (11.2%) |
| 8:30 AM to 8:59 AM | 8 (0.4%) | 10 (0.6%) |
| 9:00 AM to 9:59 AM | 41 (1.8%) | 81 (4.5%) |
| 10:00 AM to 10:59 AM | 8 (0.4%) | 162 (9.0%) |
| 11:00 AM to 11:59 AM | 0 (0.0%) | 0 (0.0%) |
| 12:00 PM to 3:59 PM | 148 (6.6%) | 49 (2.7%) |
| 4:00 PM to 11:59 PM | 153 (6.9%) | 95 (5.3%) |
| Total | 2,232 (100.0%) | 1,797 (100.0%) |
Housing Occupancy in Greenwood
Occupancy by Ownership in Greenwood
Of the total 3,953 dwellings in Greenwood, owner-occupied units account for 2,780 (70.3%), while renter-occupied units make up 1,173 (29.7%).
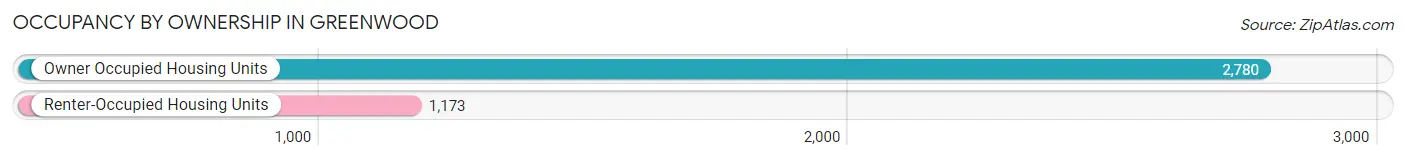
| Occupancy | # Housing Units | % Housing Units |
| Owner Occupied Housing Units | 2,780 | 70.3% |
| Renter-Occupied Housing Units | 1,173 | 29.7% |
| Total Occupied Housing Units | 3,953 | 100.0% |
Occupancy by Household Size in Greenwood
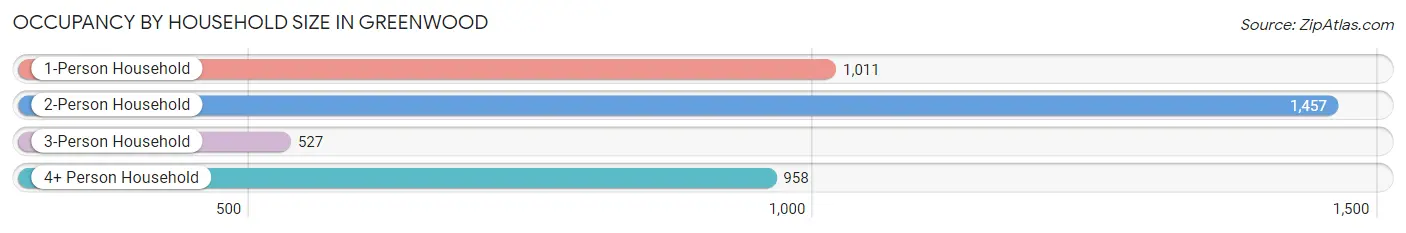
| Household Size | # Housing Units | % Housing Units |
| 1-Person Household | 1,011 | 25.6% |
| 2-Person Household | 1,457 | 36.9% |
| 3-Person Household | 527 | 13.3% |
| 4+ Person Household | 958 | 24.2% |
| Total Housing Units | 3,953 | 100.0% |
Occupancy by Ownership by Household Size in Greenwood
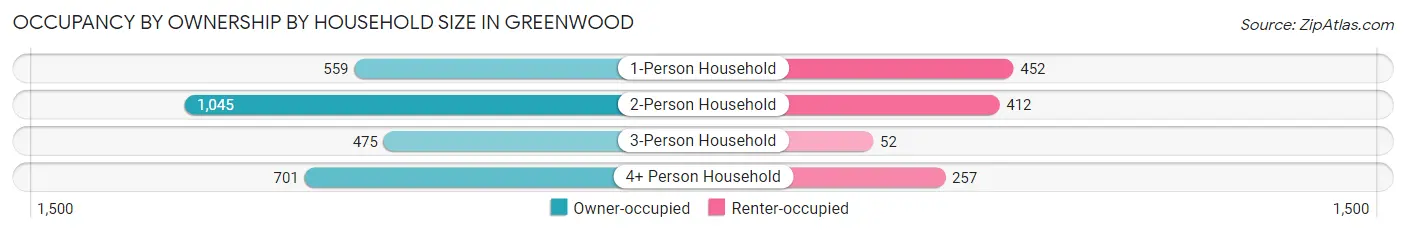
| Household Size | Owner-occupied | Renter-occupied |
| 1-Person Household | 559 (55.3%) | 452 (44.7%) |
| 2-Person Household | 1,045 (71.7%) | 412 (28.3%) |
| 3-Person Household | 475 (90.1%) | 52 (9.9%) |
| 4+ Person Household | 701 (73.2%) | 257 (26.8%) |
| Total Housing Units | 2,780 (70.3%) | 1,173 (29.7%) |
Occupancy by Educational Attainment in Greenwood
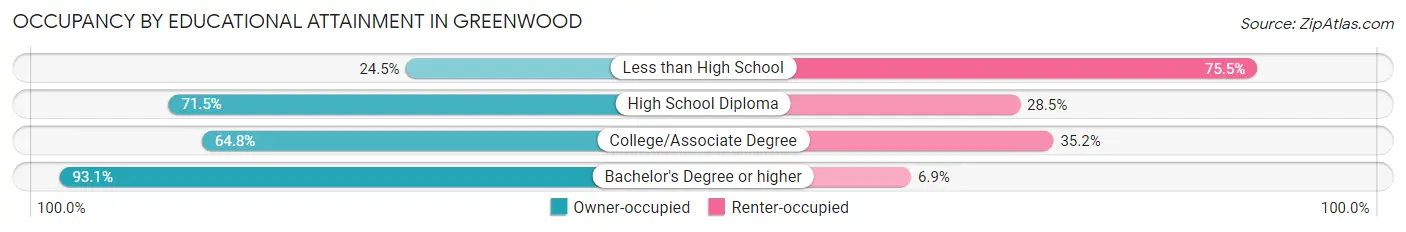
| Household Size | Owner-occupied | Renter-occupied |
| Less than High School | 84 (24.5%) | 259 (75.5%) |
| High School Diploma | 749 (71.5%) | 299 (28.5%) |
| College/Associate Degree | 1,005 (64.8%) | 545 (35.2%) |
| Bachelor's Degree or higher | 942 (93.1%) | 70 (6.9%) |
Occupancy by Age of Householder in Greenwood
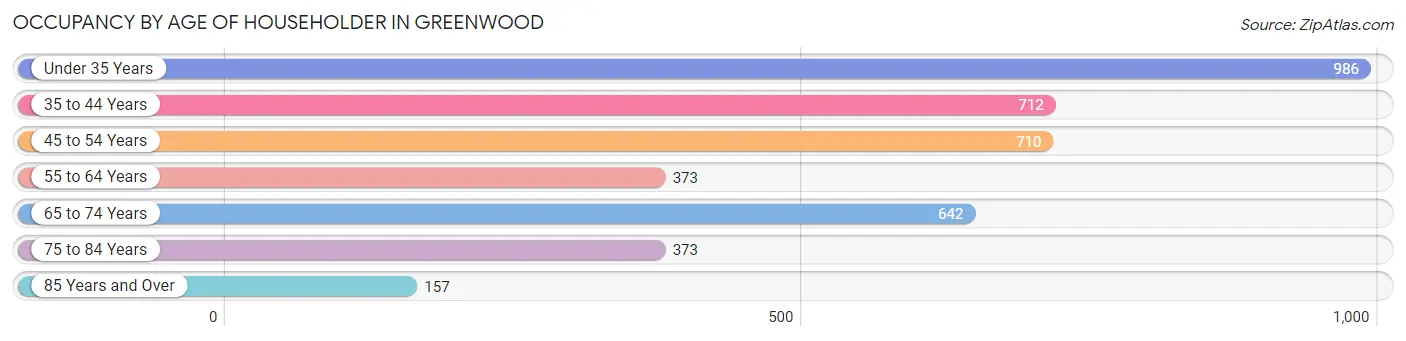
| Age Bracket | # Households | % Households |
| Under 35 Years | 986 | 24.9% |
| 35 to 44 Years | 712 | 18.0% |
| 45 to 54 Years | 710 | 18.0% |
| 55 to 64 Years | 373 | 9.4% |
| 65 to 74 Years | 642 | 16.2% |
| 75 to 84 Years | 373 | 9.4% |
| 85 Years and Over | 157 | 4.0% |
| Total | 3,953 | 100.0% |
Housing Finances in Greenwood
Median Income by Occupancy in Greenwood
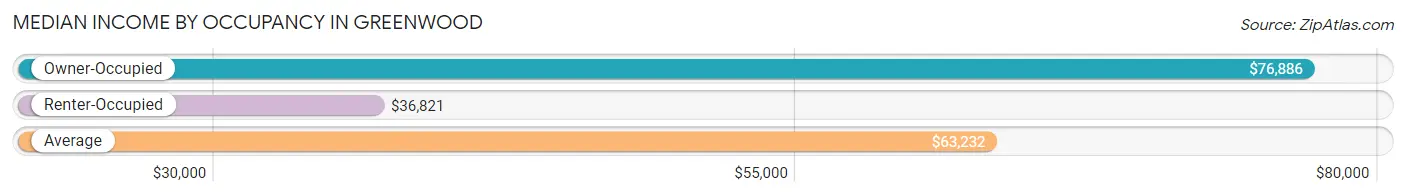
| Occupancy Type | # Households | Median Income |
| Owner-Occupied | 2,780 (70.3%) | $76,886 |
| Renter-Occupied | 1,173 (29.7%) | $36,821 |
| Average | 3,953 (100.0%) | $63,232 |
Occupancy by Householder Income Bracket in Greenwood
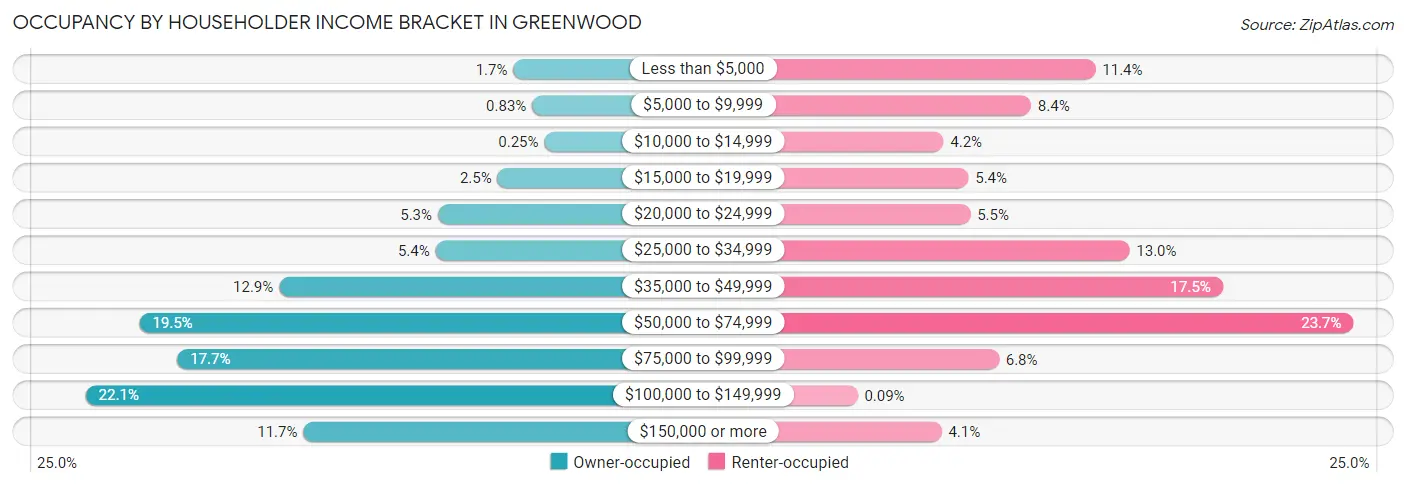
| Income Bracket | Owner-occupied | Renter-occupied |
| Less than $5,000 | 48 (1.7%) | 134 (11.4%) |
| $5,000 to $9,999 | 23 (0.8%) | 98 (8.4%) |
| $10,000 to $14,999 | 7 (0.3%) | 49 (4.2%) |
| $15,000 to $19,999 | 69 (2.5%) | 63 (5.4%) |
| $20,000 to $24,999 | 148 (5.3%) | 64 (5.5%) |
| $25,000 to $34,999 | 151 (5.4%) | 153 (13.0%) |
| $35,000 to $49,999 | 358 (12.9%) | 205 (17.5%) |
| $50,000 to $74,999 | 543 (19.5%) | 278 (23.7%) |
| $75,000 to $99,999 | 493 (17.7%) | 80 (6.8%) |
| $100,000 to $149,999 | 614 (22.1%) | 1 (0.1%) |
| $150,000 or more | 326 (11.7%) | 48 (4.1%) |
| Total | 2,780 (100.0%) | 1,173 (100.0%) |
Monthly Housing Cost Tiers in Greenwood
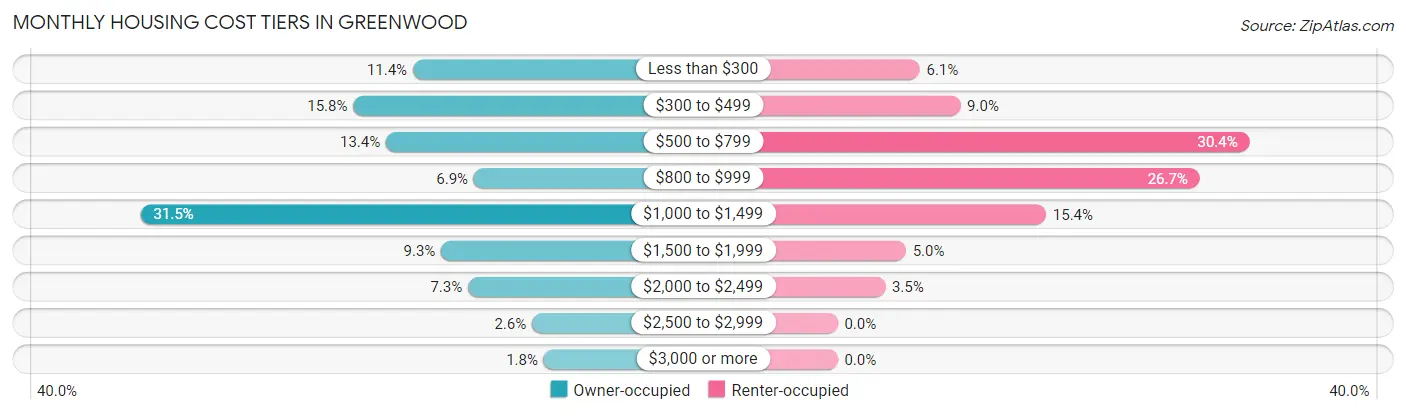
| Monthly Cost | Owner-occupied | Renter-occupied |
| Less than $300 | 317 (11.4%) | 71 (6.0%) |
| $300 to $499 | 439 (15.8%) | 106 (9.0%) |
| $500 to $799 | 372 (13.4%) | 356 (30.3%) |
| $800 to $999 | 192 (6.9%) | 313 (26.7%) |
| $1,000 to $1,499 | 875 (31.5%) | 180 (15.3%) |
| $1,500 to $1,999 | 259 (9.3%) | 59 (5.0%) |
| $2,000 to $2,499 | 204 (7.3%) | 41 (3.5%) |
| $2,500 to $2,999 | 73 (2.6%) | 0 (0.0%) |
| $3,000 or more | 49 (1.8%) | 0 (0.0%) |
| Total | 2,780 (100.0%) | 1,173 (100.0%) |
Physical Housing Characteristics in Greenwood
Housing Structures in Greenwood
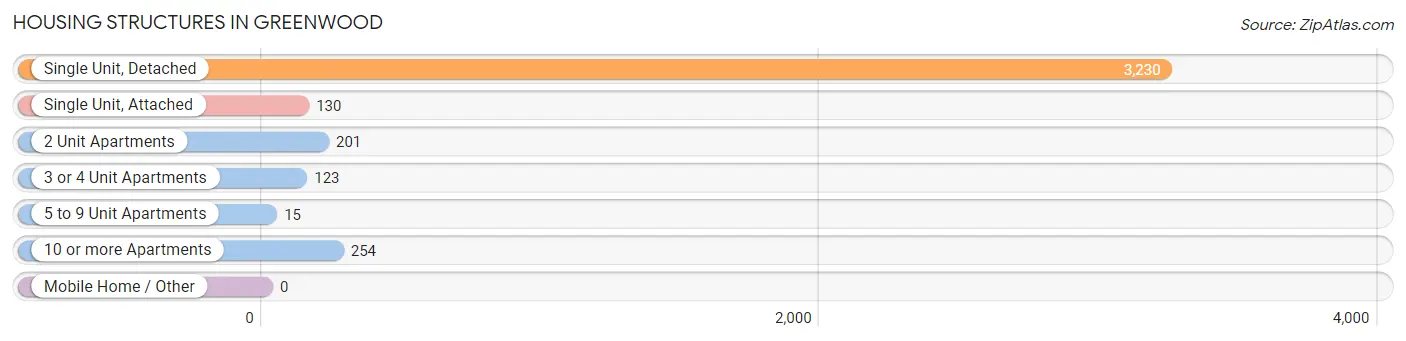
| Structure Type | # Housing Units | % Housing Units |
| Single Unit, Detached | 3,230 | 81.7% |
| Single Unit, Attached | 130 | 3.3% |
| 2 Unit Apartments | 201 | 5.1% |
| 3 or 4 Unit Apartments | 123 | 3.1% |
| 5 to 9 Unit Apartments | 15 | 0.4% |
| 10 or more Apartments | 254 | 6.4% |
| Mobile Home / Other | 0 | 0.0% |
| Total | 3,953 | 100.0% |
Housing Structures by Occupancy in Greenwood
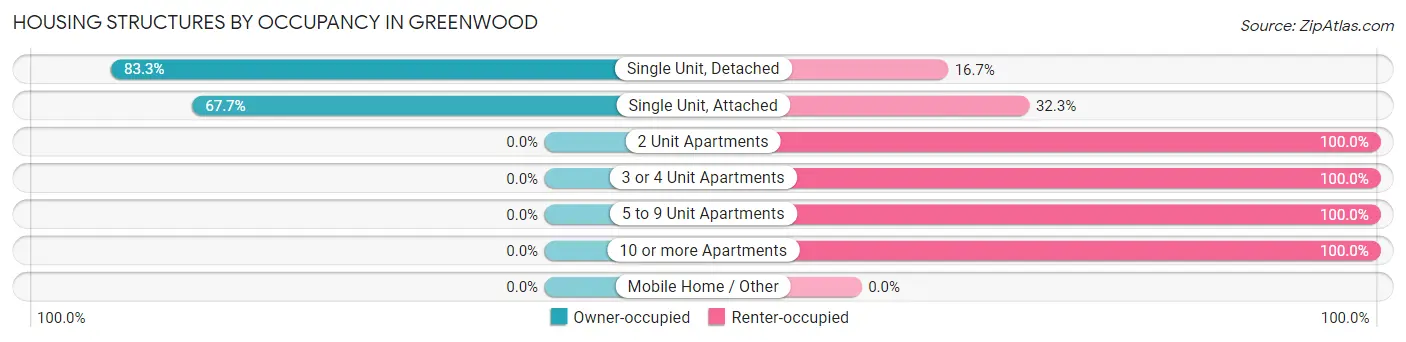
| Structure Type | Owner-occupied | Renter-occupied |
| Single Unit, Detached | 2,692 (83.3%) | 538 (16.7%) |
| Single Unit, Attached | 88 (67.7%) | 42 (32.3%) |
| 2 Unit Apartments | 0 (0.0%) | 201 (100.0%) |
| 3 or 4 Unit Apartments | 0 (0.0%) | 123 (100.0%) |
| 5 to 9 Unit Apartments | 0 (0.0%) | 15 (100.0%) |
| 10 or more Apartments | 0 (0.0%) | 254 (100.0%) |
| Mobile Home / Other | 0 (0.0%) | 0 (0.0%) |
| Total | 2,780 (70.3%) | 1,173 (29.7%) |
Housing Structures by Number of Rooms in Greenwood
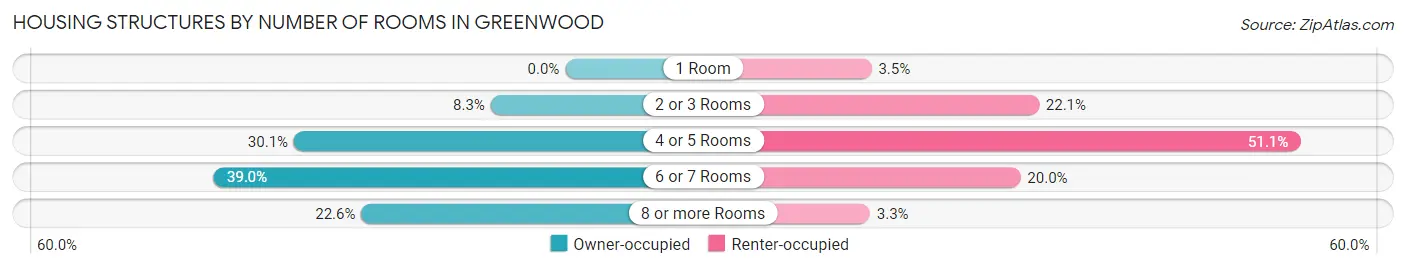
| Number of Rooms | Owner-occupied | Renter-occupied |
| 1 Room | 0 (0.0%) | 41 (3.5%) |
| 2 or 3 Rooms | 230 (8.3%) | 259 (22.1%) |
| 4 or 5 Rooms | 837 (30.1%) | 599 (51.1%) |
| 6 or 7 Rooms | 1,084 (39.0%) | 235 (20.0%) |
| 8 or more Rooms | 629 (22.6%) | 39 (3.3%) |
| Total | 2,780 (100.0%) | 1,173 (100.0%) |
Housing Structure by Heating Type in Greenwood
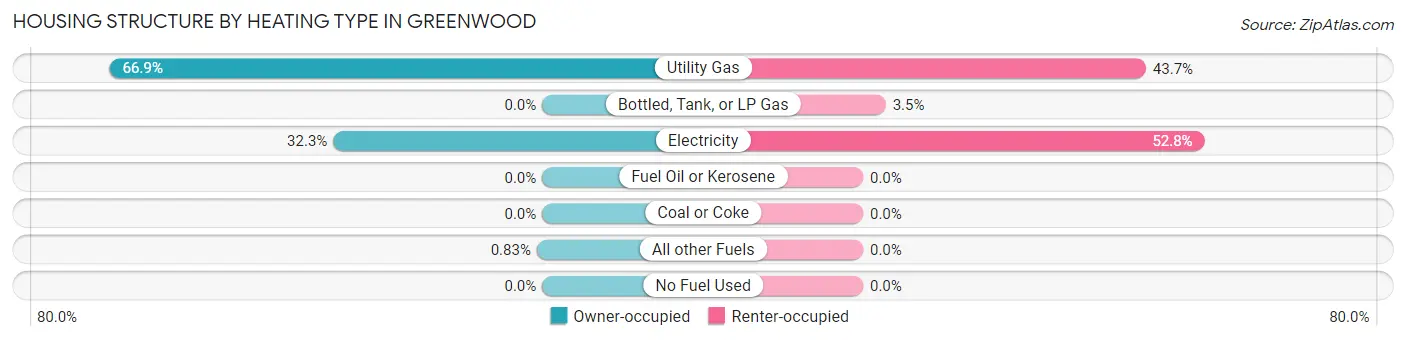
| Heating Type | Owner-occupied | Renter-occupied |
| Utility Gas | 1,859 (66.9%) | 513 (43.7%) |
| Bottled, Tank, or LP Gas | 0 (0.0%) | 41 (3.5%) |
| Electricity | 898 (32.3%) | 619 (52.8%) |
| Fuel Oil or Kerosene | 0 (0.0%) | 0 (0.0%) |
| Coal or Coke | 0 (0.0%) | 0 (0.0%) |
| All other Fuels | 23 (0.8%) | 0 (0.0%) |
| No Fuel Used | 0 (0.0%) | 0 (0.0%) |
| Total | 2,780 (100.0%) | 1,173 (100.0%) |
Household Vehicle Usage in Greenwood
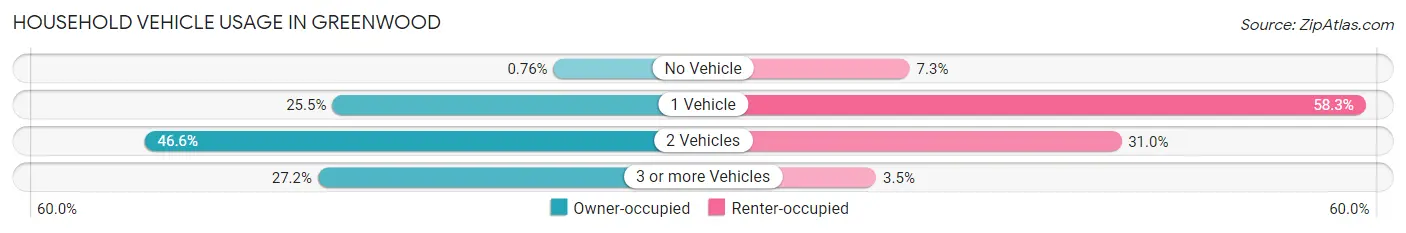
| Vehicles per Household | Owner-occupied | Renter-occupied |
| No Vehicle | 21 (0.8%) | 85 (7.2%) |
| 1 Vehicle | 710 (25.5%) | 684 (58.3%) |
| 2 Vehicles | 1,294 (46.6%) | 363 (30.9%) |
| 3 or more Vehicles | 755 (27.2%) | 41 (3.5%) |
| Total | 2,780 (100.0%) | 1,173 (100.0%) |
Real Estate & Mortgages in Greenwood
Real Estate and Mortgage Overview in Greenwood
| Characteristic | Without Mortgage | With Mortgage |
| Housing Units | 952 | 1,828 |
| Median Property Value | $146,100 | $173,500 |
| Median Household Income | $52,188 | $270 |
| Monthly Housing Costs | $385 | $49 |
| Real Estate Taxes | $832 | $118 |
Property Value by Mortgage Status in Greenwood
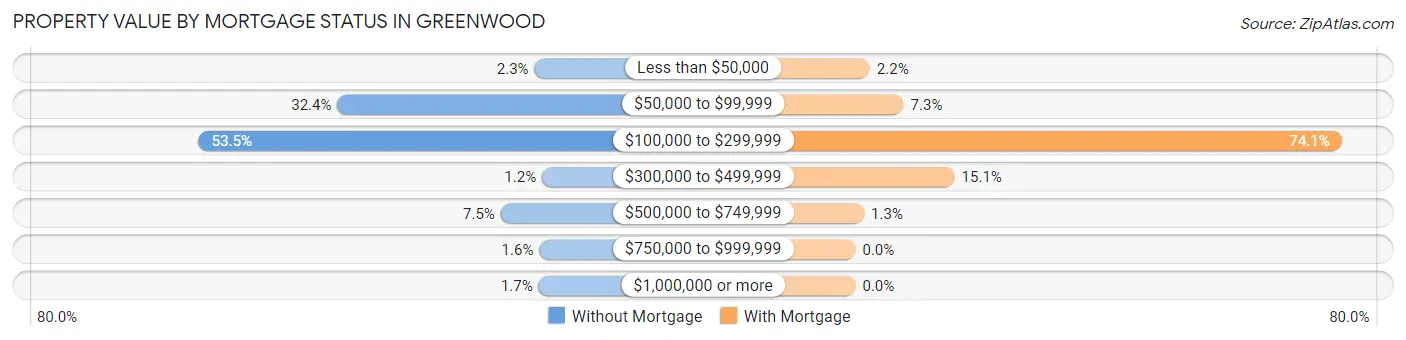
| Property Value | Without Mortgage | With Mortgage |
| Less than $50,000 | 22 (2.3%) | 40 (2.2%) |
| $50,000 to $99,999 | 308 (32.4%) | 134 (7.3%) |
| $100,000 to $299,999 | 509 (53.5%) | 1,354 (74.1%) |
| $300,000 to $499,999 | 11 (1.2%) | 276 (15.1%) |
| $500,000 to $749,999 | 71 (7.5%) | 24 (1.3%) |
| $750,000 to $999,999 | 15 (1.6%) | 0 (0.0%) |
| $1,000,000 or more | 16 (1.7%) | 0 (0.0%) |
| Total | 952 (100.0%) | 1,828 (100.0%) |
Household Income by Mortgage Status in Greenwood
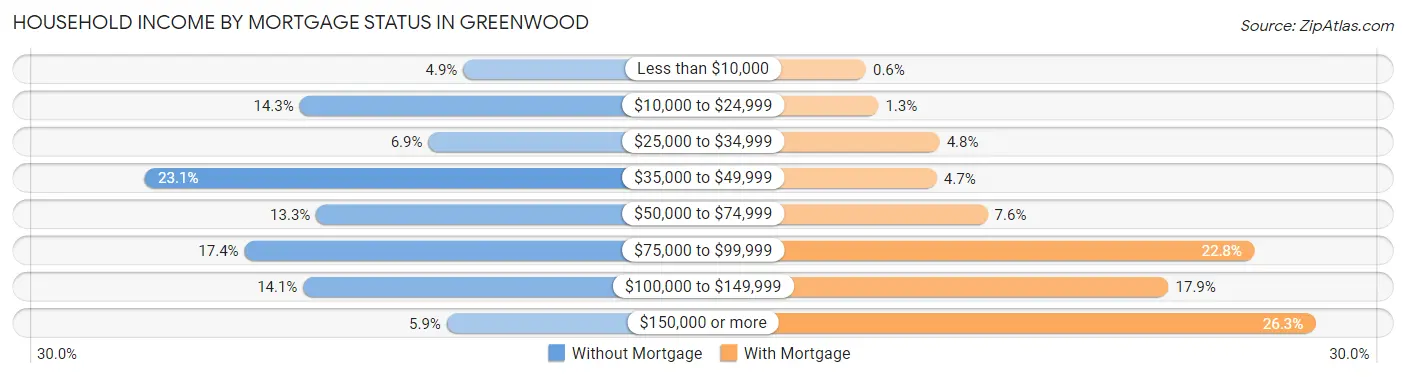
| Household Income | Without Mortgage | With Mortgage |
| Less than $10,000 | 47 (4.9%) | 11 (0.6%) |
| $10,000 to $24,999 | 136 (14.3%) | 24 (1.3%) |
| $25,000 to $34,999 | 66 (6.9%) | 88 (4.8%) |
| $35,000 to $49,999 | 220 (23.1%) | 85 (4.6%) |
| $50,000 to $74,999 | 127 (13.3%) | 138 (7.5%) |
| $75,000 to $99,999 | 166 (17.4%) | 416 (22.8%) |
| $100,000 to $149,999 | 134 (14.1%) | 327 (17.9%) |
| $150,000 or more | 56 (5.9%) | 480 (26.3%) |
| Total | 952 (100.0%) | 1,828 (100.0%) |
Property Value to Household Income Ratio in Greenwood
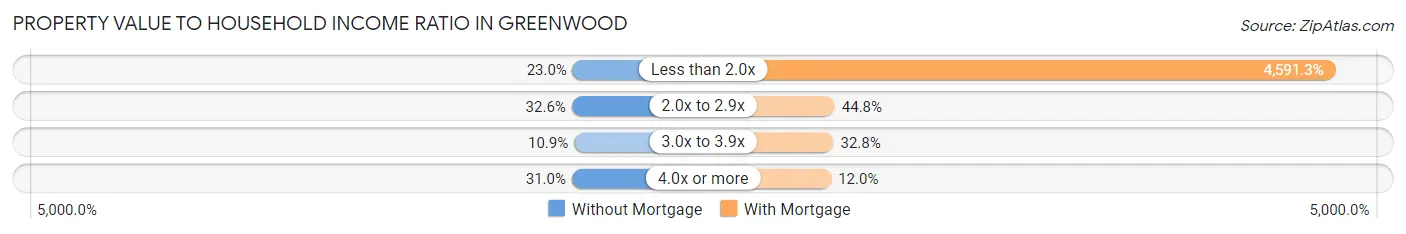
| Value-to-Income Ratio | Without Mortgage | With Mortgage |
| Less than 2.0x | 219 (23.0%) | 83,929 (4,591.3%) |
| 2.0x to 2.9x | 310 (32.6%) | 818 (44.8%) |
| 3.0x to 3.9x | 104 (10.9%) | 600 (32.8%) |
| 4.0x or more | 295 (31.0%) | 220 (12.0%) |
| Total | 952 (100.0%) | 1,828 (100.0%) |
Real Estate Taxes by Mortgage Status in Greenwood
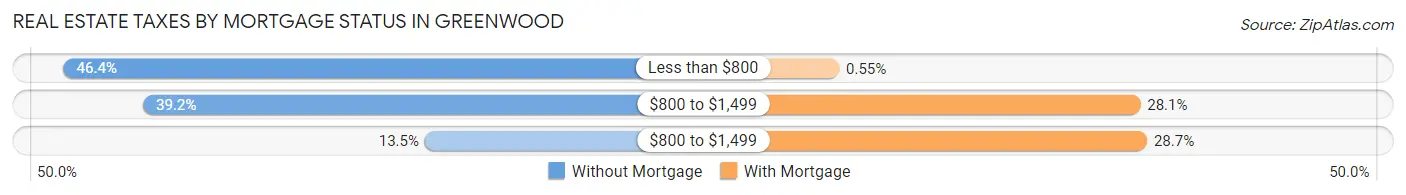
| Property Taxes | Without Mortgage | With Mortgage |
| Less than $800 | 442 (46.4%) | 10 (0.5%) |
| $800 to $1,499 | 373 (39.2%) | 513 (28.1%) |
| $800 to $1,499 | 128 (13.5%) | 524 (28.7%) |
| Total | 952 (100.0%) | 1,828 (100.0%) |
Health & Disability in Greenwood
Health Insurance Coverage by Age in Greenwood
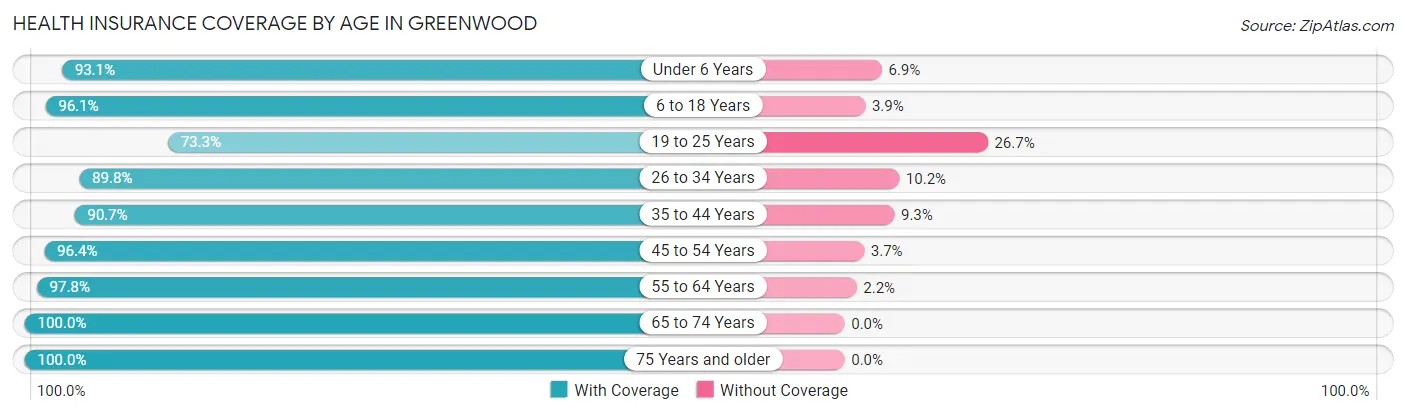
| Age Bracket | With Coverage | Without Coverage |
| Under 6 Years | 738 (93.1%) | 55 (6.9%) |
| 6 to 18 Years | 1,695 (96.1%) | 68 (3.9%) |
| 19 to 25 Years | 475 (73.3%) | 173 (26.7%) |
| 26 to 34 Years | 1,112 (89.8%) | 126 (10.2%) |
| 35 to 44 Years | 1,115 (90.7%) | 114 (9.3%) |
| 45 to 54 Years | 1,216 (96.4%) | 46 (3.6%) |
| 55 to 64 Years | 654 (97.8%) | 15 (2.2%) |
| 65 to 74 Years | 1,017 (100.0%) | 0 (0.0%) |
| 75 Years and older | 713 (100.0%) | 0 (0.0%) |
| Total | 8,735 (93.6%) | 597 (6.4%) |
Health Insurance Coverage by Citizenship Status in Greenwood
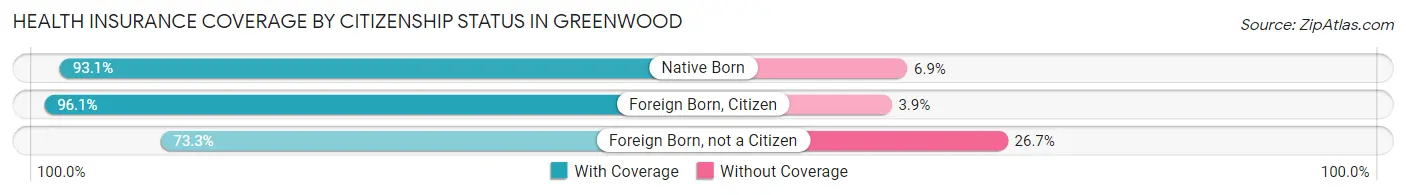
| Citizenship Status | With Coverage | Without Coverage |
| Native Born | 738 (93.1%) | 55 (6.9%) |
| Foreign Born, Citizen | 1,695 (96.1%) | 68 (3.9%) |
| Foreign Born, not a Citizen | 475 (73.3%) | 173 (26.7%) |
Health Insurance Coverage by Household Income in Greenwood
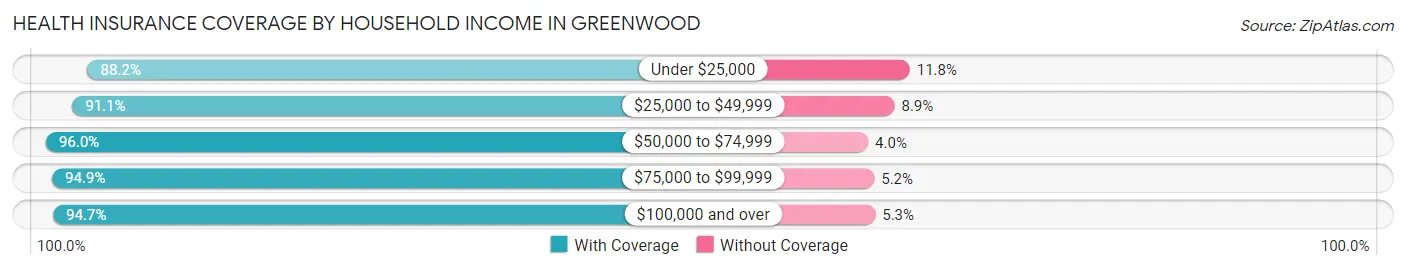
| Household Income | With Coverage | Without Coverage |
| Under $25,000 | 837 (88.2%) | 112 (11.8%) |
| $25,000 to $49,999 | 1,690 (91.1%) | 166 (8.9%) |
| $50,000 to $74,999 | 1,920 (96.0%) | 80 (4.0%) |
| $75,000 to $99,999 | 1,419 (94.9%) | 77 (5.1%) |
| $100,000 and over | 2,869 (94.7%) | 162 (5.3%) |
Public vs Private Health Insurance Coverage by Age in Greenwood
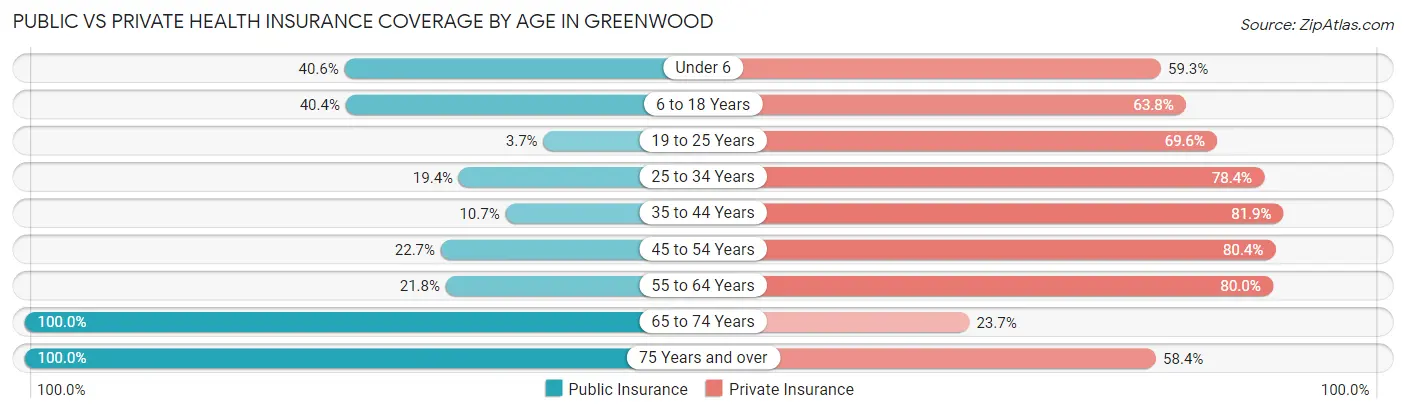
| Age Bracket | Public Insurance | Private Insurance |
| Under 6 | 322 (40.6%) | 470 (59.3%) |
| 6 to 18 Years | 712 (40.4%) | 1,125 (63.8%) |
| 19 to 25 Years | 24 (3.7%) | 451 (69.6%) |
| 25 to 34 Years | 240 (19.4%) | 970 (78.3%) |
| 35 to 44 Years | 132 (10.7%) | 1,007 (81.9%) |
| 45 to 54 Years | 287 (22.7%) | 1,015 (80.4%) |
| 55 to 64 Years | 146 (21.8%) | 535 (80.0%) |
| 65 to 74 Years | 1,017 (100.0%) | 241 (23.7%) |
| 75 Years and over | 713 (100.0%) | 416 (58.4%) |
| Total | 3,593 (38.5%) | 6,230 (66.8%) |
Disability Status by Sex by Age in Greenwood
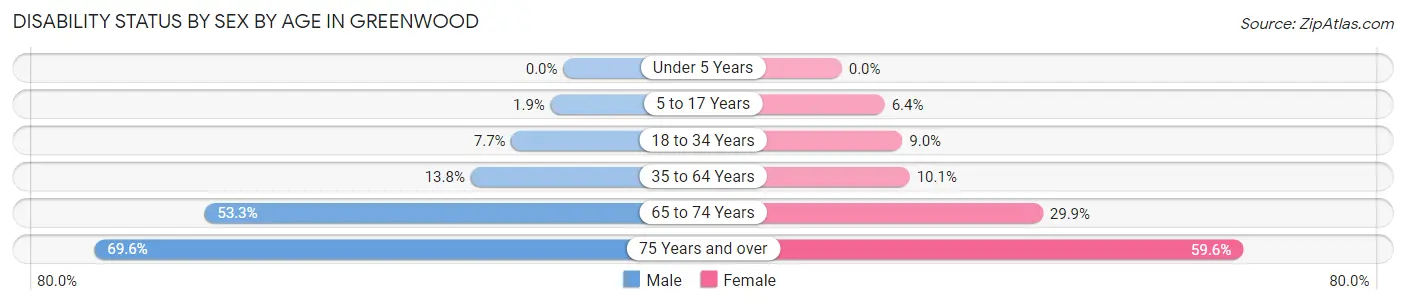
| Age Bracket | Male | Female |
| Under 5 Years | 0 (0.0%) | 0 (0.0%) |
| 5 to 17 Years | 17 (1.9%) | 58 (6.4%) |
| 18 to 34 Years | 80 (7.7%) | 88 (9.0%) |
| 35 to 64 Years | 211 (13.8%) | 164 (10.1%) |
| 65 to 74 Years | 210 (53.3%) | 186 (29.9%) |
| 75 Years and over | 188 (69.6%) | 264 (59.6%) |
Disability Class by Sex by Age in Greenwood
Disability Class: Hearing Difficulty
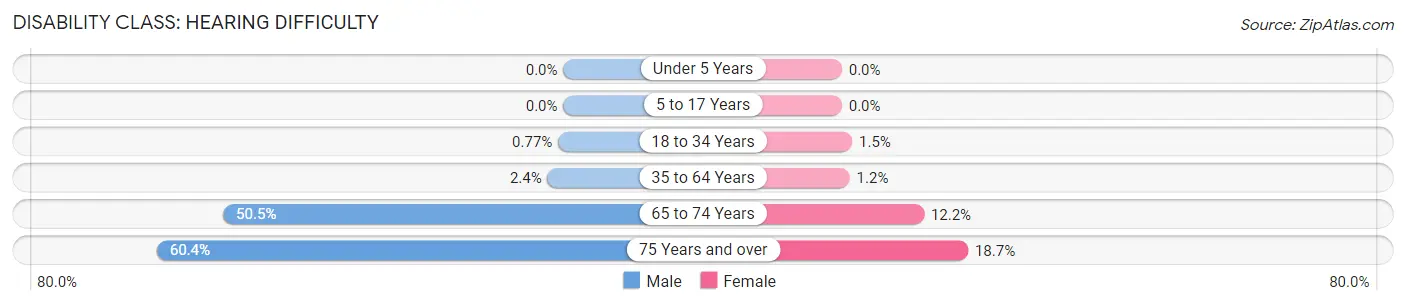
| Age Bracket | Male | Female |
| Under 5 Years | 0 (0.0%) | 0 (0.0%) |
| 5 to 17 Years | 0 (0.0%) | 0 (0.0%) |
| 18 to 34 Years | 8 (0.8%) | 15 (1.5%) |
| 35 to 64 Years | 36 (2.4%) | 19 (1.2%) |
| 65 to 74 Years | 199 (50.5%) | 76 (12.2%) |
| 75 Years and over | 163 (60.4%) | 83 (18.7%) |
Disability Class: Vision Difficulty
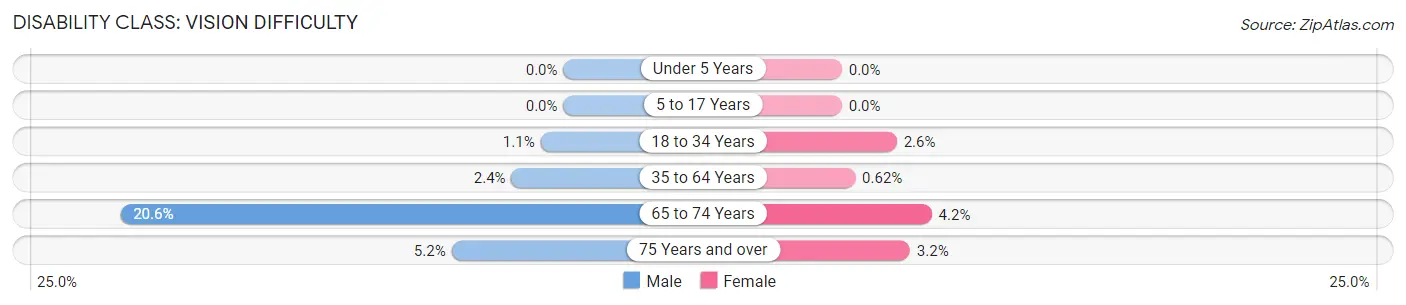
| Age Bracket | Male | Female |
| Under 5 Years | 0 (0.0%) | 0 (0.0%) |
| 5 to 17 Years | 0 (0.0%) | 0 (0.0%) |
| 18 to 34 Years | 11 (1.1%) | 25 (2.5%) |
| 35 to 64 Years | 37 (2.4%) | 10 (0.6%) |
| 65 to 74 Years | 81 (20.6%) | 26 (4.2%) |
| 75 Years and over | 14 (5.2%) | 14 (3.2%) |
Disability Class: Cognitive Difficulty
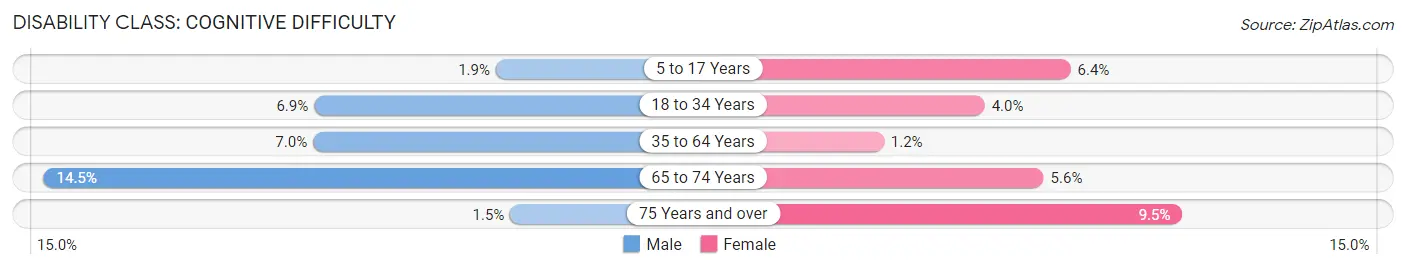
| Age Bracket | Male | Female |
| 5 to 17 Years | 17 (1.9%) | 58 (6.4%) |
| 18 to 34 Years | 72 (6.9%) | 39 (4.0%) |
| 35 to 64 Years | 107 (7.0%) | 19 (1.2%) |
| 65 to 74 Years | 57 (14.5%) | 35 (5.6%) |
| 75 Years and over | 4 (1.5%) | 42 (9.5%) |
Disability Class: Ambulatory Difficulty
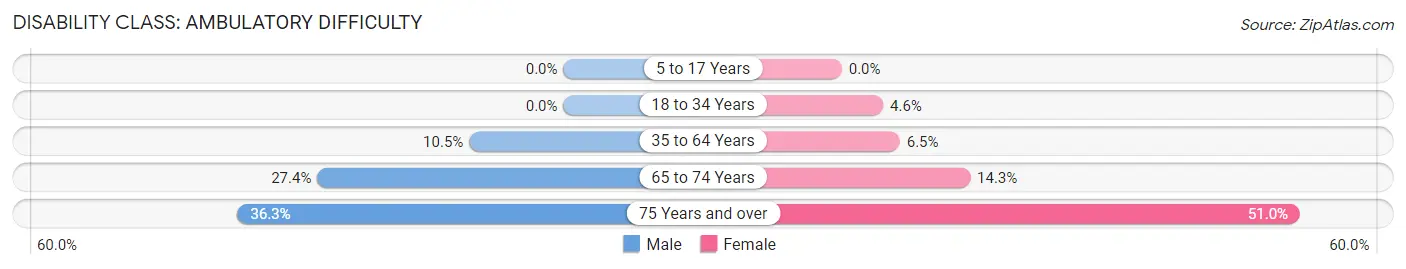
| Age Bracket | Male | Female |
| 5 to 17 Years | 0 (0.0%) | 0 (0.0%) |
| 18 to 34 Years | 0 (0.0%) | 45 (4.6%) |
| 35 to 64 Years | 161 (10.5%) | 105 (6.5%) |
| 65 to 74 Years | 108 (27.4%) | 89 (14.3%) |
| 75 Years and over | 98 (36.3%) | 226 (51.0%) |
Disability Class: Self-Care Difficulty
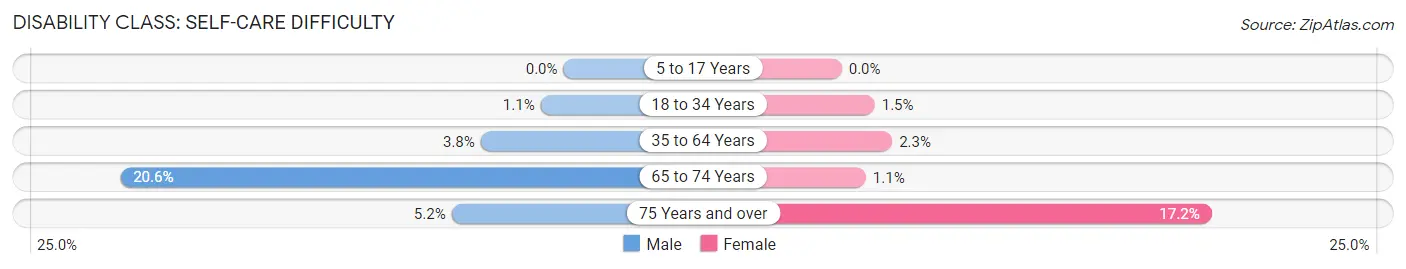
| Age Bracket | Male | Female |
| 5 to 17 Years | 0 (0.0%) | 0 (0.0%) |
| 18 to 34 Years | 11 (1.1%) | 15 (1.5%) |
| 35 to 64 Years | 59 (3.8%) | 38 (2.3%) |
| 65 to 74 Years | 81 (20.6%) | 7 (1.1%) |
| 75 Years and over | 14 (5.2%) | 76 (17.2%) |
Technology Access in Greenwood
Computing Device Access in Greenwood
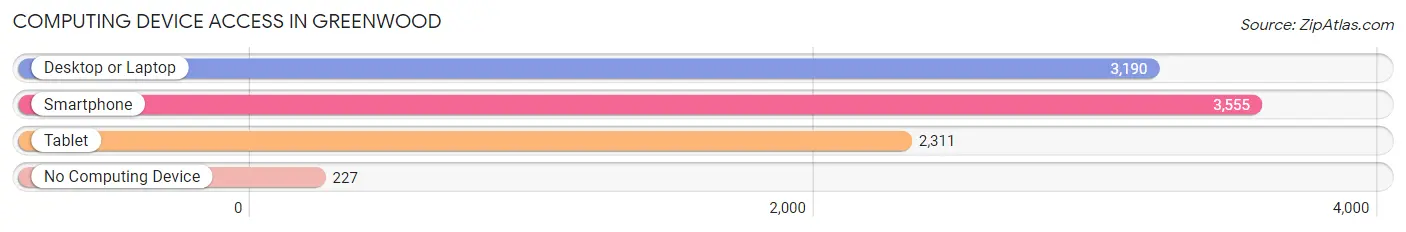
| Device Type | # Households | % Households |
| Desktop or Laptop | 3,190 | 80.7% |
| Smartphone | 3,555 | 89.9% |
| Tablet | 2,311 | 58.5% |
| No Computing Device | 227 | 5.7% |
| Total | 3,953 | 100.0% |
Internet Access in Greenwood
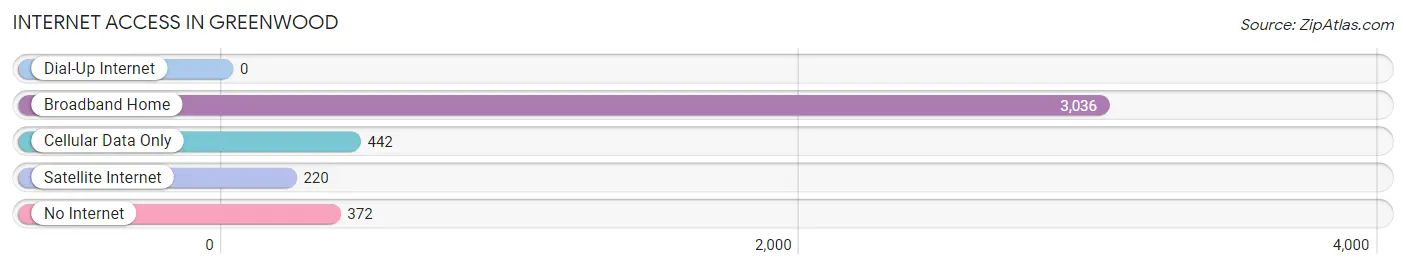
| Internet Type | # Households | % Households |
| Dial-Up Internet | 0 | 0.0% |
| Broadband Home | 3,036 | 76.8% |
| Cellular Data Only | 442 | 11.2% |
| Satellite Internet | 220 | 5.6% |
| No Internet | 372 | 9.4% |
| Total | 3,953 | 100.0% |
Greenwood Summary
Greenwood, Arkansas is a city located in Sebastian County, Arkansas, United States. It is the county seat of Sebastian County and is part of the Fort Smith metropolitan area. As of the 2010 census, the population of Greenwood was 8,952.
History
Greenwood was founded in 1851 by William A. Greenwood, a settler from Tennessee. The city was incorporated in 1887 and was named after its founder. Greenwood was a major stop on the Butterfield Overland Mail route, which ran from St. Louis to San Francisco. The city was also a major stop on the St. Louis-San Francisco Railway, which ran through the city until the 1950s.
Geography
Greenwood is located in the Arkansas River Valley in western Arkansas. It is situated at the intersection of U.S. Routes 71 and 64, approximately 10 miles south of Fort Smith. The city has a total area of 8.3 square miles, all of which is land.
Economy
Greenwood is a major economic center for the region. The city is home to several major employers, including the Greenwood Public Schools, the Greenwood Police Department, and the Greenwood Fire Department. The city is also home to several manufacturing companies, including the Greenwood Manufacturing Company, which produces automotive parts, and the Greenwood Plastics Company, which produces plastic products.
Demographics
As of the 2010 census, there were 8,952 people, 3,541 households, and 2,521 families residing in the city. The population density was 1,076.3 people per square mile. The racial makeup of the city was 79.2% White, 15.2% African American, 0.5% Native American, 0.7% Asian, 0.1% Pacific Islander, 1.7% from other races, and 2.7% from two or more races. Hispanic or Latino of any race were 4.2% of the population.
The median income for a household in the city was $37,945, and the median income for a family was $45,945. The per capita income for the city was $19,945. About 11.2% of families and 14.2% of the population were below the poverty line, including 19.2% of those under age 18 and 10.2% of those age 65 or over.
Conclusion
Greenwood, Arkansas is a city located in Sebastian County, Arkansas, United States. It is the county seat of Sebastian County and is part of the Fort Smith metropolitan area. As of the 2010 census, the population of Greenwood was 8,952. The city was founded in 1851 by William A. Greenwood and was incorporated in 1887. Greenwood is a major economic center for the region, with several major employers and manufacturing companies. As of the 2010 census, the population of Greenwood was 8,952, with a median household income of $37,945 and a median family income of $45,945.
Common Questions
What is Per Capita Income in Greenwood?
Per Capita income in Greenwood is $30,011.
What is the Median Family Income in Greenwood?
Median Family Income in Greenwood is $73,047.
What is the Median Household income in Greenwood?
Median Household Income in Greenwood is $63,232.
What is Income or Wage Gap in Greenwood?
Income or Wage Gap in Greenwood is 17.6%.
Women in Greenwood earn 82.4 cents for every dollar earned by a man.
What is Inequality or Gini Index in Greenwood?
Inequality or Gini Index in Greenwood is 0.39.
What is the Total Population of Greenwood?
Total Population of Greenwood is 9,544.
What is the Total Male Population of Greenwood?
Total Male Population of Greenwood is 4,584.
What is the Total Female Population of Greenwood?
Total Female Population of Greenwood is 4,960.
What is the Ratio of Males per 100 Females in Greenwood?
There are 92.42 Males per 100 Females in Greenwood.
What is the Ratio of Females per 100 Males in Greenwood?
There are 108.20 Females per 100 Males in Greenwood.
What is the Median Population Age in Greenwood?
Median Population Age in Greenwood is 37.1 Years.
What is the Average Family Size in Greenwood
Average Family Size in Greenwood is 2.8 People.
What is the Average Household Size in Greenwood
Average Household Size in Greenwood is 2.4 People.
How Large is the Labor Force in Greenwood?
There are 4,638 People in the Labor Forcein in Greenwood.
What is the Percentage of People in the Labor Force in Greenwood?
62.1% of People are in the Labor Force in Greenwood.
What is the Unemployment Rate in Greenwood?
Unemployment Rate in Greenwood is 3.3%.