Piney, AR Map & Demographics
Piney Map
Piney Overview
$21,061
PER CAPITA INCOME
$38,684
AVG FAMILY INCOME
$45,000
AVG HOUSEHOLD INCOME
34.9%
WAGE / INCOME GAP [ % ]
65.1¢/ $1
WAGE / INCOME GAP [ $ ]
$8,717
FAMILY INCOME DEFICIT
0.41
INEQUALITY / GINI INDEX
4,563
TOTAL POPULATION
2,222
MALE POPULATION
2,341
FEMALE POPULATION
94.92
MALES / 100 FEMALES
105.36
FEMALES / 100 MALES
33.6
MEDIAN AGE
3.2
AVG FAMILY SIZE
2.4
AVG HOUSEHOLD SIZE
2,214
LABOR FORCE [ PEOPLE ]
67.1%
PERCENT IN LABOR FORCE
5.9%
UNEMPLOYMENT RATE
Income in Piney
Income Overview in Piney
Per Capita Income in Piney is $21,061, while median incomes of families and households are $38,684 and $45,000 respectively.
| Characteristic | Number | Measure |
| Per Capita Income | 4,563 | $21,061 |
| Median Family Income | 1,006 | $38,684 |
| Mean Family Income | 1,006 | $53,096 |
| Median Household Income | 1,892 | $45,000 |
| Mean Household Income | 1,892 | $49,749 |
| Income Deficit | 1,006 | $8,717 |
| Wage / Income Gap (%) | 4,563 | 34.93% |
| Wage / Income Gap ($) | 4,563 | 65.07¢ per $1 |
| Gini / Inequality Index | 4,563 | 0.41 |
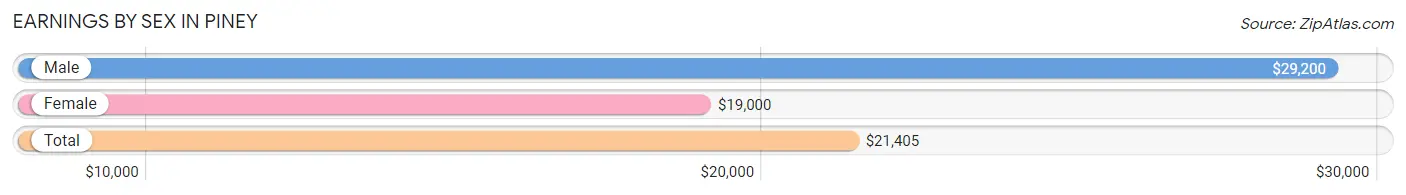
Earnings by Sex in Piney
Average Earnings in Piney are $21,405, $29,200 for men and $19,000 for women, a difference of 34.9%.
| Sex | Number | Average Earnings |
| Male | 1,176 (49.6%) | $29,200 |
| Female | 1,196 (50.4%) | $19,000 |
| Total | 2,372 (100.0%) | $21,405 |
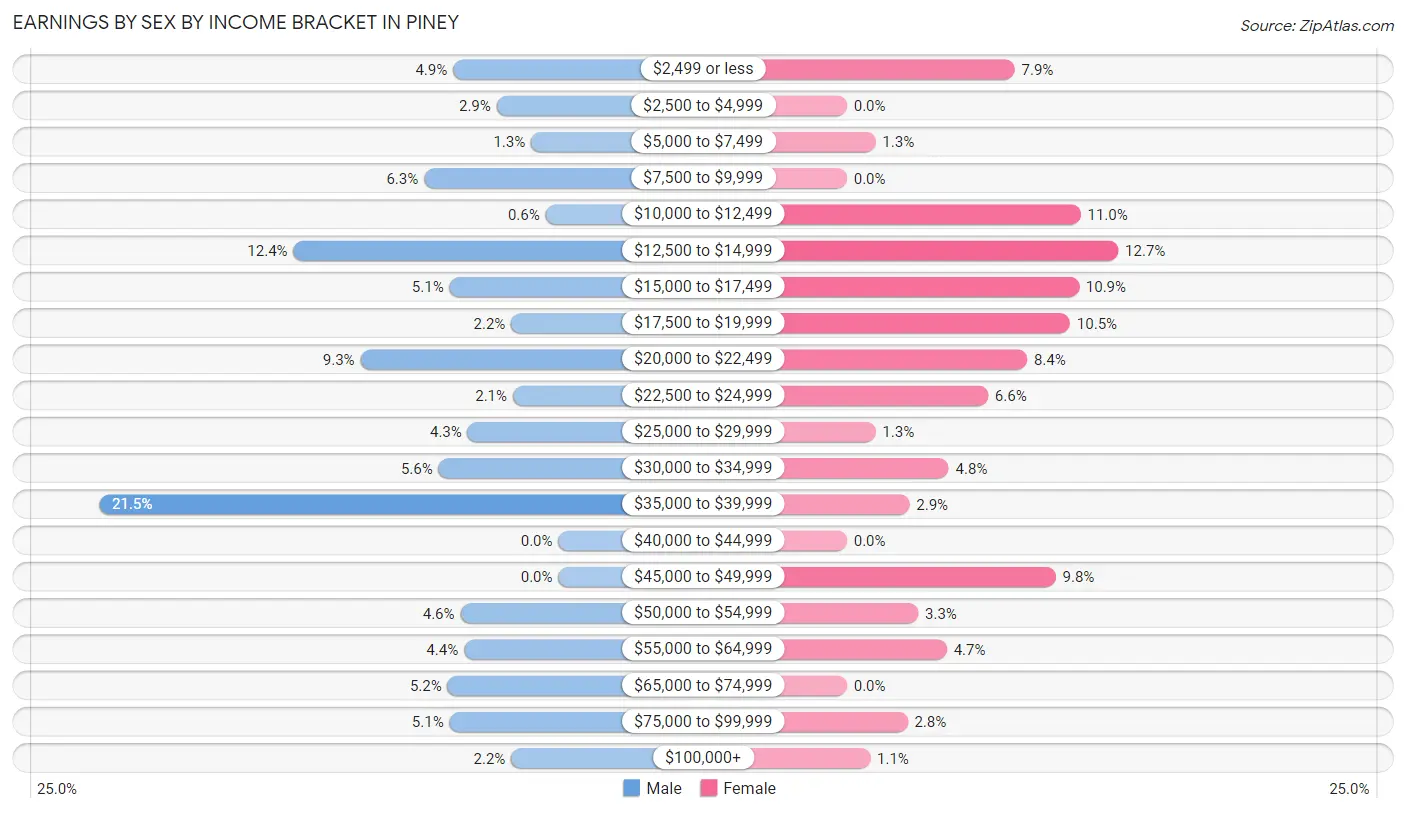
Earnings by Sex by Income Bracket in Piney
The most common earnings brackets in Piney are $35,000 to $39,999 for men (253 | 21.5%) and $12,500 to $14,999 for women (152 | 12.7%).
| Income | Male | Female |
| $2,499 or less | 58 (4.9%) | 94 (7.9%) |
| $2,500 to $4,999 | 34 (2.9%) | 0 (0.0%) |
| $5,000 to $7,499 | 15 (1.3%) | 16 (1.3%) |
| $7,500 to $9,999 | 74 (6.3%) | 0 (0.0%) |
| $10,000 to $12,499 | 7 (0.6%) | 131 (11.0%) |
| $12,500 to $14,999 | 146 (12.4%) | 152 (12.7%) |
| $15,000 to $17,499 | 60 (5.1%) | 130 (10.9%) |
| $17,500 to $19,999 | 26 (2.2%) | 125 (10.4%) |
| $20,000 to $22,499 | 109 (9.3%) | 101 (8.4%) |
| $22,500 to $24,999 | 25 (2.1%) | 79 (6.6%) |
| $25,000 to $29,999 | 50 (4.3%) | 16 (1.3%) |
| $30,000 to $34,999 | 66 (5.6%) | 57 (4.8%) |
| $35,000 to $39,999 | 253 (21.5%) | 35 (2.9%) |
| $40,000 to $44,999 | 0 (0.0%) | 0 (0.0%) |
| $45,000 to $49,999 | 0 (0.0%) | 117 (9.8%) |
| $50,000 to $54,999 | 54 (4.6%) | 40 (3.3%) |
| $55,000 to $64,999 | 52 (4.4%) | 56 (4.7%) |
| $65,000 to $74,999 | 61 (5.2%) | 0 (0.0%) |
| $75,000 to $99,999 | 60 (5.1%) | 34 (2.8%) |
| $100,000+ | 26 (2.2%) | 13 (1.1%) |
| Total | 1,176 (100.0%) | 1,196 (100.0%) |
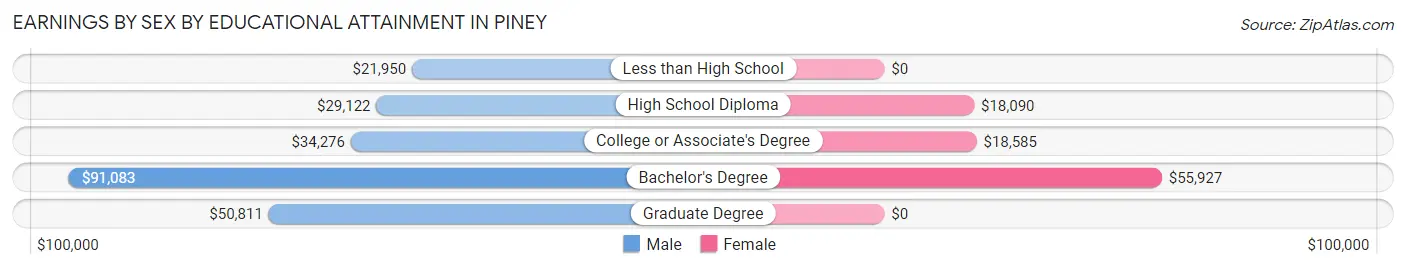
Earnings by Sex by Educational Attainment in Piney
Average earnings in Piney are $33,333 for men and $19,110 for women, a difference of 42.7%. Men with an educational attainment of bachelor's degree enjoy the highest average annual earnings of $91,083, while those with less than high school education earn the least with $21,950. Women with an educational attainment of bachelor's degree earn the most with the average annual earnings of $55,927, while those with high school diploma education have the smallest earnings of $18,090.
| Educational Attainment | Male Income | Female Income |
| Less than High School | $21,950 | $0 |
| High School Diploma | $29,122 | $18,090 |
| College or Associate's Degree | $34,276 | $18,585 |
| Bachelor's Degree | $91,083 | $55,927 |
| Graduate Degree | $50,811 | $0 |
| Total | $33,333 | $19,110 |
Family Income in Piney
Family Income Brackets in Piney
According to the Piney family income data, there are 227 families falling into the $15,000 to $24,999 income range, which is the most common income bracket and makes up 22.6% of all families.
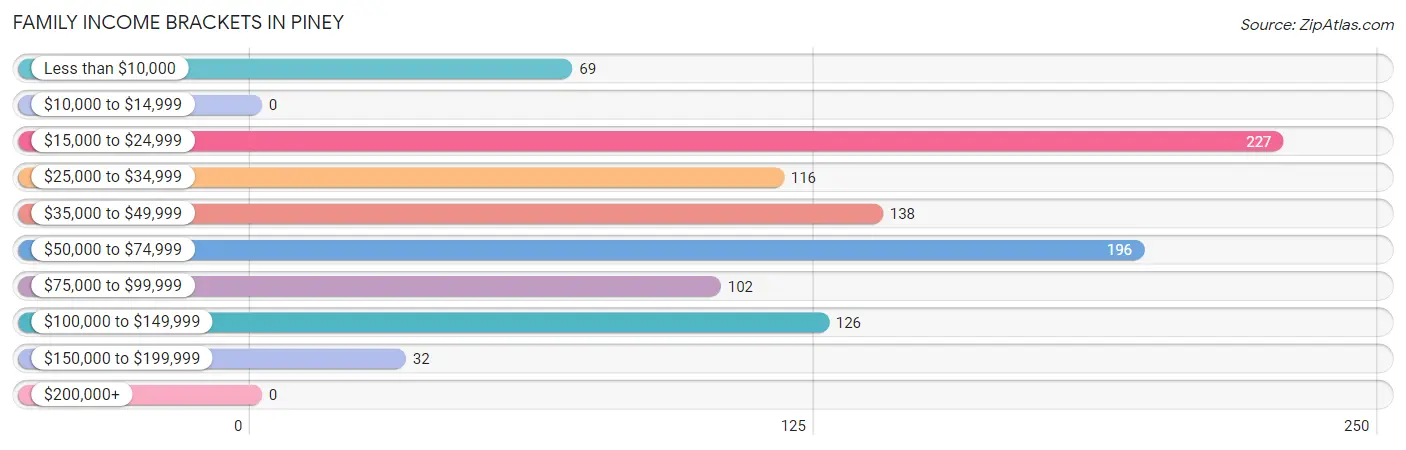
| Income Bracket | # Families | % Families |
| Less than $10,000 | 69 | 6.9% |
| $10,000 to $14,999 | 0 | 0.0% |
| $15,000 to $24,999 | 227 | 22.6% |
| $25,000 to $34,999 | 116 | 11.5% |
| $35,000 to $49,999 | 138 | 13.7% |
| $50,000 to $74,999 | 196 | 19.5% |
| $75,000 to $99,999 | 102 | 10.1% |
| $100,000 to $149,999 | 126 | 12.5% |
| $150,000 to $199,999 | 32 | 3.2% |
| $200,000+ | 0 | 0.0% |
Family Income by Famaliy Size in Piney
4-person families (126 | 12.5%) account for the highest median family income in Piney with $103,538 per family, while 4-person families (126 | 12.5%) have the highest median income of $25,884 per family member.
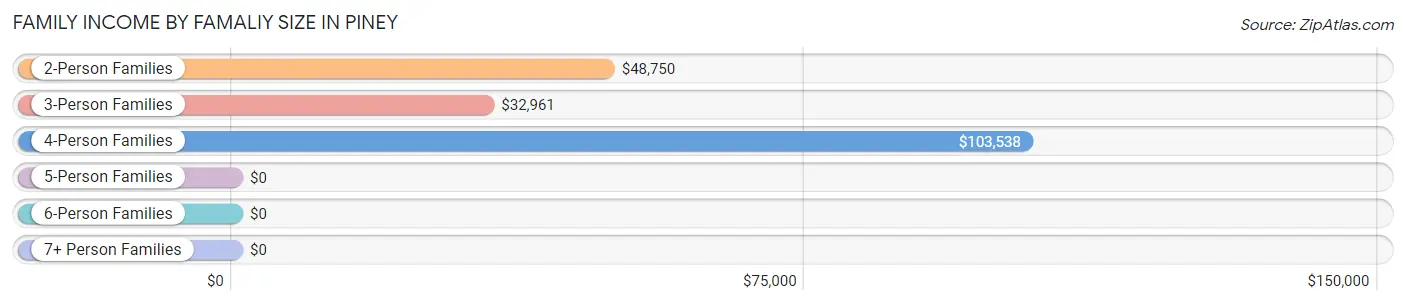
| Income Bracket | # Families | Median Income |
| 2-Person Families | 418 (41.5%) | $48,750 |
| 3-Person Families | 259 (25.8%) | $32,961 |
| 4-Person Families | 126 (12.5%) | $103,538 |
| 5-Person Families | 114 (11.3%) | $0 |
| 6-Person Families | 0 (0.0%) | $0 |
| 7+ Person Families | 89 (8.8%) | $0 |
| Total | 1,006 (100.0%) | $38,684 |
Family Income by Number of Earners in Piney
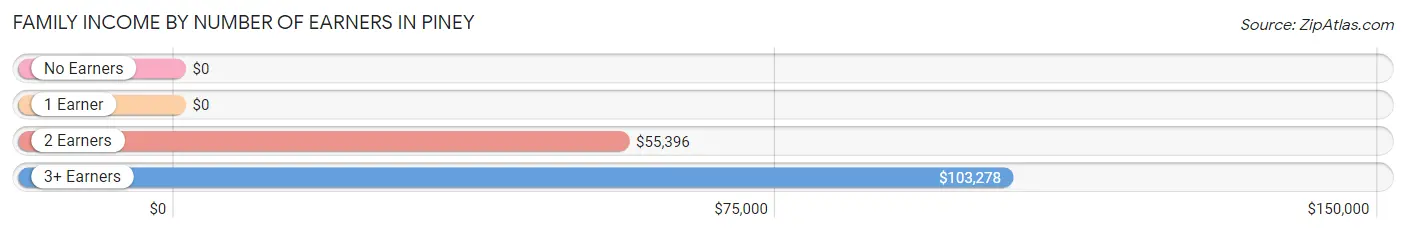
| Number of Earners | # Families | Median Income |
| No Earners | 97 (9.6%) | $0 |
| 1 Earner | 429 (42.6%) | $0 |
| 2 Earners | 397 (39.5%) | $55,396 |
| 3+ Earners | 83 (8.3%) | $103,278 |
| Total | 1,006 (100.0%) | $38,684 |
Household Income in Piney
Household Income Brackets in Piney
With 471 households falling in the category, the $50,000 to $74,999 income range is the most frequent in Piney, accounting for 24.9% of all households. In contrast, only 13 households (0.7%) fall into the $200,000+ income bracket, making it the least populous group.
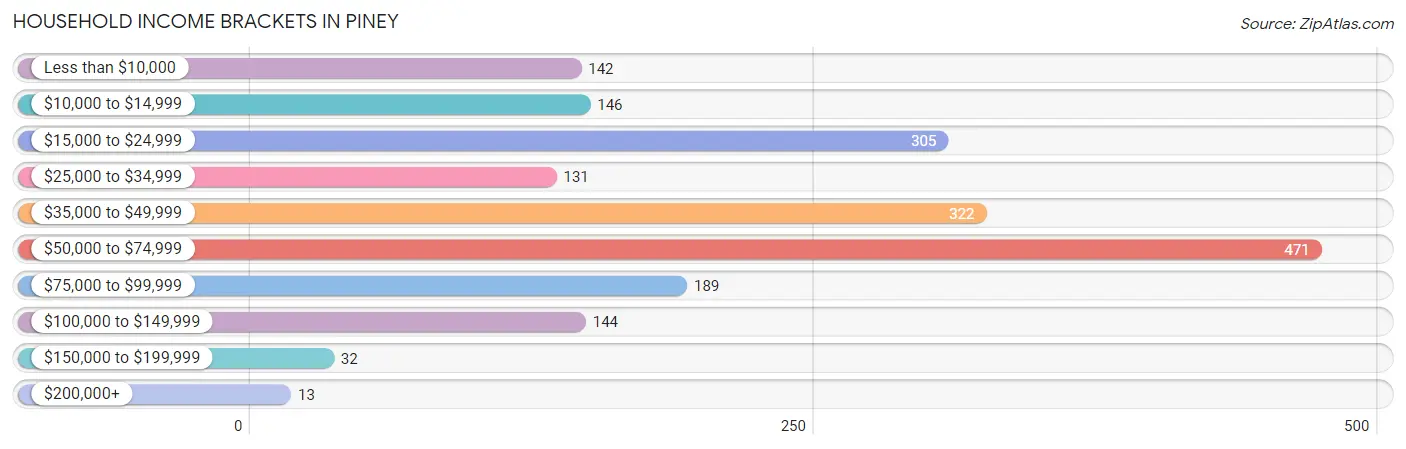
| Income Bracket | # Households | % Households |
| Less than $10,000 | 142 | 7.5% |
| $10,000 to $14,999 | 146 | 7.7% |
| $15,000 to $24,999 | 305 | 16.1% |
| $25,000 to $34,999 | 131 | 6.9% |
| $35,000 to $49,999 | 322 | 17.0% |
| $50,000 to $74,999 | 471 | 24.9% |
| $75,000 to $99,999 | 189 | 10.0% |
| $100,000 to $149,999 | 144 | 7.6% |
| $150,000 to $199,999 | 32 | 1.7% |
| $200,000+ | 13 | 0.7% |
Household Income by Householder Age in Piney
The median household income in Piney is $45,000, with the highest median household income of $52,202 found in the 45 to 64 years age bracket for the primary householder. A total of 683 households (36.1%) fall into this category. Meanwhile, the 15 to 24 years age bracket for the primary householder has the lowest median household income of $0, with 10 households (0.5%) in this group.
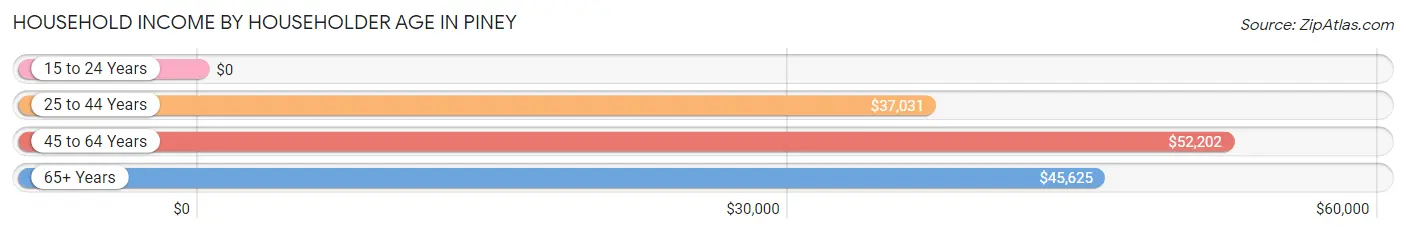
| Income Bracket | # Households | Median Income |
| 15 to 24 Years | 10 (0.5%) | $0 |
| 25 to 44 Years | 768 (40.6%) | $37,031 |
| 45 to 64 Years | 683 (36.1%) | $52,202 |
| 65+ Years | 431 (22.8%) | $45,625 |
| Total | 1,892 (100.0%) | $45,000 |
Poverty in Piney
Income Below Poverty by Sex and Age in Piney
With 35.0% poverty level for males and 41.4% for females among the residents of Piney, under 5 year old males and 25 to 34 year old females are the most vulnerable to poverty, with 122 males (76.7%) and 391 females (71.9%) in their respective age groups living below the poverty level.

| Age Bracket | Male | Female |
| Under 5 Years | 122 (76.7%) | 89 (61.4%) |
| 5 Years | 70 (69.3%) | 0 (0.0%) |
| 6 to 11 Years | 122 (55.7%) | 155 (68.6%) |
| 12 to 14 Years | 70 (40.7%) | 76 (55.9%) |
| 15 Years | 0 (0.0%) | 0 (0.0%) |
| 16 and 17 Years | 0 (0.0%) | 0 (0.0%) |
| 18 to 24 Years | 60 (40.5%) | 12 (11.1%) |
| 25 to 34 Years | 37 (12.4%) | 391 (71.9%) |
| 35 to 44 Years | 64 (21.6%) | 72 (28.9%) |
| 45 to 54 Years | 150 (52.1%) | 55 (24.8%) |
| 55 to 64 Years | 27 (10.6%) | 32 (17.8%) |
| 65 to 74 Years | 45 (32.9%) | 53 (17.1%) |
| 75 Years and over | 0 (0.0%) | 29 (25.0%) |
| Total | 767 (35.0%) | 964 (41.4%) |
Income Above Poverty by Sex and Age in Piney
According to the poverty statistics in Piney, males aged 15 years and females aged 5 years are the age groups that are most secure financially, with 100.0% of males and 100.0% of females in these age groups living above the poverty line.
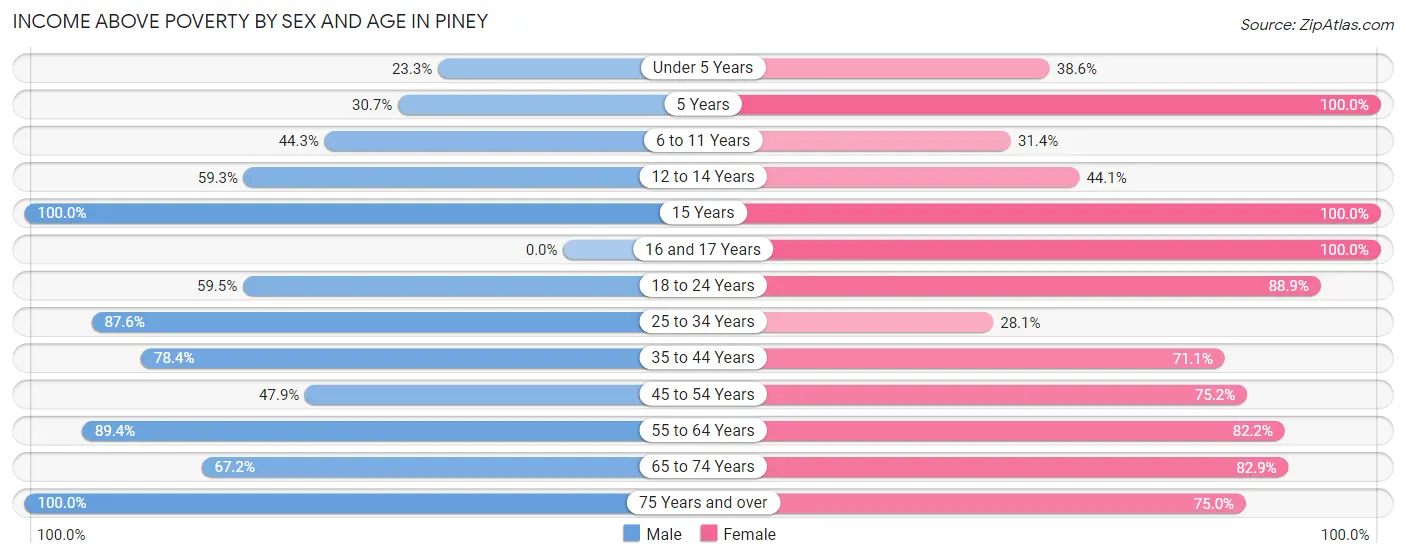
| Age Bracket | Male | Female |
| Under 5 Years | 37 (23.3%) | 56 (38.6%) |
| 5 Years | 31 (30.7%) | 19 (100.0%) |
| 6 to 11 Years | 97 (44.3%) | 71 (31.4%) |
| 12 to 14 Years | 102 (59.3%) | 60 (44.1%) |
| 15 Years | 51 (100.0%) | 35 (100.0%) |
| 16 and 17 Years | 0 (0.0%) | 37 (100.0%) |
| 18 to 24 Years | 88 (59.5%) | 96 (88.9%) |
| 25 to 34 Years | 261 (87.6%) | 153 (28.1%) |
| 35 to 44 Years | 232 (78.4%) | 177 (71.1%) |
| 45 to 54 Years | 138 (47.9%) | 167 (75.2%) |
| 55 to 64 Years | 227 (89.4%) | 148 (82.2%) |
| 65 to 74 Years | 92 (67.1%) | 257 (82.9%) |
| 75 Years and over | 67 (100.0%) | 87 (75.0%) |
| Total | 1,423 (65.0%) | 1,363 (58.6%) |
Income Below Poverty Among Married-Couple Families in Piney
The poverty statistics for married-couple families in Piney show that 34.7% or 179 of the total 516 families live below the poverty line. Families with 3 or 4 children have the highest poverty rate of 80.3%, comprising of 139 families. On the other hand, families with no children have the lowest poverty rate of 9.3%, which includes 15 families.
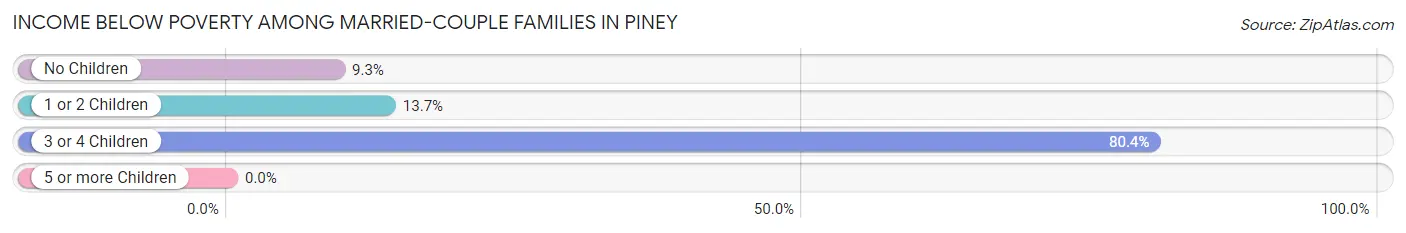
| Children | Above Poverty | Below Poverty |
| No Children | 146 (90.7%) | 15 (9.3%) |
| 1 or 2 Children | 157 (86.3%) | 25 (13.7%) |
| 3 or 4 Children | 34 (19.7%) | 139 (80.3%) |
| 5 or more Children | 0 (0.0%) | 0 (0.0%) |
| Total | 337 (65.3%) | 179 (34.7%) |
Income Below Poverty Among Single-Parent Households in Piney
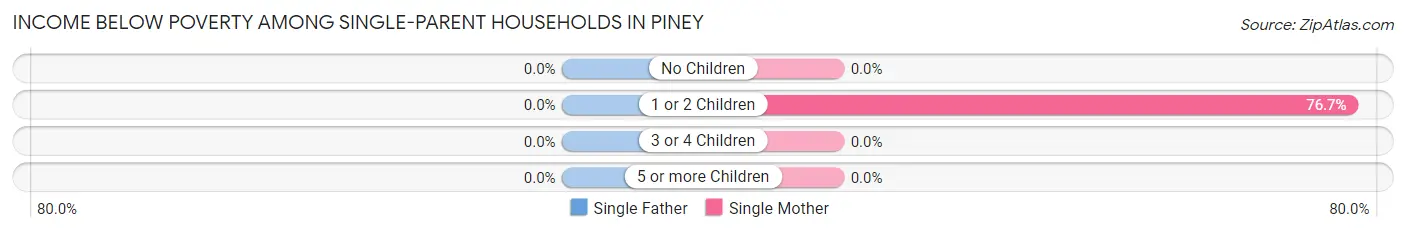
| Children | Single Father | Single Mother |
| No Children | 0 (0.0%) | 0 (0.0%) |
| 1 or 2 Children | 0 (0.0%) | 181 (76.7%) |
| 3 or 4 Children | 0 (0.0%) | 0 (0.0%) |
| 5 or more Children | 0 (0.0%) | 0 (0.0%) |
| Total | 0 (0.0%) | 181 (51.7%) |
Income Below Poverty Among Married-Couple vs Single-Parent Households in Piney
The poverty data for Piney shows that 179 of the married-couple family households (34.7%) and 181 of the single-parent households (36.9%) are living below the poverty level. Within the married-couple family households, those with 3 or 4 children have the highest poverty rate, with 139 households (80.3%) falling below the poverty line. Among the single-parent households, those with 1 or 2 children have the highest poverty rate, with 181 household (52.8%) living below poverty.
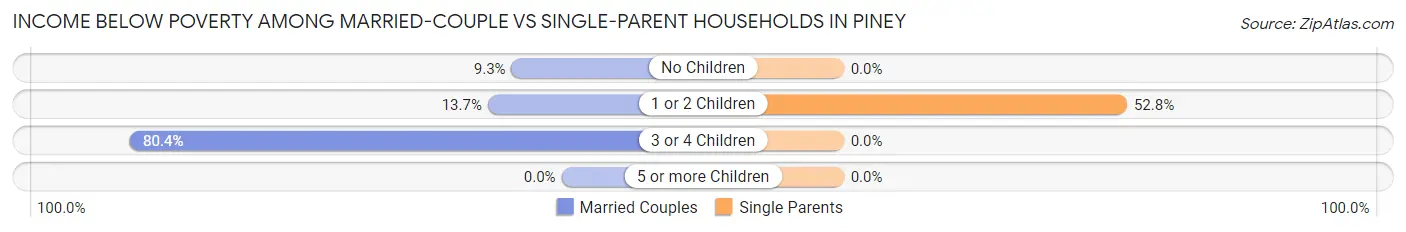
| Children | Married-Couple Families | Single-Parent Households |
| No Children | 15 (9.3%) | 0 (0.0%) |
| 1 or 2 Children | 25 (13.7%) | 181 (52.8%) |
| 3 or 4 Children | 139 (80.3%) | 0 (0.0%) |
| 5 or more Children | 0 (0.0%) | 0 (0.0%) |
| Total | 179 (34.7%) | 181 (36.9%) |
Race in Piney
The most populous races in Piney are White / Caucasian (4,004 | 87.7%), Black / African American (344 | 7.5%), and Hispanic or Latino (130 | 2.9%).
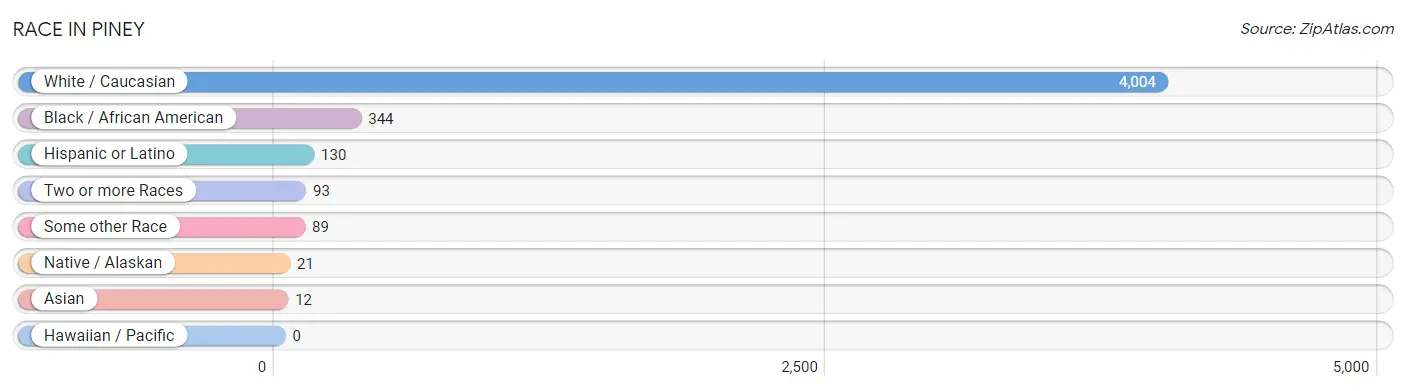
| Race | # Population | % Population |
| Asian | 12 | 0.3% |
| Black / African American | 344 | 7.5% |
| Hawaiian / Pacific | 0 | 0.0% |
| Hispanic or Latino | 130 | 2.9% |
| Native / Alaskan | 21 | 0.5% |
| White / Caucasian | 4,004 | 87.7% |
| Two or more Races | 93 | 2.0% |
| Some other Race | 89 | 1.9% |
| Total | 4,563 | 100.0% |
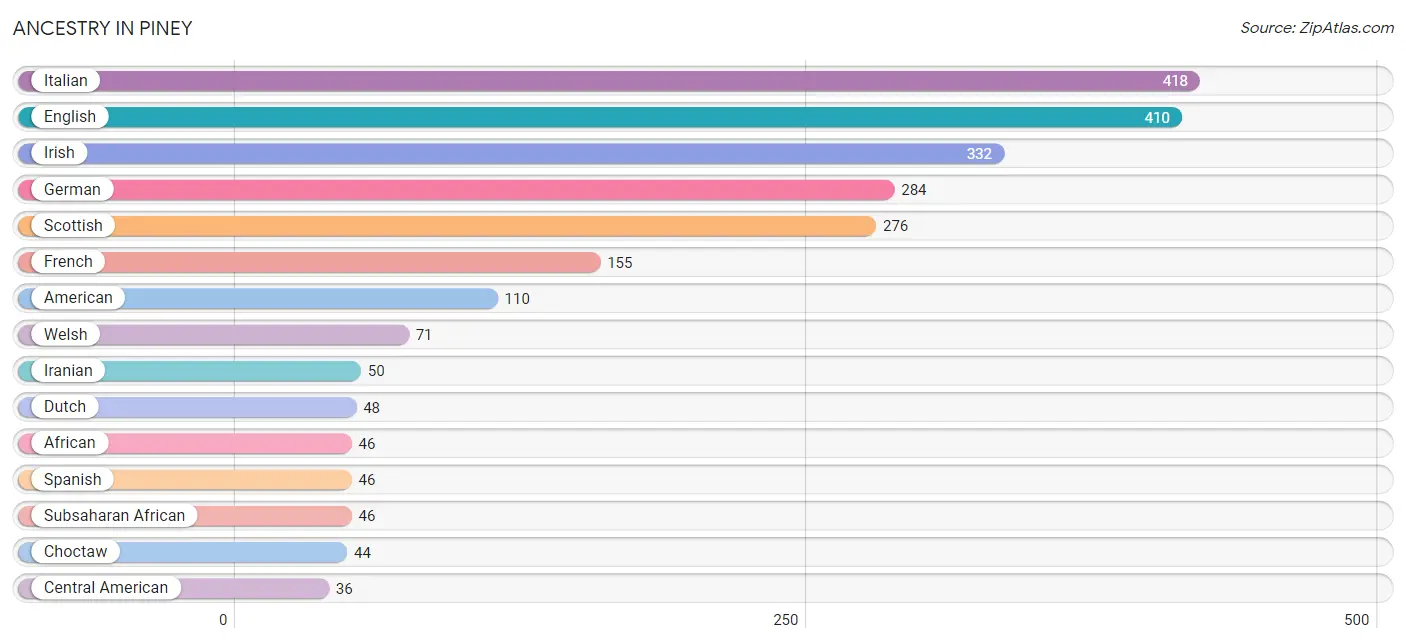
Ancestry in Piney
The most populous ancestries reported in Piney are Italian (418 | 9.2%), English (410 | 9.0%), Irish (332 | 7.3%), German (284 | 6.2%), and Scottish (276 | 6.0%), together accounting for 37.7% of all Piney residents.
| Ancestry | # Population | % Population |
| African | 46 | 1.0% |
| American | 110 | 2.4% |
| Central American | 36 | 0.8% |
| Cherokee | 6 | 0.1% |
| Choctaw | 44 | 1.0% |
| Dutch | 48 | 1.1% |
| Eastern European | 11 | 0.2% |
| English | 410 | 9.0% |
| European | 10 | 0.2% |
| French | 155 | 3.4% |
| French Canadian | 19 | 0.4% |
| German | 284 | 6.2% |
| Honduran | 9 | 0.2% |
| Hungarian | 21 | 0.5% |
| Iranian | 50 | 1.1% |
| Irish | 332 | 7.3% |
| Italian | 418 | 9.2% |
| Korean | 8 | 0.2% |
| Lithuanian | 16 | 0.4% |
| Mexican | 8 | 0.2% |
| Polish | 25 | 0.5% |
| Salvadoran | 27 | 0.6% |
| Scotch-Irish | 10 | 0.2% |
| Scottish | 276 | 6.0% |
| Spanish | 46 | 1.0% |
| Sri Lankan | 4 | 0.1% |
| Subsaharan African | 46 | 1.0% |
| Swedish | 15 | 0.3% |
| Welsh | 71 | 1.6% |
| Yugoslavian | 12 | 0.3% | View All 30 Rows |
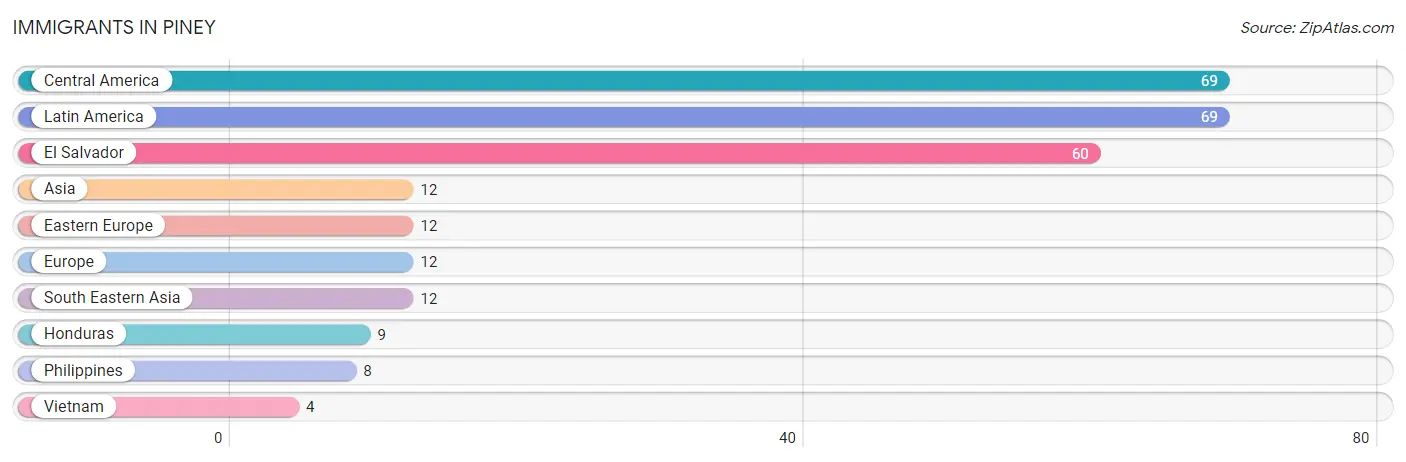
Immigrants in Piney
The most numerous immigrant groups reported in Piney came from Central America (69 | 1.5%), Latin America (69 | 1.5%), El Salvador (60 | 1.3%), Asia (12 | 0.3%), and Eastern Europe (12 | 0.3%), together accounting for 4.9% of all Piney residents.
| Immigration Origin | # Population | % Population |
| Asia | 12 | 0.3% |
| Central America | 69 | 1.5% |
| Eastern Europe | 12 | 0.3% |
| El Salvador | 60 | 1.3% |
| Europe | 12 | 0.3% |
| Honduras | 9 | 0.2% |
| Latin America | 69 | 1.5% |
| Philippines | 8 | 0.2% |
| South Eastern Asia | 12 | 0.3% |
| Vietnam | 4 | 0.1% | View All 10 Rows |
Sex and Age in Piney
Sex and Age in Piney
The most populous age groups in Piney are 5 to 9 Years (266 | 12.0%) for men and 30 to 34 Years (382 | 16.3%) for women.
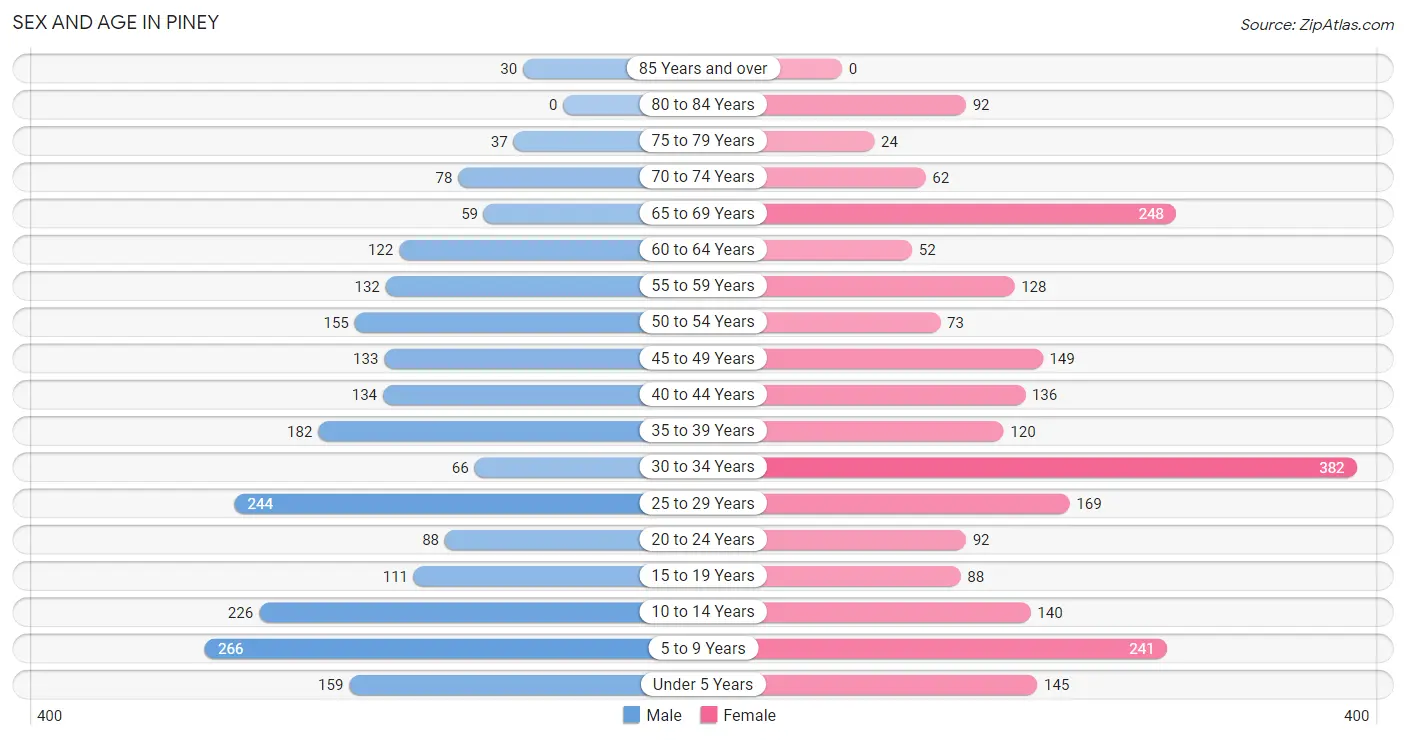
| Age Bracket | Male | Female |
| Under 5 Years | 159 (7.2%) | 145 (6.2%) |
| 5 to 9 Years | 266 (12.0%) | 241 (10.3%) |
| 10 to 14 Years | 226 (10.2%) | 140 (6.0%) |
| 15 to 19 Years | 111 (5.0%) | 88 (3.8%) |
| 20 to 24 Years | 88 (4.0%) | 92 (3.9%) |
| 25 to 29 Years | 244 (11.0%) | 169 (7.2%) |
| 30 to 34 Years | 66 (3.0%) | 382 (16.3%) |
| 35 to 39 Years | 182 (8.2%) | 120 (5.1%) |
| 40 to 44 Years | 134 (6.0%) | 136 (5.8%) |
| 45 to 49 Years | 133 (6.0%) | 149 (6.4%) |
| 50 to 54 Years | 155 (7.0%) | 73 (3.1%) |
| 55 to 59 Years | 132 (5.9%) | 128 (5.5%) |
| 60 to 64 Years | 122 (5.5%) | 52 (2.2%) |
| 65 to 69 Years | 59 (2.7%) | 248 (10.6%) |
| 70 to 74 Years | 78 (3.5%) | 62 (2.6%) |
| 75 to 79 Years | 37 (1.7%) | 24 (1.0%) |
| 80 to 84 Years | 0 (0.0%) | 92 (3.9%) |
| 85 Years and over | 30 (1.3%) | 0 (0.0%) |
| Total | 2,222 (100.0%) | 2,341 (100.0%) |
Families and Households in Piney
Median Family Size in Piney
The median family size in Piney is 3.21 persons per family, with married-couple families (516 | 51.3%) accounting for the largest median family size of 3.72 persons per family. On the other hand, single female/mother families (350 | 34.8%) represent the smallest median family size with 2.57 persons per family.
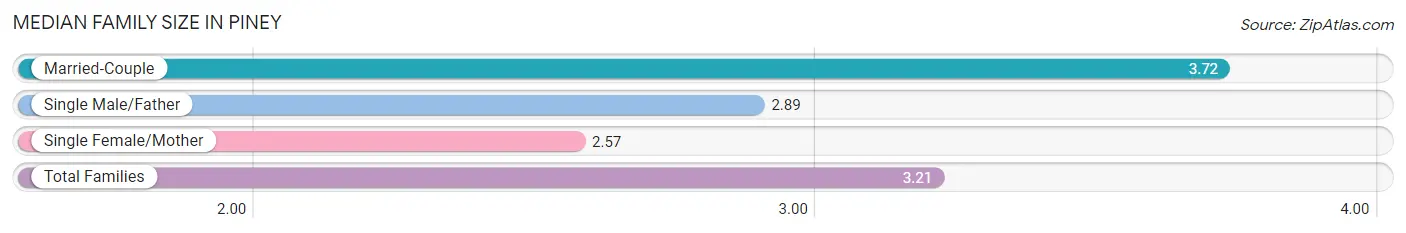
| Family Type | # Families | Family Size |
| Married-Couple | 516 (51.3%) | 3.72 |
| Single Male/Father | 140 (13.9%) | 2.89 |
| Single Female/Mother | 350 (34.8%) | 2.57 |
| Total Families | 1,006 (100.0%) | 3.21 |
Median Household Size in Piney
The median household size in Piney is 2.39 persons per household, with married-couple households (516 | 27.3%) accounting for the largest median household size of 3.8 persons per household. non-family households (886 | 46.8%) represent the smallest median household size with 1.18 persons per household.
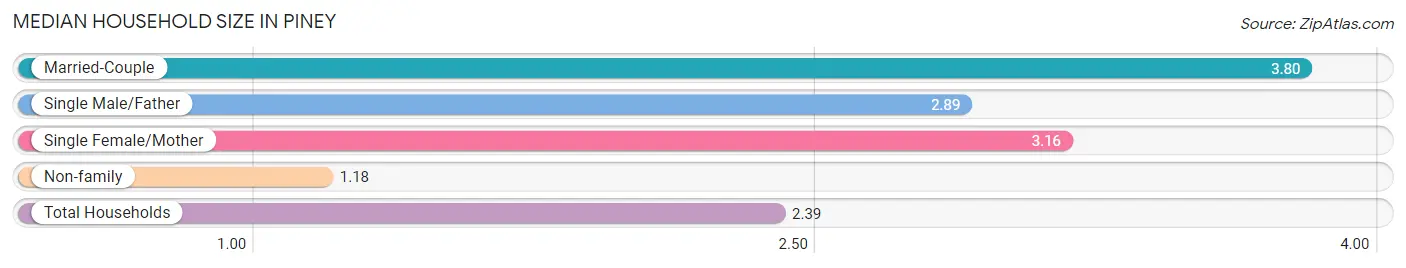
| Household Type | # Households | Household Size |
| Married-Couple | 516 (27.3%) | 3.80 |
| Single Male/Father | 140 (7.4%) | 2.89 |
| Single Female/Mother | 350 (18.5%) | 3.16 |
| Non-family | 886 (46.8%) | 1.18 |
| Total Households | 1,892 (100.0%) | 2.39 |
Household Size by Marriage Status in Piney
Out of a total of 1,892 households in Piney, 1,006 (53.2%) are family households, while 886 (46.8%) are nonfamily households. The most numerous type of family households are 3-person households, comprising 362, and the most common type of nonfamily households are 1-person households, comprising 750.
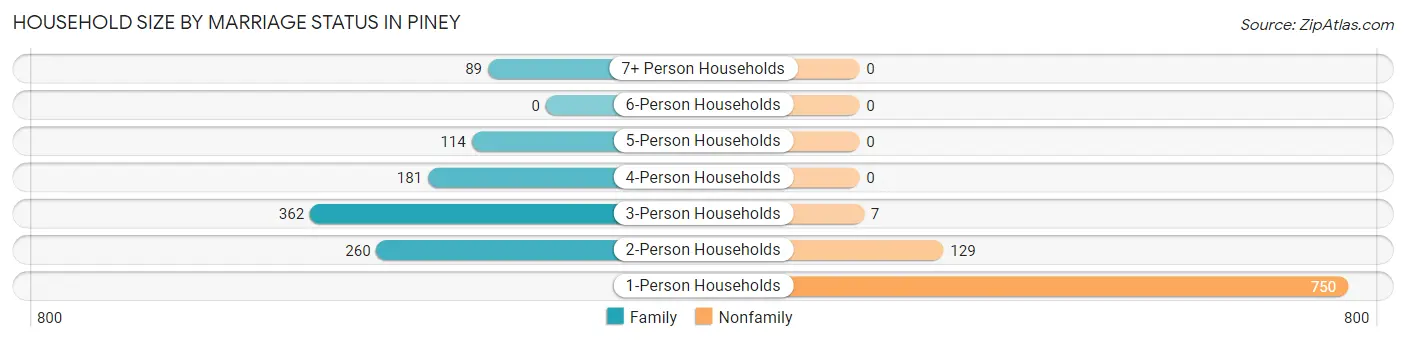
| Household Size | Family Households | Nonfamily Households |
| 1-Person Households | - | 750 (39.6%) |
| 2-Person Households | 260 (13.7%) | 129 (6.8%) |
| 3-Person Households | 362 (19.1%) | 7 (0.4%) |
| 4-Person Households | 181 (9.6%) | 0 (0.0%) |
| 5-Person Households | 114 (6.0%) | 0 (0.0%) |
| 6-Person Households | 0 (0.0%) | 0 (0.0%) |
| 7+ Person Households | 89 (4.7%) | 0 (0.0%) |
| Total | 1,006 (53.2%) | 886 (46.8%) |
Female Fertility in Piney
Fertility by Age in Piney
Average fertility rate in Piney is 58.0 births per 1,000 women. Women in the age bracket of 15 to 19 years have the highest fertility rate with 80.0 births per 1,000 women. Women in the age bracket of 20 to 34 years acount for 54.3% of all women with births.
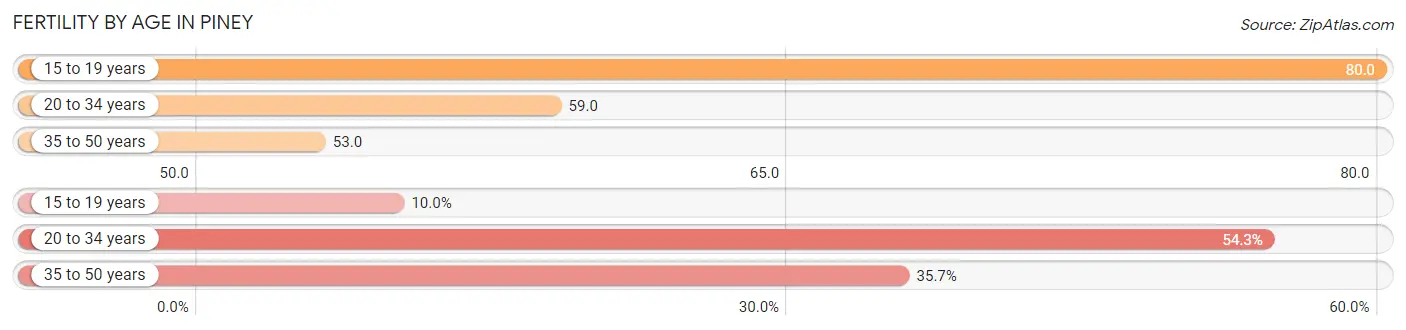
| Age Bracket | Women with Births | Births / 1,000 Women |
| 15 to 19 years | 7 (10.0%) | 80.0 |
| 20 to 34 years | 38 (54.3%) | 59.0 |
| 35 to 50 years | 25 (35.7%) | 53.0 |
| Total | 70 (100.0%) | 58.0 |
Fertility by Age by Marriage Status in Piney
90.0% of women with births (70) in Piney are married. The highest percentage of unmarried women with births falls into 15 to 19 years age bracket with 100.0% of them unmarried at the time of birth, while the lowest percentage of unmarried women with births belong to 20 to 34 years age bracket with 0.0% of them unmarried.
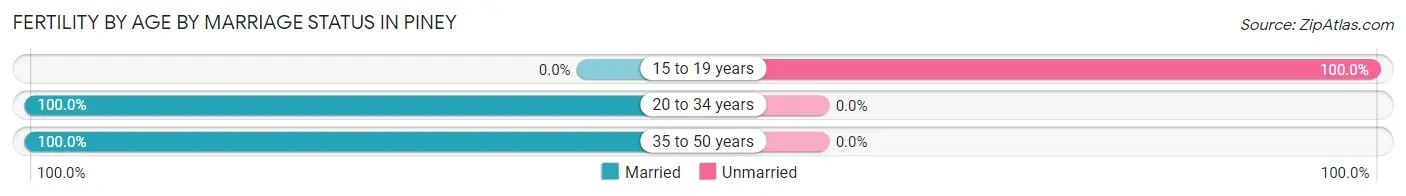
| Age Bracket | Married | Unmarried |
| 15 to 19 years | 0 (0.0%) | 7 (100.0%) |
| 20 to 34 years | 38 (100.0%) | 0 (0.0%) |
| 35 to 50 years | 25 (100.0%) | 0 (0.0%) |
| Total | 63 (90.0%) | 7 (10.0%) |
Fertility by Education in Piney
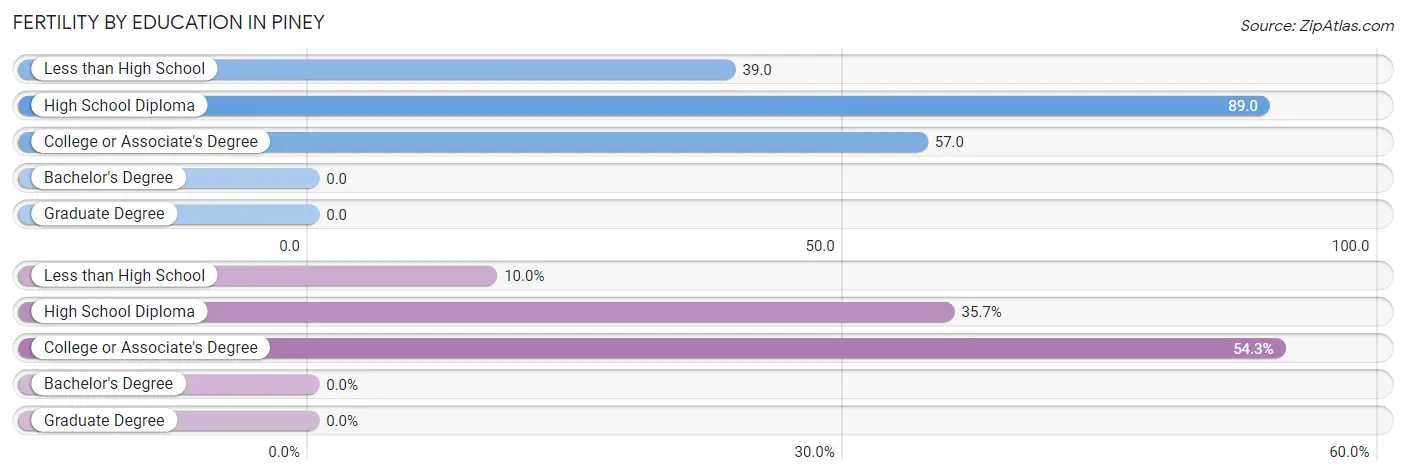
| Educational Attainment | Women with Births | Births / 1,000 Women |
| Less than High School | 7 (10.0%) | 39.0 |
| High School Diploma | 25 (35.7%) | 89.0 |
| College or Associate's Degree | 38 (54.3%) | 57.0 |
| Bachelor's Degree | 0 (0.0%) | 0.0 |
| Graduate Degree | 0 (0.0%) | 0.0 |
| Total | 70 (100.0%) | 58.0 |
Fertility by Education by Marriage Status in Piney
10.0% of women with births in Piney are unmarried. Women with the educational attainment of high school diploma are most likely to be married with 100.0% of them married at childbirth, while women with the educational attainment of less than high school are least likely to be married with 100.0% of them unmarried at childbirth.
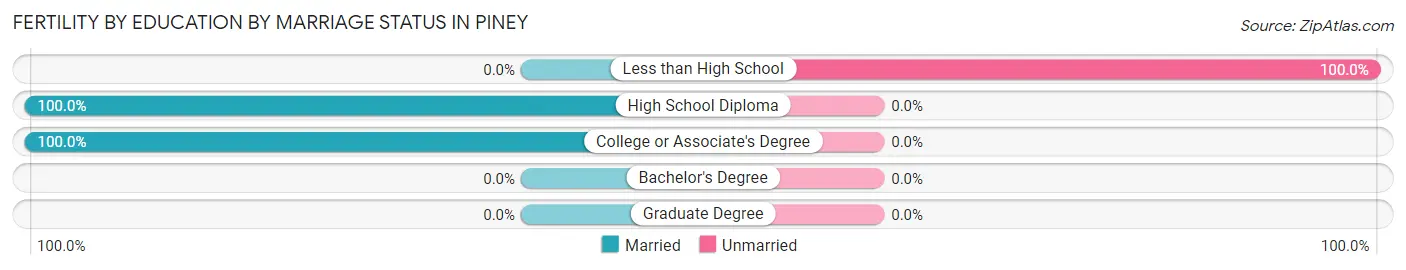
| Educational Attainment | Married | Unmarried |
| Less than High School | 0 (0.0%) | 7 (100.0%) |
| High School Diploma | 25 (100.0%) | 0 (0.0%) |
| College or Associate's Degree | 38 (100.0%) | 0 (0.0%) |
| Bachelor's Degree | 0 (0.0%) | 0 (0.0%) |
| Graduate Degree | 0 (0.0%) | 0 (0.0%) |
| Total | 63 (90.0%) | 7 (10.0%) |
Employment Characteristics in Piney
Employment by Class of Employer in Piney
Among the 2,068 employed individuals in Piney, private company employees (1,645 | 79.5%), self-employed (not incorporated) (146 | 7.1%), and local government employees (97 | 4.7%) make up the most common classes of employment.
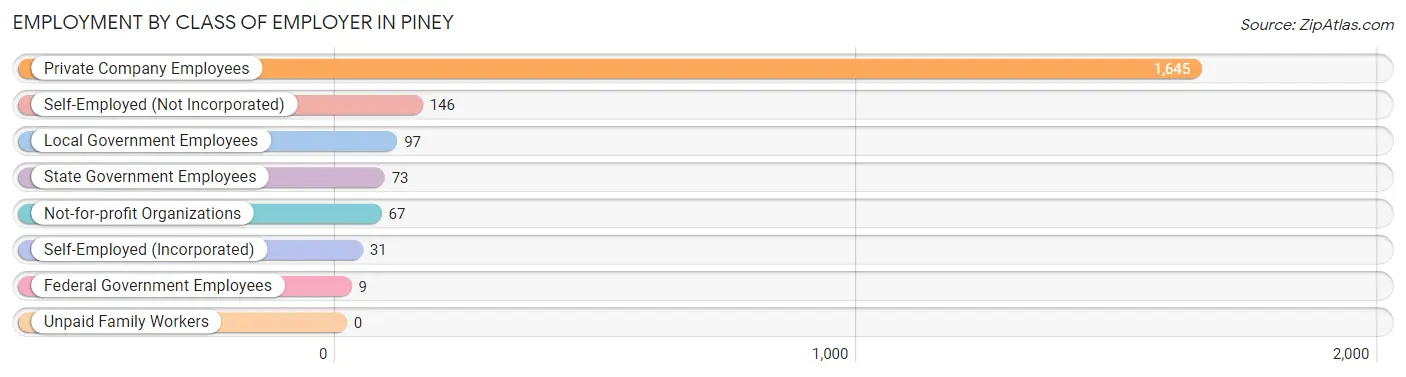
| Employer Class | # Employees | % Employees |
| Private Company Employees | 1,645 | 79.5% |
| Self-Employed (Incorporated) | 31 | 1.5% |
| Self-Employed (Not Incorporated) | 146 | 7.1% |
| Not-for-profit Organizations | 67 | 3.2% |
| Local Government Employees | 97 | 4.7% |
| State Government Employees | 73 | 3.5% |
| Federal Government Employees | 9 | 0.4% |
| Unpaid Family Workers | 0 | 0.0% |
| Total | 2,068 | 100.0% |
Employment Status by Age in Piney
According to the labor force statistics for Piney, out of the total population over 16 years of age (3,300), 67.1% or 2,214 individuals are in the labor force, with 5.9% or 131 of them unemployed. The age group with the highest labor force participation rate is 16 to 19 years, with 100.0% or 113 individuals in the labor force. Within the labor force, the 20 to 24 years age range has the highest percentage of unemployed individuals, with 50.6% or 91 of them being unemployed.
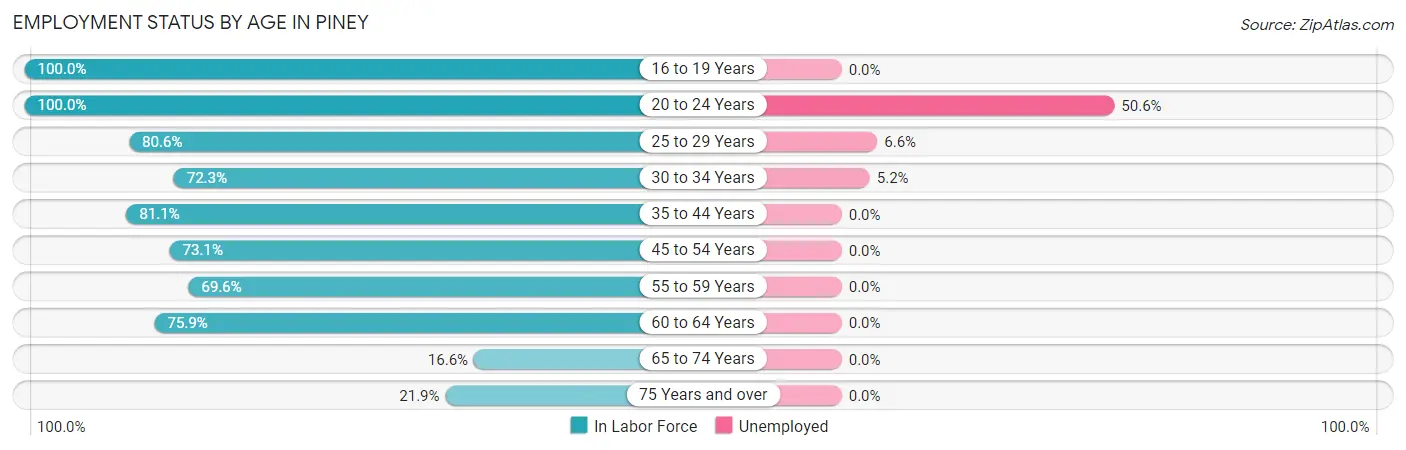
| Age Bracket | In Labor Force | Unemployed |
| 16 to 19 Years | 113 (100.0%) | 0 (0.0%) |
| 20 to 24 Years | 180 (100.0%) | 91 (50.6%) |
| 25 to 29 Years | 333 (80.6%) | 22 (6.6%) |
| 30 to 34 Years | 324 (72.3%) | 17 (5.2%) |
| 35 to 44 Years | 464 (81.1%) | 0 (0.0%) |
| 45 to 54 Years | 373 (73.1%) | 0 (0.0%) |
| 55 to 59 Years | 181 (69.6%) | 0 (0.0%) |
| 60 to 64 Years | 132 (75.9%) | 0 (0.0%) |
| 65 to 74 Years | 74 (16.6%) | 0 (0.0%) |
| 75 Years and over | 40 (21.9%) | 0 (0.0%) |
| Total | 2,214 (67.1%) | 131 (5.9%) |
Employment Status by Educational Attainment in Piney
According to labor force statistics for Piney, 76.0% of individuals (1,807) out of the total population between 25 and 64 years of age (2,377) are in the labor force, with 2.2% or 40 of them being unemployed. The group with the highest labor force participation rate are those with the educational attainment of bachelor's degree or higher, with 79.9% or 291 individuals in the labor force. Within the labor force, individuals with less than high school education have the highest percentage of unemployment, with 6.7% or 17 of them being unemployed.
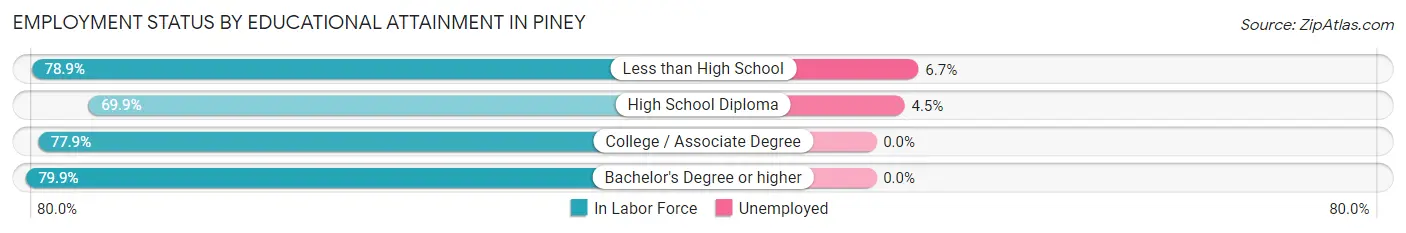
| Educational Attainment | In Labor Force | Unemployed |
| Less than High School | 255 (78.9%) | 22 (6.7%) |
| High School Diploma | 485 (69.9%) | 31 (4.5%) |
| College / Associate Degree | 776 (77.9%) | 0 (0.0%) |
| Bachelor's Degree or higher | 291 (79.9%) | 0 (0.0%) |
| Total | 1,807 (76.0%) | 52 (2.2%) |
Employment Occupations by Sex in Piney
Management, Business, Science and Arts Occupations
The most common Management, Business, Science and Arts occupations in Piney are Health Diagnosing & Treating (162 | 7.8%), Management (144 | 6.9%), Health Technologists (114 | 5.5%), Community & Social Service (108 | 5.2%), and Education Instruction & Library (77 | 3.7%).
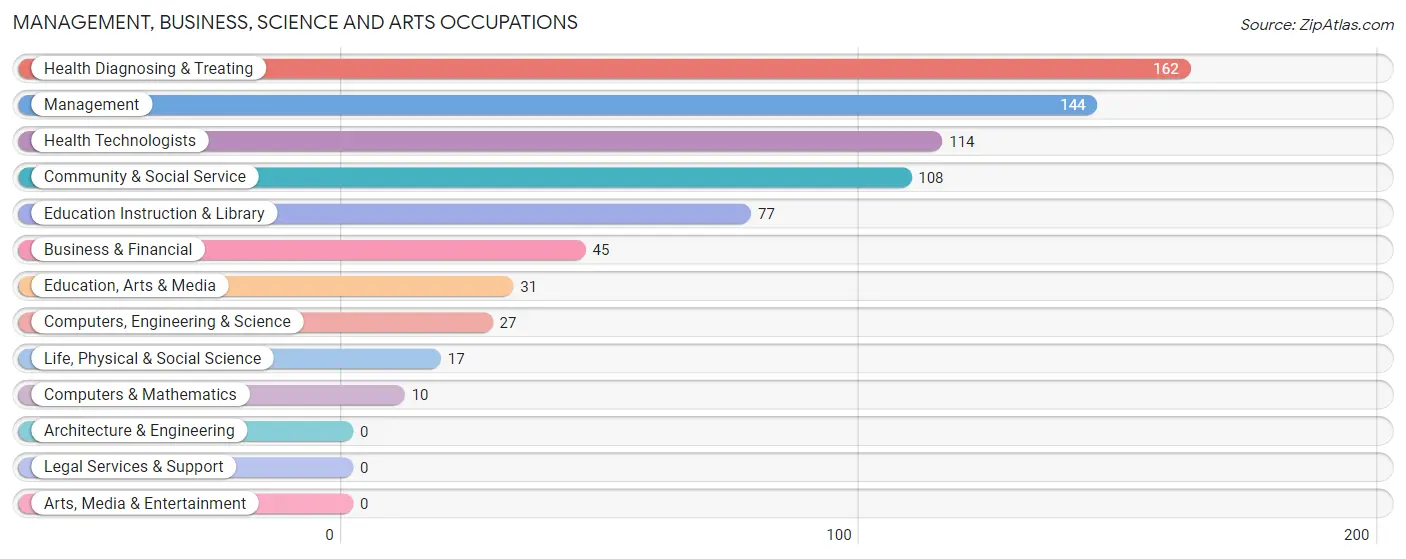
Management, Business, Science and Arts Occupations by Sex
Within the Management, Business, Science and Arts occupations in Piney, the most male-oriented occupations are Computers, Engineering & Science (100.0%), Computers & Mathematics (100.0%), and Life, Physical & Social Science (100.0%), while the most female-oriented occupations are Education, Arts & Media (100.0%), Community & Social Service (70.4%), and Education Instruction & Library (58.4%).
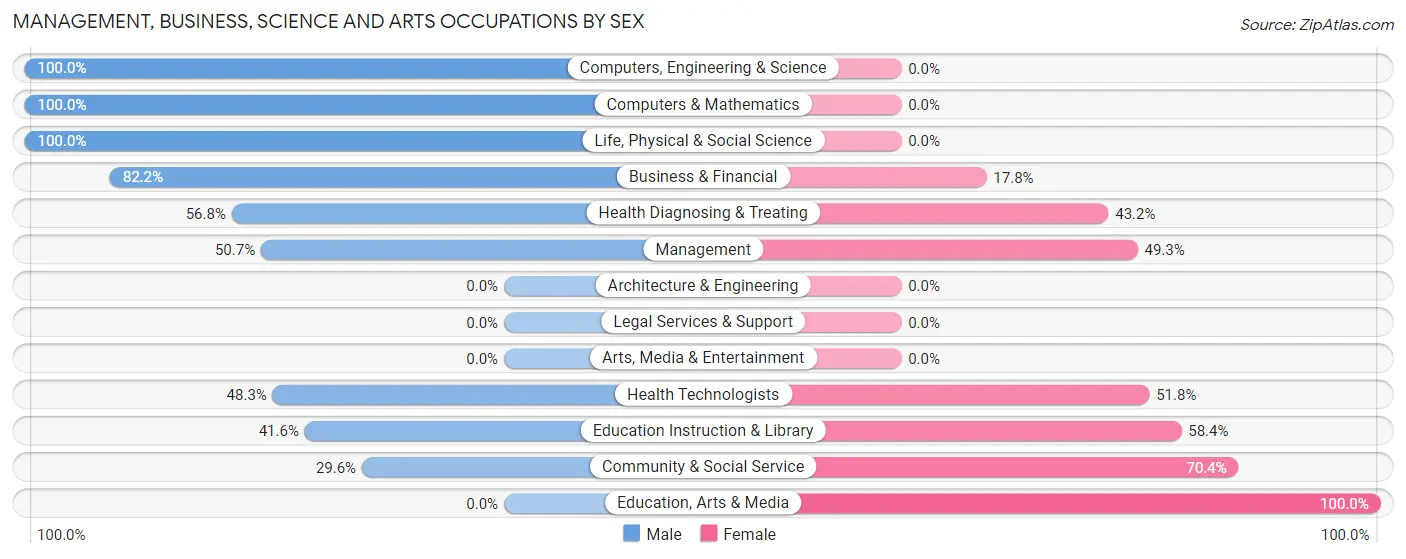
| Occupation | Male | Female |
| Management | 73 (50.7%) | 71 (49.3%) |
| Business & Financial | 37 (82.2%) | 8 (17.8%) |
| Computers, Engineering & Science | 27 (100.0%) | 0 (0.0%) |
| Computers & Mathematics | 10 (100.0%) | 0 (0.0%) |
| Architecture & Engineering | 0 (0.0%) | 0 (0.0%) |
| Life, Physical & Social Science | 17 (100.0%) | 0 (0.0%) |
| Community & Social Service | 32 (29.6%) | 76 (70.4%) |
| Education, Arts & Media | 0 (0.0%) | 31 (100.0%) |
| Legal Services & Support | 0 (0.0%) | 0 (0.0%) |
| Education Instruction & Library | 32 (41.6%) | 45 (58.4%) |
| Arts, Media & Entertainment | 0 (0.0%) | 0 (0.0%) |
| Health Diagnosing & Treating | 92 (56.8%) | 70 (43.2%) |
| Health Technologists | 55 (48.2%) | 59 (51.7%) |
| Total (Category) | 261 (53.7%) | 225 (46.3%) |
| Total (Overall) | 964 (46.3%) | 1,120 (53.7%) |
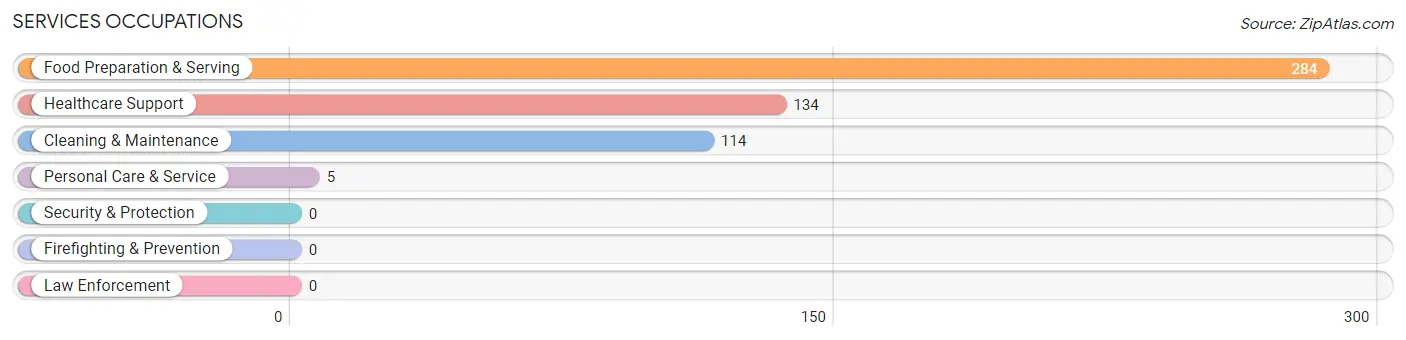
Services Occupations
The most common Services occupations in Piney are Food Preparation & Serving (284 | 13.6%), Healthcare Support (134 | 6.4%), Cleaning & Maintenance (114 | 5.5%), and Personal Care & Service (5 | 0.2%).
Services Occupations by Sex
Within the Services occupations in Piney, the most male-oriented occupations are Personal Care & Service (100.0%), and Healthcare Support (29.1%), while the most female-oriented occupations are Food Preparation & Serving (100.0%), Cleaning & Maintenance (100.0%), and Healthcare Support (70.9%).
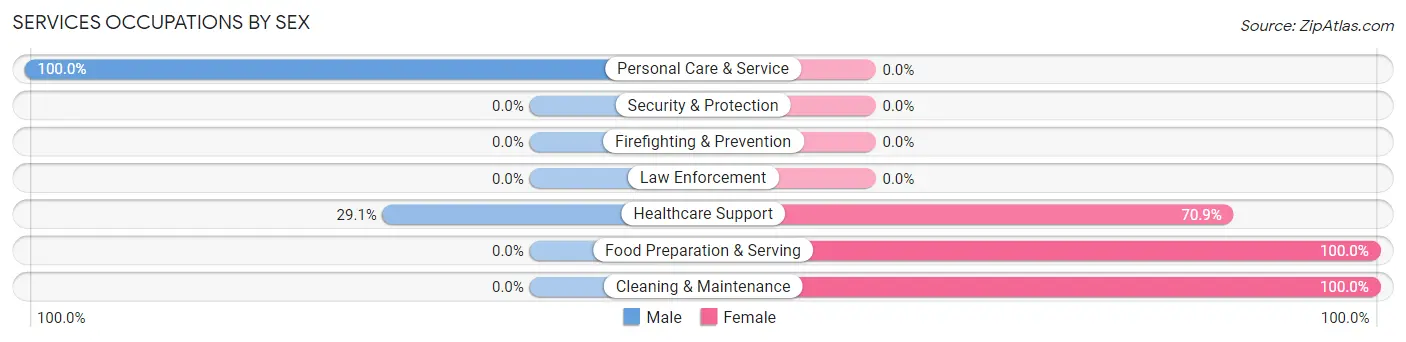
| Occupation | Male | Female |
| Healthcare Support | 39 (29.1%) | 95 (70.9%) |
| Security & Protection | 0 (0.0%) | 0 (0.0%) |
| Firefighting & Prevention | 0 (0.0%) | 0 (0.0%) |
| Law Enforcement | 0 (0.0%) | 0 (0.0%) |
| Food Preparation & Serving | 0 (0.0%) | 284 (100.0%) |
| Cleaning & Maintenance | 0 (0.0%) | 114 (100.0%) |
| Personal Care & Service | 5 (100.0%) | 0 (0.0%) |
| Total (Category) | 44 (8.2%) | 493 (91.8%) |
| Total (Overall) | 964 (46.3%) | 1,120 (53.7%) |
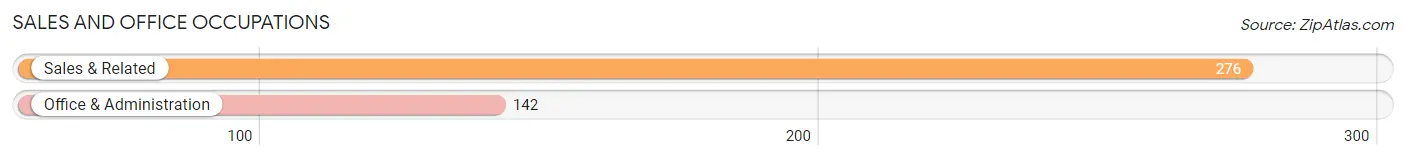
Sales and Office Occupations
The most common Sales and Office occupations in Piney are Sales & Related (276 | 13.2%), and Office & Administration (142 | 6.8%).
Sales and Office Occupations by Sex
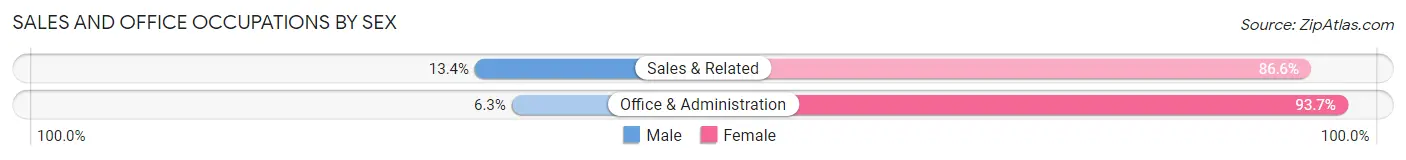
| Occupation | Male | Female |
| Sales & Related | 37 (13.4%) | 239 (86.6%) |
| Office & Administration | 9 (6.3%) | 133 (93.7%) |
| Total (Category) | 46 (11.0%) | 372 (89.0%) |
| Total (Overall) | 964 (46.3%) | 1,120 (53.7%) |
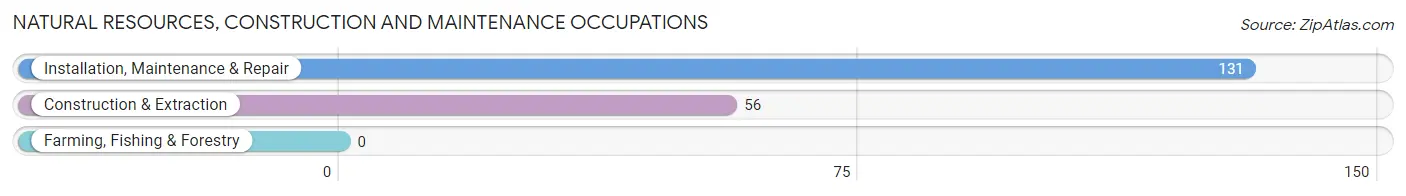
Natural Resources, Construction and Maintenance Occupations
The most common Natural Resources, Construction and Maintenance occupations in Piney are Installation, Maintenance & Repair (131 | 6.3%), and Construction & Extraction (56 | 2.7%).
Natural Resources, Construction and Maintenance Occupations by Sex
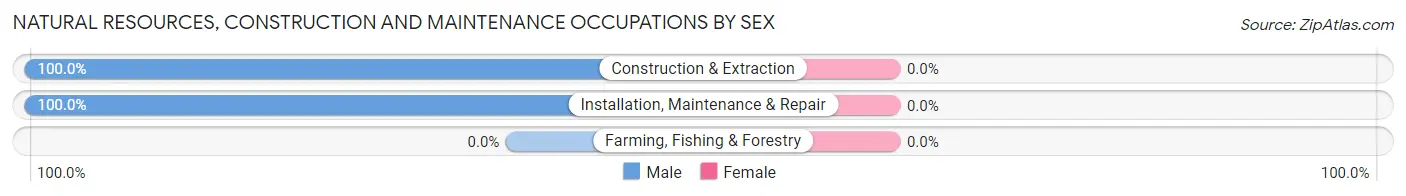
| Occupation | Male | Female |
| Farming, Fishing & Forestry | 0 (0.0%) | 0 (0.0%) |
| Construction & Extraction | 56 (100.0%) | 0 (0.0%) |
| Installation, Maintenance & Repair | 131 (100.0%) | 0 (0.0%) |
| Total (Category) | 187 (100.0%) | 0 (0.0%) |
| Total (Overall) | 964 (46.3%) | 1,120 (53.7%) |
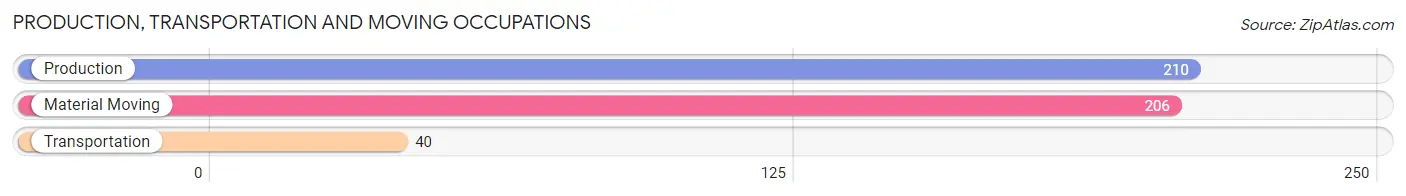
Production, Transportation and Moving Occupations
The most common Production, Transportation and Moving occupations in Piney are Production (210 | 10.1%), Material Moving (206 | 9.9%), and Transportation (40 | 1.9%).
Production, Transportation and Moving Occupations by Sex
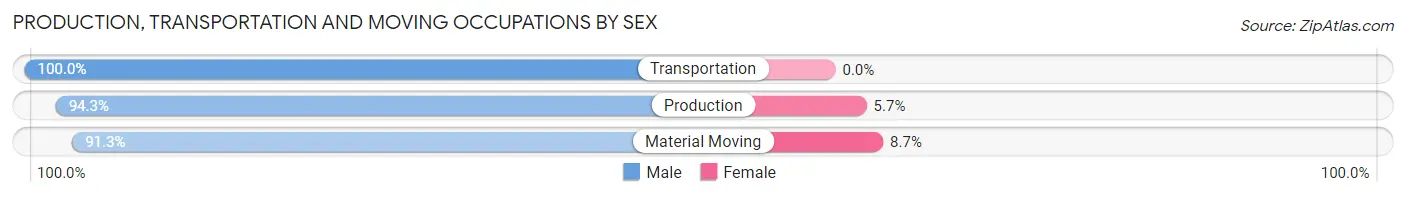
| Occupation | Male | Female |
| Production | 198 (94.3%) | 12 (5.7%) |
| Transportation | 40 (100.0%) | 0 (0.0%) |
| Material Moving | 188 (91.3%) | 18 (8.7%) |
| Total (Category) | 426 (93.4%) | 30 (6.6%) |
| Total (Overall) | 964 (46.3%) | 1,120 (53.7%) |
Employment Industries by Sex in Piney
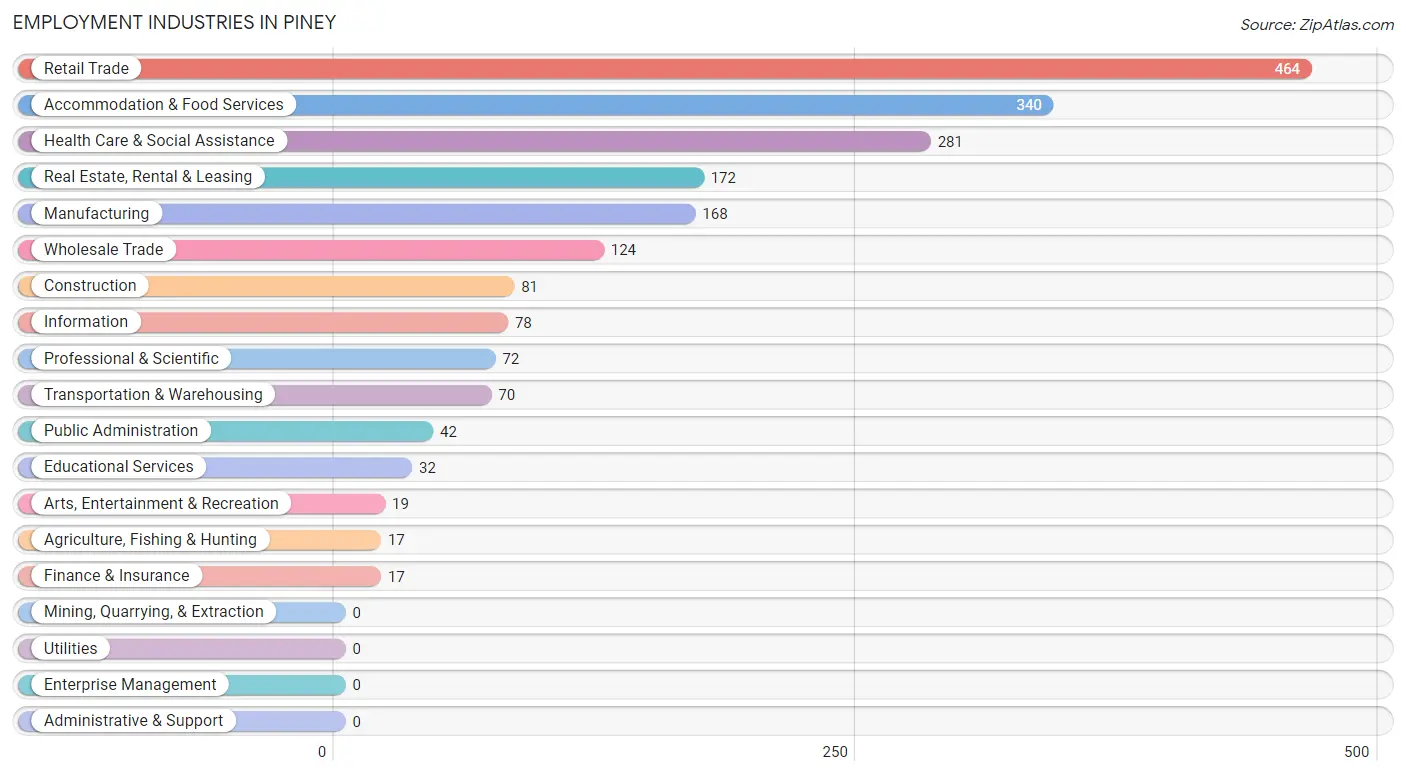
Employment Industries in Piney
The major employment industries in Piney include Retail Trade (464 | 22.3%), Accommodation & Food Services (340 | 16.3%), Health Care & Social Assistance (281 | 13.5%), Real Estate, Rental & Leasing (172 | 8.3%), and Manufacturing (168 | 8.1%).
Employment Industries by Sex in Piney
The Piney industries that see more men than women are Agriculture, Fishing & Hunting (100.0%), Construction (100.0%), and Manufacturing (100.0%), whereas the industries that tend to have a higher number of women are Public Administration (100.0%), Accommodation & Food Services (89.1%), and Health Care & Social Assistance (82.9%).
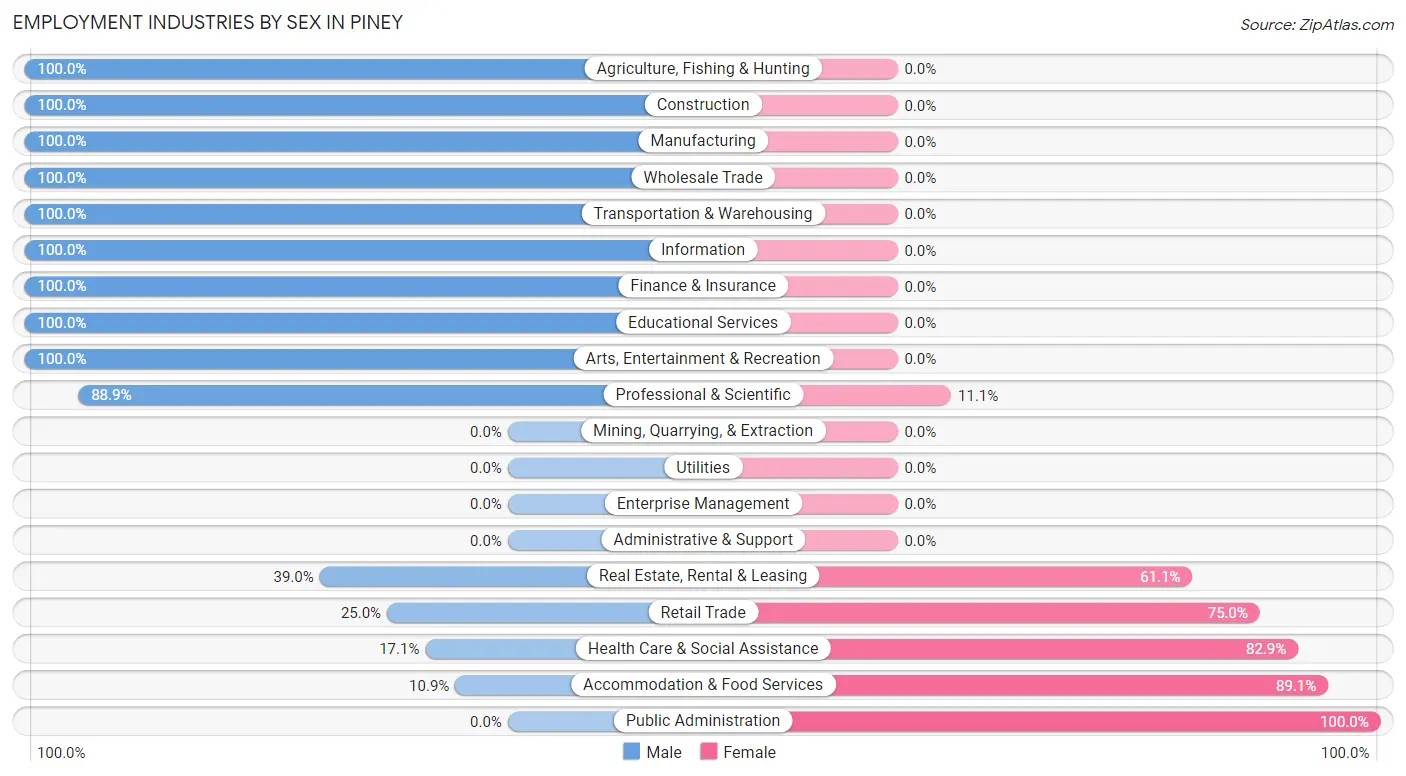
| Industry | Male | Female |
| Agriculture, Fishing & Hunting | 17 (100.0%) | 0 (0.0%) |
| Mining, Quarrying, & Extraction | 0 (0.0%) | 0 (0.0%) |
| Construction | 81 (100.0%) | 0 (0.0%) |
| Manufacturing | 168 (100.0%) | 0 (0.0%) |
| Wholesale Trade | 124 (100.0%) | 0 (0.0%) |
| Retail Trade | 116 (25.0%) | 348 (75.0%) |
| Transportation & Warehousing | 70 (100.0%) | 0 (0.0%) |
| Utilities | 0 (0.0%) | 0 (0.0%) |
| Information | 78 (100.0%) | 0 (0.0%) |
| Finance & Insurance | 17 (100.0%) | 0 (0.0%) |
| Real Estate, Rental & Leasing | 67 (39.0%) | 105 (61.1%) |
| Professional & Scientific | 64 (88.9%) | 8 (11.1%) |
| Enterprise Management | 0 (0.0%) | 0 (0.0%) |
| Administrative & Support | 0 (0.0%) | 0 (0.0%) |
| Educational Services | 32 (100.0%) | 0 (0.0%) |
| Health Care & Social Assistance | 48 (17.1%) | 233 (82.9%) |
| Arts, Entertainment & Recreation | 19 (100.0%) | 0 (0.0%) |
| Accommodation & Food Services | 37 (10.9%) | 303 (89.1%) |
| Public Administration | 0 (0.0%) | 42 (100.0%) |
| Total | 964 (46.3%) | 1,120 (53.7%) |
Education in Piney
School Enrollment in Piney
The most common levels of schooling among the 1,154 students in Piney are elementary school (373 | 32.3%), middle school (285 | 24.7%), and high school (190 | 16.5%).
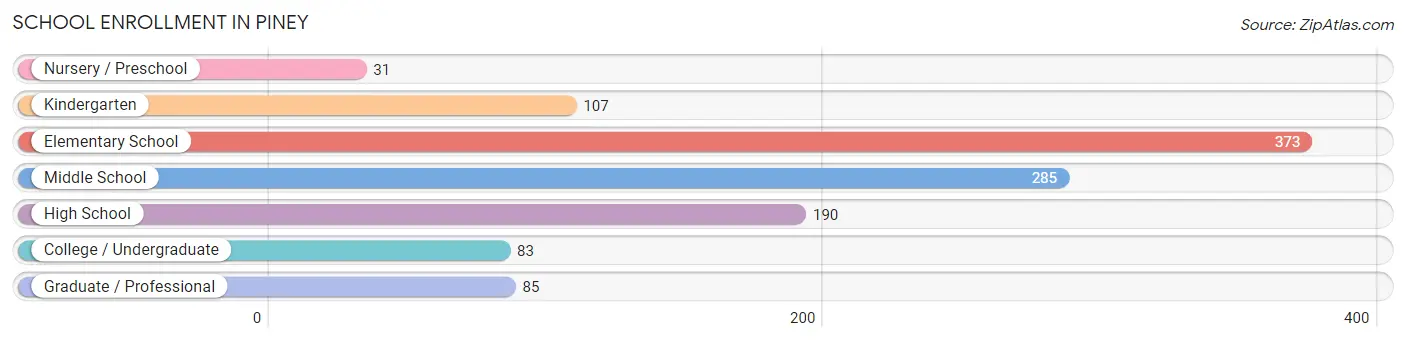
| School Level | # Students | % Students |
| Nursery / Preschool | 31 | 2.7% |
| Kindergarten | 107 | 9.3% |
| Elementary School | 373 | 32.3% |
| Middle School | 285 | 24.7% |
| High School | 190 | 16.5% |
| College / Undergraduate | 83 | 7.2% |
| Graduate / Professional | 85 | 7.4% |
| Total | 1,154 | 100.0% |
School Enrollment by Age by Funding Source in Piney
Out of a total of 1,154 students who are enrolled in schools in Piney, 120 (10.4%) attend a private institution, while the remaining 1,034 (89.6%) are enrolled in public schools. The age group of 20 to 24 year olds has the highest likelihood of being enrolled in private schools, with 67 (100.0% in the age bracket) enrolled. Conversely, the age group of 5 to 9 year old has the lowest likelihood of being enrolled in a private school, with 507 (100.0% in the age bracket) attending a public institution.
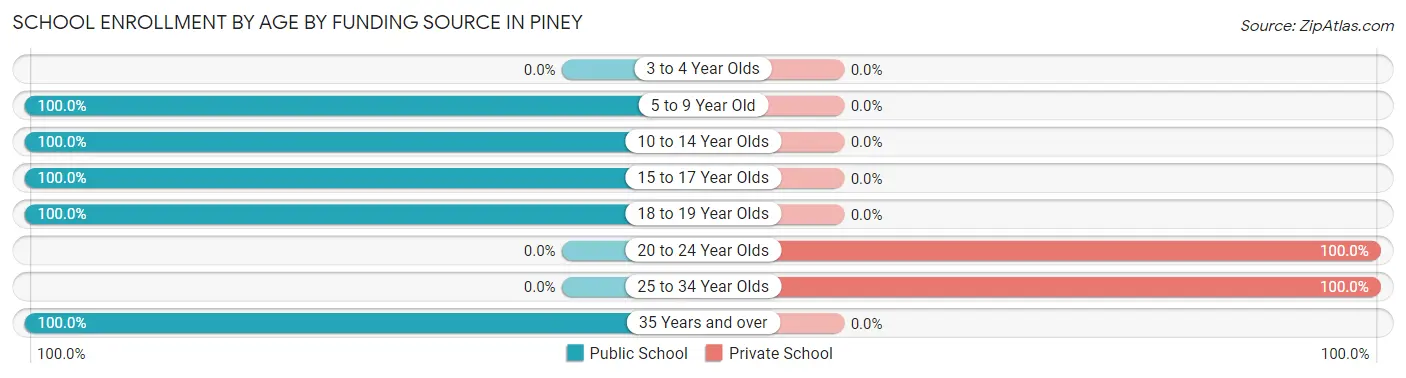
| Age Bracket | Public School | Private School |
| 3 to 4 Year Olds | 0 (0.0%) | 0 (0.0%) |
| 5 to 9 Year Old | 507 (100.0%) | 0 (0.0%) |
| 10 to 14 Year Olds | 296 (100.0%) | 0 (0.0%) |
| 15 to 17 Year Olds | 123 (100.0%) | 0 (0.0%) |
| 18 to 19 Year Olds | 76 (100.0%) | 0 (0.0%) |
| 20 to 24 Year Olds | 0 (0.0%) | 67 (100.0%) |
| 25 to 34 Year Olds | 0 (0.0%) | 53 (100.0%) |
| 35 Years and over | 32 (100.0%) | 0 (0.0%) |
| Total | 1,034 (89.6%) | 120 (10.4%) |
Educational Attainment by Field of Study in Piney
Education (168 | 30.7%), computers & mathematics (69 | 12.6%), arts & humanities (68 | 12.4%), business (60 | 11.0%), and psychology (46 | 8.4%) are the most common fields of study among 547 individuals in Piney who have obtained a bachelor's degree or higher.
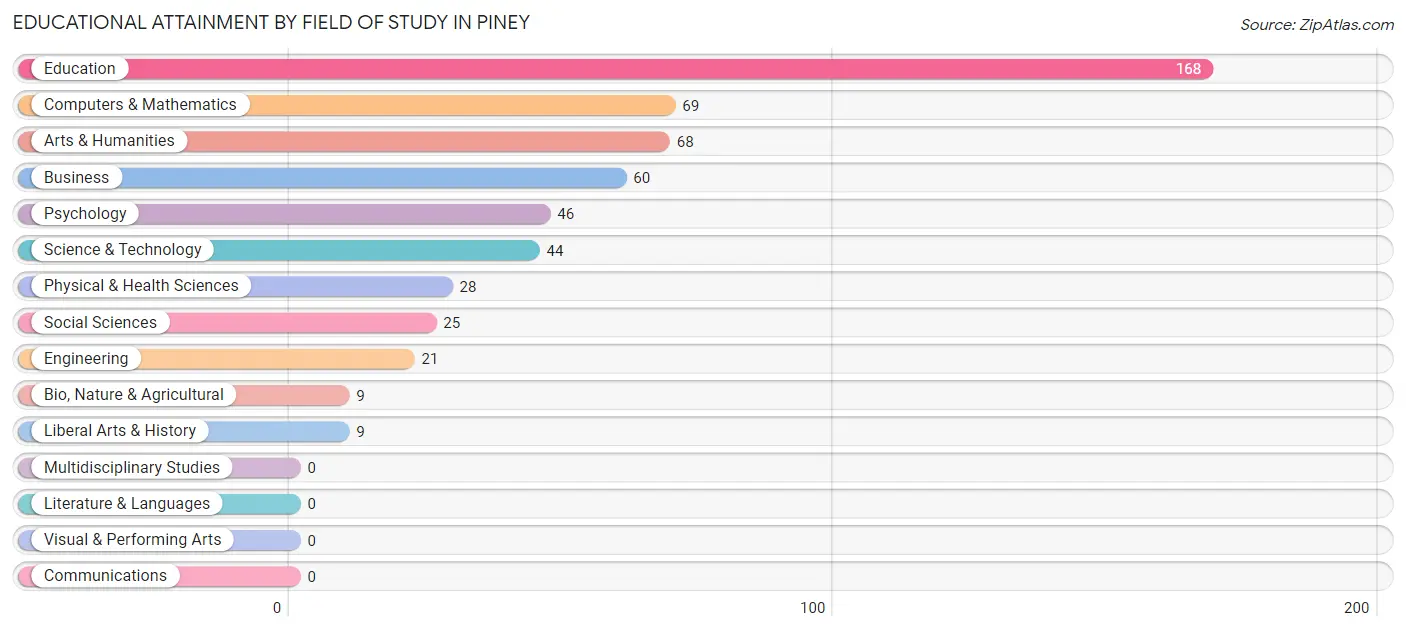
| Field of Study | # Graduates | % Graduates |
| Computers & Mathematics | 69 | 12.6% |
| Bio, Nature & Agricultural | 9 | 1.7% |
| Physical & Health Sciences | 28 | 5.1% |
| Psychology | 46 | 8.4% |
| Social Sciences | 25 | 4.6% |
| Engineering | 21 | 3.8% |
| Multidisciplinary Studies | 0 | 0.0% |
| Science & Technology | 44 | 8.0% |
| Business | 60 | 11.0% |
| Education | 168 | 30.7% |
| Literature & Languages | 0 | 0.0% |
| Liberal Arts & History | 9 | 1.7% |
| Visual & Performing Arts | 0 | 0.0% |
| Communications | 0 | 0.0% |
| Arts & Humanities | 68 | 12.4% |
| Total | 547 | 100.0% |
Transportation & Commute in Piney
Vehicle Availability by Sex in Piney
The most prevalent vehicle ownership categories in Piney are males with 2 vehicles (542, accounting for 57.2%) and females with 2 vehicles (546, making up 48.4%).
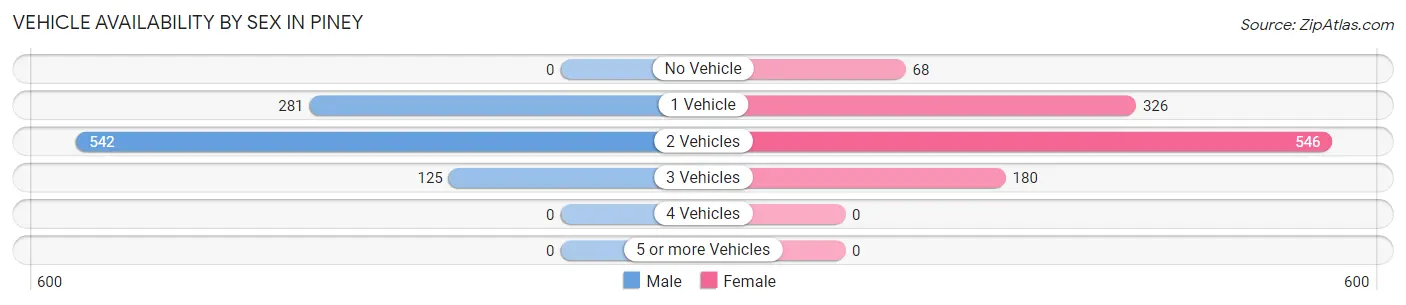
| Vehicles Available | Male | Female |
| No Vehicle | 0 (0.0%) | 68 (6.1%) |
| 1 Vehicle | 281 (29.6%) | 326 (29.1%) |
| 2 Vehicles | 542 (57.2%) | 546 (48.7%) |
| 3 Vehicles | 125 (13.2%) | 180 (16.1%) |
| 4 Vehicles | 0 (0.0%) | 0 (0.0%) |
| 5 or more Vehicles | 0 (0.0%) | 0 (0.0%) |
| Total | 948 (100.0%) | 1,120 (100.0%) |
Commute Time in Piney
The most frequently occuring commute durations in Piney are 15 to 19 minutes (607 commuters, 32.0%), 10 to 14 minutes (386 commuters, 20.3%), and less than 5 minutes (231 commuters, 12.2%).
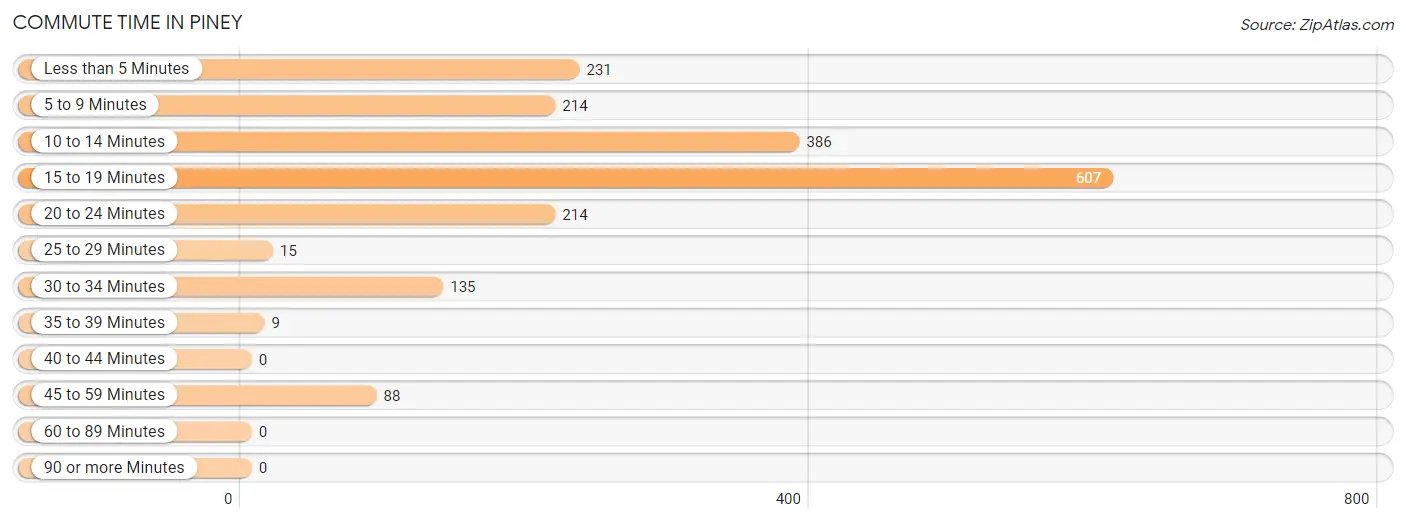
| Commute Time | # Commuters | % Commuters |
| Less than 5 Minutes | 231 | 12.2% |
| 5 to 9 Minutes | 214 | 11.3% |
| 10 to 14 Minutes | 386 | 20.3% |
| 15 to 19 Minutes | 607 | 32.0% |
| 20 to 24 Minutes | 214 | 11.3% |
| 25 to 29 Minutes | 15 | 0.8% |
| 30 to 34 Minutes | 135 | 7.1% |
| 35 to 39 Minutes | 9 | 0.5% |
| 40 to 44 Minutes | 0 | 0.0% |
| 45 to 59 Minutes | 88 | 4.6% |
| 60 to 89 Minutes | 0 | 0.0% |
| 90 or more Minutes | 0 | 0.0% |
Commute Time by Sex in Piney
The most common commute times in Piney are 15 to 19 minutes (353 commuters, 43.9%) for males and 15 to 19 minutes (254 commuters, 23.2%) for females.
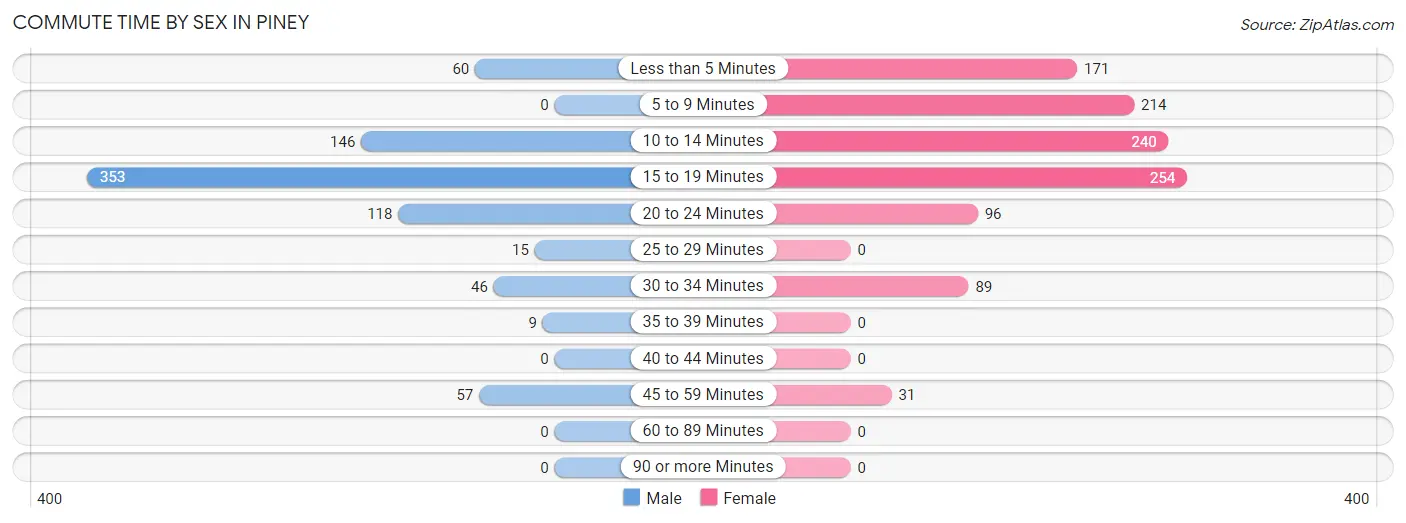
| Commute Time | Male | Female |
| Less than 5 Minutes | 60 (7.5%) | 171 (15.6%) |
| 5 to 9 Minutes | 0 (0.0%) | 214 (19.5%) |
| 10 to 14 Minutes | 146 (18.2%) | 240 (21.9%) |
| 15 to 19 Minutes | 353 (43.9%) | 254 (23.2%) |
| 20 to 24 Minutes | 118 (14.7%) | 96 (8.8%) |
| 25 to 29 Minutes | 15 (1.9%) | 0 (0.0%) |
| 30 to 34 Minutes | 46 (5.7%) | 89 (8.1%) |
| 35 to 39 Minutes | 9 (1.1%) | 0 (0.0%) |
| 40 to 44 Minutes | 0 (0.0%) | 0 (0.0%) |
| 45 to 59 Minutes | 57 (7.1%) | 31 (2.8%) |
| 60 to 89 Minutes | 0 (0.0%) | 0 (0.0%) |
| 90 or more Minutes | 0 (0.0%) | 0 (0.0%) |
Time of Departure to Work by Sex in Piney
The most frequent times of departure to work in Piney are 7:00 AM to 7:29 AM (165, 20.5%) for males and 8:00 AM to 8:29 AM (250, 22.8%) for females.
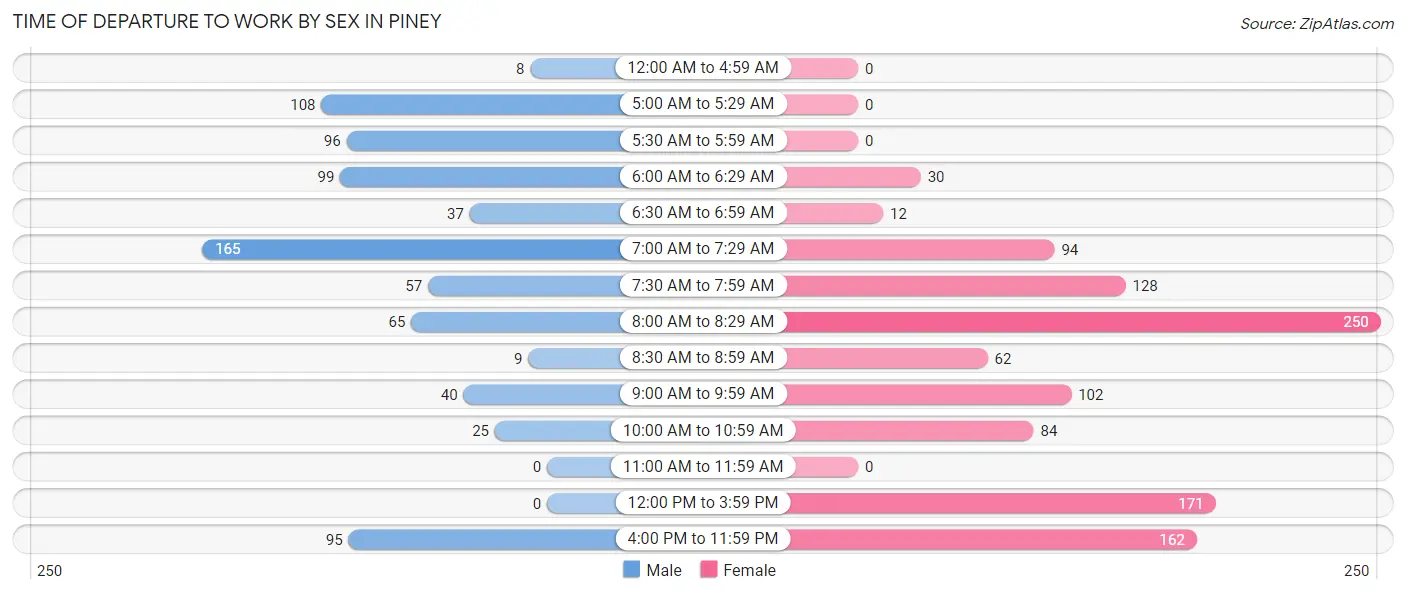
| Time of Departure | Male | Female |
| 12:00 AM to 4:59 AM | 8 (1.0%) | 0 (0.0%) |
| 5:00 AM to 5:29 AM | 108 (13.4%) | 0 (0.0%) |
| 5:30 AM to 5:59 AM | 96 (11.9%) | 0 (0.0%) |
| 6:00 AM to 6:29 AM | 99 (12.3%) | 30 (2.7%) |
| 6:30 AM to 6:59 AM | 37 (4.6%) | 12 (1.1%) |
| 7:00 AM to 7:29 AM | 165 (20.5%) | 94 (8.6%) |
| 7:30 AM to 7:59 AM | 57 (7.1%) | 128 (11.7%) |
| 8:00 AM to 8:29 AM | 65 (8.1%) | 250 (22.8%) |
| 8:30 AM to 8:59 AM | 9 (1.1%) | 62 (5.7%) |
| 9:00 AM to 9:59 AM | 40 (5.0%) | 102 (9.3%) |
| 10:00 AM to 10:59 AM | 25 (3.1%) | 84 (7.7%) |
| 11:00 AM to 11:59 AM | 0 (0.0%) | 0 (0.0%) |
| 12:00 PM to 3:59 PM | 0 (0.0%) | 171 (15.6%) |
| 4:00 PM to 11:59 PM | 95 (11.8%) | 162 (14.8%) |
| Total | 804 (100.0%) | 1,095 (100.0%) |
Housing Occupancy in Piney
Occupancy by Ownership in Piney
Of the total 1,892 dwellings in Piney, owner-occupied units account for 912 (48.2%), while renter-occupied units make up 980 (51.8%).
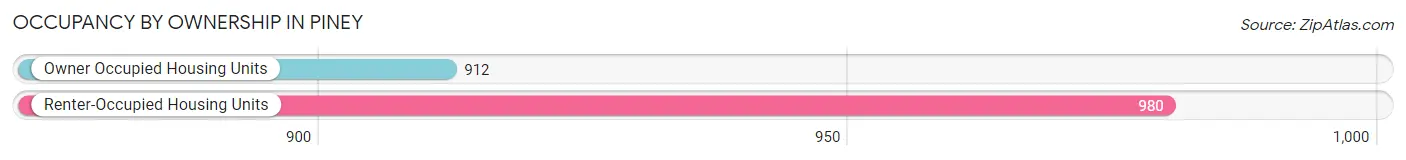
| Occupancy | # Housing Units | % Housing Units |
| Owner Occupied Housing Units | 912 | 48.2% |
| Renter-Occupied Housing Units | 980 | 51.8% |
| Total Occupied Housing Units | 1,892 | 100.0% |
Occupancy by Household Size in Piney
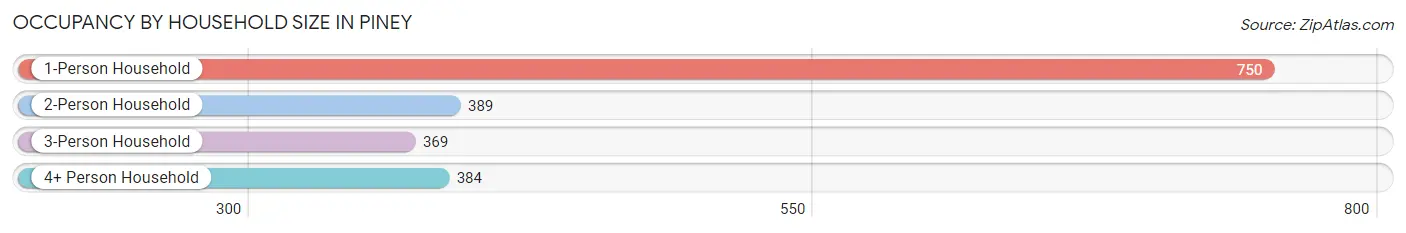
| Household Size | # Housing Units | % Housing Units |
| 1-Person Household | 750 | 39.6% |
| 2-Person Household | 389 | 20.6% |
| 3-Person Household | 369 | 19.5% |
| 4+ Person Household | 384 | 20.3% |
| Total Housing Units | 1,892 | 100.0% |
Occupancy by Ownership by Household Size in Piney
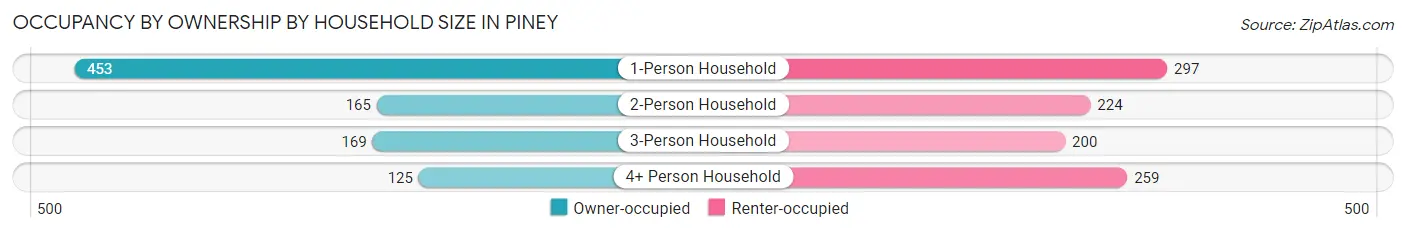
| Household Size | Owner-occupied | Renter-occupied |
| 1-Person Household | 453 (60.4%) | 297 (39.6%) |
| 2-Person Household | 165 (42.4%) | 224 (57.6%) |
| 3-Person Household | 169 (45.8%) | 200 (54.2%) |
| 4+ Person Household | 125 (32.6%) | 259 (67.4%) |
| Total Housing Units | 912 (48.2%) | 980 (51.8%) |
Occupancy by Educational Attainment in Piney
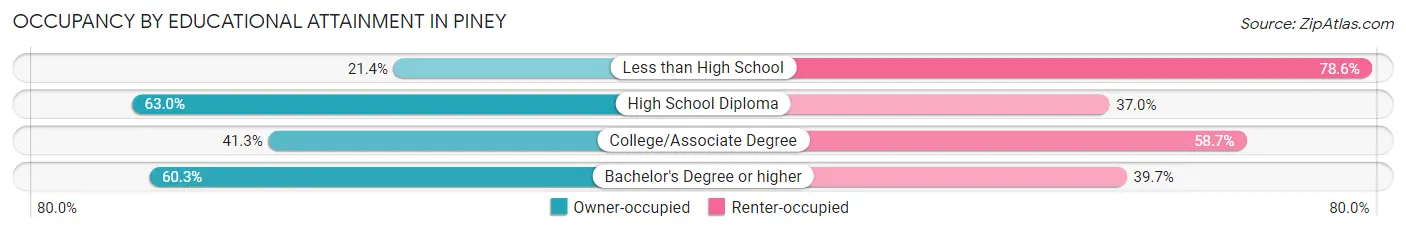
| Household Size | Owner-occupied | Renter-occupied |
| Less than High School | 42 (21.4%) | 154 (78.6%) |
| High School Diploma | 288 (63.0%) | 169 (37.0%) |
| College/Associate Degree | 359 (41.3%) | 510 (58.7%) |
| Bachelor's Degree or higher | 223 (60.3%) | 147 (39.7%) |
Occupancy by Age of Householder in Piney
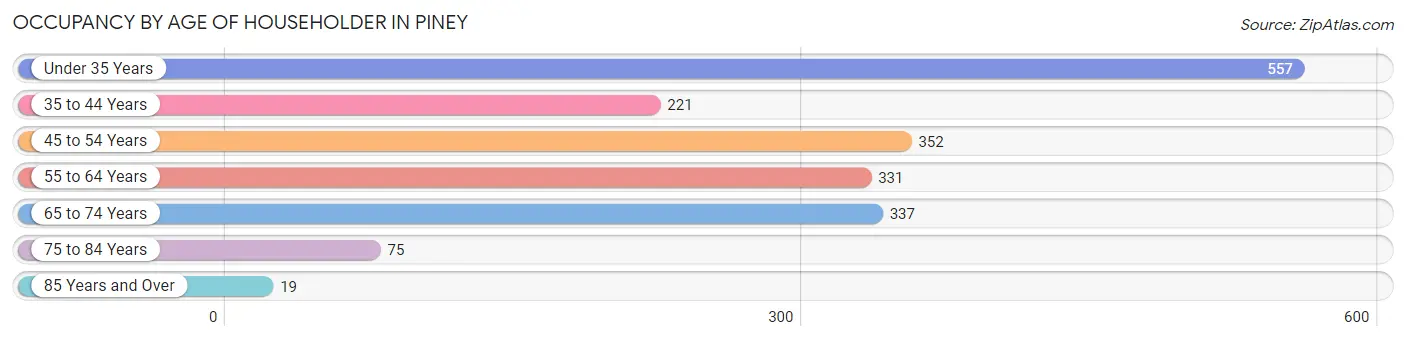
| Age Bracket | # Households | % Households |
| Under 35 Years | 557 | 29.4% |
| 35 to 44 Years | 221 | 11.7% |
| 45 to 54 Years | 352 | 18.6% |
| 55 to 64 Years | 331 | 17.5% |
| 65 to 74 Years | 337 | 17.8% |
| 75 to 84 Years | 75 | 4.0% |
| 85 Years and Over | 19 | 1.0% |
| Total | 1,892 | 100.0% |
Housing Finances in Piney
Median Income by Occupancy in Piney
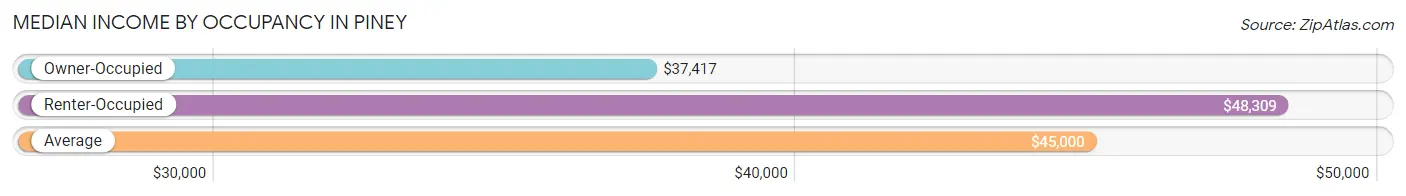
| Occupancy Type | # Households | Median Income |
| Owner-Occupied | 912 (48.2%) | $37,417 |
| Renter-Occupied | 980 (51.8%) | $48,309 |
| Average | 1,892 (100.0%) | $45,000 |
Occupancy by Householder Income Bracket in Piney
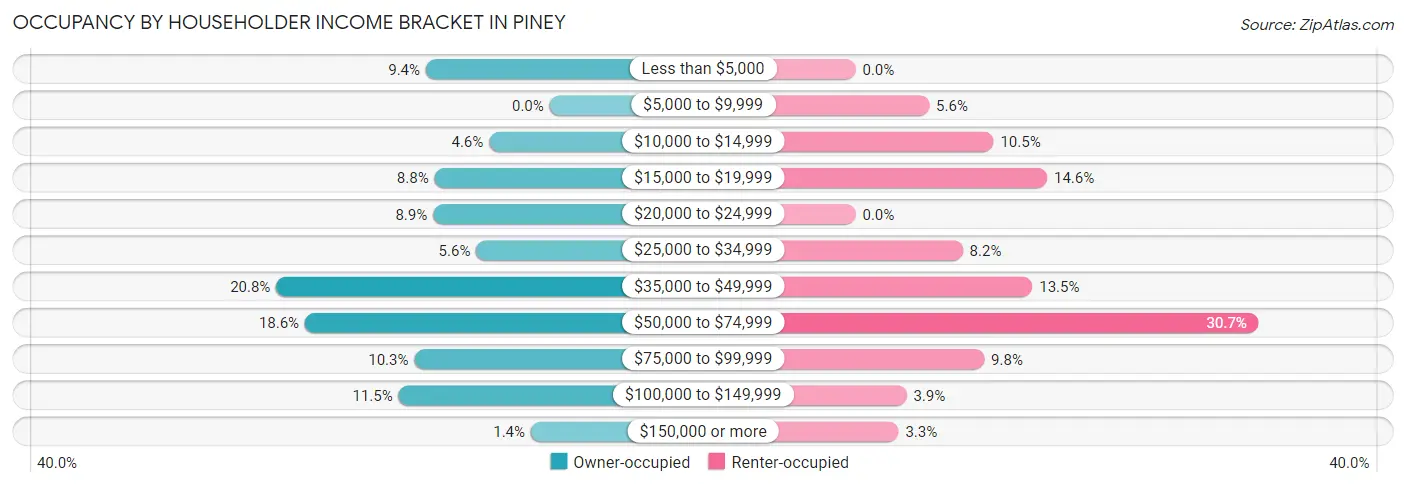
| Income Bracket | Owner-occupied | Renter-occupied |
| Less than $5,000 | 86 (9.4%) | 0 (0.0%) |
| $5,000 to $9,999 | 0 (0.0%) | 55 (5.6%) |
| $10,000 to $14,999 | 42 (4.6%) | 103 (10.5%) |
| $15,000 to $19,999 | 80 (8.8%) | 143 (14.6%) |
| $20,000 to $24,999 | 81 (8.9%) | 0 (0.0%) |
| $25,000 to $34,999 | 51 (5.6%) | 80 (8.2%) |
| $35,000 to $49,999 | 190 (20.8%) | 132 (13.5%) |
| $50,000 to $74,999 | 170 (18.6%) | 301 (30.7%) |
| $75,000 to $99,999 | 94 (10.3%) | 96 (9.8%) |
| $100,000 to $149,999 | 105 (11.5%) | 38 (3.9%) |
| $150,000 or more | 13 (1.4%) | 32 (3.3%) |
| Total | 912 (100.0%) | 980 (100.0%) |
Monthly Housing Cost Tiers in Piney
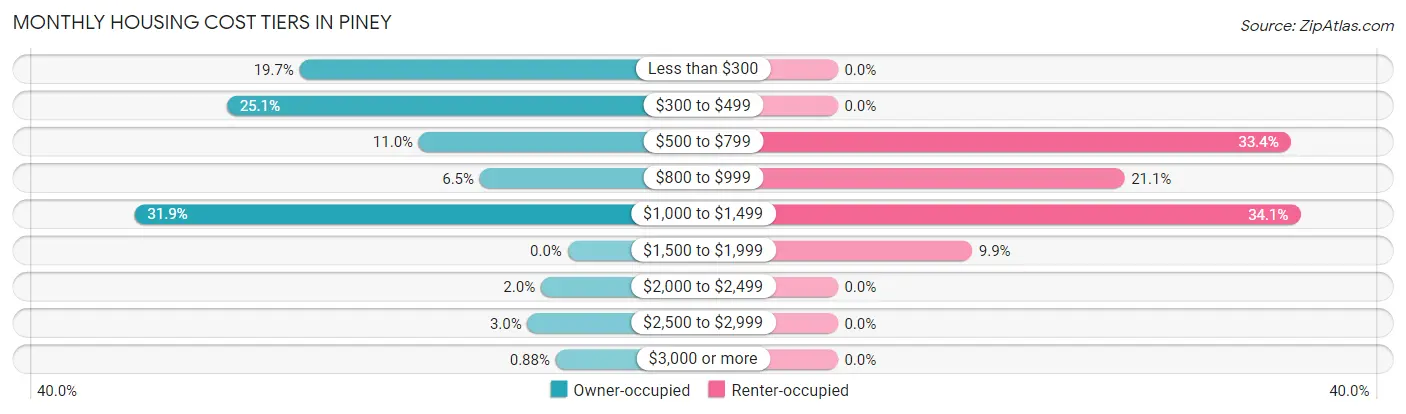
| Monthly Cost | Owner-occupied | Renter-occupied |
| Less than $300 | 180 (19.7%) | 0 (0.0%) |
| $300 to $499 | 229 (25.1%) | 0 (0.0%) |
| $500 to $799 | 100 (11.0%) | 327 (33.4%) |
| $800 to $999 | 59 (6.5%) | 207 (21.1%) |
| $1,000 to $1,499 | 291 (31.9%) | 334 (34.1%) |
| $1,500 to $1,999 | 0 (0.0%) | 97 (9.9%) |
| $2,000 to $2,499 | 18 (2.0%) | 0 (0.0%) |
| $2,500 to $2,999 | 27 (3.0%) | 0 (0.0%) |
| $3,000 or more | 8 (0.9%) | 0 (0.0%) |
| Total | 912 (100.0%) | 980 (100.0%) |
Physical Housing Characteristics in Piney
Housing Structures in Piney
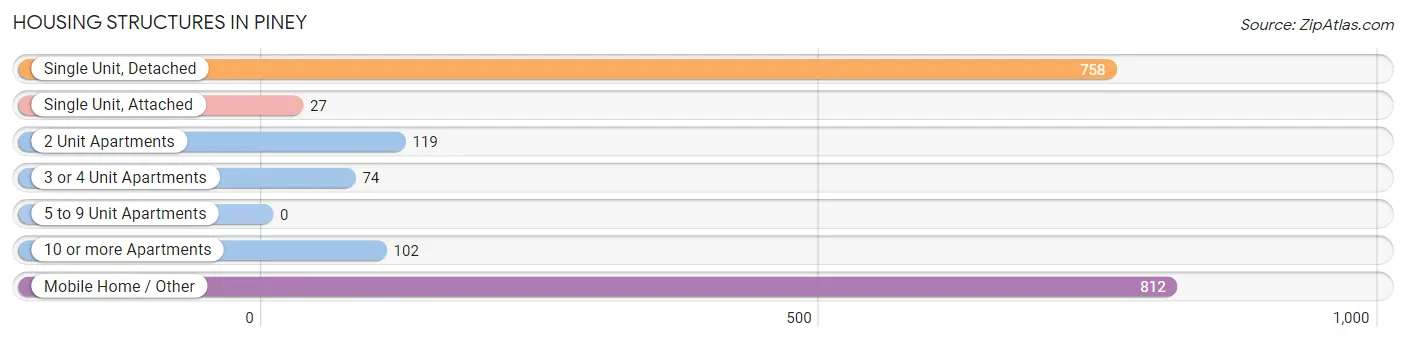
| Structure Type | # Housing Units | % Housing Units |
| Single Unit, Detached | 758 | 40.1% |
| Single Unit, Attached | 27 | 1.4% |
| 2 Unit Apartments | 119 | 6.3% |
| 3 or 4 Unit Apartments | 74 | 3.9% |
| 5 to 9 Unit Apartments | 0 | 0.0% |
| 10 or more Apartments | 102 | 5.4% |
| Mobile Home / Other | 812 | 42.9% |
| Total | 1,892 | 100.0% |
Housing Structures by Occupancy in Piney
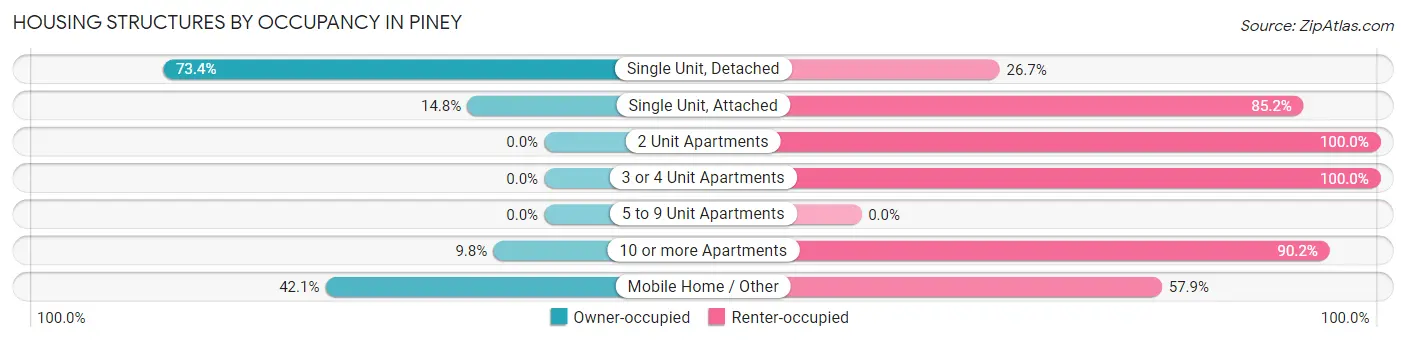
| Structure Type | Owner-occupied | Renter-occupied |
| Single Unit, Detached | 556 (73.4%) | 202 (26.7%) |
| Single Unit, Attached | 4 (14.8%) | 23 (85.2%) |
| 2 Unit Apartments | 0 (0.0%) | 119 (100.0%) |
| 3 or 4 Unit Apartments | 0 (0.0%) | 74 (100.0%) |
| 5 to 9 Unit Apartments | 0 (0.0%) | 0 (0.0%) |
| 10 or more Apartments | 10 (9.8%) | 92 (90.2%) |
| Mobile Home / Other | 342 (42.1%) | 470 (57.9%) |
| Total | 912 (48.2%) | 980 (51.8%) |
Housing Structures by Number of Rooms in Piney
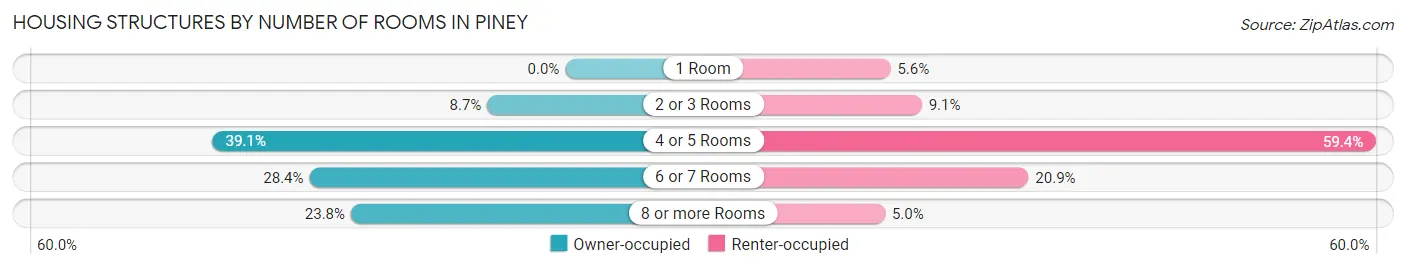
| Number of Rooms | Owner-occupied | Renter-occupied |
| 1 Room | 0 (0.0%) | 55 (5.6%) |
| 2 or 3 Rooms | 79 (8.7%) | 89 (9.1%) |
| 4 or 5 Rooms | 357 (39.1%) | 582 (59.4%) |
| 6 or 7 Rooms | 259 (28.4%) | 205 (20.9%) |
| 8 or more Rooms | 217 (23.8%) | 49 (5.0%) |
| Total | 912 (100.0%) | 980 (100.0%) |
Housing Structure by Heating Type in Piney
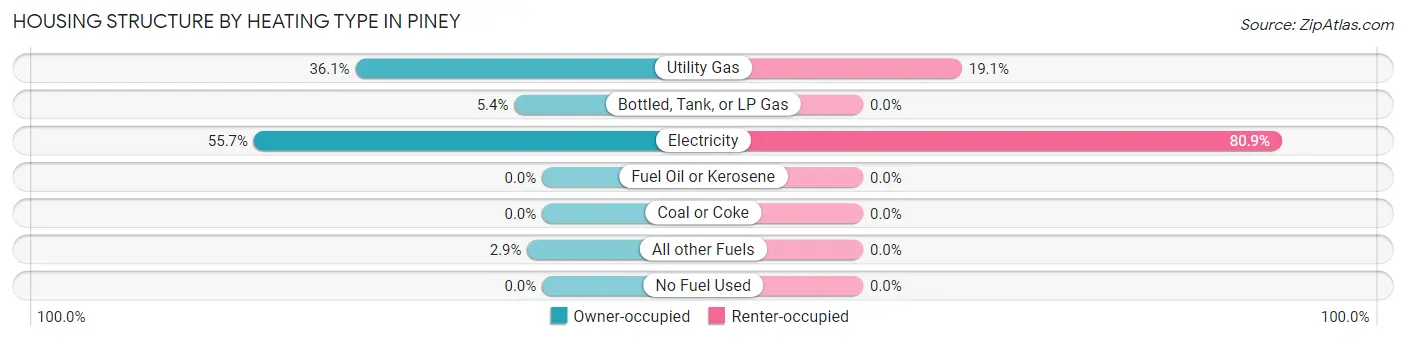
| Heating Type | Owner-occupied | Renter-occupied |
| Utility Gas | 329 (36.1%) | 187 (19.1%) |
| Bottled, Tank, or LP Gas | 49 (5.4%) | 0 (0.0%) |
| Electricity | 508 (55.7%) | 793 (80.9%) |
| Fuel Oil or Kerosene | 0 (0.0%) | 0 (0.0%) |
| Coal or Coke | 0 (0.0%) | 0 (0.0%) |
| All other Fuels | 26 (2.9%) | 0 (0.0%) |
| No Fuel Used | 0 (0.0%) | 0 (0.0%) |
| Total | 912 (100.0%) | 980 (100.0%) |
Household Vehicle Usage in Piney
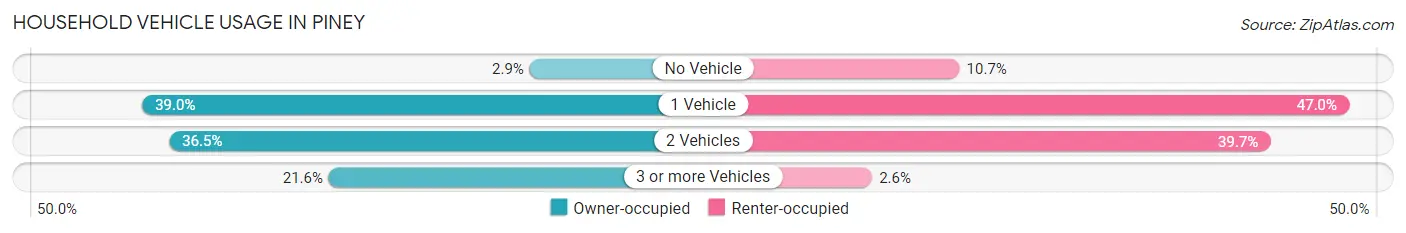
| Vehicles per Household | Owner-occupied | Renter-occupied |
| No Vehicle | 26 (2.9%) | 105 (10.7%) |
| 1 Vehicle | 356 (39.0%) | 461 (47.0%) |
| 2 Vehicles | 333 (36.5%) | 389 (39.7%) |
| 3 or more Vehicles | 197 (21.6%) | 25 (2.5%) |
| Total | 912 (100.0%) | 980 (100.0%) |
Real Estate & Mortgages in Piney
Real Estate and Mortgage Overview in Piney
| Characteristic | Without Mortgage | With Mortgage |
| Housing Units | 464 | 448 |
| Median Property Value | $121,200 | $102,300 |
| Median Household Income | $36,016 | $13 |
| Monthly Housing Costs | $346 | $8 |
| Real Estate Taxes | $572 | $18 |
Property Value by Mortgage Status in Piney
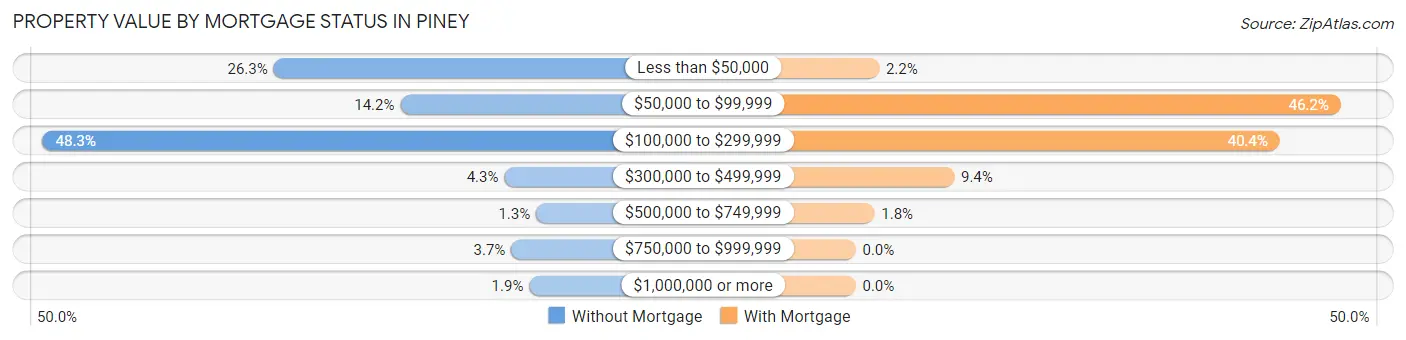
| Property Value | Without Mortgage | With Mortgage |
| Less than $50,000 | 122 (26.3%) | 10 (2.2%) |
| $50,000 to $99,999 | 66 (14.2%) | 207 (46.2%) |
| $100,000 to $299,999 | 224 (48.3%) | 181 (40.4%) |
| $300,000 to $499,999 | 20 (4.3%) | 42 (9.4%) |
| $500,000 to $749,999 | 6 (1.3%) | 8 (1.8%) |
| $750,000 to $999,999 | 17 (3.7%) | 0 (0.0%) |
| $1,000,000 or more | 9 (1.9%) | 0 (0.0%) |
| Total | 464 (100.0%) | 448 (100.0%) |
Household Income by Mortgage Status in Piney
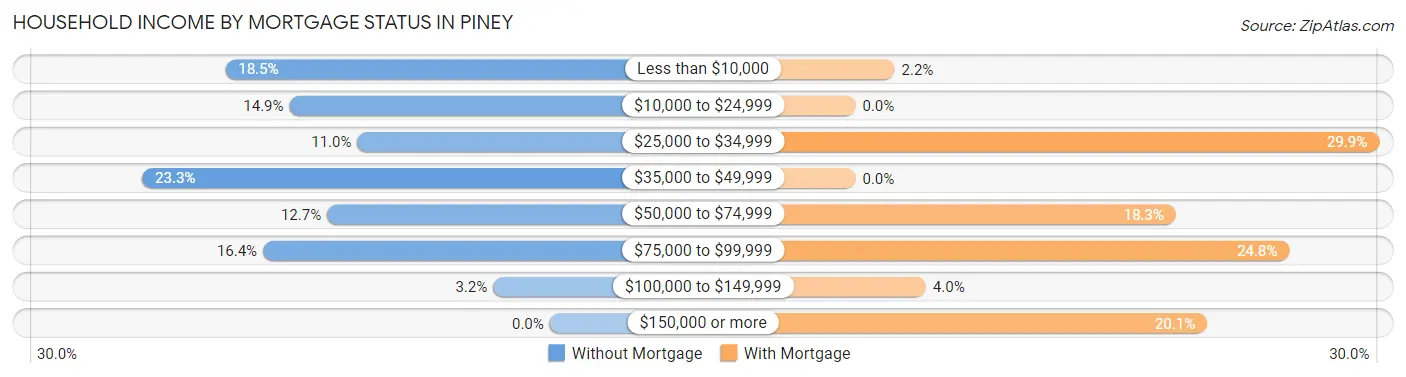
| Household Income | Without Mortgage | With Mortgage |
| Less than $10,000 | 86 (18.5%) | 10 (2.2%) |
| $10,000 to $24,999 | 69 (14.9%) | 0 (0.0%) |
| $25,000 to $34,999 | 51 (11.0%) | 134 (29.9%) |
| $35,000 to $49,999 | 108 (23.3%) | 0 (0.0%) |
| $50,000 to $74,999 | 59 (12.7%) | 82 (18.3%) |
| $75,000 to $99,999 | 76 (16.4%) | 111 (24.8%) |
| $100,000 to $149,999 | 15 (3.2%) | 18 (4.0%) |
| $150,000 or more | 0 (0.0%) | 90 (20.1%) |
| Total | 464 (100.0%) | 448 (100.0%) |
Property Value to Household Income Ratio in Piney
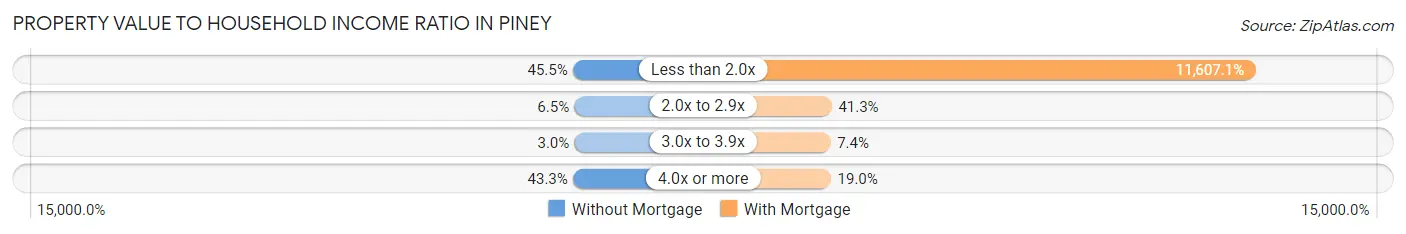
| Value-to-Income Ratio | Without Mortgage | With Mortgage |
| Less than 2.0x | 211 (45.5%) | 52,000 (11,607.1%) |
| 2.0x to 2.9x | 30 (6.5%) | 185 (41.3%) |
| 3.0x to 3.9x | 14 (3.0%) | 33 (7.4%) |
| 4.0x or more | 201 (43.3%) | 85 (19.0%) |
| Total | 464 (100.0%) | 448 (100.0%) |
Real Estate Taxes by Mortgage Status in Piney
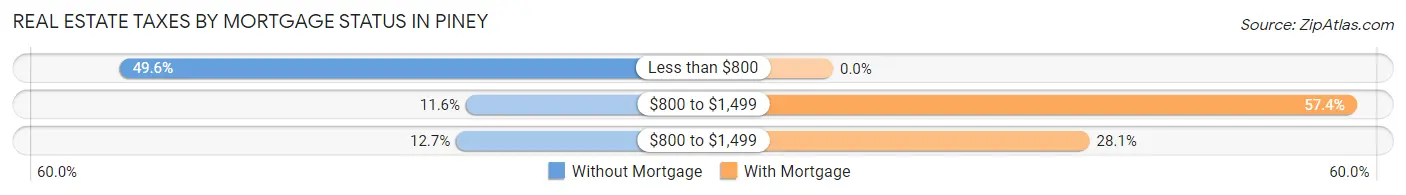
| Property Taxes | Without Mortgage | With Mortgage |
| Less than $800 | 230 (49.6%) | 0 (0.0%) |
| $800 to $1,499 | 54 (11.6%) | 257 (57.4%) |
| $800 to $1,499 | 59 (12.7%) | 126 (28.1%) |
| Total | 464 (100.0%) | 448 (100.0%) |
Health & Disability in Piney
Health Insurance Coverage by Age in Piney
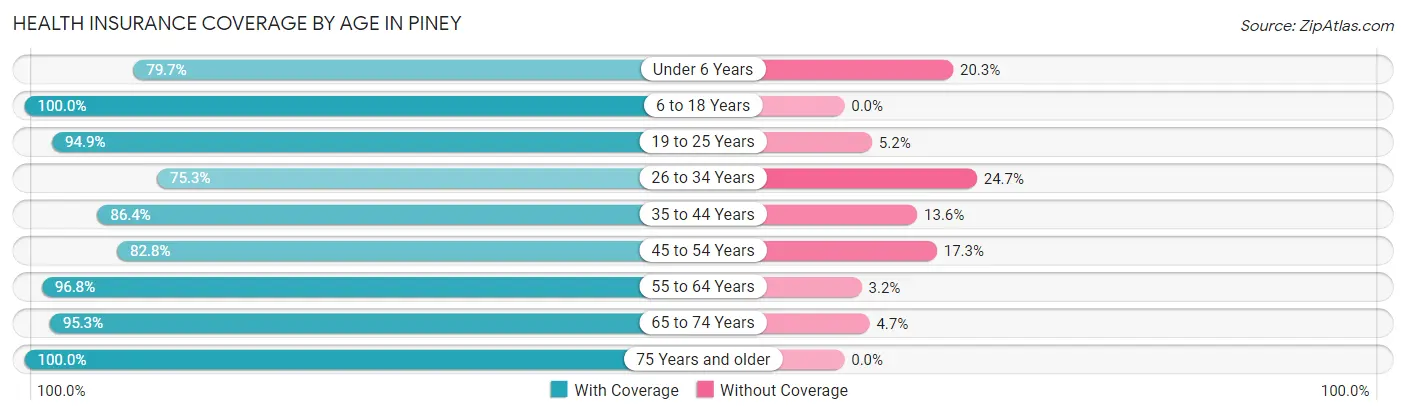
| Age Bracket | With Coverage | Without Coverage |
| Under 6 Years | 338 (79.7%) | 86 (20.3%) |
| 6 to 18 Years | 952 (100.0%) | 0 (0.0%) |
| 19 to 25 Years | 221 (94.9%) | 12 (5.1%) |
| 26 to 34 Years | 594 (75.3%) | 195 (24.7%) |
| 35 to 44 Years | 471 (86.4%) | 74 (13.6%) |
| 45 to 54 Years | 422 (82.8%) | 88 (17.2%) |
| 55 to 64 Years | 420 (96.8%) | 14 (3.2%) |
| 65 to 74 Years | 426 (95.3%) | 21 (4.7%) |
| 75 Years and older | 183 (100.0%) | 0 (0.0%) |
| Total | 4,027 (89.1%) | 490 (10.8%) |
Health Insurance Coverage by Citizenship Status in Piney
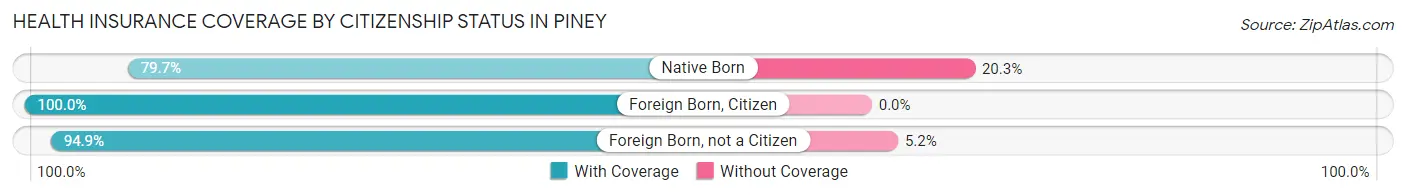
| Citizenship Status | With Coverage | Without Coverage |
| Native Born | 338 (79.7%) | 86 (20.3%) |
| Foreign Born, Citizen | 952 (100.0%) | 0 (0.0%) |
| Foreign Born, not a Citizen | 221 (94.9%) | 12 (5.1%) |
Health Insurance Coverage by Household Income in Piney
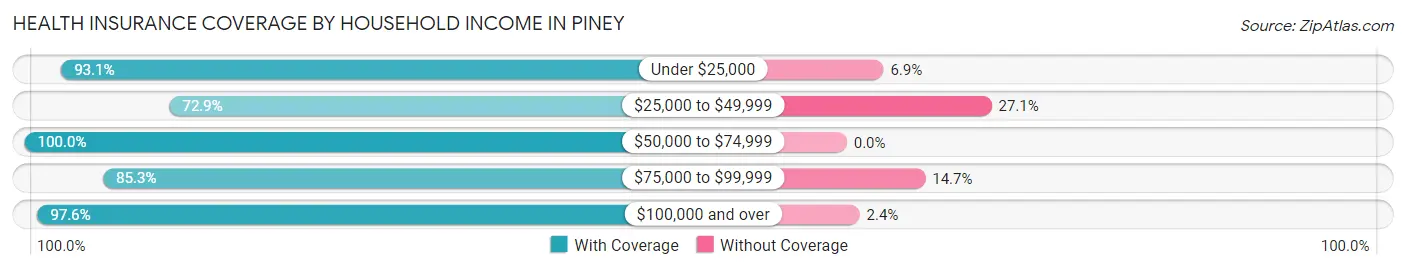
| Household Income | With Coverage | Without Coverage |
| Under $25,000 | 1,030 (93.1%) | 76 (6.9%) |
| $25,000 to $49,999 | 884 (72.9%) | 329 (27.1%) |
| $50,000 to $74,999 | 1,132 (100.0%) | 0 (0.0%) |
| $75,000 to $99,999 | 412 (85.3%) | 71 (14.7%) |
| $100,000 and over | 569 (97.6%) | 14 (2.4%) |
Public vs Private Health Insurance Coverage by Age in Piney
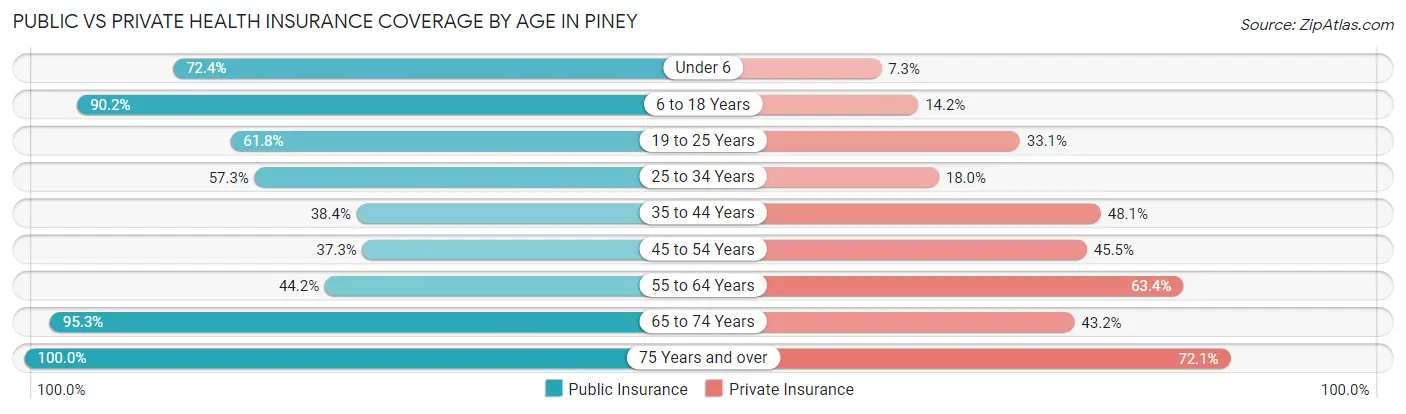
| Age Bracket | Public Insurance | Private Insurance |
| Under 6 | 307 (72.4%) | 31 (7.3%) |
| 6 to 18 Years | 859 (90.2%) | 135 (14.2%) |
| 19 to 25 Years | 144 (61.8%) | 77 (33.1%) |
| 25 to 34 Years | 452 (57.3%) | 142 (18.0%) |
| 35 to 44 Years | 209 (38.4%) | 262 (48.1%) |
| 45 to 54 Years | 190 (37.2%) | 232 (45.5%) |
| 55 to 64 Years | 192 (44.2%) | 275 (63.4%) |
| 65 to 74 Years | 426 (95.3%) | 193 (43.2%) |
| 75 Years and over | 183 (100.0%) | 132 (72.1%) |
| Total | 2,962 (65.6%) | 1,479 (32.7%) |
Disability Status by Sex by Age in Piney
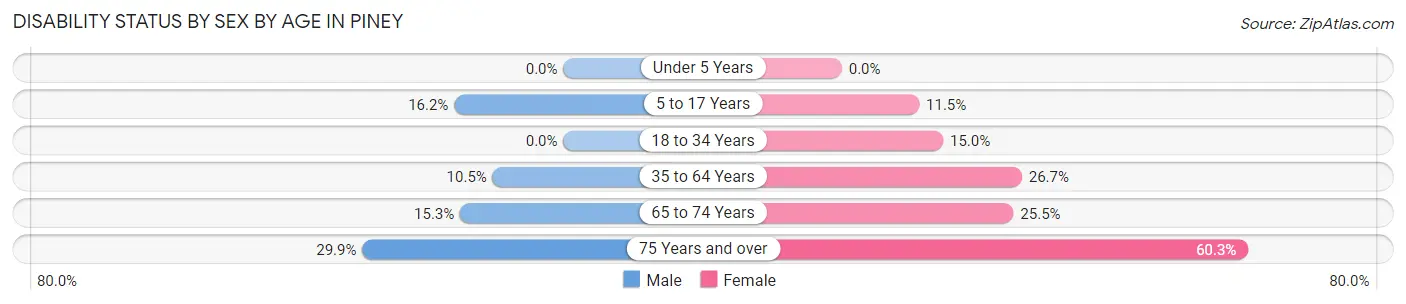
| Age Bracket | Male | Female |
| Under 5 Years | 0 (0.0%) | 0 (0.0%) |
| 5 to 17 Years | 88 (16.2%) | 52 (11.5%) |
| 18 to 34 Years | 0 (0.0%) | 98 (15.0%) |
| 35 to 64 Years | 88 (10.5%) | 174 (26.7%) |
| 65 to 74 Years | 21 (15.3%) | 79 (25.5%) |
| 75 Years and over | 20 (29.8%) | 70 (60.3%) |
Disability Class by Sex by Age in Piney
Disability Class: Hearing Difficulty
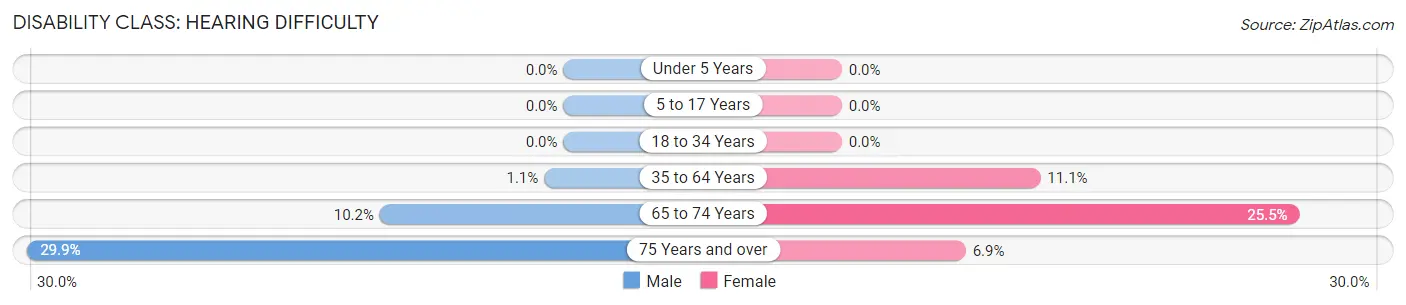
| Age Bracket | Male | Female |
| Under 5 Years | 0 (0.0%) | 0 (0.0%) |
| 5 to 17 Years | 0 (0.0%) | 0 (0.0%) |
| 18 to 34 Years | 0 (0.0%) | 0 (0.0%) |
| 35 to 64 Years | 9 (1.1%) | 72 (11.1%) |
| 65 to 74 Years | 14 (10.2%) | 79 (25.5%) |
| 75 Years and over | 20 (29.8%) | 8 (6.9%) |
Disability Class: Vision Difficulty
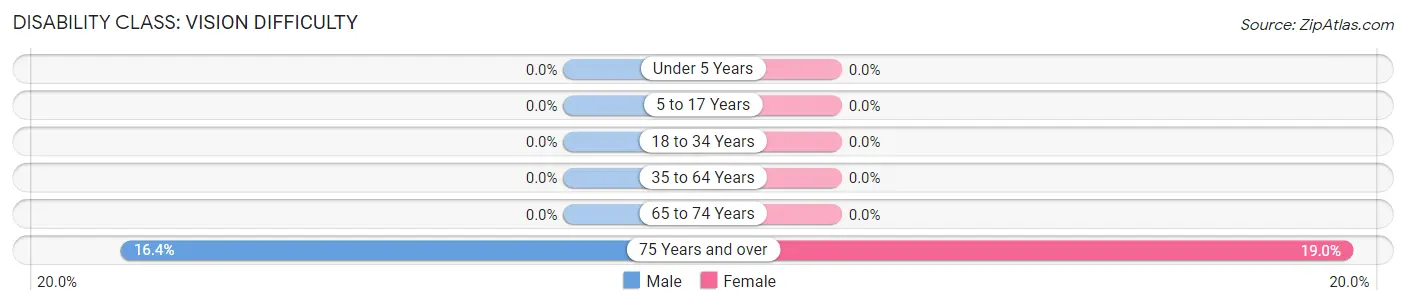
| Age Bracket | Male | Female |
| Under 5 Years | 0 (0.0%) | 0 (0.0%) |
| 5 to 17 Years | 0 (0.0%) | 0 (0.0%) |
| 18 to 34 Years | 0 (0.0%) | 0 (0.0%) |
| 35 to 64 Years | 0 (0.0%) | 0 (0.0%) |
| 65 to 74 Years | 0 (0.0%) | 0 (0.0%) |
| 75 Years and over | 11 (16.4%) | 22 (19.0%) |
Disability Class: Cognitive Difficulty
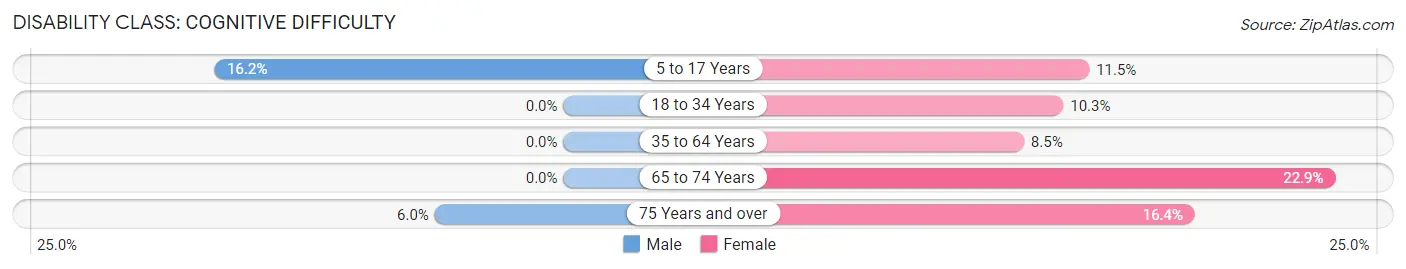
| Age Bracket | Male | Female |
| 5 to 17 Years | 88 (16.2%) | 52 (11.5%) |
| 18 to 34 Years | 0 (0.0%) | 67 (10.3%) |
| 35 to 64 Years | 0 (0.0%) | 55 (8.5%) |
| 65 to 74 Years | 0 (0.0%) | 71 (22.9%) |
| 75 Years and over | 4 (6.0%) | 19 (16.4%) |
Disability Class: Ambulatory Difficulty
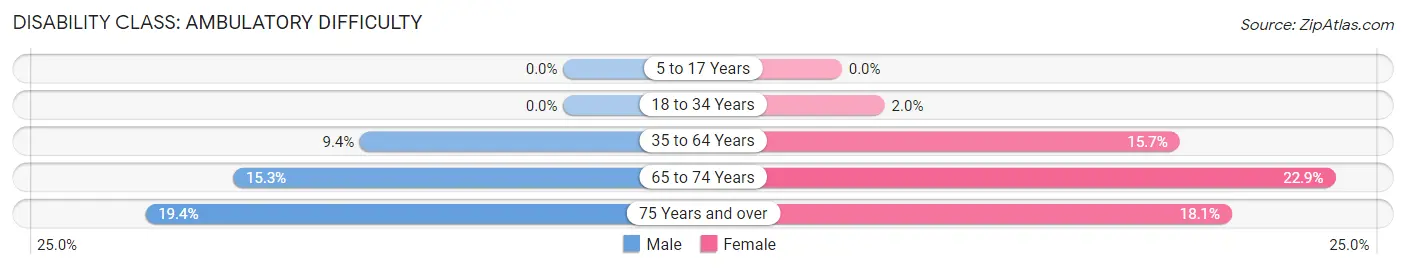
| Age Bracket | Male | Female |
| 5 to 17 Years | 0 (0.0%) | 0 (0.0%) |
| 18 to 34 Years | 0 (0.0%) | 13 (2.0%) |
| 35 to 64 Years | 79 (9.4%) | 102 (15.7%) |
| 65 to 74 Years | 21 (15.3%) | 71 (22.9%) |
| 75 Years and over | 13 (19.4%) | 21 (18.1%) |
Disability Class: Self-Care Difficulty
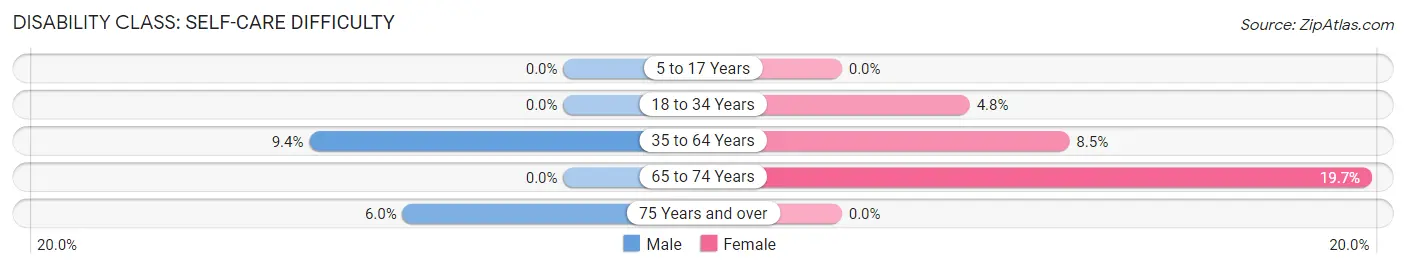
| Age Bracket | Male | Female |
| 5 to 17 Years | 0 (0.0%) | 0 (0.0%) |
| 18 to 34 Years | 0 (0.0%) | 31 (4.8%) |
| 35 to 64 Years | 79 (9.4%) | 55 (8.5%) |
| 65 to 74 Years | 0 (0.0%) | 61 (19.7%) |
| 75 Years and over | 4 (6.0%) | 0 (0.0%) |
Technology Access in Piney
Computing Device Access in Piney
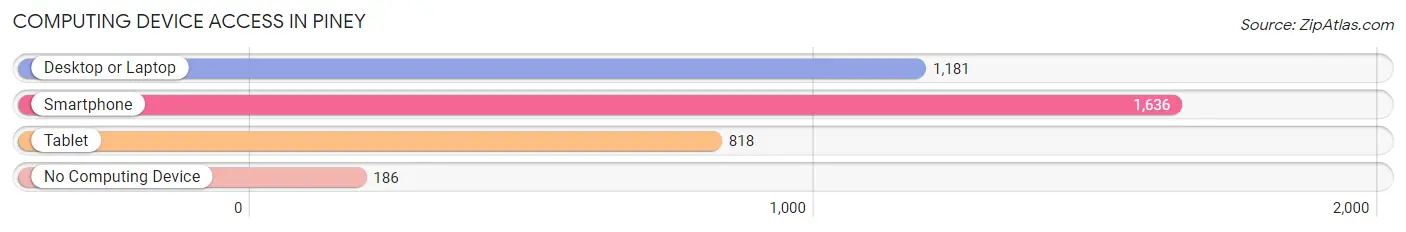
| Device Type | # Households | % Households |
| Desktop or Laptop | 1,181 | 62.4% |
| Smartphone | 1,636 | 86.5% |
| Tablet | 818 | 43.2% |
| No Computing Device | 186 | 9.8% |
| Total | 1,892 | 100.0% |
Internet Access in Piney
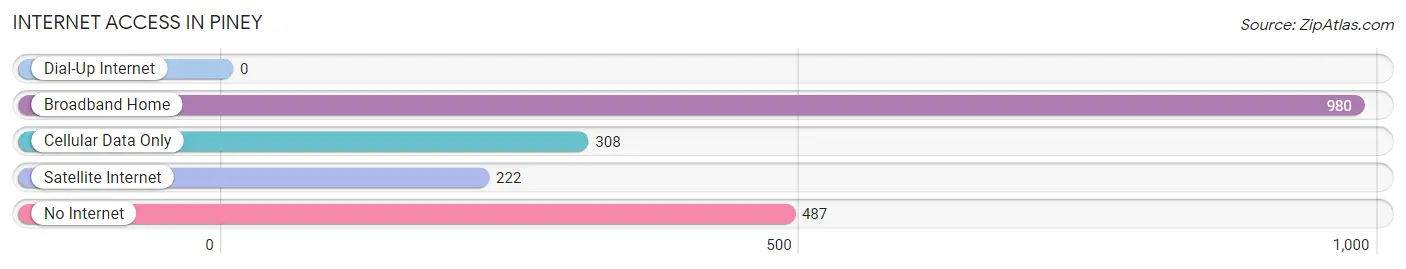
| Internet Type | # Households | % Households |
| Dial-Up Internet | 0 | 0.0% |
| Broadband Home | 980 | 51.8% |
| Cellular Data Only | 308 | 16.3% |
| Satellite Internet | 222 | 11.7% |
| No Internet | 487 | 25.7% |
| Total | 1,892 | 100.0% |
Piney Summary
Piney is a small unincorporated community located in Johnson County, Arkansas. It is situated in the Ozark Mountains, approximately 10 miles south of Clarksville, the county seat. The community is located along the banks of the Little Piney Creek, which is a tributary of the Arkansas River. The population of Piney was estimated to be around 200 people in 2020.
Geography
Piney is located in the Ozark Mountains of northwest Arkansas. The community is situated in the foothills of the Ozarks, approximately 10 miles south of Clarksville, the county seat. The terrain is mostly hilly and forested, with some open fields and pastures. The Little Piney Creek runs through the community, and is a tributary of the Arkansas River. The climate is humid subtropical, with hot summers and mild winters.
Economy
The economy of Piney is largely based on agriculture and forestry. The area is known for its production of timber, and the community is home to several sawmills and lumber yards. The area also produces hay, corn, soybeans, and other crops. There are also several small businesses in the area, including a general store, a gas station, and a few restaurants.
Demographics
The population of Piney was estimated to be around 200 people in 2020. The racial makeup of the community is predominantly white, with a small minority of African Americans. The median household income is around $30,000, and the median home value is around $90,000. The majority of the population is employed in the agricultural and forestry industries.
Conclusion
Piney is a small unincorporated community located in Johnson County, Arkansas. It is situated in the Ozark Mountains, approximately 10 miles south of Clarksville, the county seat. The population of Piney was estimated to be around 200 people in 2020. The economy of Piney is largely based on agriculture and forestry, and the majority of the population is employed in these industries. The racial makeup of the community is predominantly white, with a small minority of African Americans. The median household income is around $30,000, and the median home value is around $90,000.
Common Questions
What is Per Capita Income in Piney?
Per Capita income in Piney is $21,061.
What is the Median Family Income in Piney?
Median Family Income in Piney is $38,684.
What is the Median Household income in Piney?
Median Household Income in Piney is $45,000.
What is Income or Wage Gap in Piney?
Income or Wage Gap in Piney is 34.9%.
Women in Piney earn 65.1 cents for every dollar earned by a man.
What is Family Income Deficit in Piney?
Family Income Deficit in Piney is $8,717.
Families that are below poverty line in Piney earn $8,717 less on average than the poverty threshold level.
What is Inequality or Gini Index in Piney?
Inequality or Gini Index in Piney is 0.41.
What is the Total Population of Piney?
Total Population of Piney is 4,563.
What is the Total Male Population of Piney?
Total Male Population of Piney is 2,222.
What is the Total Female Population of Piney?
Total Female Population of Piney is 2,341.
What is the Ratio of Males per 100 Females in Piney?
There are 94.92 Males per 100 Females in Piney.
What is the Ratio of Females per 100 Males in Piney?
There are 105.36 Females per 100 Males in Piney.
What is the Median Population Age in Piney?
Median Population Age in Piney is 33.6 Years.
What is the Average Family Size in Piney
Average Family Size in Piney is 3.2 People.
What is the Average Household Size in Piney
Average Household Size in Piney is 2.4 People.
How Large is the Labor Force in Piney?
There are 2,214 People in the Labor Forcein in Piney.
What is the Percentage of People in the Labor Force in Piney?
67.1% of People are in the Labor Force in Piney.
What is the Unemployment Rate in Piney?
Unemployment Rate in Piney is 5.9%.