Melbourne, AR Map & Demographics
Melbourne Map
Melbourne Overview
$23,470
PER CAPITA INCOME
$55,161
AVG FAMILY INCOME
$41,938
AVG HOUSEHOLD INCOME
14.7%
WAGE / INCOME GAP [ % ]
85.3¢/ $1
WAGE / INCOME GAP [ $ ]
0.47
INEQUALITY / GINI INDEX
2,430
TOTAL POPULATION
1,281
MALE POPULATION
1,149
FEMALE POPULATION
111.49
MALES / 100 FEMALES
89.70
FEMALES / 100 MALES
32.5
MEDIAN AGE
3.5
AVG FAMILY SIZE
2.6
AVG HOUSEHOLD SIZE
907
LABOR FORCE [ PEOPLE ]
49.4%
PERCENT IN LABOR FORCE
5.9%
UNEMPLOYMENT RATE
Melbourne Zip Codes
Melbourne Area Codes
Income in Melbourne
Income Overview in Melbourne
Per Capita Income in Melbourne is $23,470, while median incomes of families and households are $55,161 and $41,938 respectively.
| Characteristic | Number | Measure |
| Per Capita Income | 2,430 | $23,470 |
| Median Family Income | 520 | $55,161 |
| Mean Family Income | 520 | $70,699 |
| Median Household Income | 873 | $41,938 |
| Mean Household Income | 873 | $61,236 |
| Income Deficit | 520 | $0 |
| Wage / Income Gap (%) | 2,430 | 14.69% |
| Wage / Income Gap ($) | 2,430 | 85.31¢ per $1 |
| Gini / Inequality Index | 2,430 | 0.47 |
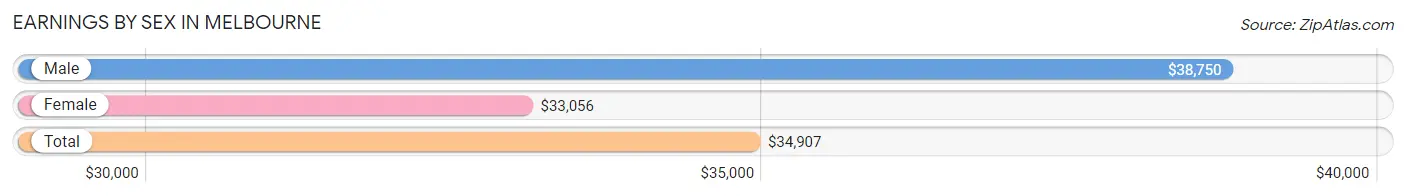
Earnings by Sex in Melbourne
Average Earnings in Melbourne are $34,907, $38,750 for men and $33,056 for women, a difference of 14.7%.
| Sex | Number | Average Earnings |
| Male | 582 (61.5%) | $38,750 |
| Female | 364 (38.5%) | $33,056 |
| Total | 946 (100.0%) | $34,907 |
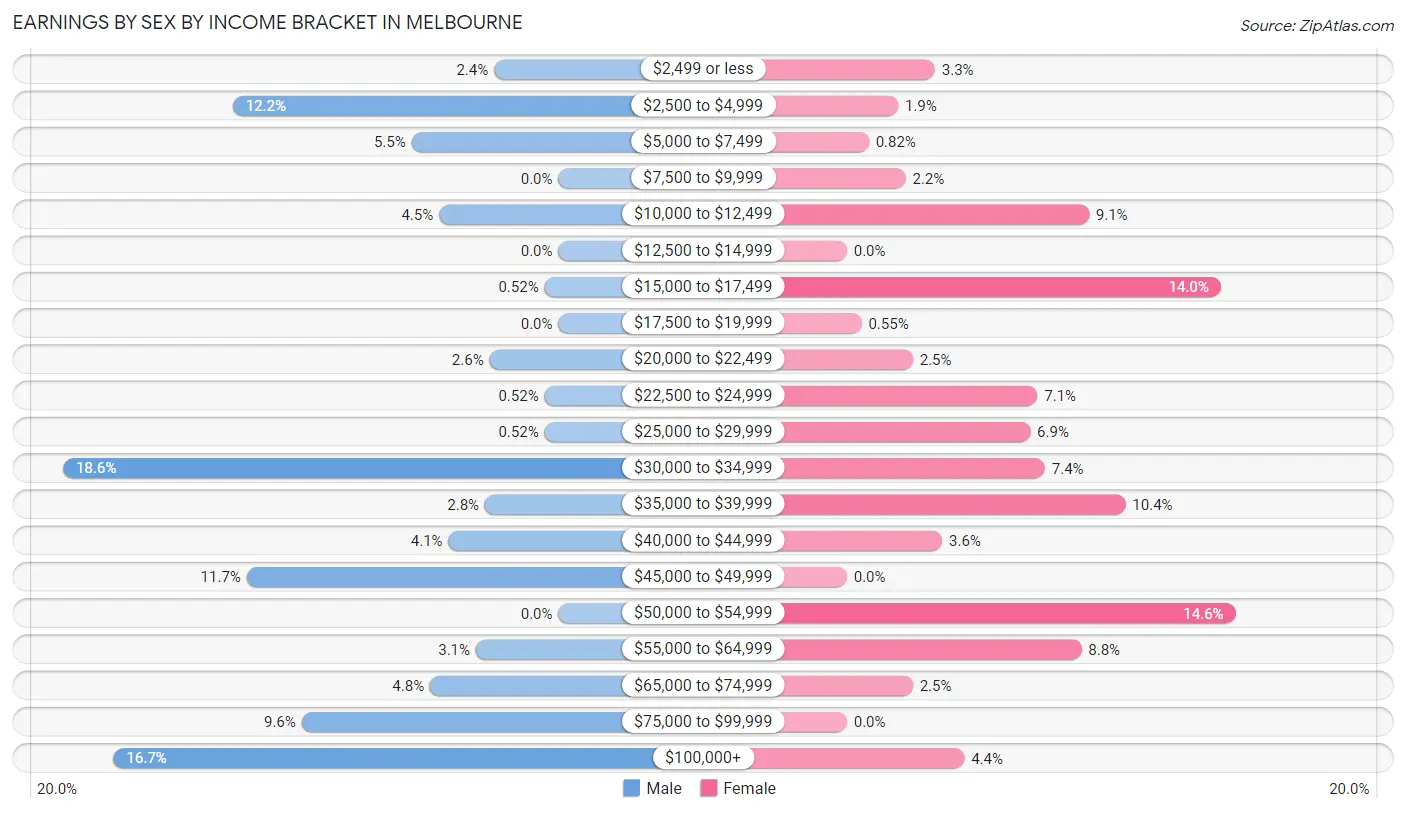
Earnings by Sex by Income Bracket in Melbourne
The most common earnings brackets in Melbourne are $30,000 to $34,999 for men (108 | 18.6%) and $50,000 to $54,999 for women (53 | 14.6%).
| Income | Male | Female |
| $2,499 or less | 14 (2.4%) | 12 (3.3%) |
| $2,500 to $4,999 | 71 (12.2%) | 7 (1.9%) |
| $5,000 to $7,499 | 32 (5.5%) | 3 (0.8%) |
| $7,500 to $9,999 | 0 (0.0%) | 8 (2.2%) |
| $10,000 to $12,499 | 26 (4.5%) | 33 (9.1%) |
| $12,500 to $14,999 | 0 (0.0%) | 0 (0.0%) |
| $15,000 to $17,499 | 3 (0.5%) | 51 (14.0%) |
| $17,500 to $19,999 | 0 (0.0%) | 2 (0.5%) |
| $20,000 to $22,499 | 15 (2.6%) | 9 (2.5%) |
| $22,500 to $24,999 | 3 (0.5%) | 26 (7.1%) |
| $25,000 to $29,999 | 3 (0.5%) | 25 (6.9%) |
| $30,000 to $34,999 | 108 (18.6%) | 27 (7.4%) |
| $35,000 to $39,999 | 16 (2.8%) | 38 (10.4%) |
| $40,000 to $44,999 | 24 (4.1%) | 13 (3.6%) |
| $45,000 to $49,999 | 68 (11.7%) | 0 (0.0%) |
| $50,000 to $54,999 | 0 (0.0%) | 53 (14.6%) |
| $55,000 to $64,999 | 18 (3.1%) | 32 (8.8%) |
| $65,000 to $74,999 | 28 (4.8%) | 9 (2.5%) |
| $75,000 to $99,999 | 56 (9.6%) | 0 (0.0%) |
| $100,000+ | 97 (16.7%) | 16 (4.4%) |
| Total | 582 (100.0%) | 364 (100.0%) |
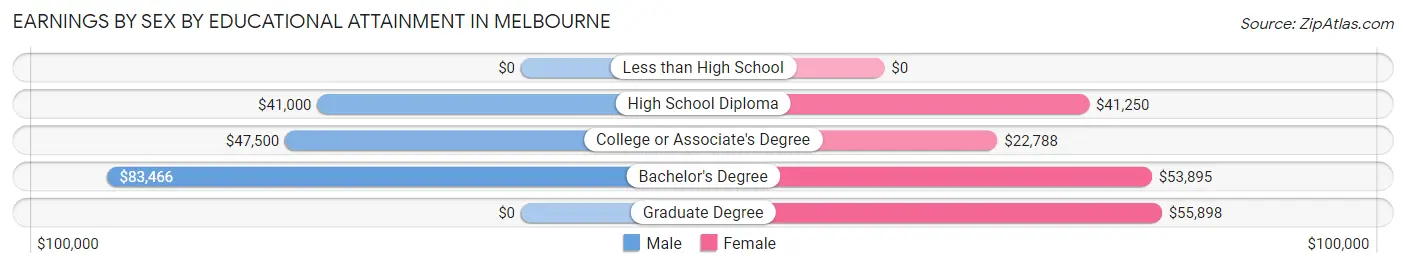
Earnings by Sex by Educational Attainment in Melbourne
Average earnings in Melbourne are $46,853 for men and $34,444 for women, a difference of 26.5%. Men with an educational attainment of bachelor's degree enjoy the highest average annual earnings of $83,466, while those with high school diploma education earn the least with $41,000. Women with an educational attainment of graduate degree earn the most with the average annual earnings of $55,898, while those with college or associate's degree education have the smallest earnings of $22,788.
| Educational Attainment | Male Income | Female Income |
| Less than High School | - | - |
| High School Diploma | $41,000 | $41,250 |
| College or Associate's Degree | $47,500 | $22,788 |
| Bachelor's Degree | $83,466 | $53,895 |
| Graduate Degree | - | - |
| Total | $46,853 | $34,444 |
Family Income in Melbourne
Family Income Brackets in Melbourne
According to the Melbourne family income data, there are 88 families falling into the $50,000 to $74,999 income range, which is the most common income bracket and makes up 16.9% of all families. Conversely, the $200,000+ income bracket is the least frequent group with only 16 families (3.1%) belonging to this category.
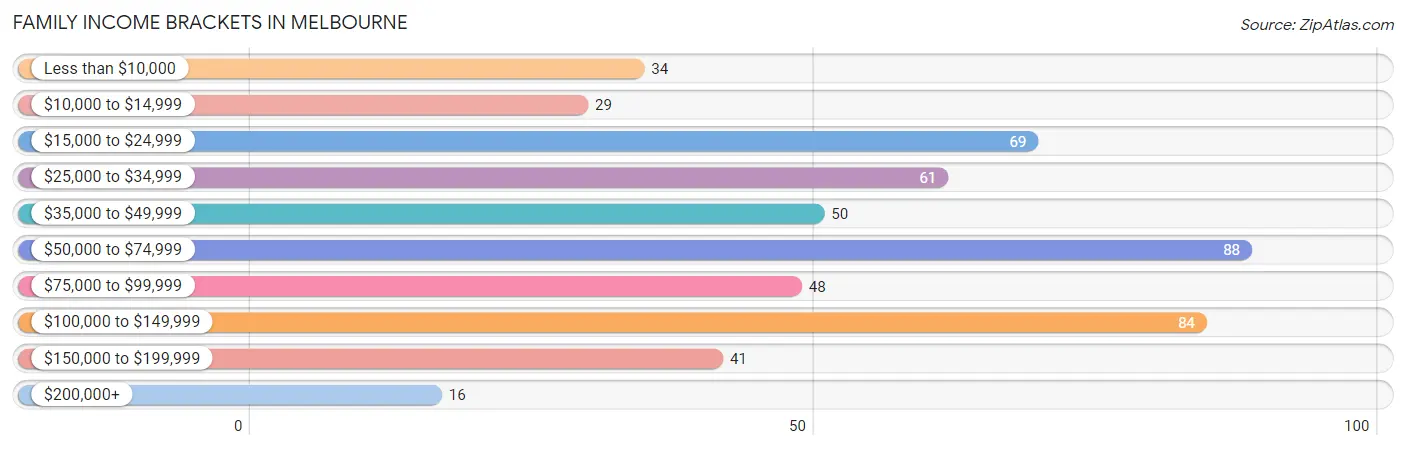
| Income Bracket | # Families | % Families |
| Less than $10,000 | 34 | 6.5% |
| $10,000 to $14,999 | 29 | 5.6% |
| $15,000 to $24,999 | 69 | 13.3% |
| $25,000 to $34,999 | 61 | 11.7% |
| $35,000 to $49,999 | 50 | 9.6% |
| $50,000 to $74,999 | 88 | 16.9% |
| $75,000 to $99,999 | 48 | 9.2% |
| $100,000 to $149,999 | 84 | 16.2% |
| $150,000 to $199,999 | 41 | 7.9% |
| $200,000+ | 16 | 3.1% |
Family Income by Famaliy Size in Melbourne
4-person families (142 | 27.3%) account for the highest median family income in Melbourne with $56,613 per family, while 2-person families (183 | 35.2%) have the highest median income of $21,125 per family member.
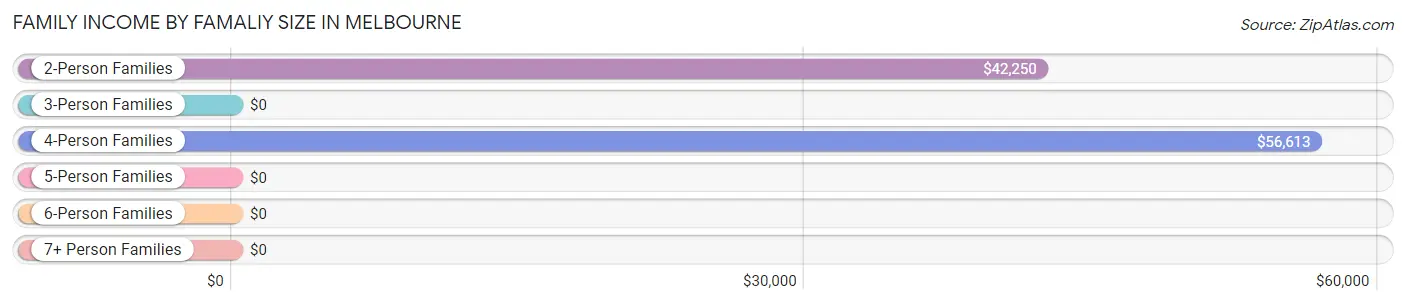
| Income Bracket | # Families | Median Income |
| 2-Person Families | 183 (35.2%) | $42,250 |
| 3-Person Families | 137 (26.4%) | $0 |
| 4-Person Families | 142 (27.3%) | $56,613 |
| 5-Person Families | 35 (6.7%) | $0 |
| 6-Person Families | 13 (2.5%) | $0 |
| 7+ Person Families | 10 (1.9%) | $0 |
| Total | 520 (100.0%) | $55,161 |
Family Income by Number of Earners in Melbourne
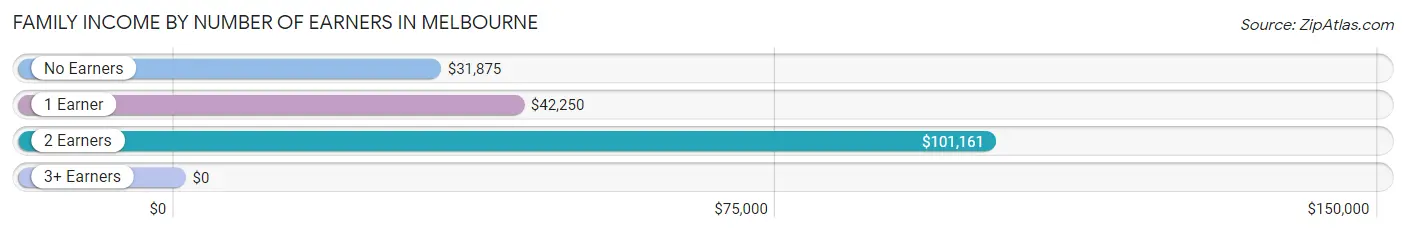
| Number of Earners | # Families | Median Income |
| No Earners | 98 (18.9%) | $31,875 |
| 1 Earner | 213 (41.0%) | $42,250 |
| 2 Earners | 205 (39.4%) | $101,161 |
| 3+ Earners | 4 (0.8%) | $0 |
| Total | 520 (100.0%) | $55,161 |
Household Income in Melbourne
Household Income Brackets in Melbourne
With 168 households falling in the category, the $15,000 to $24,999 income range is the most frequent in Melbourne, accounting for 19.2% of all households. In contrast, only 16 households (1.8%) fall into the $200,000+ income bracket, making it the least populous group.
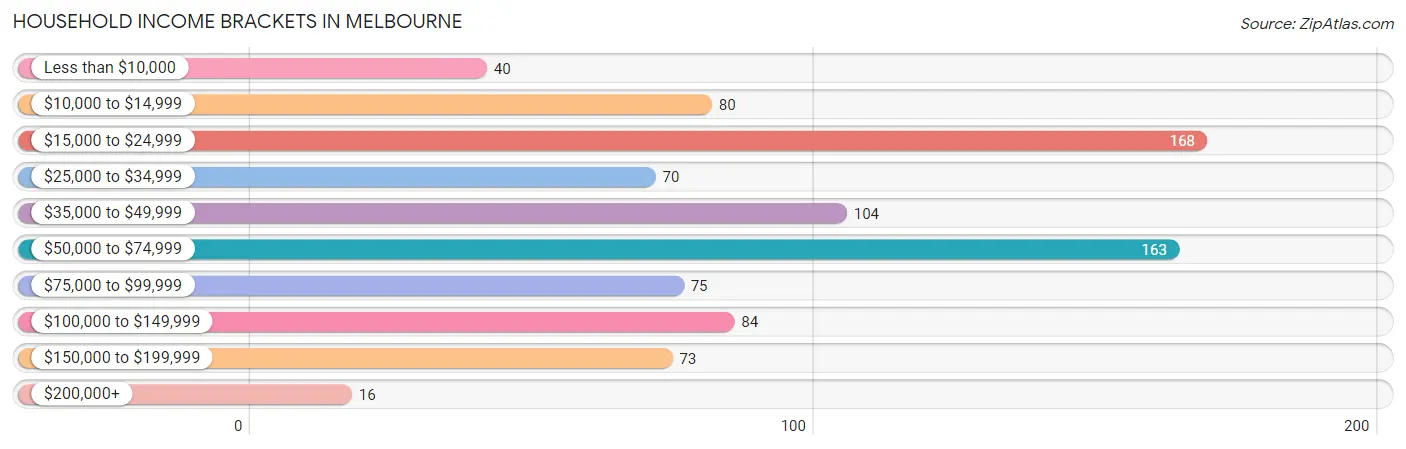
| Income Bracket | # Households | % Households |
| Less than $10,000 | 40 | 4.6% |
| $10,000 to $14,999 | 80 | 9.2% |
| $15,000 to $24,999 | 168 | 19.2% |
| $25,000 to $34,999 | 70 | 8.0% |
| $35,000 to $49,999 | 104 | 11.9% |
| $50,000 to $74,999 | 163 | 18.7% |
| $75,000 to $99,999 | 75 | 8.6% |
| $100,000 to $149,999 | 84 | 9.6% |
| $150,000 to $199,999 | 73 | 8.4% |
| $200,000+ | 16 | 1.8% |
Household Income by Householder Age in Melbourne
The median household income in Melbourne is $41,938, with the highest median household income of $55,385 found in the 25 to 44 years age bracket for the primary householder. A total of 316 households (36.2%) fall into this category. Meanwhile, the 15 to 24 years age bracket for the primary householder has the lowest median household income of $26,667, with 20 households (2.3%) in this group.
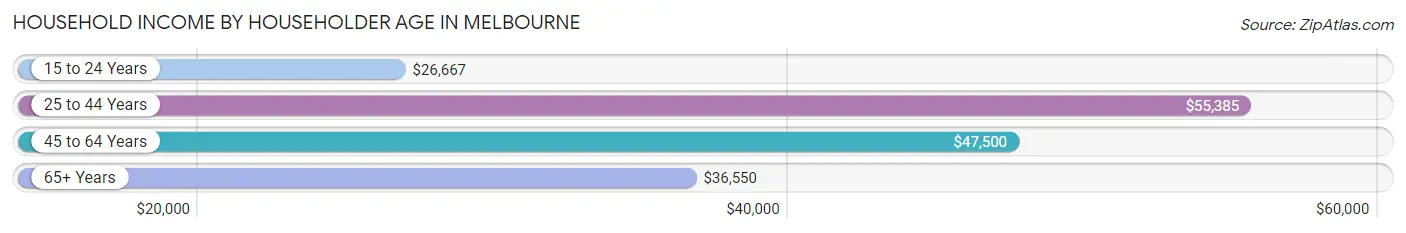
| Income Bracket | # Households | Median Income |
| 15 to 24 Years | 20 (2.3%) | $26,667 |
| 25 to 44 Years | 316 (36.2%) | $55,385 |
| 45 to 64 Years | 352 (40.3%) | $47,500 |
| 65+ Years | 185 (21.2%) | $36,550 |
| Total | 873 (100.0%) | $41,938 |
Poverty in Melbourne
Income Below Poverty by Sex and Age in Melbourne
With 25.6% poverty level for males and 36.3% for females among the residents of Melbourne, 18 to 24 year old males and 5 year old females are the most vulnerable to poverty, with 123 males (64.4%) and 16 females (100.0%) in their respective age groups living below the poverty level.
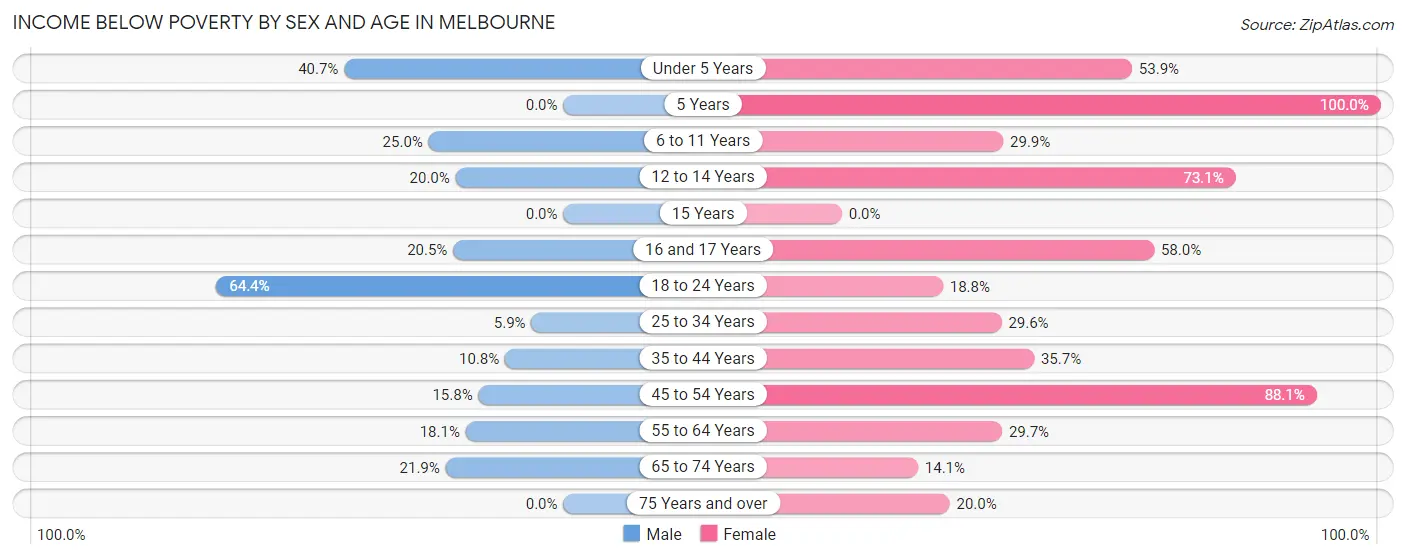
| Age Bracket | Male | Female |
| Under 5 Years | 48 (40.7%) | 21 (53.8%) |
| 5 Years | 0 (0.0%) | 16 (100.0%) |
| 6 to 11 Years | 24 (25.0%) | 53 (29.9%) |
| 12 to 14 Years | 21 (20.0%) | 19 (73.1%) |
| 15 Years | 0 (0.0%) | 0 (0.0%) |
| 16 and 17 Years | 9 (20.4%) | 51 (58.0%) |
| 18 to 24 Years | 123 (64.4%) | 12 (18.8%) |
| 25 to 34 Years | 8 (5.9%) | 48 (29.6%) |
| 35 to 44 Years | 8 (10.8%) | 56 (35.7%) |
| 45 to 54 Years | 20 (15.8%) | 52 (88.1%) |
| 55 to 64 Years | 29 (18.1%) | 33 (29.7%) |
| 65 to 74 Years | 26 (21.8%) | 12 (14.1%) |
| 75 Years and over | 0 (0.0%) | 19 (20.0%) |
| Total | 316 (25.6%) | 392 (36.3%) |
Income Above Poverty by Sex and Age in Melbourne
According to the poverty statistics in Melbourne, males aged 5 years and females aged 65 to 74 years are the age groups that are most secure financially, with 100.0% of males and 85.9% of females in these age groups living above the poverty line.
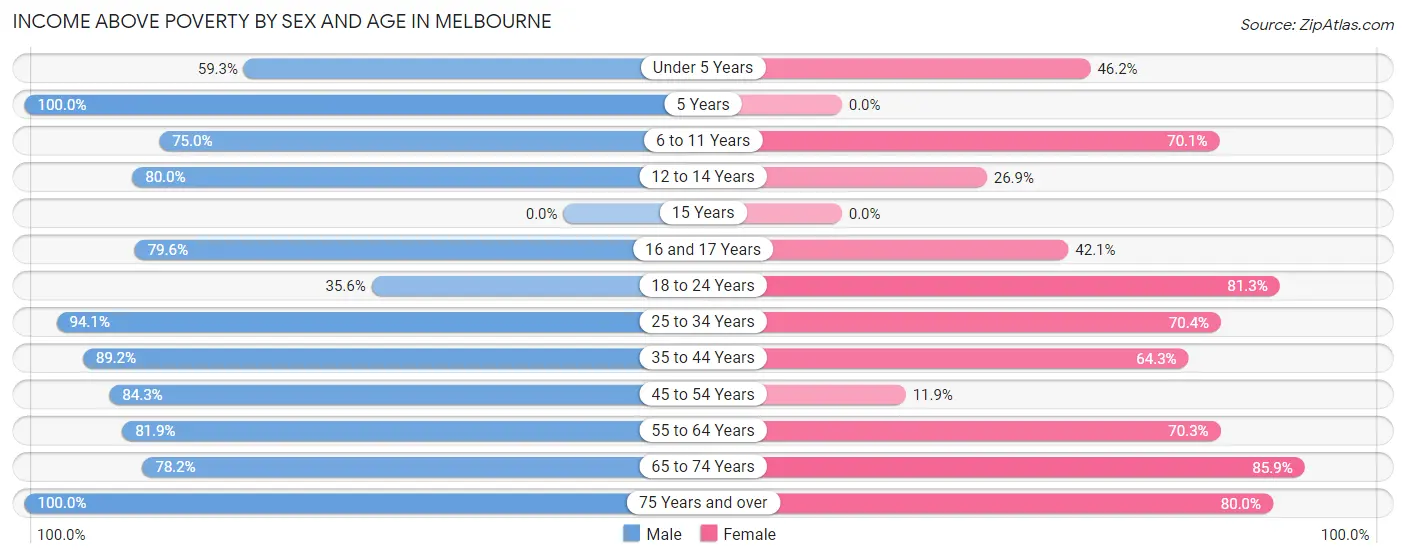
| Age Bracket | Male | Female |
| Under 5 Years | 70 (59.3%) | 18 (46.2%) |
| 5 Years | 13 (100.0%) | 0 (0.0%) |
| 6 to 11 Years | 72 (75.0%) | 124 (70.1%) |
| 12 to 14 Years | 84 (80.0%) | 7 (26.9%) |
| 15 Years | 0 (0.0%) | 0 (0.0%) |
| 16 and 17 Years | 35 (79.5%) | 37 (42.0%) |
| 18 to 24 Years | 68 (35.6%) | 52 (81.2%) |
| 25 to 34 Years | 127 (94.1%) | 114 (70.4%) |
| 35 to 44 Years | 66 (89.2%) | 101 (64.3%) |
| 45 to 54 Years | 107 (84.3%) | 7 (11.9%) |
| 55 to 64 Years | 131 (81.9%) | 78 (70.3%) |
| 65 to 74 Years | 93 (78.1%) | 73 (85.9%) |
| 75 Years and over | 52 (100.0%) | 76 (80.0%) |
| Total | 918 (74.4%) | 687 (63.7%) |
Income Below Poverty Among Married-Couple Families in Melbourne
The poverty statistics for married-couple families in Melbourne show that 13.1% or 43 of the total 328 families live below the poverty line. Families with 5 or more children have the highest poverty rate of 100.0%, comprising of 10 families. On the other hand, families with 3 or 4 children have the lowest poverty rate of 0.0%, which includes 0 families.
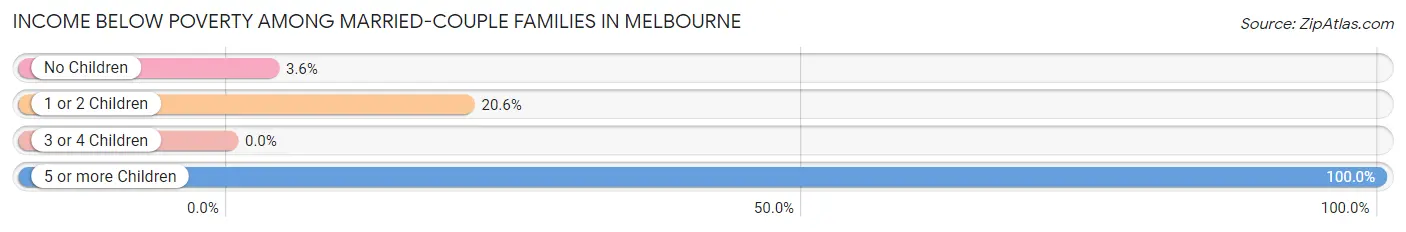
| Children | Above Poverty | Below Poverty |
| No Children | 135 (96.4%) | 5 (3.6%) |
| 1 or 2 Children | 108 (79.4%) | 28 (20.6%) |
| 3 or 4 Children | 42 (100.0%) | 0 (0.0%) |
| 5 or more Children | 0 (0.0%) | 10 (100.0%) |
| Total | 285 (86.9%) | 43 (13.1%) |
Income Below Poverty Among Single-Parent Households in Melbourne
According to the poverty data in Melbourne, 30.3% or 10 single-father households and 49.7% or 79 single-mother households are living below the poverty line. Among single-father households, those with 1 or 2 children have the highest poverty rate, with 10 households (100.0%) experiencing poverty. Likewise, among single-mother households, those with no children have the highest poverty rate, with 7 households (100.0%) falling below the poverty line.
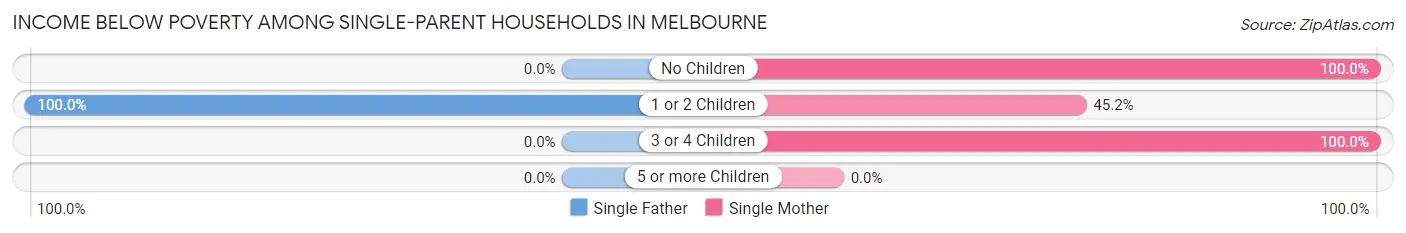
| Children | Single Father | Single Mother |
| No Children | 0 (0.0%) | 7 (100.0%) |
| 1 or 2 Children | 10 (100.0%) | 66 (45.2%) |
| 3 or 4 Children | 0 (0.0%) | 6 (100.0%) |
| 5 or more Children | 0 (0.0%) | 0 (0.0%) |
| Total | 10 (30.3%) | 79 (49.7%) |
Income Below Poverty Among Married-Couple vs Single-Parent Households in Melbourne
The poverty data for Melbourne shows that 43 of the married-couple family households (13.1%) and 89 of the single-parent households (46.4%) are living below the poverty level. Within the married-couple family households, those with 5 or more children have the highest poverty rate, with 10 households (100.0%) falling below the poverty line. Among the single-parent households, those with no children have the highest poverty rate, with 7 household (100.0%) living below poverty.
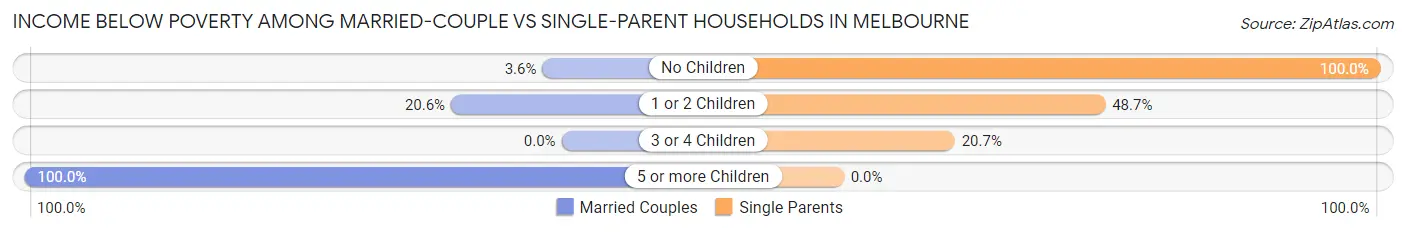
| Children | Married-Couple Families | Single-Parent Households |
| No Children | 5 (3.6%) | 7 (100.0%) |
| 1 or 2 Children | 28 (20.6%) | 76 (48.7%) |
| 3 or 4 Children | 0 (0.0%) | 6 (20.7%) |
| 5 or more Children | 10 (100.0%) | 0 (0.0%) |
| Total | 43 (13.1%) | 89 (46.4%) |
Race in Melbourne
The most populous races in Melbourne are White / Caucasian (2,401 | 98.8%), Two or more Races (12 | 0.5%), and Black / African American (10 | 0.4%).
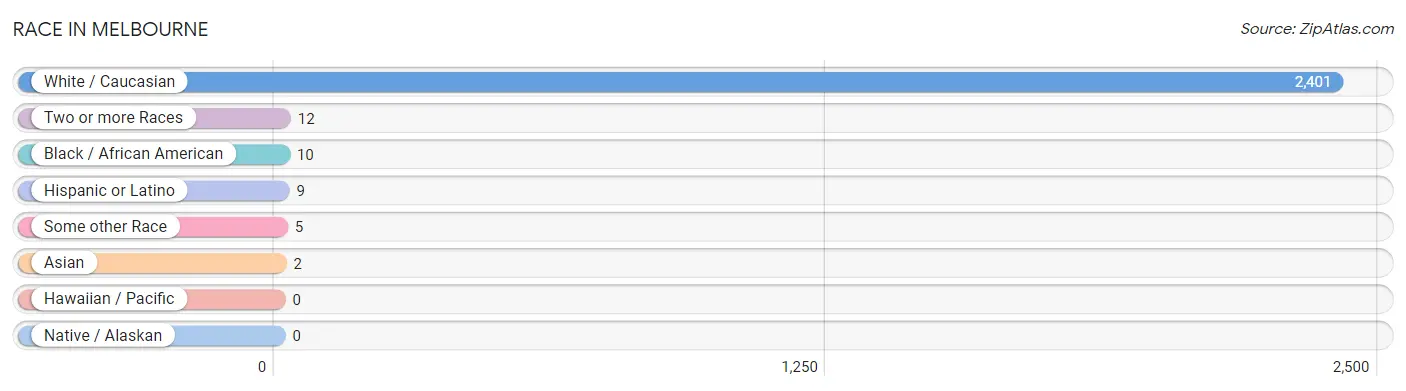
| Race | # Population | % Population |
| Asian | 2 | 0.1% |
| Black / African American | 10 | 0.4% |
| Hawaiian / Pacific | 0 | 0.0% |
| Hispanic or Latino | 9 | 0.4% |
| Native / Alaskan | 0 | 0.0% |
| White / Caucasian | 2,401 | 98.8% |
| Two or more Races | 12 | 0.5% |
| Some other Race | 5 | 0.2% |
| Total | 2,430 | 100.0% |
Ancestry in Melbourne
The most populous ancestries reported in Melbourne are Irish (440 | 18.1%), English (324 | 13.3%), American (215 | 8.8%), Italian (179 | 7.4%), and Scottish (90 | 3.7%), together accounting for 51.4% of all Melbourne residents.
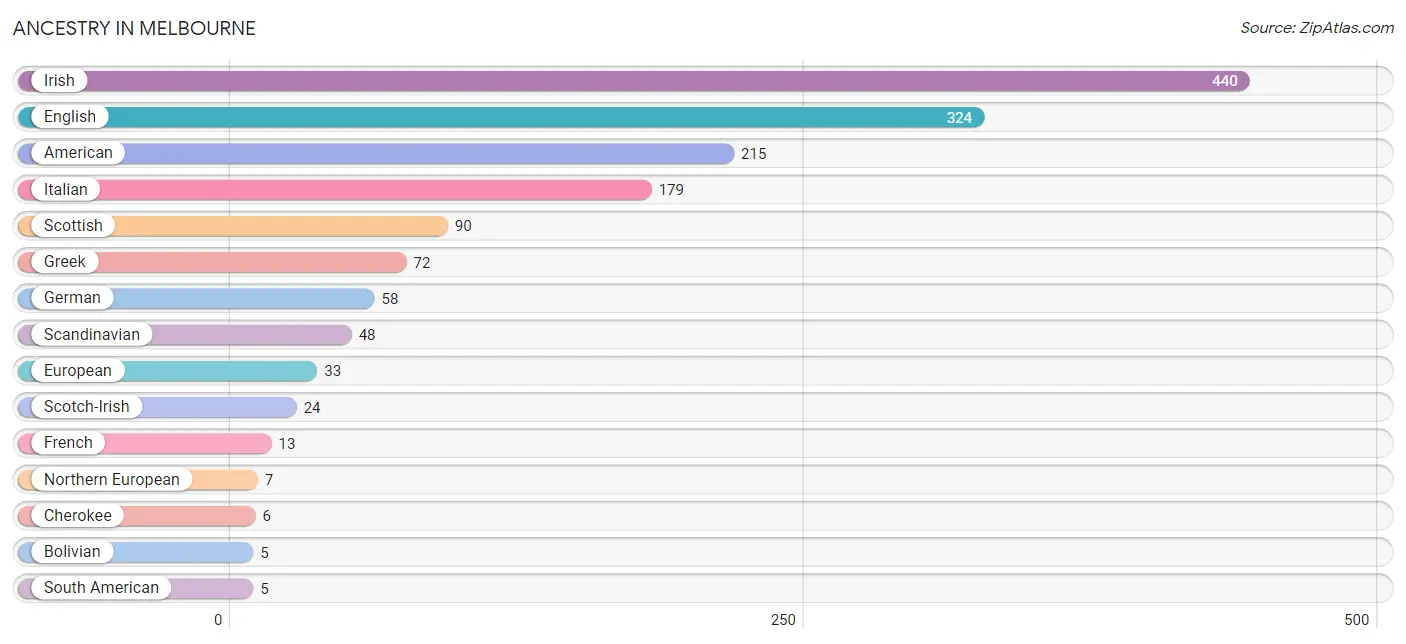
| Ancestry | # Population | % Population |
| American | 215 | 8.8% |
| Bhutanese | 1 | 0.0% |
| Bolivian | 5 | 0.2% |
| Cherokee | 6 | 0.3% |
| English | 324 | 13.3% |
| European | 33 | 1.4% |
| French | 13 | 0.5% |
| German | 58 | 2.4% |
| Greek | 72 | 3.0% |
| Irish | 440 | 18.1% |
| Italian | 179 | 7.4% |
| Korean | 2 | 0.1% |
| Mexican | 3 | 0.1% |
| Native Hawaiian | 1 | 0.0% |
| Northern European | 7 | 0.3% |
| Scandinavian | 48 | 2.0% |
| Scotch-Irish | 24 | 1.0% |
| Scottish | 90 | 3.7% |
| South American | 5 | 0.2% |
| Swedish | 3 | 0.1% |
| Welsh | 3 | 0.1% | View All 21 Rows |
Immigrants in Melbourne
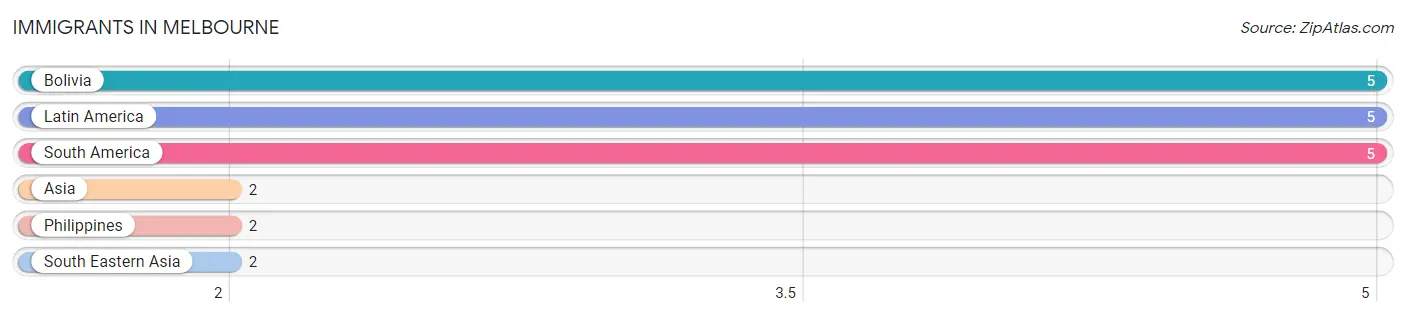
The most numerous immigrant groups reported in Melbourne came from Bolivia (5 | 0.2%), Latin America (5 | 0.2%), South America (5 | 0.2%), Asia (2 | 0.1%), and Philippines (2 | 0.1%), together accounting for 0.8% of all Melbourne residents.
| Immigration Origin | # Population | % Population |
| Asia | 2 | 0.1% |
| Bolivia | 5 | 0.2% |
| Latin America | 5 | 0.2% |
| Philippines | 2 | 0.1% |
| South America | 5 | 0.2% |
| South Eastern Asia | 2 | 0.1% | View All 6 Rows |
Sex and Age in Melbourne
Sex and Age in Melbourne
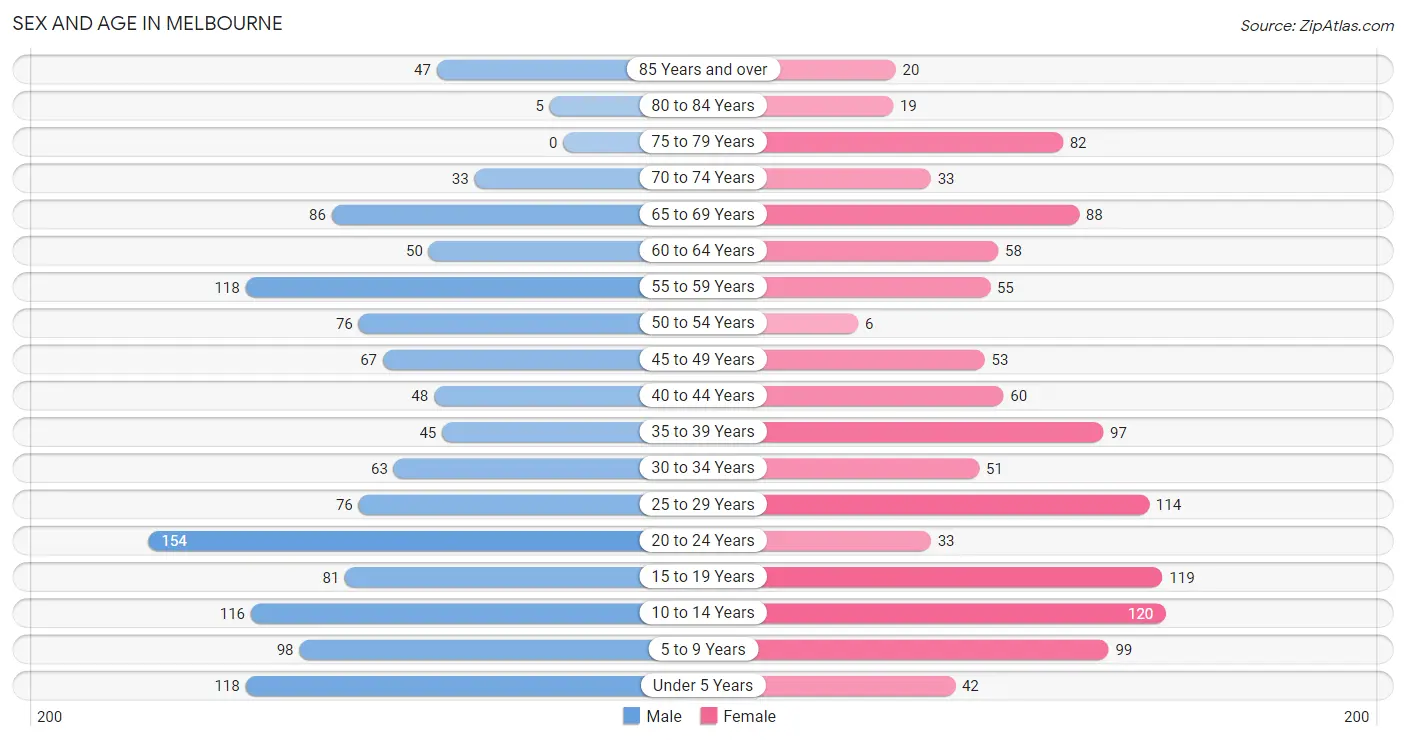
The most populous age groups in Melbourne are 20 to 24 Years (154 | 12.0%) for men and 10 to 14 Years (120 | 10.4%) for women.
| Age Bracket | Male | Female |
| Under 5 Years | 118 (9.2%) | 42 (3.7%) |
| 5 to 9 Years | 98 (7.6%) | 99 (8.6%) |
| 10 to 14 Years | 116 (9.1%) | 120 (10.4%) |
| 15 to 19 Years | 81 (6.3%) | 119 (10.4%) |
| 20 to 24 Years | 154 (12.0%) | 33 (2.9%) |
| 25 to 29 Years | 76 (5.9%) | 114 (9.9%) |
| 30 to 34 Years | 63 (4.9%) | 51 (4.4%) |
| 35 to 39 Years | 45 (3.5%) | 97 (8.4%) |
| 40 to 44 Years | 48 (3.7%) | 60 (5.2%) |
| 45 to 49 Years | 67 (5.2%) | 53 (4.6%) |
| 50 to 54 Years | 76 (5.9%) | 6 (0.5%) |
| 55 to 59 Years | 118 (9.2%) | 55 (4.8%) |
| 60 to 64 Years | 50 (3.9%) | 58 (5.1%) |
| 65 to 69 Years | 86 (6.7%) | 88 (7.7%) |
| 70 to 74 Years | 33 (2.6%) | 33 (2.9%) |
| 75 to 79 Years | 0 (0.0%) | 82 (7.1%) |
| 80 to 84 Years | 5 (0.4%) | 19 (1.7%) |
| 85 Years and over | 47 (3.7%) | 20 (1.7%) |
| Total | 1,281 (100.0%) | 1,149 (100.0%) |
Families and Households in Melbourne
Median Family Size in Melbourne
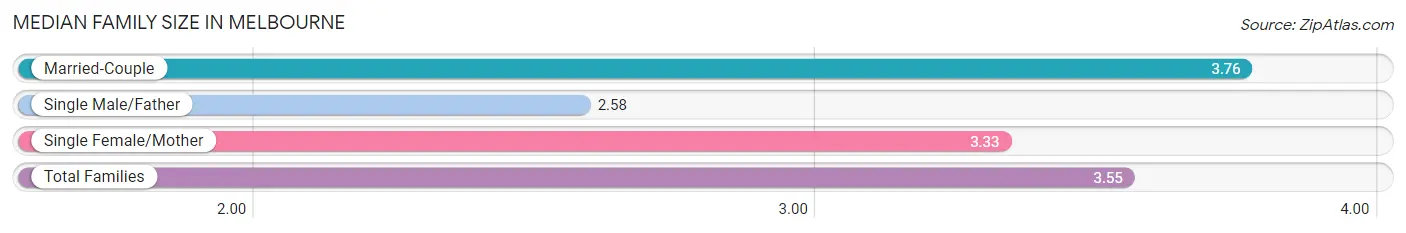
The median family size in Melbourne is 3.55 persons per family, with married-couple families (328 | 63.1%) accounting for the largest median family size of 3.76 persons per family. On the other hand, single male/father families (33 | 6.4%) represent the smallest median family size with 2.58 persons per family.
| Family Type | # Families | Family Size |
| Married-Couple | 328 (63.1%) | 3.76 |
| Single Male/Father | 33 (6.4%) | 2.58 |
| Single Female/Mother | 159 (30.6%) | 3.33 |
| Total Families | 520 (100.0%) | 3.55 |
Median Household Size in Melbourne
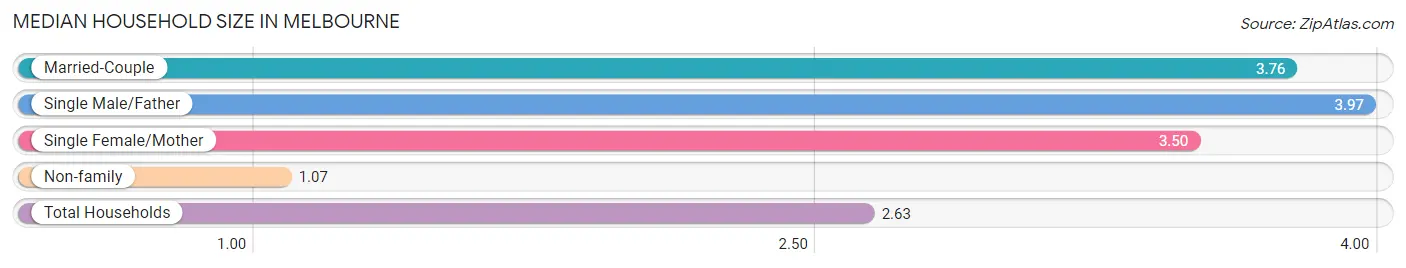
The median household size in Melbourne is 2.63 persons per household, with single male/father households (33 | 3.8%) accounting for the largest median household size of 3.97 persons per household. non-family households (353 | 40.4%) represent the smallest median household size with 1.07 persons per household.
| Household Type | # Households | Household Size |
| Married-Couple | 328 (37.6%) | 3.76 |
| Single Male/Father | 33 (3.8%) | 3.97 |
| Single Female/Mother | 159 (18.2%) | 3.50 |
| Non-family | 353 (40.4%) | 1.07 |
| Total Households | 873 (100.0%) | 2.63 |
Household Size by Marriage Status in Melbourne
Out of a total of 873 households in Melbourne, 520 (59.6%) are family households, while 353 (40.4%) are nonfamily households. The most numerous type of family households are 3-person households, comprising 163, and the most common type of nonfamily households are 1-person households, comprising 340.
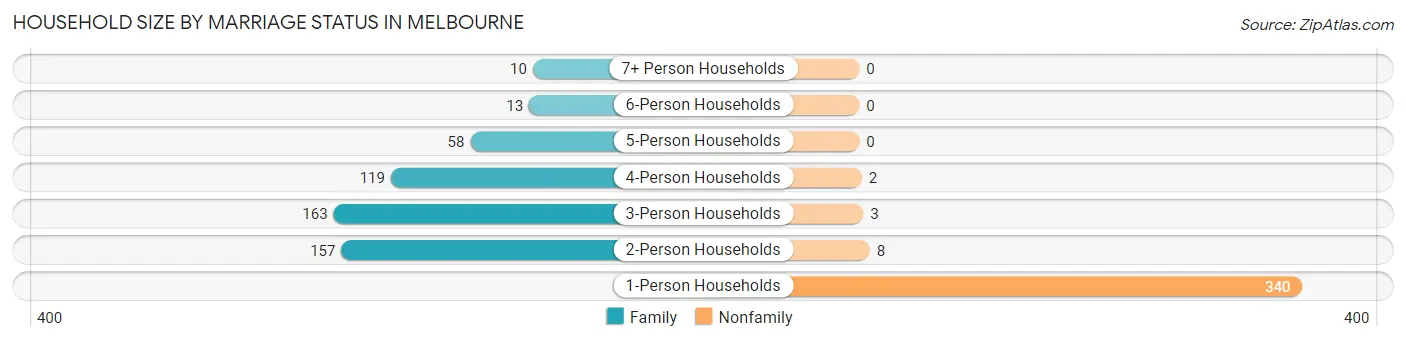
| Household Size | Family Households | Nonfamily Households |
| 1-Person Households | - | 340 (39.0%) |
| 2-Person Households | 157 (18.0%) | 8 (0.9%) |
| 3-Person Households | 163 (18.7%) | 3 (0.3%) |
| 4-Person Households | 119 (13.6%) | 2 (0.2%) |
| 5-Person Households | 58 (6.6%) | 0 (0.0%) |
| 6-Person Households | 13 (1.5%) | 0 (0.0%) |
| 7+ Person Households | 10 (1.1%) | 0 (0.0%) |
| Total | 520 (59.6%) | 353 (40.4%) |
Female Fertility in Melbourne
Fertility by Age in Melbourne
Average fertility rate in Melbourne is 120.0 births per 1,000 women. Women in the age bracket of 20 to 34 years have the highest fertility rate with 318.0 births per 1,000 women. Women in the age bracket of 20 to 34 years acount for 100.0% of all women with births.
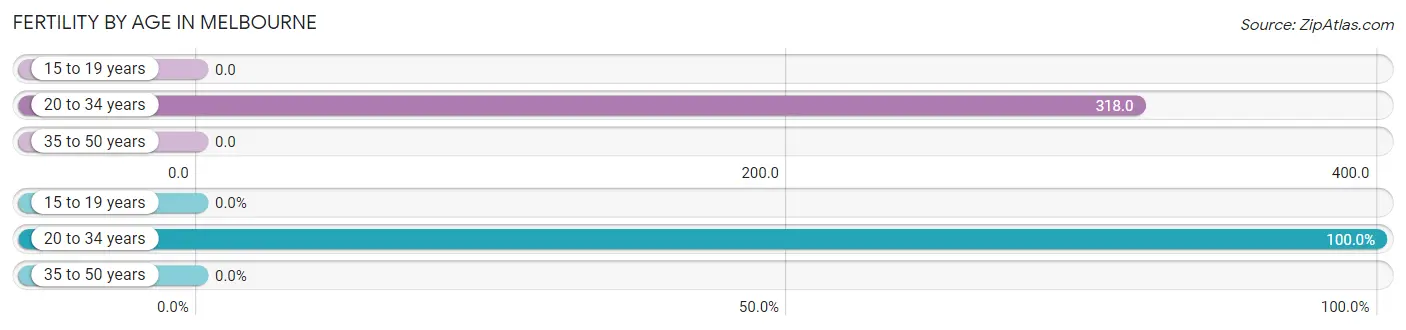
| Age Bracket | Women with Births | Births / 1,000 Women |
| 15 to 19 years | 0 (0.0%) | 0.0 |
| 20 to 34 years | 63 (100.0%) | 318.0 |
| 35 to 50 years | 0 (0.0%) | 0.0 |
| Total | 63 (100.0%) | 120.0 |
Fertility by Age by Marriage Status in Melbourne
68.3% of women with births (63) in Melbourne are married. The highest percentage of unmarried women with births falls into 20 to 34 years age bracket with 31.8% of them unmarried at the time of birth, while the lowest percentage of unmarried women with births belong to 20 to 34 years age bracket with 31.8% of them unmarried.
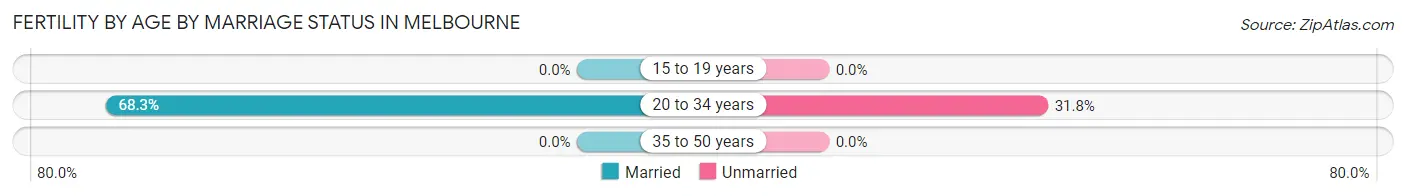
| Age Bracket | Married | Unmarried |
| 15 to 19 years | 0 (0.0%) | 0 (0.0%) |
| 20 to 34 years | 43 (68.2%) | 20 (31.8%) |
| 35 to 50 years | 0 (0.0%) | 0 (0.0%) |
| Total | 43 (68.2%) | 20 (31.8%) |
Fertility by Education in Melbourne
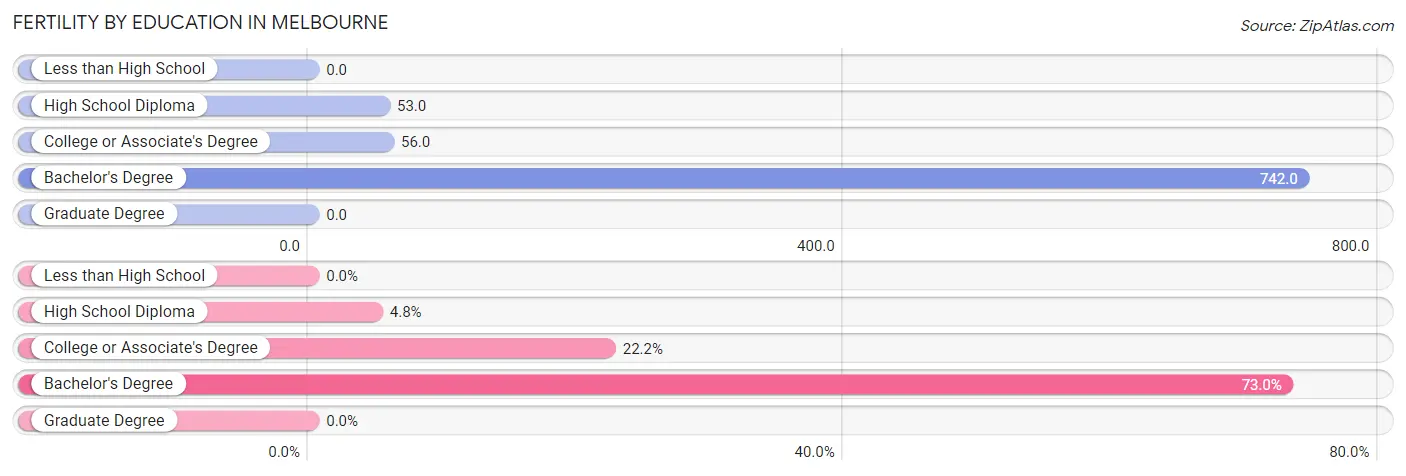
| Educational Attainment | Women with Births | Births / 1,000 Women |
| Less than High School | 0 (0.0%) | 0.0 |
| High School Diploma | 3 (4.8%) | 53.0 |
| College or Associate's Degree | 14 (22.2%) | 56.0 |
| Bachelor's Degree | 46 (73.0%) | 742.0 |
| Graduate Degree | 0 (0.0%) | 0.0 |
| Total | 63 (100.0%) | 120.0 |
Fertility by Education by Marriage Status in Melbourne
31.8% of women with births in Melbourne are unmarried. Women with the educational attainment of bachelor's degree are most likely to be married with 93.5% of them married at childbirth, while women with the educational attainment of high school diploma are least likely to be married with 100.0% of them unmarried at childbirth.
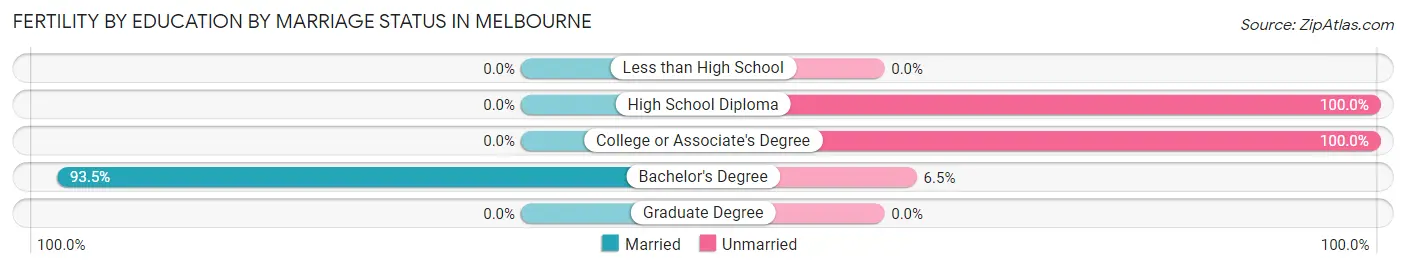
| Educational Attainment | Married | Unmarried |
| Less than High School | 0 (0.0%) | 0 (0.0%) |
| High School Diploma | 0 (0.0%) | 3 (100.0%) |
| College or Associate's Degree | 0 (0.0%) | 14 (100.0%) |
| Bachelor's Degree | 43 (93.5%) | 3 (6.5%) |
| Graduate Degree | 0 (0.0%) | 0 (0.0%) |
| Total | 43 (68.2%) | 20 (31.8%) |
Employment Characteristics in Melbourne
Employment by Class of Employer in Melbourne
Among the 826 employed individuals in Melbourne, private company employees (420 | 50.8%), state government employees (149 | 18.0%), and self-employed (not incorporated) (97 | 11.7%) make up the most common classes of employment.
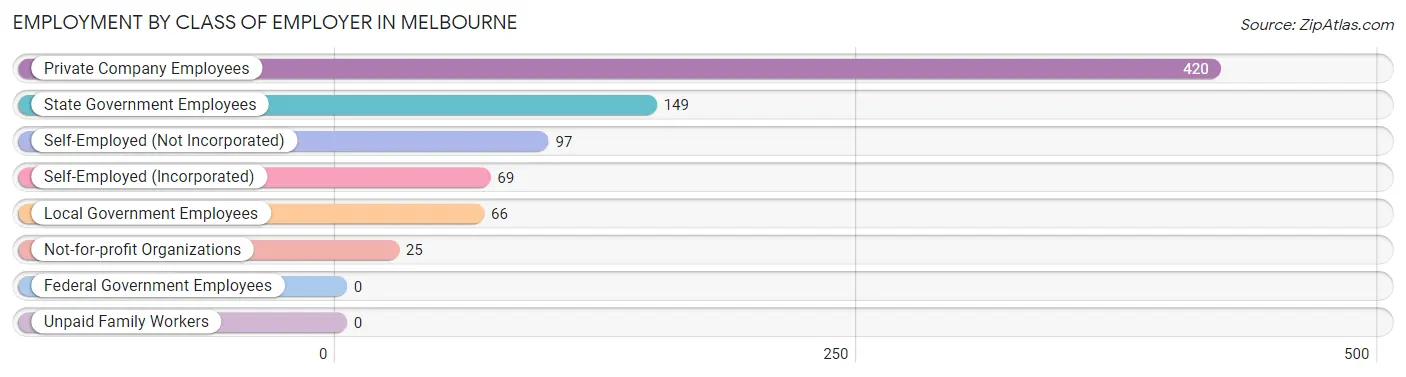
| Employer Class | # Employees | % Employees |
| Private Company Employees | 420 | 50.8% |
| Self-Employed (Incorporated) | 69 | 8.4% |
| Self-Employed (Not Incorporated) | 97 | 11.7% |
| Not-for-profit Organizations | 25 | 3.0% |
| Local Government Employees | 66 | 8.0% |
| State Government Employees | 149 | 18.0% |
| Federal Government Employees | 0 | 0.0% |
| Unpaid Family Workers | 0 | 0.0% |
| Total | 826 | 100.0% |
Employment Status by Age in Melbourne
According to the labor force statistics for Melbourne, out of the total population over 16 years of age (1,837), 49.4% or 907 individuals are in the labor force, with 5.9% or 54 of them unemployed. The age group with the highest labor force participation rate is 45 to 54 years, with 89.1% or 180 individuals in the labor force. Within the labor force, the 35 to 44 years age range has the highest percentage of unemployed individuals, with 21.6% or 43 of them being unemployed.
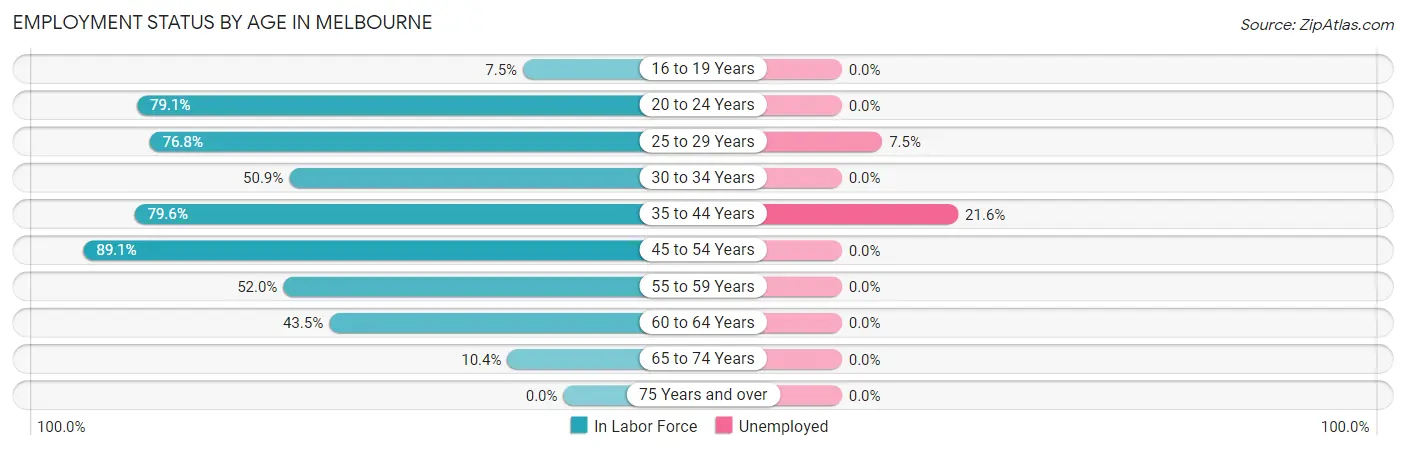
| Age Bracket | In Labor Force | Unemployed |
| 16 to 19 Years | 15 (7.5%) | 0 (0.0%) |
| 20 to 24 Years | 148 (79.1%) | 0 (0.0%) |
| 25 to 29 Years | 146 (76.8%) | 11 (7.5%) |
| 30 to 34 Years | 58 (50.9%) | 0 (0.0%) |
| 35 to 44 Years | 199 (79.6%) | 43 (21.6%) |
| 45 to 54 Years | 180 (89.1%) | 0 (0.0%) |
| 55 to 59 Years | 90 (52.0%) | 0 (0.0%) |
| 60 to 64 Years | 47 (43.5%) | 0 (0.0%) |
| 65 to 74 Years | 25 (10.4%) | 0 (0.0%) |
| 75 Years and over | 0 (0.0%) | 0 (0.0%) |
| Total | 907 (49.4%) | 54 (5.9%) |
Employment Status by Educational Attainment in Melbourne
According to labor force statistics for Melbourne, 69.4% of individuals (720) out of the total population between 25 and 64 years of age (1,037) are in the labor force, with 7.5% or 54 of them being unemployed. The group with the highest labor force participation rate are those with the educational attainment of bachelor's degree or higher, with 89.9% or 195 individuals in the labor force. Within the labor force, individuals with college / associate degree education have the highest percentage of unemployment, with 14.7% or 54 of them being unemployed.
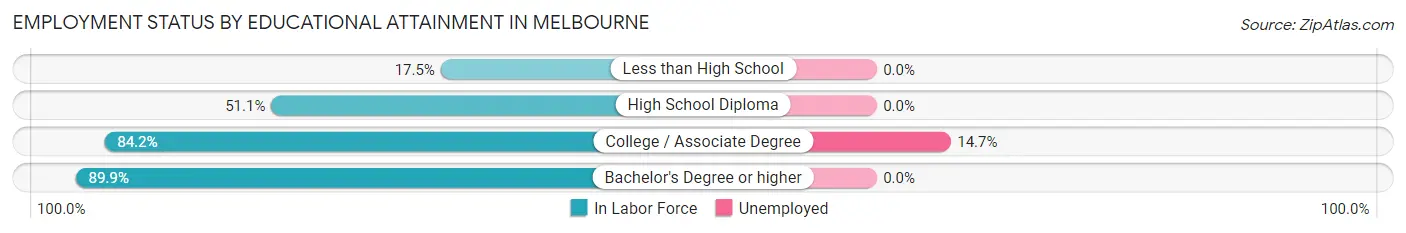
| Educational Attainment | In Labor Force | Unemployed |
| Less than High School | 20 (17.5%) | 0 (0.0%) |
| High School Diploma | 138 (51.1%) | 0 (0.0%) |
| College / Associate Degree | 367 (84.2%) | 64 (14.7%) |
| Bachelor's Degree or higher | 195 (89.9%) | 0 (0.0%) |
| Total | 720 (69.4%) | 78 (7.5%) |
Employment Occupations by Sex in Melbourne
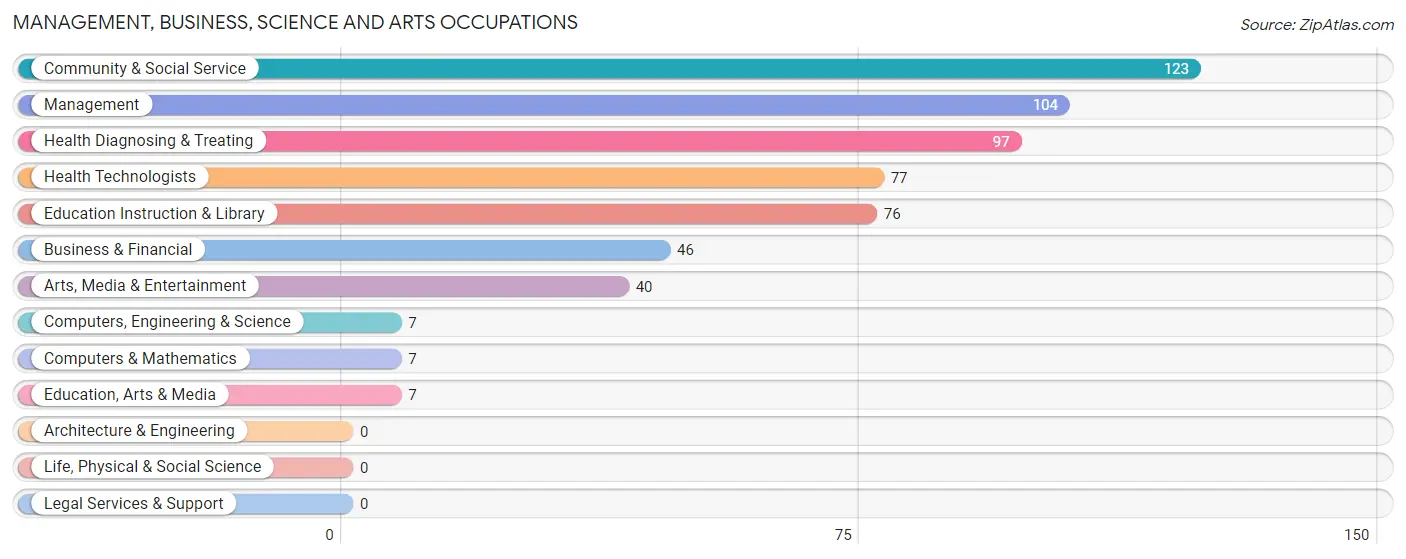
Management, Business, Science and Arts Occupations
The most common Management, Business, Science and Arts occupations in Melbourne are Community & Social Service (123 | 14.4%), Management (104 | 12.2%), Health Diagnosing & Treating (97 | 11.4%), Health Technologists (77 | 9.0%), and Education Instruction & Library (76 | 8.9%).
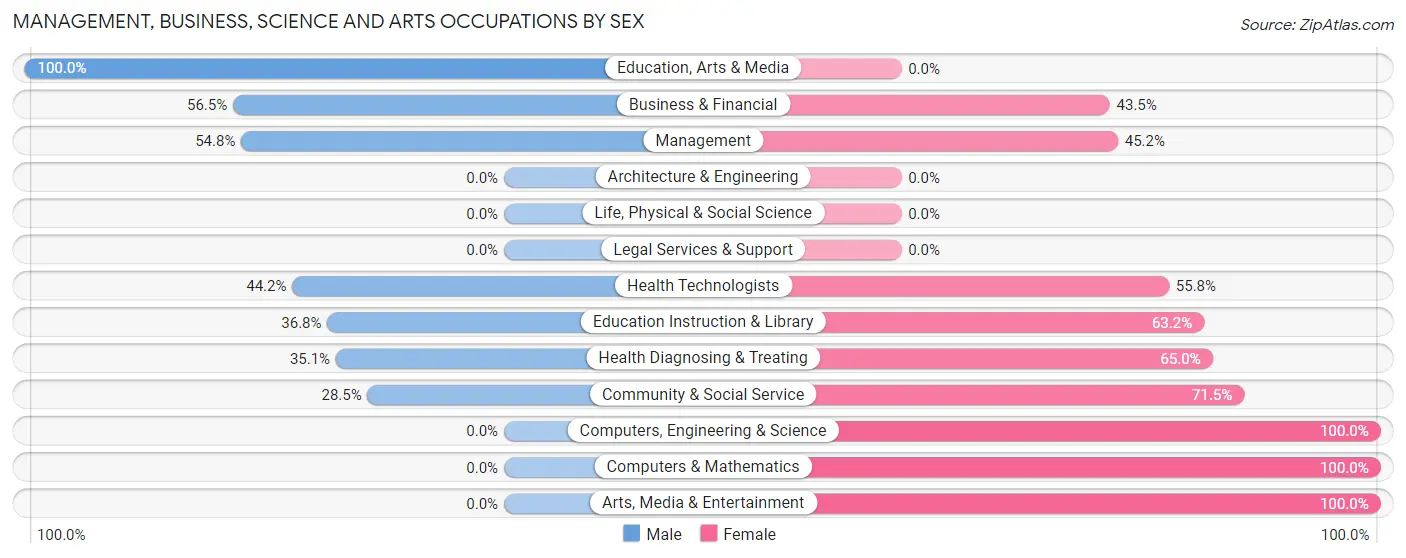
Management, Business, Science and Arts Occupations by Sex
Within the Management, Business, Science and Arts occupations in Melbourne, the most male-oriented occupations are Education, Arts & Media (100.0%), Business & Financial (56.5%), and Management (54.8%), while the most female-oriented occupations are Computers, Engineering & Science (100.0%), Computers & Mathematics (100.0%), and Arts, Media & Entertainment (100.0%).
| Occupation | Male | Female |
| Management | 57 (54.8%) | 47 (45.2%) |
| Business & Financial | 26 (56.5%) | 20 (43.5%) |
| Computers, Engineering & Science | 0 (0.0%) | 7 (100.0%) |
| Computers & Mathematics | 0 (0.0%) | 7 (100.0%) |
| Architecture & Engineering | 0 (0.0%) | 0 (0.0%) |
| Life, Physical & Social Science | 0 (0.0%) | 0 (0.0%) |
| Community & Social Service | 35 (28.5%) | 88 (71.5%) |
| Education, Arts & Media | 7 (100.0%) | 0 (0.0%) |
| Legal Services & Support | 0 (0.0%) | 0 (0.0%) |
| Education Instruction & Library | 28 (36.8%) | 48 (63.2%) |
| Arts, Media & Entertainment | 0 (0.0%) | 40 (100.0%) |
| Health Diagnosing & Treating | 34 (35.0%) | 63 (64.9%) |
| Health Technologists | 34 (44.2%) | 43 (55.8%) |
| Total (Category) | 152 (40.3%) | 225 (59.7%) |
| Total (Overall) | 533 (62.4%) | 321 (37.6%) |
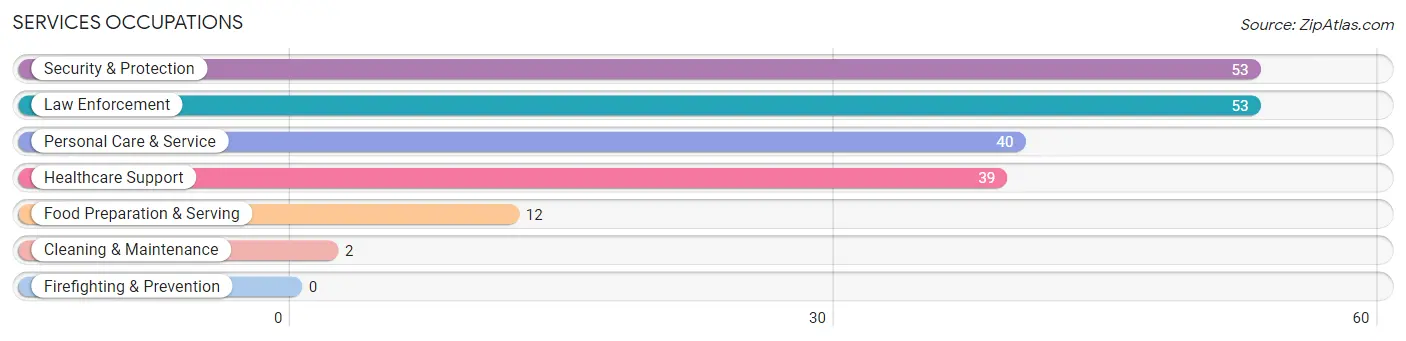
Services Occupations
The most common Services occupations in Melbourne are Security & Protection (53 | 6.2%), Law Enforcement (53 | 6.2%), Personal Care & Service (40 | 4.7%), Healthcare Support (39 | 4.6%), and Food Preparation & Serving (12 | 1.4%).
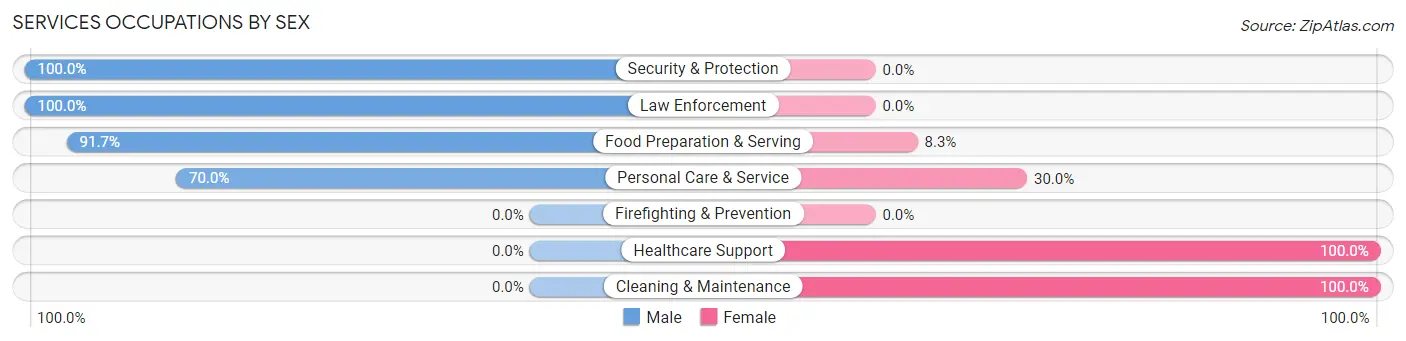
Services Occupations by Sex
Within the Services occupations in Melbourne, the most male-oriented occupations are Security & Protection (100.0%), Law Enforcement (100.0%), and Food Preparation & Serving (91.7%), while the most female-oriented occupations are Healthcare Support (100.0%), Cleaning & Maintenance (100.0%), and Personal Care & Service (30.0%).
| Occupation | Male | Female |
| Healthcare Support | 0 (0.0%) | 39 (100.0%) |
| Security & Protection | 53 (100.0%) | 0 (0.0%) |
| Firefighting & Prevention | 0 (0.0%) | 0 (0.0%) |
| Law Enforcement | 53 (100.0%) | 0 (0.0%) |
| Food Preparation & Serving | 11 (91.7%) | 1 (8.3%) |
| Cleaning & Maintenance | 0 (0.0%) | 2 (100.0%) |
| Personal Care & Service | 28 (70.0%) | 12 (30.0%) |
| Total (Category) | 92 (63.0%) | 54 (37.0%) |
| Total (Overall) | 533 (62.4%) | 321 (37.6%) |
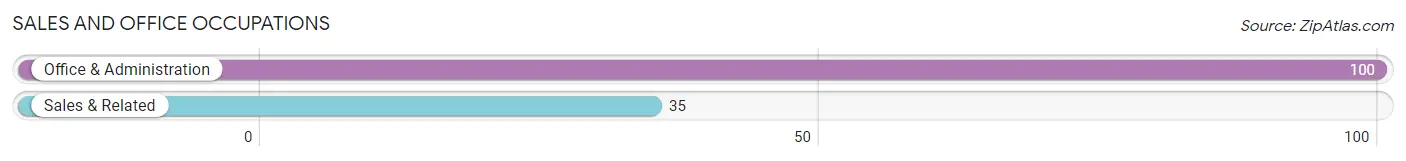
Sales and Office Occupations
The most common Sales and Office occupations in Melbourne are Office & Administration (100 | 11.7%), and Sales & Related (35 | 4.1%).
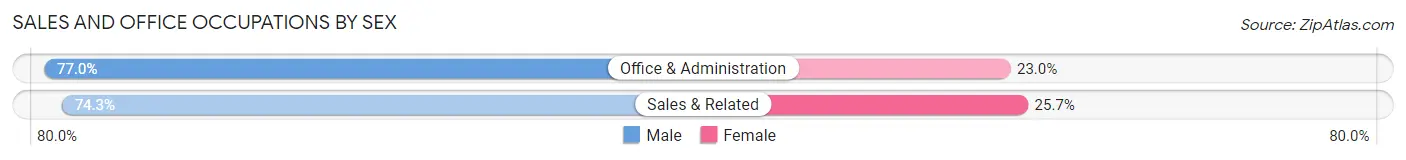
Sales and Office Occupations by Sex
| Occupation | Male | Female |
| Sales & Related | 26 (74.3%) | 9 (25.7%) |
| Office & Administration | 77 (77.0%) | 23 (23.0%) |
| Total (Category) | 103 (76.3%) | 32 (23.7%) |
| Total (Overall) | 533 (62.4%) | 321 (37.6%) |
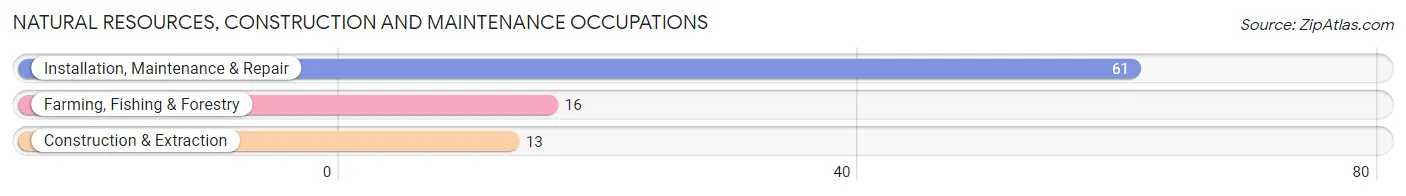
Natural Resources, Construction and Maintenance Occupations
The most common Natural Resources, Construction and Maintenance occupations in Melbourne are Installation, Maintenance & Repair (61 | 7.1%), Farming, Fishing & Forestry (16 | 1.9%), and Construction & Extraction (13 | 1.5%).
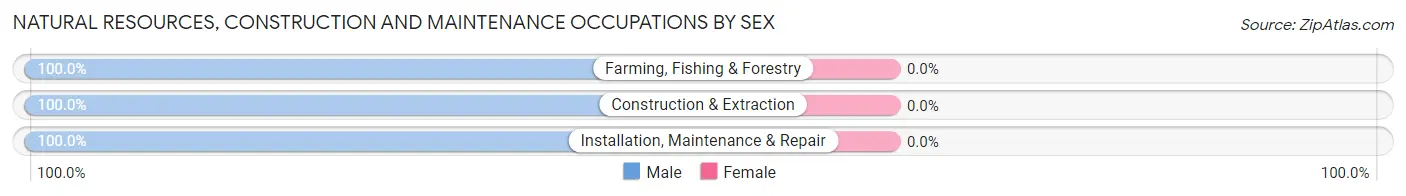
Natural Resources, Construction and Maintenance Occupations by Sex
| Occupation | Male | Female |
| Farming, Fishing & Forestry | 16 (100.0%) | 0 (0.0%) |
| Construction & Extraction | 13 (100.0%) | 0 (0.0%) |
| Installation, Maintenance & Repair | 61 (100.0%) | 0 (0.0%) |
| Total (Category) | 90 (100.0%) | 0 (0.0%) |
| Total (Overall) | 533 (62.4%) | 321 (37.6%) |
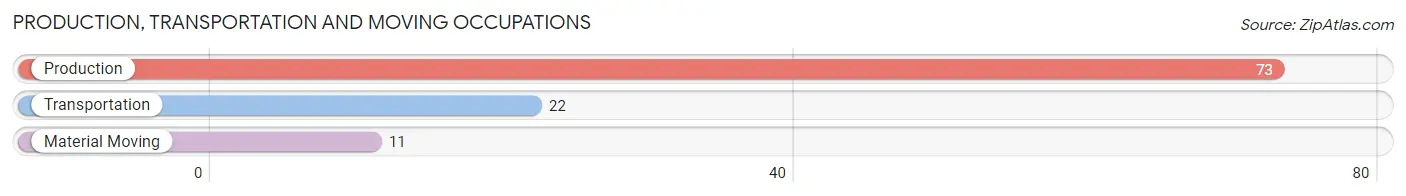
Production, Transportation and Moving Occupations
The most common Production, Transportation and Moving occupations in Melbourne are Production (73 | 8.6%), Transportation (22 | 2.6%), and Material Moving (11 | 1.3%).
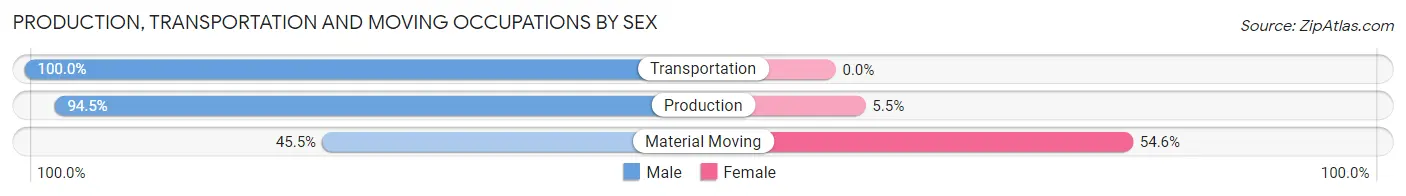
Production, Transportation and Moving Occupations by Sex
| Occupation | Male | Female |
| Production | 69 (94.5%) | 4 (5.5%) |
| Transportation | 22 (100.0%) | 0 (0.0%) |
| Material Moving | 5 (45.5%) | 6 (54.5%) |
| Total (Category) | 96 (90.6%) | 10 (9.4%) |
| Total (Overall) | 533 (62.4%) | 321 (37.6%) |
Employment Industries by Sex in Melbourne
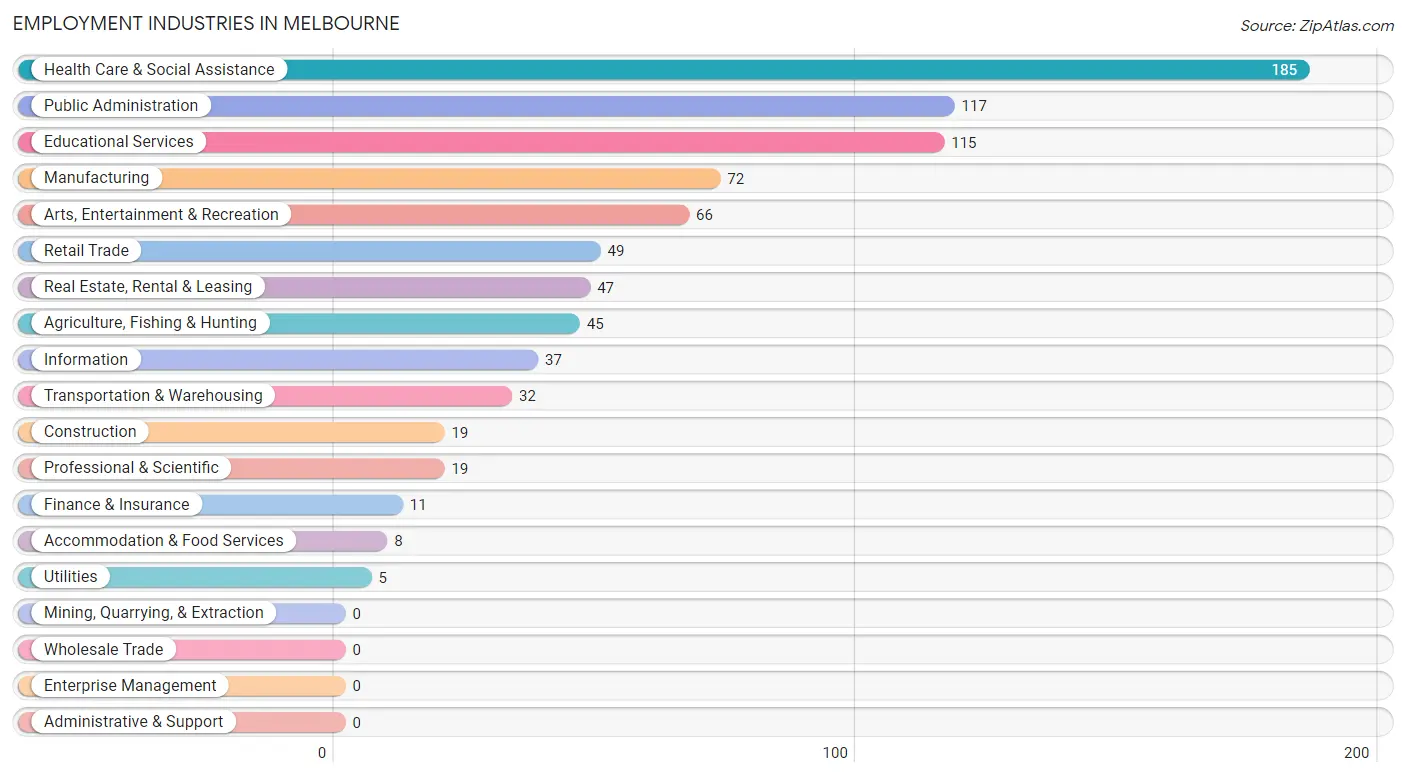
Employment Industries in Melbourne
The major employment industries in Melbourne include Health Care & Social Assistance (185 | 21.7%), Public Administration (117 | 13.7%), Educational Services (115 | 13.5%), Manufacturing (72 | 8.4%), and Arts, Entertainment & Recreation (66 | 7.7%).
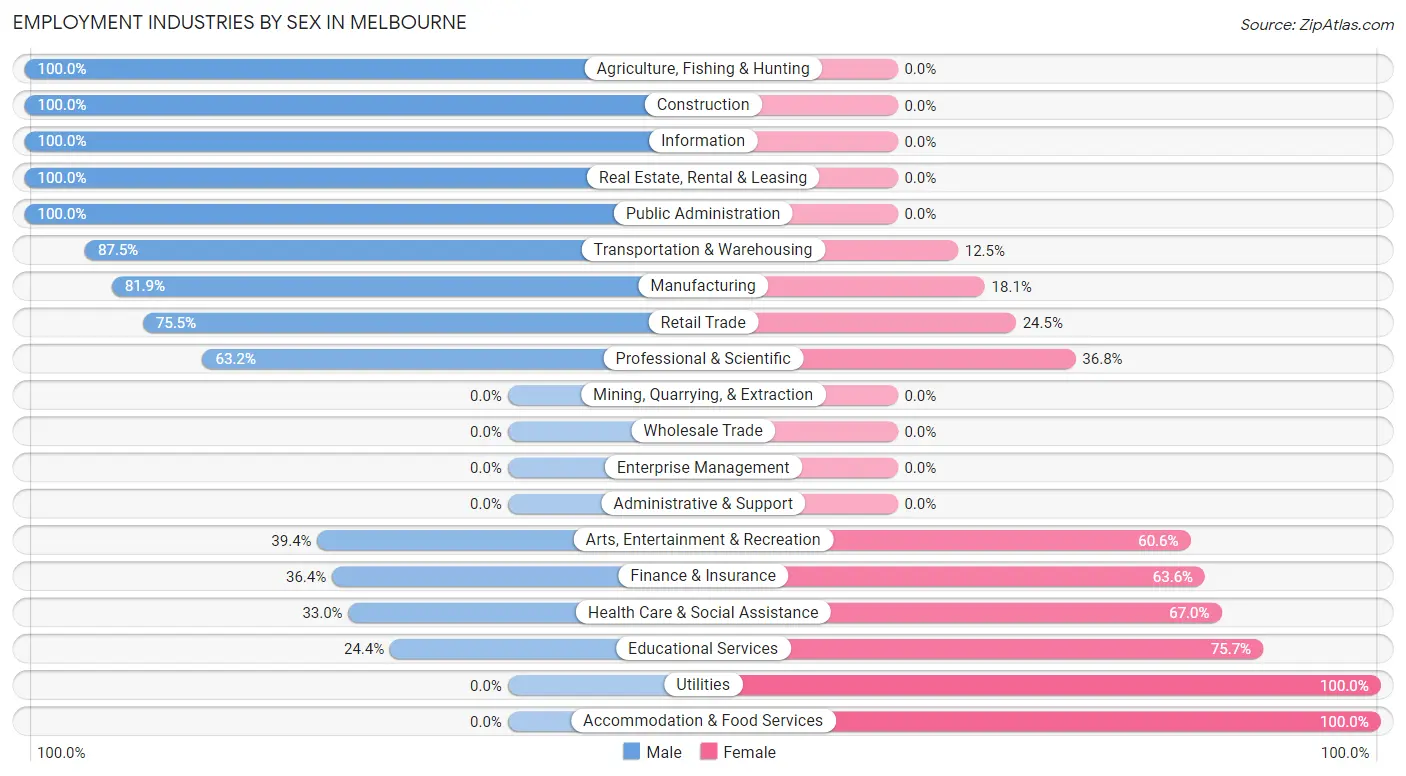
Employment Industries by Sex in Melbourne
The Melbourne industries that see more men than women are Agriculture, Fishing & Hunting (100.0%), Construction (100.0%), and Information (100.0%), whereas the industries that tend to have a higher number of women are Utilities (100.0%), Accommodation & Food Services (100.0%), and Educational Services (75.6%).
| Industry | Male | Female |
| Agriculture, Fishing & Hunting | 45 (100.0%) | 0 (0.0%) |
| Mining, Quarrying, & Extraction | 0 (0.0%) | 0 (0.0%) |
| Construction | 19 (100.0%) | 0 (0.0%) |
| Manufacturing | 59 (81.9%) | 13 (18.1%) |
| Wholesale Trade | 0 (0.0%) | 0 (0.0%) |
| Retail Trade | 37 (75.5%) | 12 (24.5%) |
| Transportation & Warehousing | 28 (87.5%) | 4 (12.5%) |
| Utilities | 0 (0.0%) | 5 (100.0%) |
| Information | 37 (100.0%) | 0 (0.0%) |
| Finance & Insurance | 4 (36.4%) | 7 (63.6%) |
| Real Estate, Rental & Leasing | 47 (100.0%) | 0 (0.0%) |
| Professional & Scientific | 12 (63.2%) | 7 (36.8%) |
| Enterprise Management | 0 (0.0%) | 0 (0.0%) |
| Administrative & Support | 0 (0.0%) | 0 (0.0%) |
| Educational Services | 28 (24.3%) | 87 (75.6%) |
| Health Care & Social Assistance | 61 (33.0%) | 124 (67.0%) |
| Arts, Entertainment & Recreation | 26 (39.4%) | 40 (60.6%) |
| Accommodation & Food Services | 0 (0.0%) | 8 (100.0%) |
| Public Administration | 117 (100.0%) | 0 (0.0%) |
| Total | 533 (62.4%) | 321 (37.6%) |
Education in Melbourne
School Enrollment in Melbourne
The most common levels of schooling among the 709 students in Melbourne are elementary school (208 | 29.3%), middle school (173 | 24.4%), and high school (165 | 23.3%).
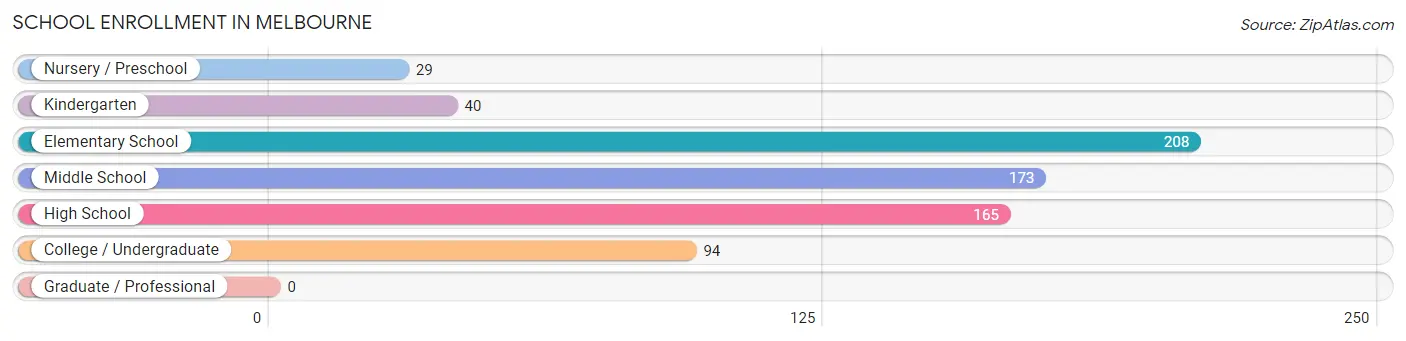
| School Level | # Students | % Students |
| Nursery / Preschool | 29 | 4.1% |
| Kindergarten | 40 | 5.6% |
| Elementary School | 208 | 29.3% |
| Middle School | 173 | 24.4% |
| High School | 165 | 23.3% |
| College / Undergraduate | 94 | 13.3% |
| Graduate / Professional | 0 | 0.0% |
| Total | 709 | 100.0% |
School Enrollment by Age by Funding Source in Melbourne
Out of a total of 709 students who are enrolled in schools in Melbourne, 46 (6.5%) attend a private institution, while the remaining 663 (93.5%) are enrolled in public schools. The age group of 35 years and over has the highest likelihood of being enrolled in private schools, with 6 (40.0% in the age bracket) enrolled. Conversely, the age group of 3 to 4 year olds has the lowest likelihood of being enrolled in a private school, with 32 (100.0% in the age bracket) attending a public institution.
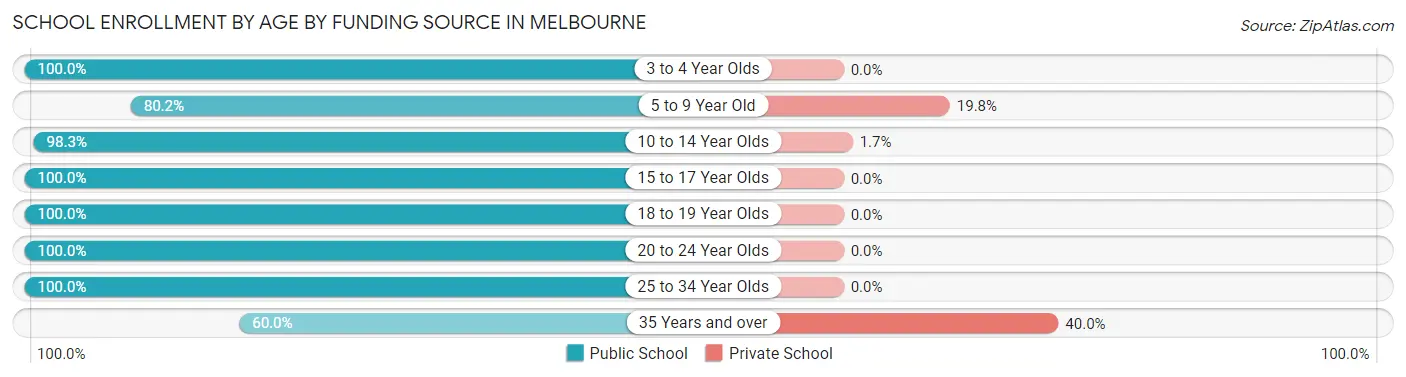
| Age Bracket | Public School | Private School |
| 3 to 4 Year Olds | 32 (100.0%) | 0 (0.0%) |
| 5 to 9 Year Old | 146 (80.2%) | 36 (19.8%) |
| 10 to 14 Year Olds | 232 (98.3%) | 4 (1.7%) |
| 15 to 17 Year Olds | 128 (100.0%) | 0 (0.0%) |
| 18 to 19 Year Olds | 56 (100.0%) | 0 (0.0%) |
| 20 to 24 Year Olds | 4 (100.0%) | 0 (0.0%) |
| 25 to 34 Year Olds | 56 (100.0%) | 0 (0.0%) |
| 35 Years and over | 9 (60.0%) | 6 (40.0%) |
| Total | 663 (93.5%) | 46 (6.5%) |
Educational Attainment by Field of Study in Melbourne
Business (68 | 23.6%), science & technology (52 | 18.1%), education (43 | 14.9%), communications (41 | 14.2%), and physical & health sciences (22 | 7.6%) are the most common fields of study among 288 individuals in Melbourne who have obtained a bachelor's degree or higher.
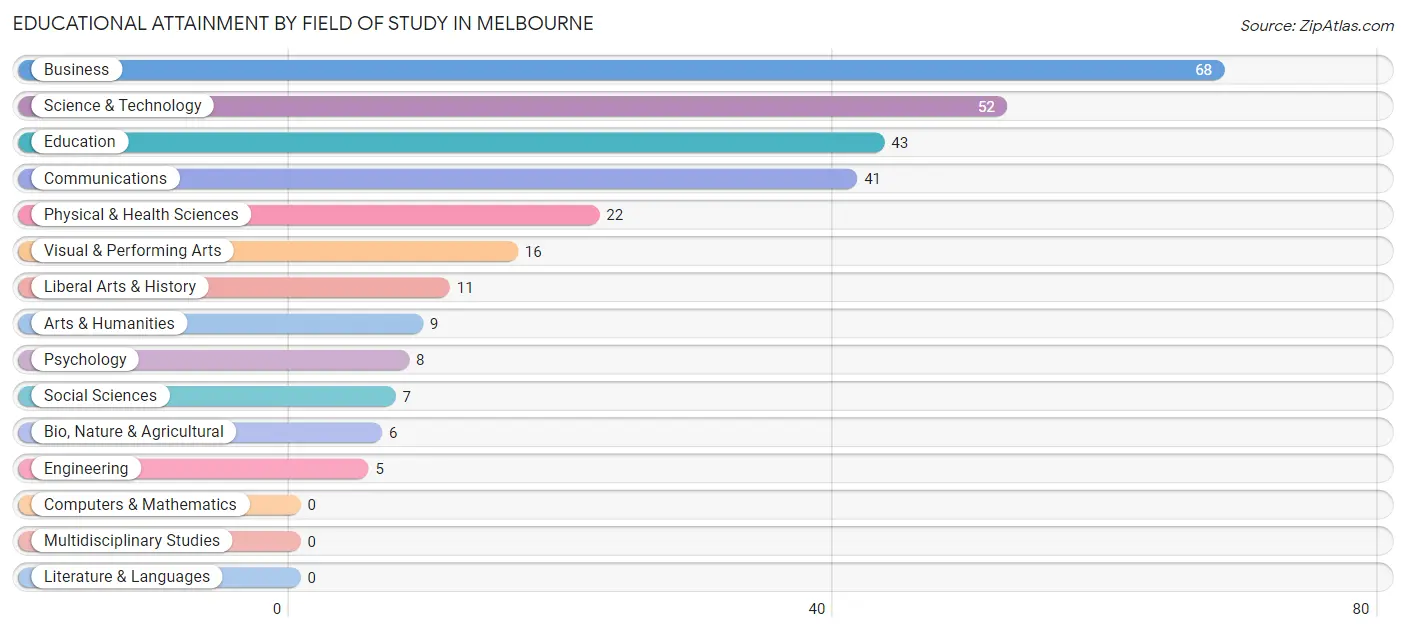
| Field of Study | # Graduates | % Graduates |
| Computers & Mathematics | 0 | 0.0% |
| Bio, Nature & Agricultural | 6 | 2.1% |
| Physical & Health Sciences | 22 | 7.6% |
| Psychology | 8 | 2.8% |
| Social Sciences | 7 | 2.4% |
| Engineering | 5 | 1.7% |
| Multidisciplinary Studies | 0 | 0.0% |
| Science & Technology | 52 | 18.1% |
| Business | 68 | 23.6% |
| Education | 43 | 14.9% |
| Literature & Languages | 0 | 0.0% |
| Liberal Arts & History | 11 | 3.8% |
| Visual & Performing Arts | 16 | 5.6% |
| Communications | 41 | 14.2% |
| Arts & Humanities | 9 | 3.1% |
| Total | 288 | 100.0% |
Transportation & Commute in Melbourne
Vehicle Availability by Sex in Melbourne
The most prevalent vehicle ownership categories in Melbourne are males with 2 vehicles (152, accounting for 30.1%) and females with 2 vehicles (108, making up 48.2%).
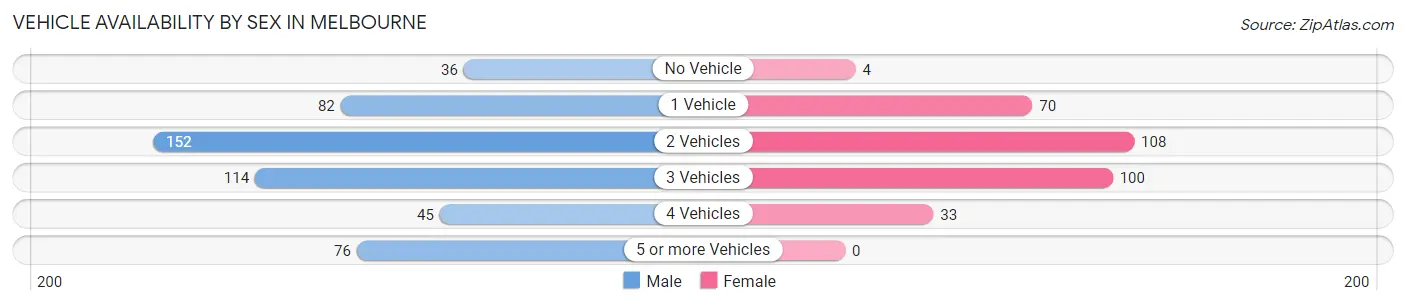
| Vehicles Available | Male | Female |
| No Vehicle | 36 (7.1%) | 4 (1.3%) |
| 1 Vehicle | 82 (16.2%) | 70 (22.2%) |
| 2 Vehicles | 152 (30.1%) | 108 (34.3%) |
| 3 Vehicles | 114 (22.6%) | 100 (31.8%) |
| 4 Vehicles | 45 (8.9%) | 33 (10.5%) |
| 5 or more Vehicles | 76 (15.0%) | 0 (0.0%) |
| Total | 505 (100.0%) | 315 (100.0%) |
Commute Time in Melbourne
The most frequently occuring commute durations in Melbourne are 5 to 9 minutes (199 commuters, 25.5%), less than 5 minutes (120 commuters, 15.3%), and 30 to 34 minutes (94 commuters, 12.0%).
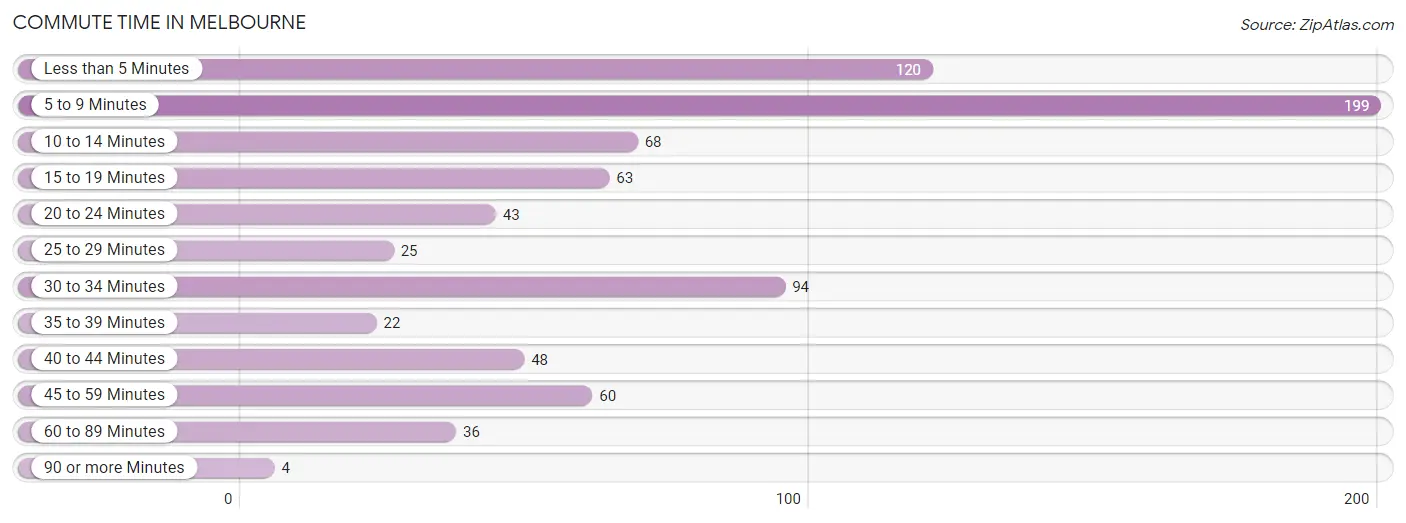
| Commute Time | # Commuters | % Commuters |
| Less than 5 Minutes | 120 | 15.3% |
| 5 to 9 Minutes | 199 | 25.5% |
| 10 to 14 Minutes | 68 | 8.7% |
| 15 to 19 Minutes | 63 | 8.1% |
| 20 to 24 Minutes | 43 | 5.5% |
| 25 to 29 Minutes | 25 | 3.2% |
| 30 to 34 Minutes | 94 | 12.0% |
| 35 to 39 Minutes | 22 | 2.8% |
| 40 to 44 Minutes | 48 | 6.1% |
| 45 to 59 Minutes | 60 | 7.7% |
| 60 to 89 Minutes | 36 | 4.6% |
| 90 or more Minutes | 4 | 0.5% |
Commute Time by Sex in Melbourne
The most common commute times in Melbourne are 5 to 9 minutes (153 commuters, 32.7%) for males and less than 5 minutes (70 commuters, 22.3%) for females.
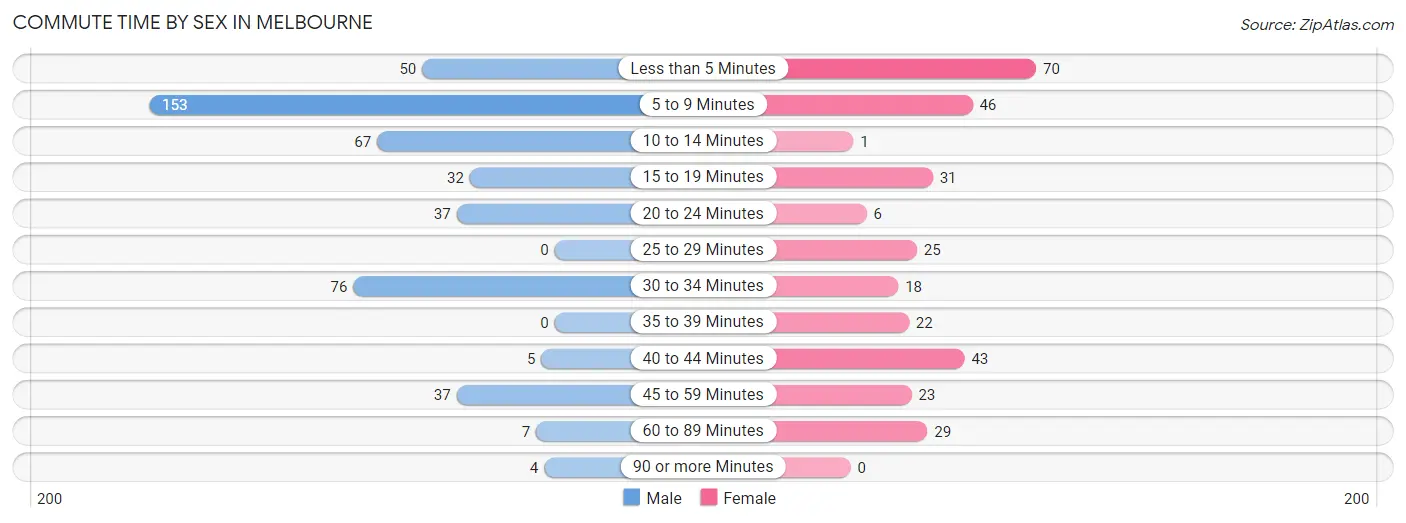
| Commute Time | Male | Female |
| Less than 5 Minutes | 50 (10.7%) | 70 (22.3%) |
| 5 to 9 Minutes | 153 (32.7%) | 46 (14.6%) |
| 10 to 14 Minutes | 67 (14.3%) | 1 (0.3%) |
| 15 to 19 Minutes | 32 (6.8%) | 31 (9.9%) |
| 20 to 24 Minutes | 37 (7.9%) | 6 (1.9%) |
| 25 to 29 Minutes | 0 (0.0%) | 25 (8.0%) |
| 30 to 34 Minutes | 76 (16.2%) | 18 (5.7%) |
| 35 to 39 Minutes | 0 (0.0%) | 22 (7.0%) |
| 40 to 44 Minutes | 5 (1.1%) | 43 (13.7%) |
| 45 to 59 Minutes | 37 (7.9%) | 23 (7.3%) |
| 60 to 89 Minutes | 7 (1.5%) | 29 (9.2%) |
| 90 or more Minutes | 4 (0.9%) | 0 (0.0%) |
Time of Departure to Work by Sex in Melbourne
The most frequent times of departure to work in Melbourne are 12:00 PM to 3:59 PM (73, 15.6%) for males and 7:00 AM to 7:29 AM (62, 19.8%) for females.
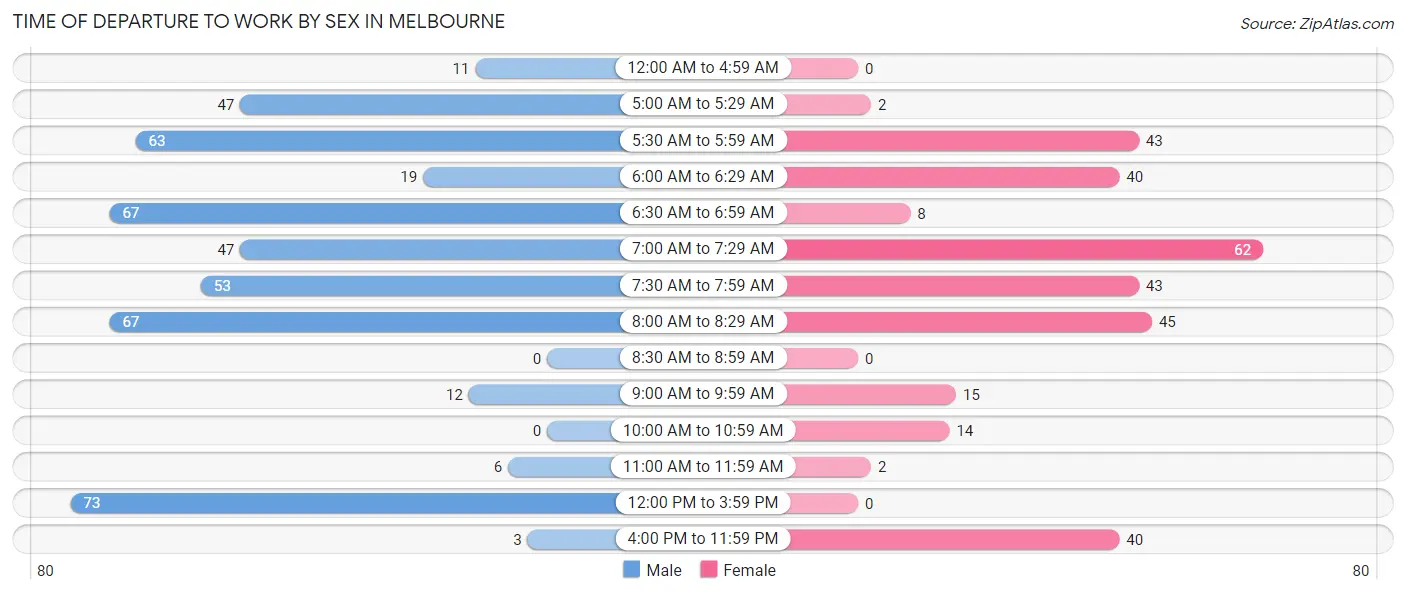
| Time of Departure | Male | Female |
| 12:00 AM to 4:59 AM | 11 (2.4%) | 0 (0.0%) |
| 5:00 AM to 5:29 AM | 47 (10.0%) | 2 (0.6%) |
| 5:30 AM to 5:59 AM | 63 (13.5%) | 43 (13.7%) |
| 6:00 AM to 6:29 AM | 19 (4.1%) | 40 (12.7%) |
| 6:30 AM to 6:59 AM | 67 (14.3%) | 8 (2.5%) |
| 7:00 AM to 7:29 AM | 47 (10.0%) | 62 (19.8%) |
| 7:30 AM to 7:59 AM | 53 (11.3%) | 43 (13.7%) |
| 8:00 AM to 8:29 AM | 67 (14.3%) | 45 (14.3%) |
| 8:30 AM to 8:59 AM | 0 (0.0%) | 0 (0.0%) |
| 9:00 AM to 9:59 AM | 12 (2.6%) | 15 (4.8%) |
| 10:00 AM to 10:59 AM | 0 (0.0%) | 14 (4.5%) |
| 11:00 AM to 11:59 AM | 6 (1.3%) | 2 (0.6%) |
| 12:00 PM to 3:59 PM | 73 (15.6%) | 0 (0.0%) |
| 4:00 PM to 11:59 PM | 3 (0.6%) | 40 (12.7%) |
| Total | 468 (100.0%) | 314 (100.0%) |
Housing Occupancy in Melbourne
Occupancy by Ownership in Melbourne
Of the total 873 dwellings in Melbourne, owner-occupied units account for 492 (56.4%), while renter-occupied units make up 381 (43.6%).
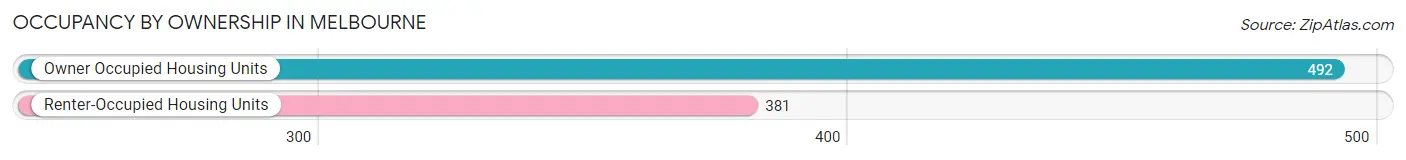
| Occupancy | # Housing Units | % Housing Units |
| Owner Occupied Housing Units | 492 | 56.4% |
| Renter-Occupied Housing Units | 381 | 43.6% |
| Total Occupied Housing Units | 873 | 100.0% |
Occupancy by Household Size in Melbourne
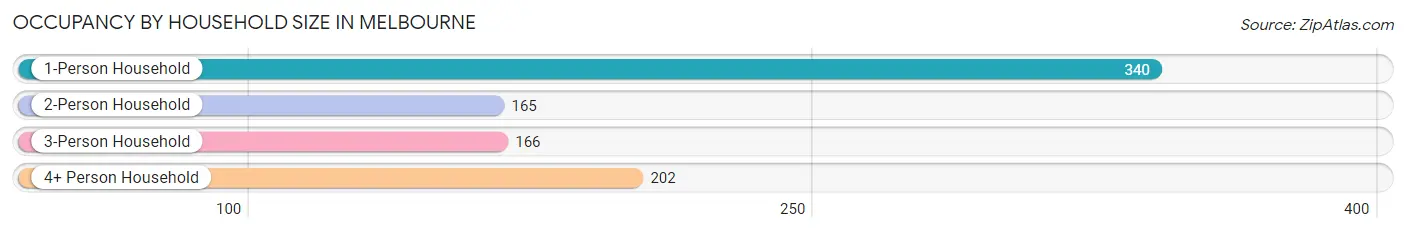
| Household Size | # Housing Units | % Housing Units |
| 1-Person Household | 340 | 39.0% |
| 2-Person Household | 165 | 18.9% |
| 3-Person Household | 166 | 19.0% |
| 4+ Person Household | 202 | 23.1% |
| Total Housing Units | 873 | 100.0% |
Occupancy by Ownership by Household Size in Melbourne
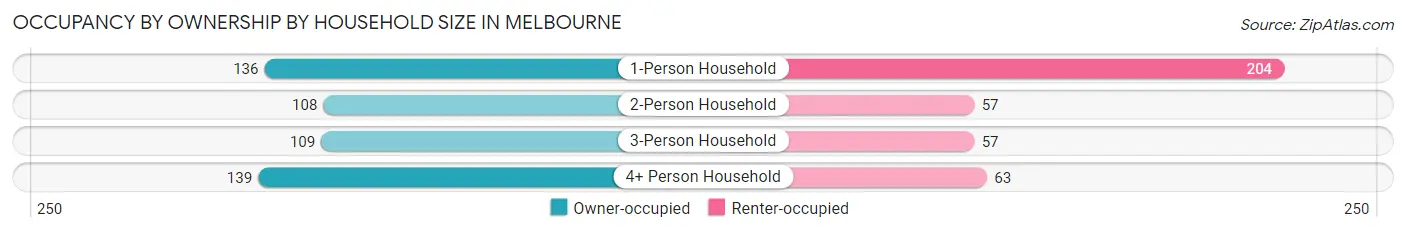
| Household Size | Owner-occupied | Renter-occupied |
| 1-Person Household | 136 (40.0%) | 204 (60.0%) |
| 2-Person Household | 108 (65.4%) | 57 (34.5%) |
| 3-Person Household | 109 (65.7%) | 57 (34.3%) |
| 4+ Person Household | 139 (68.8%) | 63 (31.2%) |
| Total Housing Units | 492 (56.4%) | 381 (43.6%) |
Occupancy by Educational Attainment in Melbourne
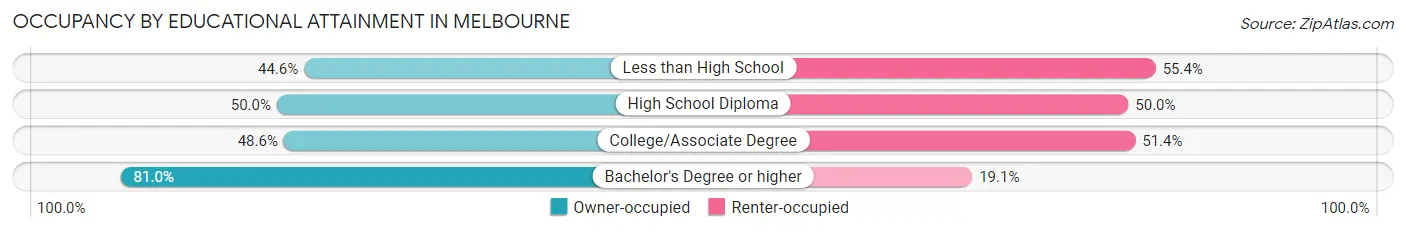
| Household Size | Owner-occupied | Renter-occupied |
| Less than High School | 37 (44.6%) | 46 (55.4%) |
| High School Diploma | 109 (50.0%) | 109 (50.0%) |
| College/Associate Degree | 176 (48.6%) | 186 (51.4%) |
| Bachelor's Degree or higher | 170 (80.9%) | 40 (19.1%) |
Occupancy by Age of Householder in Melbourne
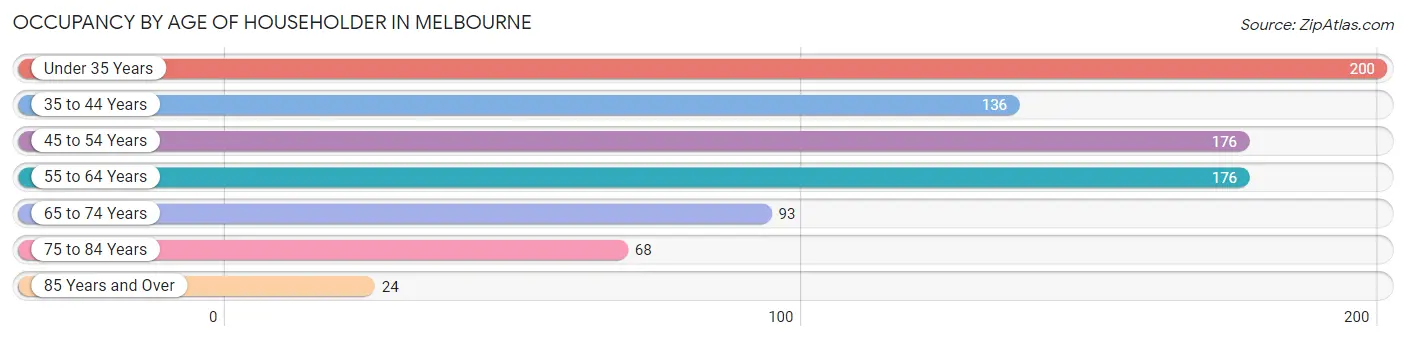
| Age Bracket | # Households | % Households |
| Under 35 Years | 200 | 22.9% |
| 35 to 44 Years | 136 | 15.6% |
| 45 to 54 Years | 176 | 20.2% |
| 55 to 64 Years | 176 | 20.2% |
| 65 to 74 Years | 93 | 10.6% |
| 75 to 84 Years | 68 | 7.8% |
| 85 Years and Over | 24 | 2.8% |
| Total | 873 | 100.0% |
Housing Finances in Melbourne
Median Income by Occupancy in Melbourne
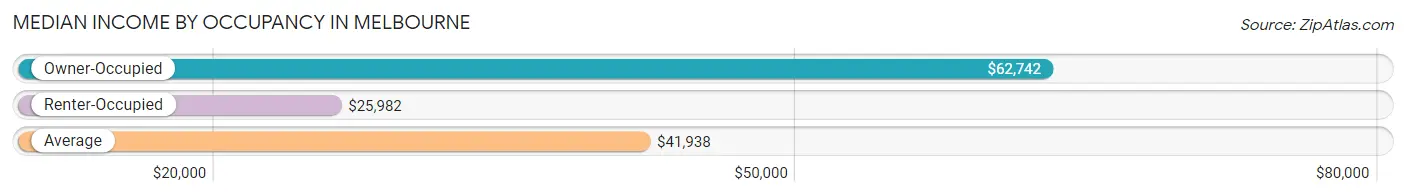
| Occupancy Type | # Households | Median Income |
| Owner-Occupied | 492 (56.4%) | $62,742 |
| Renter-Occupied | 381 (43.6%) | $25,982 |
| Average | 873 (100.0%) | $41,938 |
Occupancy by Householder Income Bracket in Melbourne
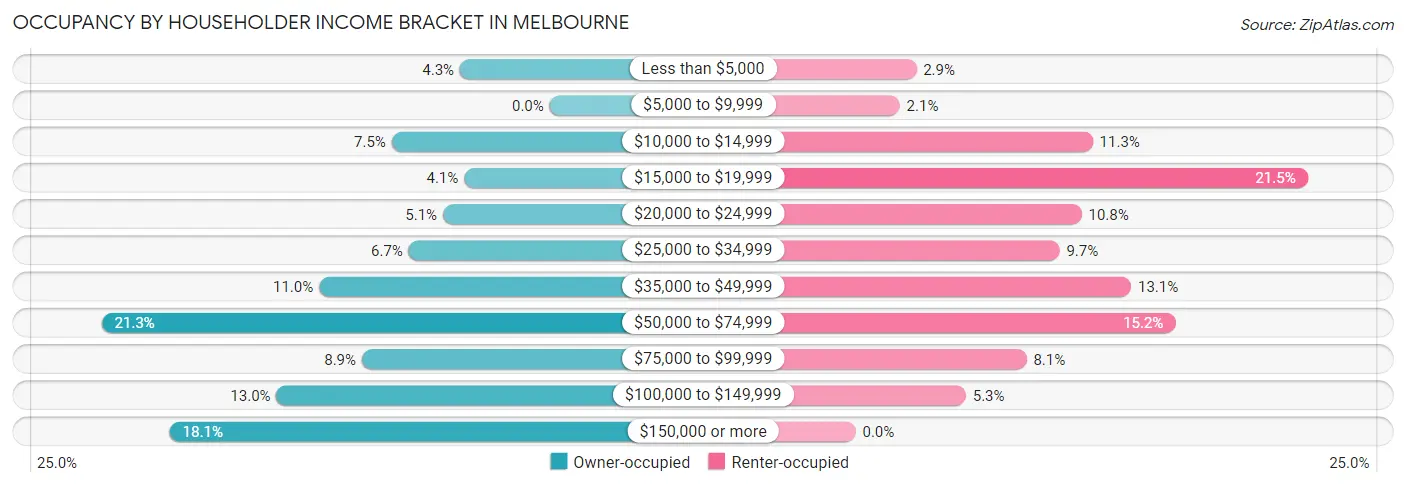
| Income Bracket | Owner-occupied | Renter-occupied |
| Less than $5,000 | 21 (4.3%) | 11 (2.9%) |
| $5,000 to $9,999 | 0 (0.0%) | 8 (2.1%) |
| $10,000 to $14,999 | 37 (7.5%) | 43 (11.3%) |
| $15,000 to $19,999 | 20 (4.1%) | 82 (21.5%) |
| $20,000 to $24,999 | 25 (5.1%) | 41 (10.8%) |
| $25,000 to $34,999 | 33 (6.7%) | 37 (9.7%) |
| $35,000 to $49,999 | 54 (11.0%) | 50 (13.1%) |
| $50,000 to $74,999 | 105 (21.3%) | 58 (15.2%) |
| $75,000 to $99,999 | 44 (8.9%) | 31 (8.1%) |
| $100,000 to $149,999 | 64 (13.0%) | 20 (5.2%) |
| $150,000 or more | 89 (18.1%) | 0 (0.0%) |
| Total | 492 (100.0%) | 381 (100.0%) |
Monthly Housing Cost Tiers in Melbourne
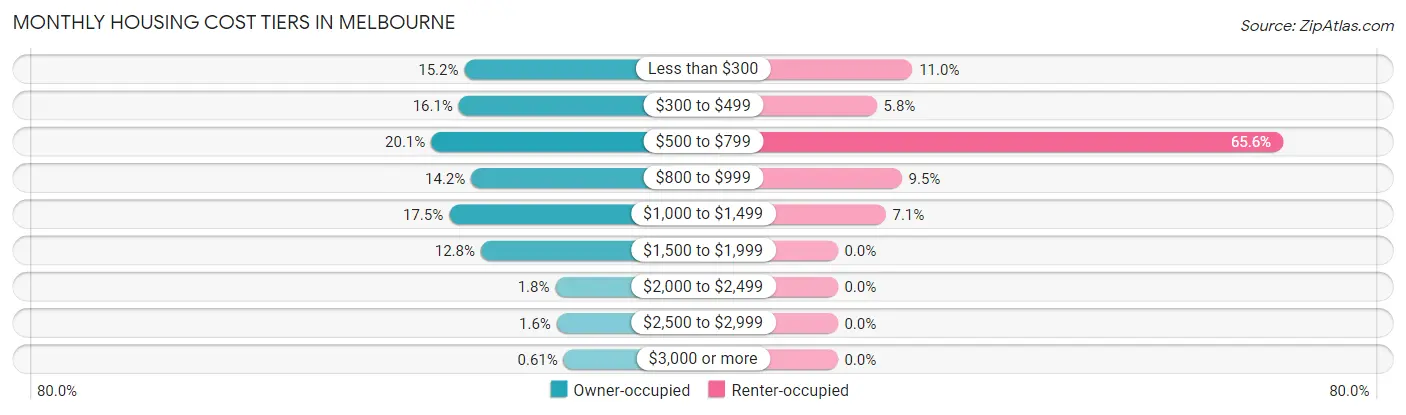
| Monthly Cost | Owner-occupied | Renter-occupied |
| Less than $300 | 75 (15.2%) | 42 (11.0%) |
| $300 to $499 | 79 (16.1%) | 22 (5.8%) |
| $500 to $799 | 99 (20.1%) | 250 (65.6%) |
| $800 to $999 | 70 (14.2%) | 36 (9.5%) |
| $1,000 to $1,499 | 86 (17.5%) | 27 (7.1%) |
| $1,500 to $1,999 | 63 (12.8%) | 0 (0.0%) |
| $2,000 to $2,499 | 9 (1.8%) | 0 (0.0%) |
| $2,500 to $2,999 | 8 (1.6%) | 0 (0.0%) |
| $3,000 or more | 3 (0.6%) | 0 (0.0%) |
| Total | 492 (100.0%) | 381 (100.0%) |
Physical Housing Characteristics in Melbourne
Housing Structures in Melbourne
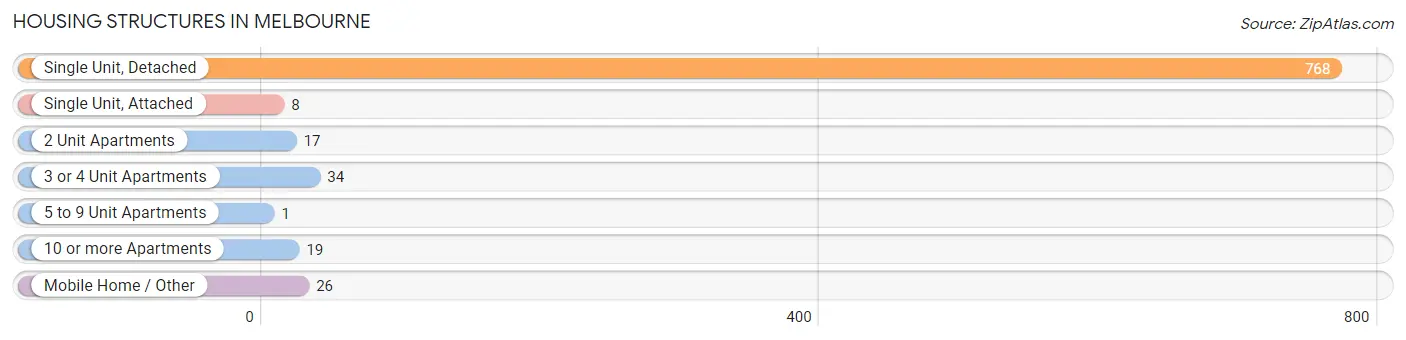
| Structure Type | # Housing Units | % Housing Units |
| Single Unit, Detached | 768 | 88.0% |
| Single Unit, Attached | 8 | 0.9% |
| 2 Unit Apartments | 17 | 1.9% |
| 3 or 4 Unit Apartments | 34 | 3.9% |
| 5 to 9 Unit Apartments | 1 | 0.1% |
| 10 or more Apartments | 19 | 2.2% |
| Mobile Home / Other | 26 | 3.0% |
| Total | 873 | 100.0% |
Housing Structures by Occupancy in Melbourne
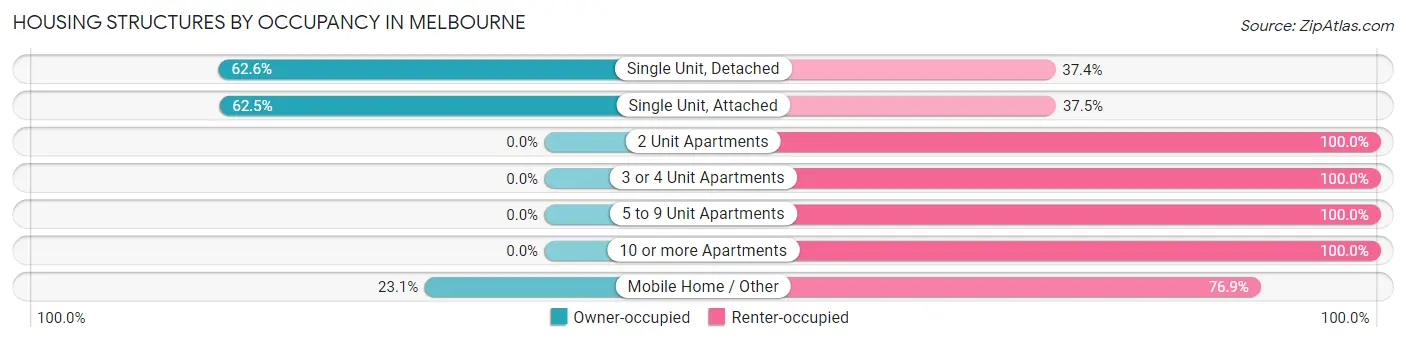
| Structure Type | Owner-occupied | Renter-occupied |
| Single Unit, Detached | 481 (62.6%) | 287 (37.4%) |
| Single Unit, Attached | 5 (62.5%) | 3 (37.5%) |
| 2 Unit Apartments | 0 (0.0%) | 17 (100.0%) |
| 3 or 4 Unit Apartments | 0 (0.0%) | 34 (100.0%) |
| 5 to 9 Unit Apartments | 0 (0.0%) | 1 (100.0%) |
| 10 or more Apartments | 0 (0.0%) | 19 (100.0%) |
| Mobile Home / Other | 6 (23.1%) | 20 (76.9%) |
| Total | 492 (56.4%) | 381 (43.6%) |
Housing Structures by Number of Rooms in Melbourne
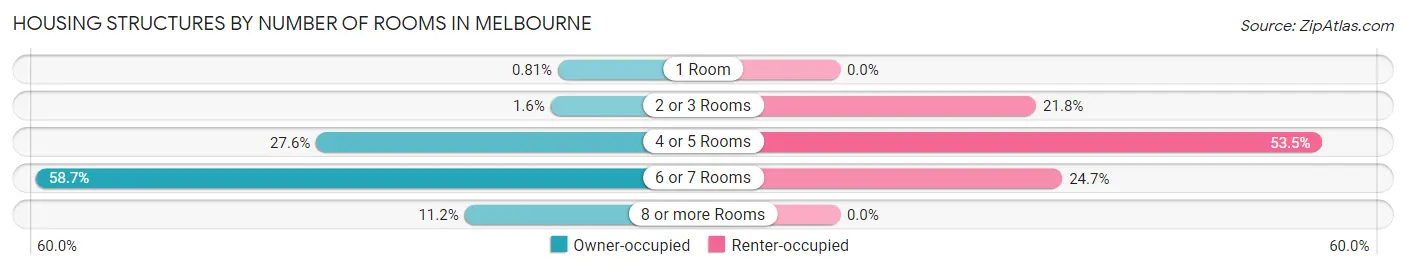
| Number of Rooms | Owner-occupied | Renter-occupied |
| 1 Room | 4 (0.8%) | 0 (0.0%) |
| 2 or 3 Rooms | 8 (1.6%) | 83 (21.8%) |
| 4 or 5 Rooms | 136 (27.6%) | 204 (53.5%) |
| 6 or 7 Rooms | 289 (58.7%) | 94 (24.7%) |
| 8 or more Rooms | 55 (11.2%) | 0 (0.0%) |
| Total | 492 (100.0%) | 381 (100.0%) |
Housing Structure by Heating Type in Melbourne
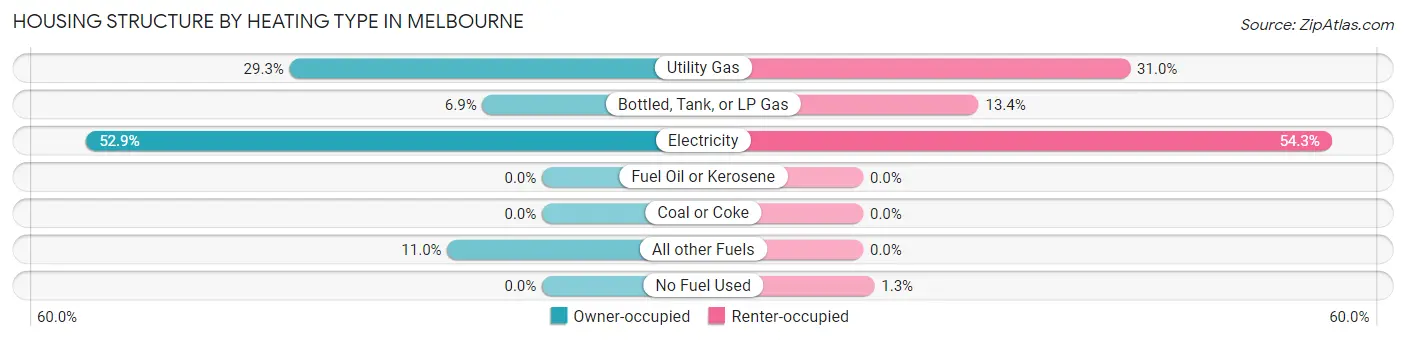
| Heating Type | Owner-occupied | Renter-occupied |
| Utility Gas | 144 (29.3%) | 118 (31.0%) |
| Bottled, Tank, or LP Gas | 34 (6.9%) | 51 (13.4%) |
| Electricity | 260 (52.8%) | 207 (54.3%) |
| Fuel Oil or Kerosene | 0 (0.0%) | 0 (0.0%) |
| Coal or Coke | 0 (0.0%) | 0 (0.0%) |
| All other Fuels | 54 (11.0%) | 0 (0.0%) |
| No Fuel Used | 0 (0.0%) | 5 (1.3%) |
| Total | 492 (100.0%) | 381 (100.0%) |
Household Vehicle Usage in Melbourne
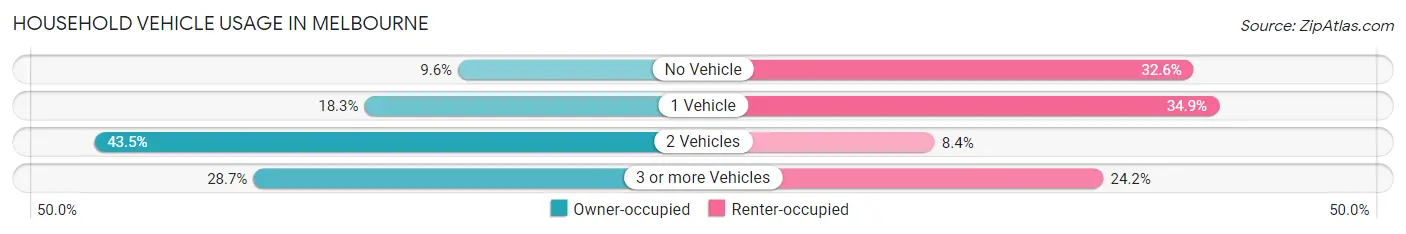
| Vehicles per Household | Owner-occupied | Renter-occupied |
| No Vehicle | 47 (9.6%) | 124 (32.6%) |
| 1 Vehicle | 90 (18.3%) | 133 (34.9%) |
| 2 Vehicles | 214 (43.5%) | 32 (8.4%) |
| 3 or more Vehicles | 141 (28.7%) | 92 (24.1%) |
| Total | 492 (100.0%) | 381 (100.0%) |
Real Estate & Mortgages in Melbourne
Real Estate and Mortgage Overview in Melbourne
| Characteristic | Without Mortgage | With Mortgage |
| Housing Units | 201 | 291 |
| Median Property Value | $128,500 | $177,200 |
| Median Household Income | $34,345 | $86 |
| Monthly Housing Costs | $347 | $3 |
| Real Estate Taxes | $681 | $5 |
Property Value by Mortgage Status in Melbourne
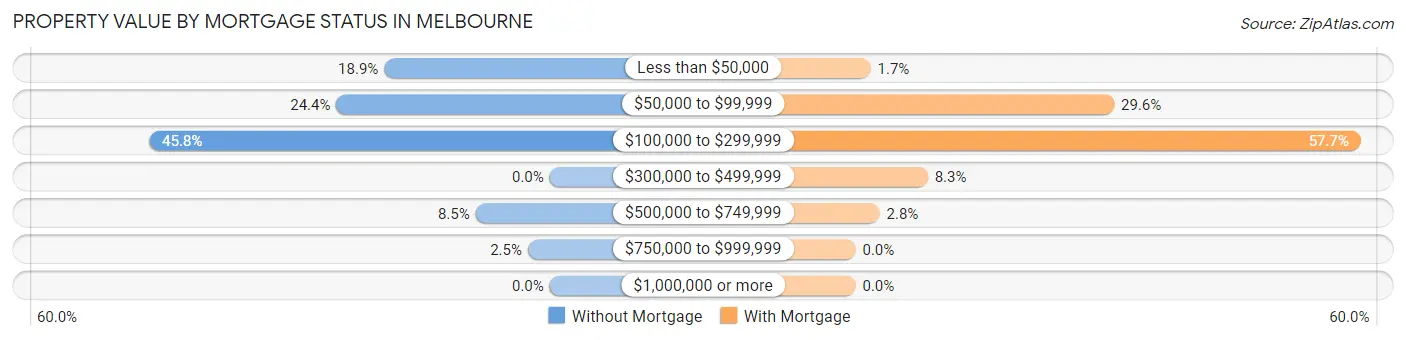
| Property Value | Without Mortgage | With Mortgage |
| Less than $50,000 | 38 (18.9%) | 5 (1.7%) |
| $50,000 to $99,999 | 49 (24.4%) | 86 (29.5%) |
| $100,000 to $299,999 | 92 (45.8%) | 168 (57.7%) |
| $300,000 to $499,999 | 0 (0.0%) | 24 (8.3%) |
| $500,000 to $749,999 | 17 (8.5%) | 8 (2.8%) |
| $750,000 to $999,999 | 5 (2.5%) | 0 (0.0%) |
| $1,000,000 or more | 0 (0.0%) | 0 (0.0%) |
| Total | 201 (100.0%) | 291 (100.0%) |
Household Income by Mortgage Status in Melbourne
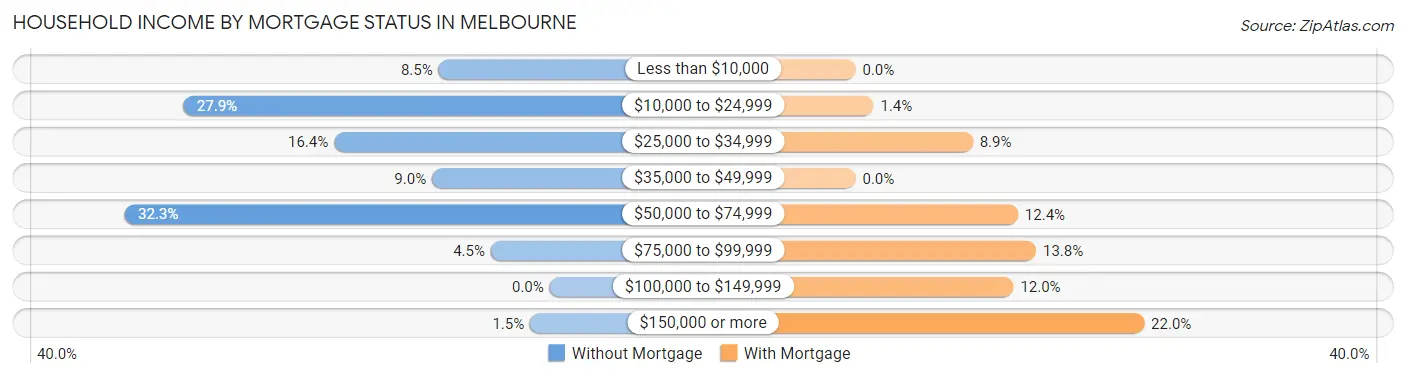
| Household Income | Without Mortgage | With Mortgage |
| Less than $10,000 | 17 (8.5%) | 0 (0.0%) |
| $10,000 to $24,999 | 56 (27.9%) | 4 (1.4%) |
| $25,000 to $34,999 | 33 (16.4%) | 26 (8.9%) |
| $35,000 to $49,999 | 18 (9.0%) | 0 (0.0%) |
| $50,000 to $74,999 | 65 (32.3%) | 36 (12.4%) |
| $75,000 to $99,999 | 9 (4.5%) | 40 (13.8%) |
| $100,000 to $149,999 | 0 (0.0%) | 35 (12.0%) |
| $150,000 or more | 3 (1.5%) | 64 (22.0%) |
| Total | 201 (100.0%) | 291 (100.0%) |
Property Value to Household Income Ratio in Melbourne
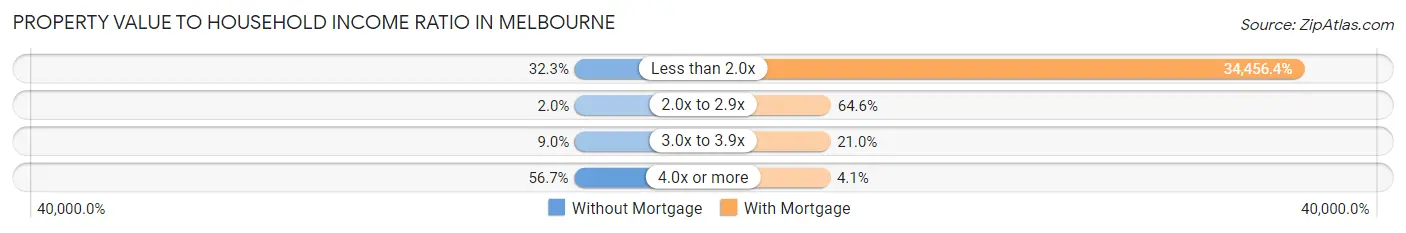
| Value-to-Income Ratio | Without Mortgage | With Mortgage |
| Less than 2.0x | 65 (32.3%) | 100,268 (34,456.4%) |
| 2.0x to 2.9x | 4 (2.0%) | 188 (64.6%) |
| 3.0x to 3.9x | 18 (9.0%) | 61 (21.0%) |
| 4.0x or more | 114 (56.7%) | 12 (4.1%) |
| Total | 201 (100.0%) | 291 (100.0%) |
Real Estate Taxes by Mortgage Status in Melbourne
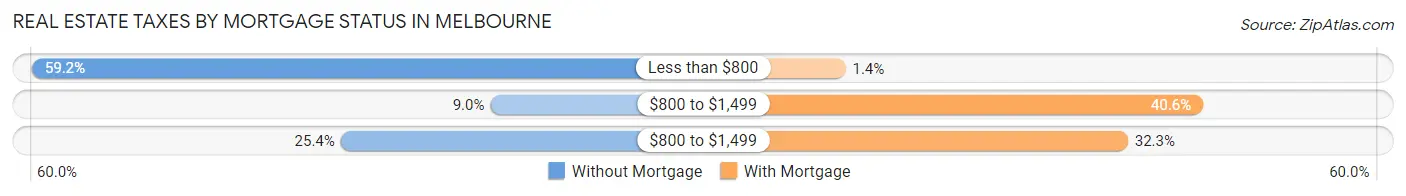
| Property Taxes | Without Mortgage | With Mortgage |
| Less than $800 | 119 (59.2%) | 4 (1.4%) |
| $800 to $1,499 | 18 (9.0%) | 118 (40.6%) |
| $800 to $1,499 | 51 (25.4%) | 94 (32.3%) |
| Total | 201 (100.0%) | 291 (100.0%) |
Health & Disability in Melbourne
Health Insurance Coverage by Age in Melbourne
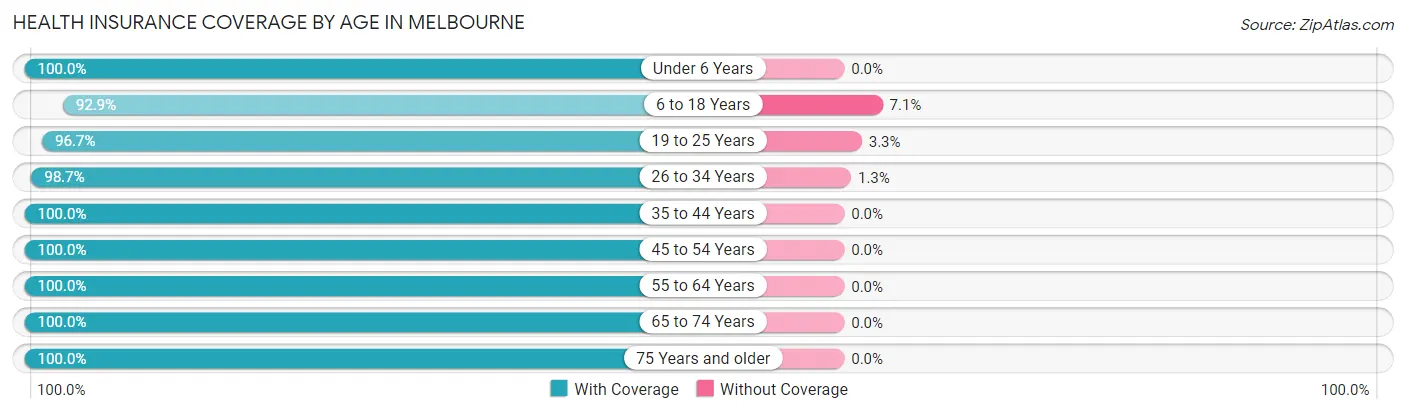
| Age Bracket | With Coverage | Without Coverage |
| Under 6 Years | 189 (100.0%) | 0 (0.0%) |
| 6 to 18 Years | 533 (92.9%) | 41 (7.1%) |
| 19 to 25 Years | 267 (96.7%) | 9 (3.3%) |
| 26 to 34 Years | 235 (98.7%) | 3 (1.3%) |
| 35 to 44 Years | 231 (100.0%) | 0 (0.0%) |
| 45 to 54 Years | 186 (100.0%) | 0 (0.0%) |
| 55 to 64 Years | 271 (100.0%) | 0 (0.0%) |
| 65 to 74 Years | 204 (100.0%) | 0 (0.0%) |
| 75 Years and older | 147 (100.0%) | 0 (0.0%) |
| Total | 2,263 (97.7%) | 53 (2.3%) |
Health Insurance Coverage by Citizenship Status in Melbourne
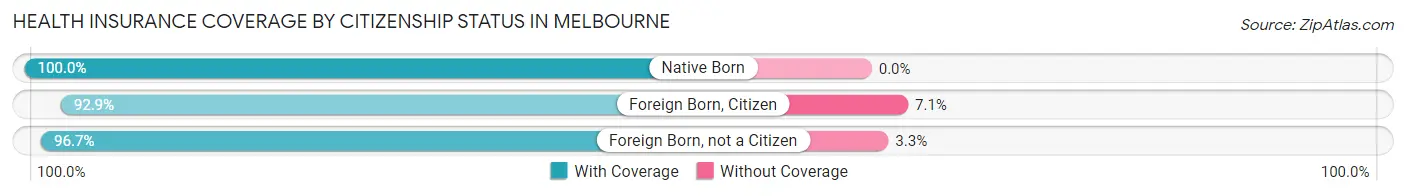
| Citizenship Status | With Coverage | Without Coverage |
| Native Born | 189 (100.0%) | 0 (0.0%) |
| Foreign Born, Citizen | 533 (92.9%) | 41 (7.1%) |
| Foreign Born, not a Citizen | 267 (96.7%) | 9 (3.3%) |
Health Insurance Coverage by Household Income in Melbourne
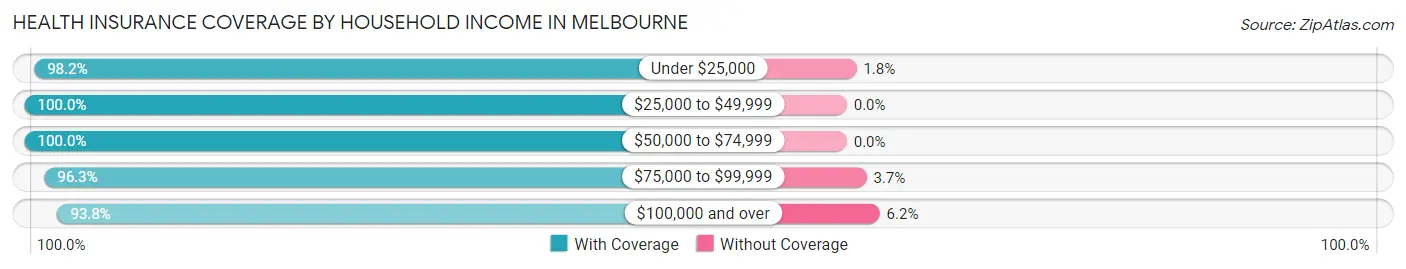
| Household Income | With Coverage | Without Coverage |
| Under $25,000 | 706 (98.2%) | 13 (1.8%) |
| $25,000 to $49,999 | 436 (100.0%) | 0 (0.0%) |
| $50,000 to $74,999 | 437 (100.0%) | 0 (0.0%) |
| $75,000 to $99,999 | 130 (96.3%) | 5 (3.7%) |
| $100,000 and over | 533 (93.8%) | 35 (6.2%) |
Public vs Private Health Insurance Coverage by Age in Melbourne
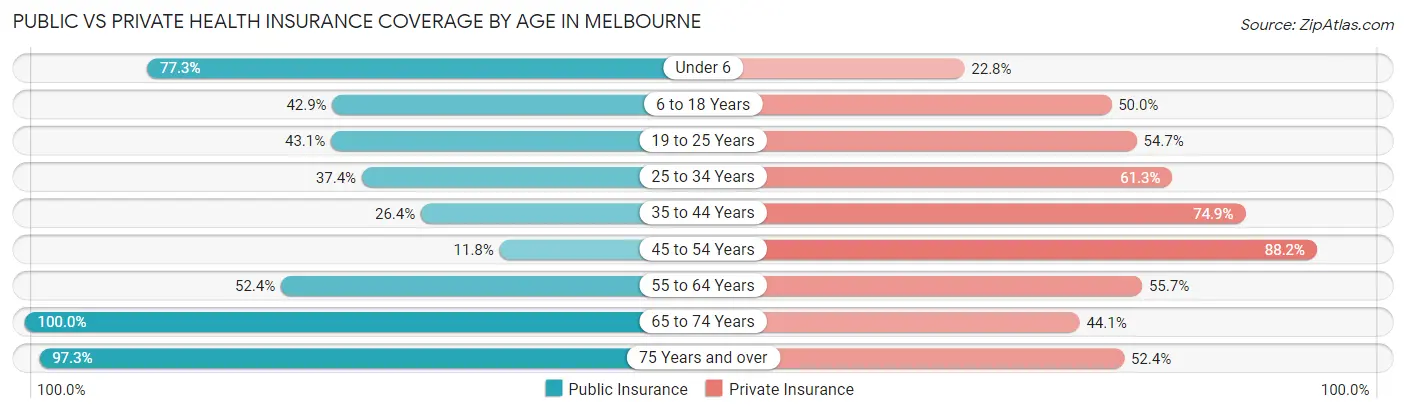
| Age Bracket | Public Insurance | Private Insurance |
| Under 6 | 146 (77.2%) | 43 (22.8%) |
| 6 to 18 Years | 246 (42.9%) | 287 (50.0%) |
| 19 to 25 Years | 119 (43.1%) | 151 (54.7%) |
| 25 to 34 Years | 89 (37.4%) | 146 (61.3%) |
| 35 to 44 Years | 61 (26.4%) | 173 (74.9%) |
| 45 to 54 Years | 22 (11.8%) | 164 (88.2%) |
| 55 to 64 Years | 142 (52.4%) | 151 (55.7%) |
| 65 to 74 Years | 204 (100.0%) | 90 (44.1%) |
| 75 Years and over | 143 (97.3%) | 77 (52.4%) |
| Total | 1,172 (50.6%) | 1,282 (55.3%) |
Disability Status by Sex by Age in Melbourne
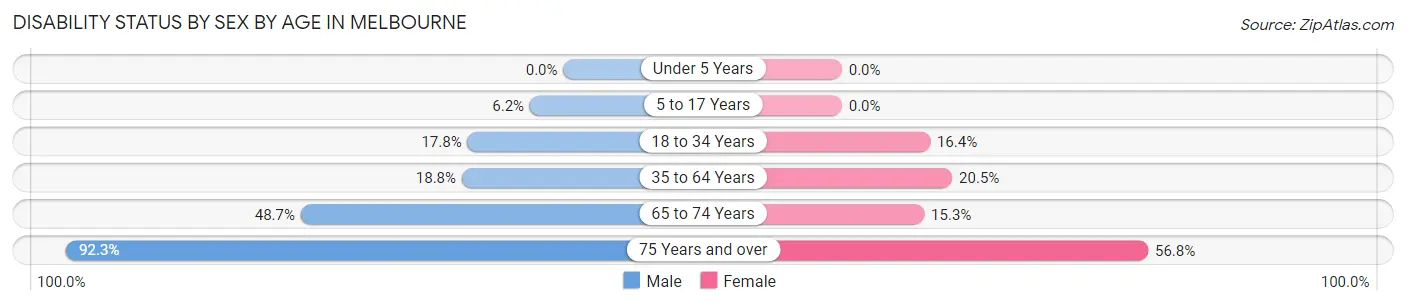
| Age Bracket | Male | Female |
| Under 5 Years | 0 (0.0%) | 0 (0.0%) |
| 5 to 17 Years | 16 (6.2%) | 0 (0.0%) |
| 18 to 34 Years | 58 (17.8%) | 37 (16.4%) |
| 35 to 64 Years | 68 (18.8%) | 67 (20.5%) |
| 65 to 74 Years | 58 (48.7%) | 13 (15.3%) |
| 75 Years and over | 48 (92.3%) | 54 (56.8%) |
Disability Class by Sex by Age in Melbourne
Disability Class: Hearing Difficulty
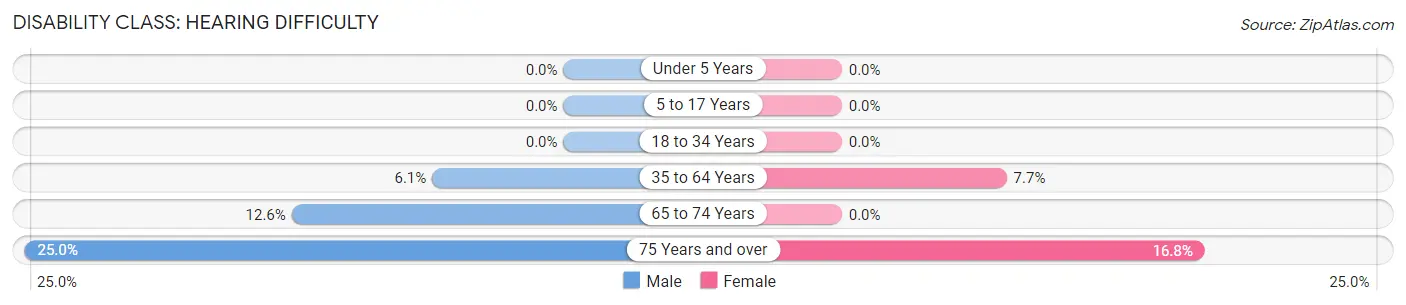
| Age Bracket | Male | Female |
| Under 5 Years | 0 (0.0%) | 0 (0.0%) |
| 5 to 17 Years | 0 (0.0%) | 0 (0.0%) |
| 18 to 34 Years | 0 (0.0%) | 0 (0.0%) |
| 35 to 64 Years | 22 (6.1%) | 25 (7.6%) |
| 65 to 74 Years | 15 (12.6%) | 0 (0.0%) |
| 75 Years and over | 13 (25.0%) | 16 (16.8%) |
Disability Class: Vision Difficulty
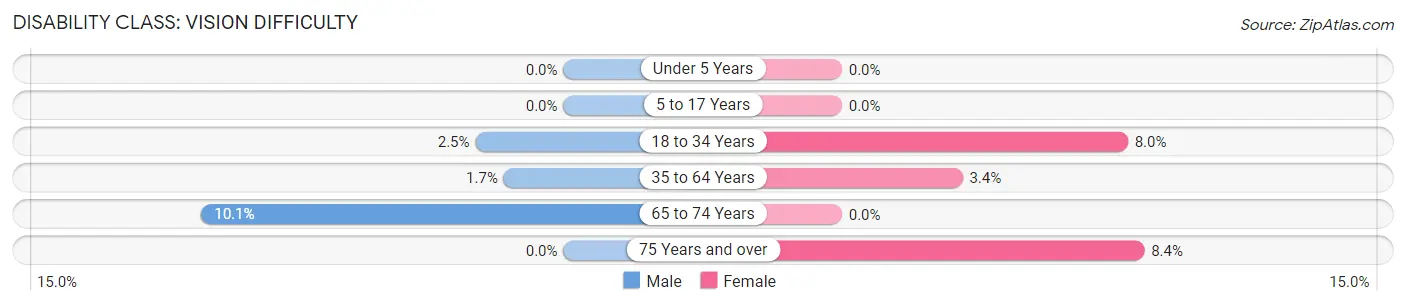
| Age Bracket | Male | Female |
| Under 5 Years | 0 (0.0%) | 0 (0.0%) |
| 5 to 17 Years | 0 (0.0%) | 0 (0.0%) |
| 18 to 34 Years | 8 (2.5%) | 18 (8.0%) |
| 35 to 64 Years | 6 (1.7%) | 11 (3.4%) |
| 65 to 74 Years | 12 (10.1%) | 0 (0.0%) |
| 75 Years and over | 0 (0.0%) | 8 (8.4%) |
Disability Class: Cognitive Difficulty
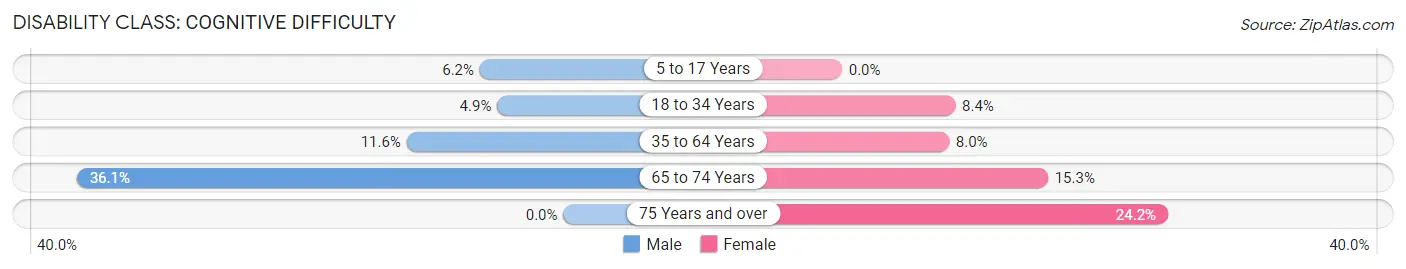
| Age Bracket | Male | Female |
| 5 to 17 Years | 16 (6.2%) | 0 (0.0%) |
| 18 to 34 Years | 16 (4.9%) | 19 (8.4%) |
| 35 to 64 Years | 42 (11.6%) | 26 (8.0%) |
| 65 to 74 Years | 43 (36.1%) | 13 (15.3%) |
| 75 Years and over | 0 (0.0%) | 23 (24.2%) |
Disability Class: Ambulatory Difficulty
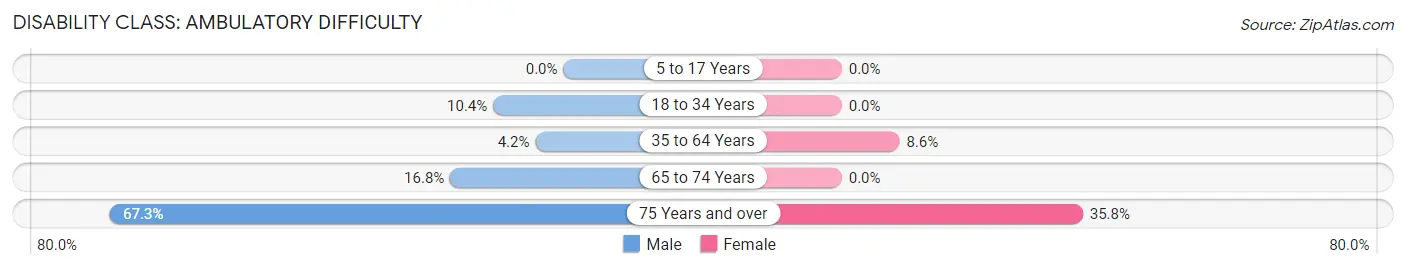
| Age Bracket | Male | Female |
| 5 to 17 Years | 0 (0.0%) | 0 (0.0%) |
| 18 to 34 Years | 34 (10.4%) | 0 (0.0%) |
| 35 to 64 Years | 15 (4.2%) | 28 (8.6%) |
| 65 to 74 Years | 20 (16.8%) | 0 (0.0%) |
| 75 Years and over | 35 (67.3%) | 34 (35.8%) |
Disability Class: Self-Care Difficulty
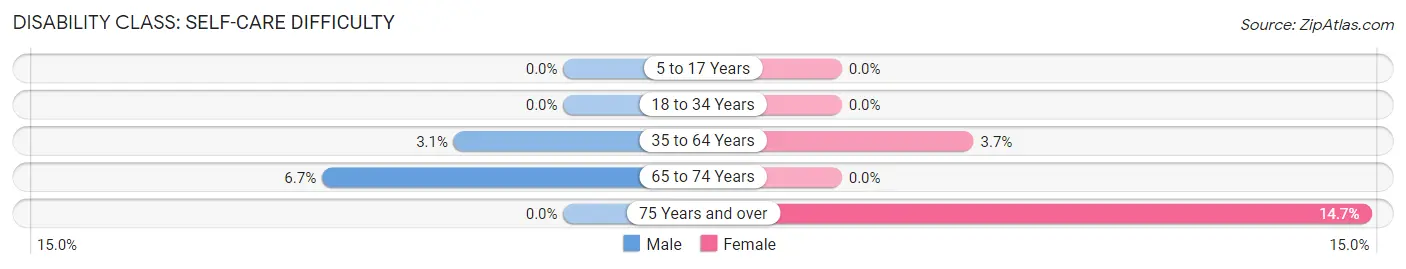
| Age Bracket | Male | Female |
| 5 to 17 Years | 0 (0.0%) | 0 (0.0%) |
| 18 to 34 Years | 0 (0.0%) | 0 (0.0%) |
| 35 to 64 Years | 11 (3.0%) | 12 (3.7%) |
| 65 to 74 Years | 8 (6.7%) | 0 (0.0%) |
| 75 Years and over | 0 (0.0%) | 14 (14.7%) |
Technology Access in Melbourne
Computing Device Access in Melbourne
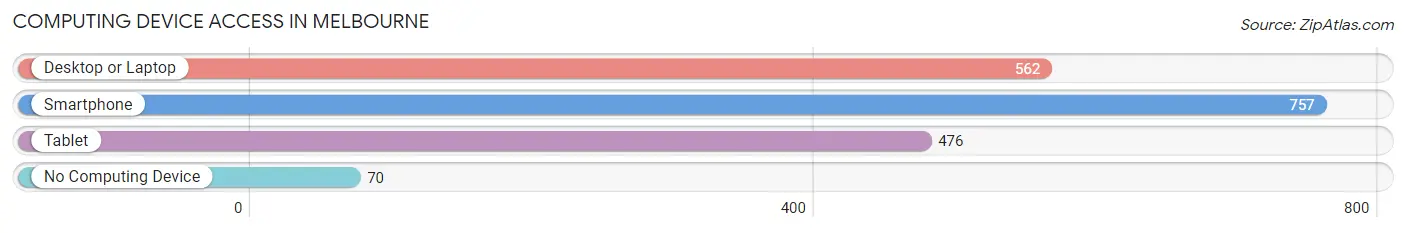
| Device Type | # Households | % Households |
| Desktop or Laptop | 562 | 64.4% |
| Smartphone | 757 | 86.7% |
| Tablet | 476 | 54.5% |
| No Computing Device | 70 | 8.0% |
| Total | 873 | 100.0% |
Internet Access in Melbourne
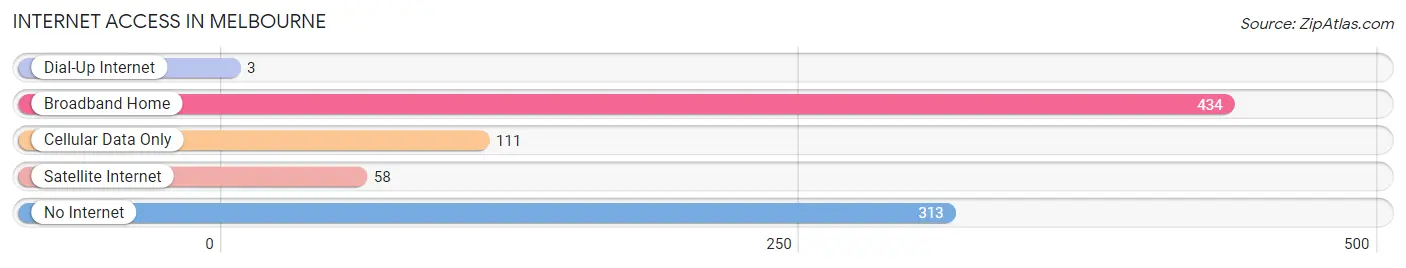
| Internet Type | # Households | % Households |
| Dial-Up Internet | 3 | 0.3% |
| Broadband Home | 434 | 49.7% |
| Cellular Data Only | 111 | 12.7% |
| Satellite Internet | 58 | 6.6% |
| No Internet | 313 | 35.8% |
| Total | 873 | 100.0% |
Melbourne Summary
Melbourne, Arkansas is a small city located in Izard County in the north-central part of the state. It is situated in the foothills of the Ozark Mountains and is surrounded by the White River and its tributaries. The city has a population of approximately 1,500 people and is the county seat of Izard County.
Geography
Melbourne is located in the foothills of the Ozark Mountains in north-central Arkansas. The city is situated on the banks of the White River and its tributaries. The city is surrounded by the Ozark National Forest and the Buffalo National River. The city is located at an elevation of 830 feet above sea level. The climate in Melbourne is mild and humid with hot summers and cold winters.
Economy
The economy of Melbourne is largely based on agriculture and tourism. The city is home to several farms and ranches that produce a variety of crops, including corn, soybeans, wheat, and hay. The city is also home to several manufacturing companies that produce a variety of products, including furniture, clothing, and automotive parts. Tourism is also an important part of the economy, with visitors coming to the area to enjoy the natural beauty of the Ozark Mountains and the Buffalo National River.
Demographics
As of the 2010 census, the population of Melbourne was 1,500. The racial makeup of the city was 95.2% White, 0.7% African American, 0.3% Native American, 0.2% Asian, 0.1% Pacific Islander, and 3.5% from other races. The median household income in Melbourne was $30,938, and the median family income was $37,813. The per capita income in Melbourne was $17,845.
History
Melbourne was founded in 1873 and was originally known as “Mountain Home.” The city was renamed in 1876 in honor of Melbourne, Australia. The city was incorporated in 1881 and was the county seat of Izard County. The city was a major center for the timber industry in the late 19th and early 20th centuries. The city was also home to several sawmills and gristmills. In the late 20th century, the city began to focus more on tourism and agriculture.
Today, Melbourne is a small city with a population of approximately 1,500 people. The city is home to several farms and ranches, as well as several manufacturing companies. The city is also a popular tourist destination, with visitors coming to the area to enjoy the natural beauty of the Ozark Mountains and the Buffalo National River.
Common Questions
What is Per Capita Income in Melbourne?
Per Capita income in Melbourne is $23,470.
What is the Median Family Income in Melbourne?
Median Family Income in Melbourne is $55,161.
What is the Median Household income in Melbourne?
Median Household Income in Melbourne is $41,938.
What is Income or Wage Gap in Melbourne?
Income or Wage Gap in Melbourne is 14.7%.
Women in Melbourne earn 85.3 cents for every dollar earned by a man.
What is Inequality or Gini Index in Melbourne?
Inequality or Gini Index in Melbourne is 0.47.
What is the Total Population of Melbourne?
Total Population of Melbourne is 2,430.
What is the Total Male Population of Melbourne?
Total Male Population of Melbourne is 1,281.
What is the Total Female Population of Melbourne?
Total Female Population of Melbourne is 1,149.
What is the Ratio of Males per 100 Females in Melbourne?
There are 111.49 Males per 100 Females in Melbourne.
What is the Ratio of Females per 100 Males in Melbourne?
There are 89.70 Females per 100 Males in Melbourne.
What is the Median Population Age in Melbourne?
Median Population Age in Melbourne is 32.5 Years.
What is the Average Family Size in Melbourne
Average Family Size in Melbourne is 3.5 People.
What is the Average Household Size in Melbourne
Average Household Size in Melbourne is 2.6 People.
How Large is the Labor Force in Melbourne?
There are 907 People in the Labor Forcein in Melbourne.
What is the Percentage of People in the Labor Force in Melbourne?
49.4% of People are in the Labor Force in Melbourne.
What is the Unemployment Rate in Melbourne?
Unemployment Rate in Melbourne is 5.9%.