Plumerville, AR Map & Demographics
Plumerville Map
Plumerville Overview
$22,714
PER CAPITA INCOME
$61,250
AVG FAMILY INCOME
$34,375
AVG HOUSEHOLD INCOME
32.1%
WAGE / INCOME GAP [ % ]
67.9¢/ $1
WAGE / INCOME GAP [ $ ]
0.39
INEQUALITY / GINI INDEX
802
TOTAL POPULATION
460
MALE POPULATION
342
FEMALE POPULATION
134.50
MALES / 100 FEMALES
74.35
FEMALES / 100 MALES
43.2
MEDIAN AGE
3.0
AVG FAMILY SIZE
2.1
AVG HOUSEHOLD SIZE
374
LABOR FORCE [ PEOPLE ]
54.4%
PERCENT IN LABOR FORCE
4.0%
UNEMPLOYMENT RATE
Plumerville Zip Codes
Plumerville Area Codes
Income in Plumerville
Income Overview in Plumerville
Per Capita Income in Plumerville is $22,714, while median incomes of families and households are $61,250 and $34,375 respectively.
| Characteristic | Number | Measure |
| Per Capita Income | 802 | $22,714 |
| Median Family Income | 182 | $61,250 |
| Mean Family Income | 182 | $59,351 |
| Median Household Income | 380 | $34,375 |
| Mean Household Income | 380 | $47,117 |
| Income Deficit | 182 | $0 |
| Wage / Income Gap (%) | 802 | 32.08% |
| Wage / Income Gap ($) | 802 | 67.92¢ per $1 |
| Gini / Inequality Index | 802 | 0.39 |
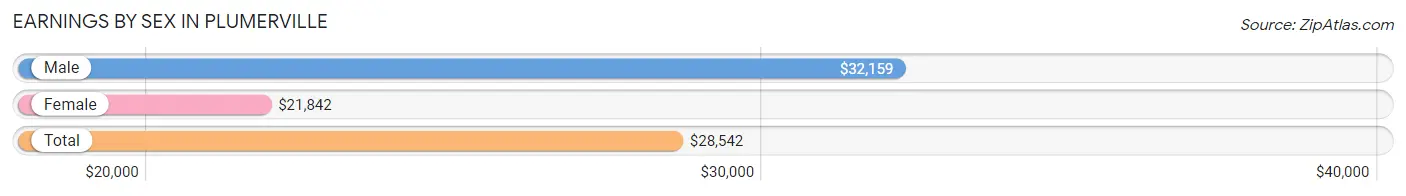
Earnings by Sex in Plumerville
Average Earnings in Plumerville are $28,542, $32,159 for men and $21,842 for women, a difference of 32.1%.
| Sex | Number | Average Earnings |
| Male | 217 (56.7%) | $32,159 |
| Female | 166 (43.3%) | $21,842 |
| Total | 383 (100.0%) | $28,542 |
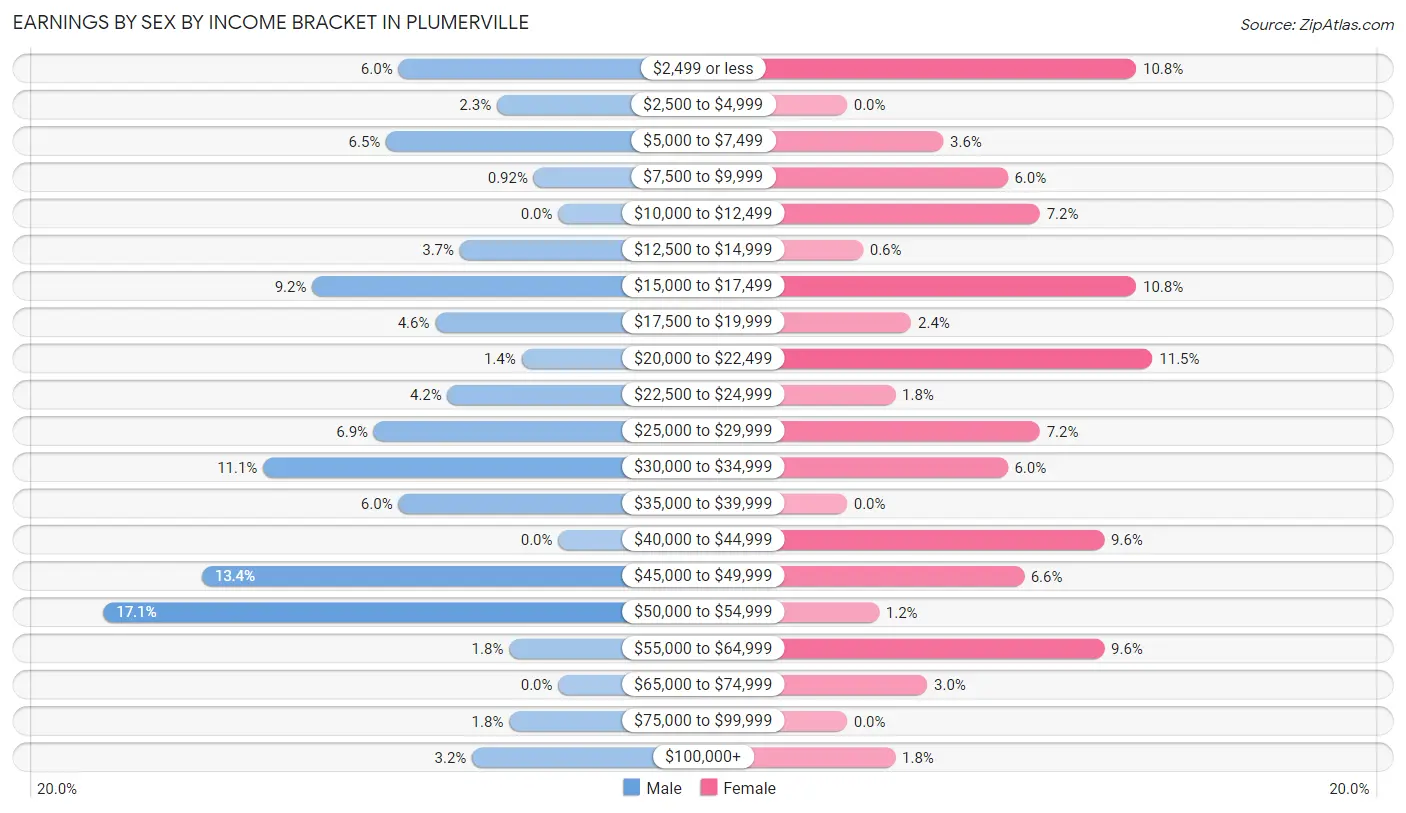
Earnings by Sex by Income Bracket in Plumerville
The most common earnings brackets in Plumerville are $50,000 to $54,999 for men (37 | 17.1%) and $20,000 to $22,499 for women (19 | 11.5%).
| Income | Male | Female |
| $2,499 or less | 13 (6.0%) | 18 (10.8%) |
| $2,500 to $4,999 | 5 (2.3%) | 0 (0.0%) |
| $5,000 to $7,499 | 14 (6.5%) | 6 (3.6%) |
| $7,500 to $9,999 | 2 (0.9%) | 10 (6.0%) |
| $10,000 to $12,499 | 0 (0.0%) | 12 (7.2%) |
| $12,500 to $14,999 | 8 (3.7%) | 1 (0.6%) |
| $15,000 to $17,499 | 20 (9.2%) | 18 (10.8%) |
| $17,500 to $19,999 | 10 (4.6%) | 4 (2.4%) |
| $20,000 to $22,499 | 3 (1.4%) | 19 (11.5%) |
| $22,500 to $24,999 | 9 (4.2%) | 3 (1.8%) |
| $25,000 to $29,999 | 15 (6.9%) | 12 (7.2%) |
| $30,000 to $34,999 | 24 (11.1%) | 10 (6.0%) |
| $35,000 to $39,999 | 13 (6.0%) | 0 (0.0%) |
| $40,000 to $44,999 | 0 (0.0%) | 16 (9.6%) |
| $45,000 to $49,999 | 29 (13.4%) | 11 (6.6%) |
| $50,000 to $54,999 | 37 (17.1%) | 2 (1.2%) |
| $55,000 to $64,999 | 4 (1.8%) | 16 (9.6%) |
| $65,000 to $74,999 | 0 (0.0%) | 5 (3.0%) |
| $75,000 to $99,999 | 4 (1.8%) | 0 (0.0%) |
| $100,000+ | 7 (3.2%) | 3 (1.8%) |
| Total | 217 (100.0%) | 166 (100.0%) |
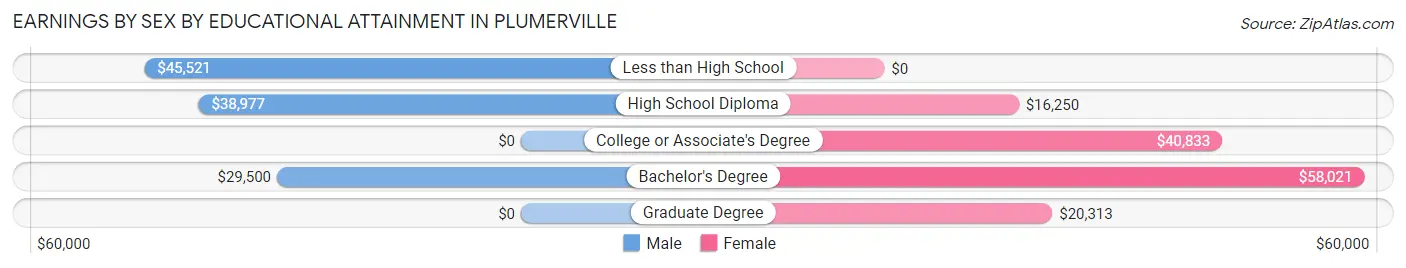
Earnings by Sex by Educational Attainment in Plumerville
Average earnings in Plumerville are $34,038 for men and $27,917 for women, a difference of 18.0%. Men with an educational attainment of less than high school enjoy the highest average annual earnings of $45,521, while those with bachelor's degree education earn the least with $29,500. Women with an educational attainment of bachelor's degree earn the most with the average annual earnings of $58,021, while those with high school diploma education have the smallest earnings of $16,250.
| Educational Attainment | Male Income | Female Income |
| Less than High School | $45,521 | $0 |
| High School Diploma | $38,977 | $16,250 |
| College or Associate's Degree | - | - |
| Bachelor's Degree | $29,500 | $58,021 |
| Graduate Degree | - | - |
| Total | $34,038 | $27,917 |
Family Income in Plumerville
Family Income Brackets in Plumerville
According to the Plumerville family income data, there are 45 families falling into the $75,000 to $99,999 income range, which is the most common income bracket and makes up 24.7% of all families.
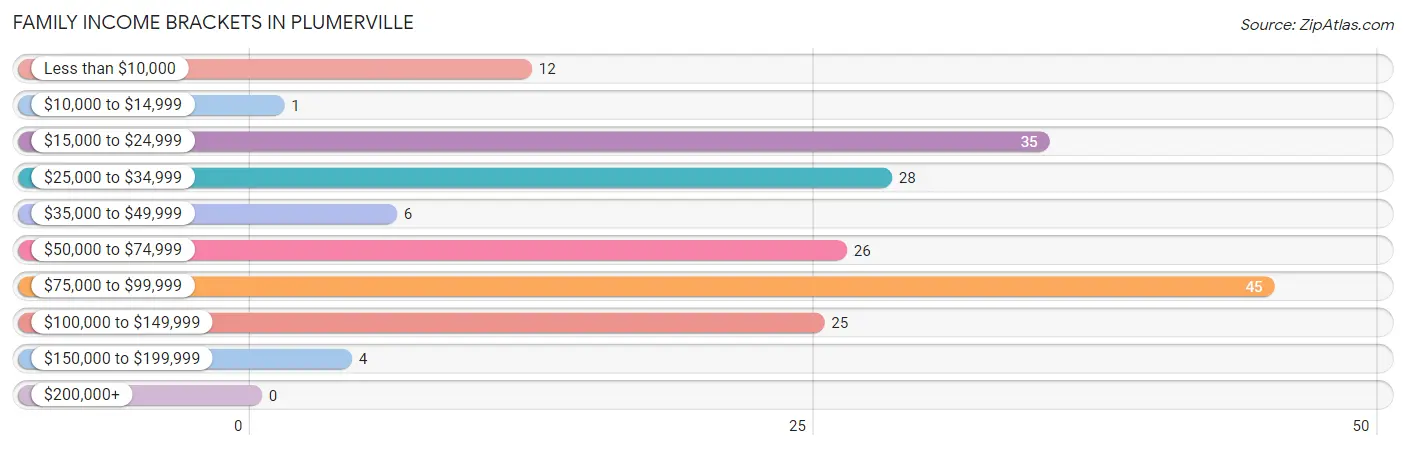
| Income Bracket | # Families | % Families |
| Less than $10,000 | 12 | 6.6% |
| $10,000 to $14,999 | 1 | 0.5% |
| $15,000 to $24,999 | 35 | 19.2% |
| $25,000 to $34,999 | 28 | 15.4% |
| $35,000 to $49,999 | 6 | 3.3% |
| $50,000 to $74,999 | 26 | 14.3% |
| $75,000 to $99,999 | 45 | 24.7% |
| $100,000 to $149,999 | 25 | 13.7% |
| $150,000 to $199,999 | 4 | 2.2% |
| $200,000+ | 0 | 0.0% |
Family Income by Famaliy Size in Plumerville
3-person families (29 | 15.9%) account for the highest median family income in Plumerville with $90,391 per family, while 2-person families (81 | 44.5%) have the highest median income of $31,340 per family member.
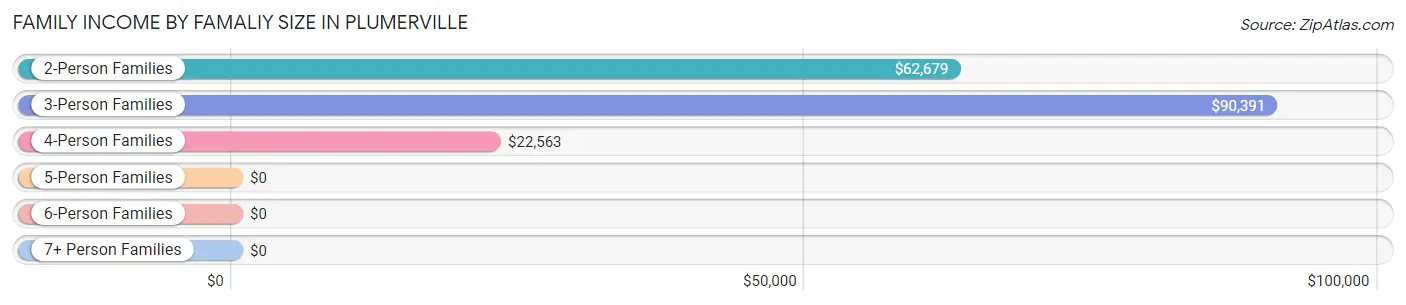
| Income Bracket | # Families | Median Income |
| 2-Person Families | 81 (44.5%) | $62,679 |
| 3-Person Families | 29 (15.9%) | $90,391 |
| 4-Person Families | 55 (30.2%) | $22,563 |
| 5-Person Families | 3 (1.7%) | $0 |
| 6-Person Families | 14 (7.7%) | $0 |
| 7+ Person Families | 0 (0.0%) | $0 |
| Total | 182 (100.0%) | $61,250 |
Family Income by Number of Earners in Plumerville
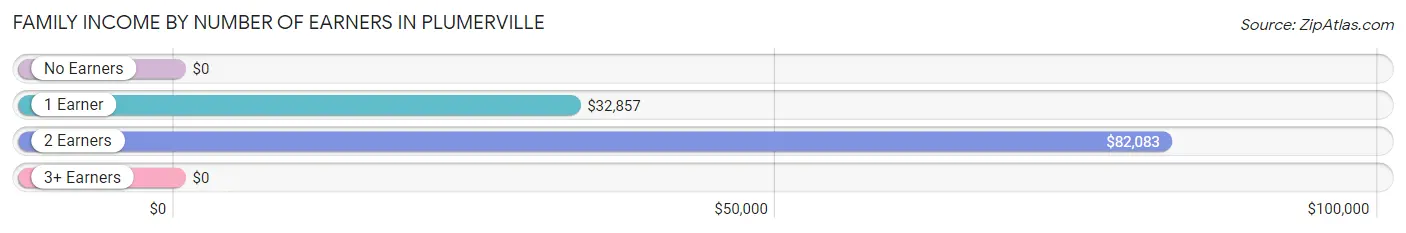
| Number of Earners | # Families | Median Income |
| No Earners | 30 (16.5%) | $0 |
| 1 Earner | 58 (31.9%) | $32,857 |
| 2 Earners | 87 (47.8%) | $82,083 |
| 3+ Earners | 7 (3.8%) | $0 |
| Total | 182 (100.0%) | $61,250 |
Household Income in Plumerville
Household Income Brackets in Plumerville
With 93 households falling in the category, the $25,000 to $34,999 income range is the most frequent in Plumerville, accounting for 24.5% of all households.
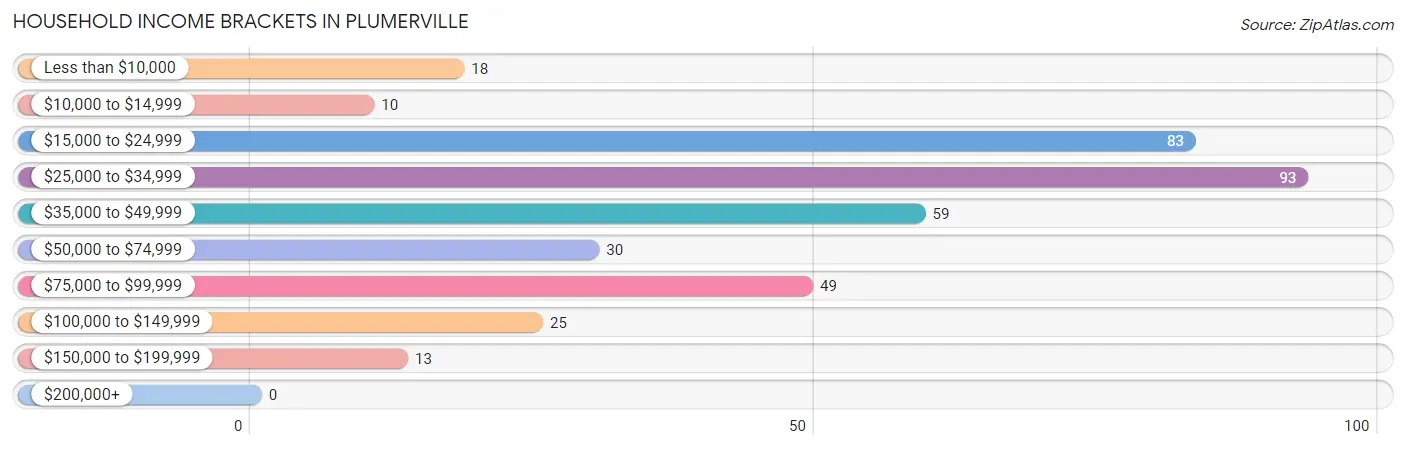
| Income Bracket | # Households | % Households |
| Less than $10,000 | 18 | 4.7% |
| $10,000 to $14,999 | 10 | 2.6% |
| $15,000 to $24,999 | 83 | 21.8% |
| $25,000 to $34,999 | 93 | 24.5% |
| $35,000 to $49,999 | 59 | 15.5% |
| $50,000 to $74,999 | 30 | 7.9% |
| $75,000 to $99,999 | 49 | 12.9% |
| $100,000 to $149,999 | 25 | 6.6% |
| $150,000 to $199,999 | 13 | 3.4% |
| $200,000+ | 0 | 0.0% |
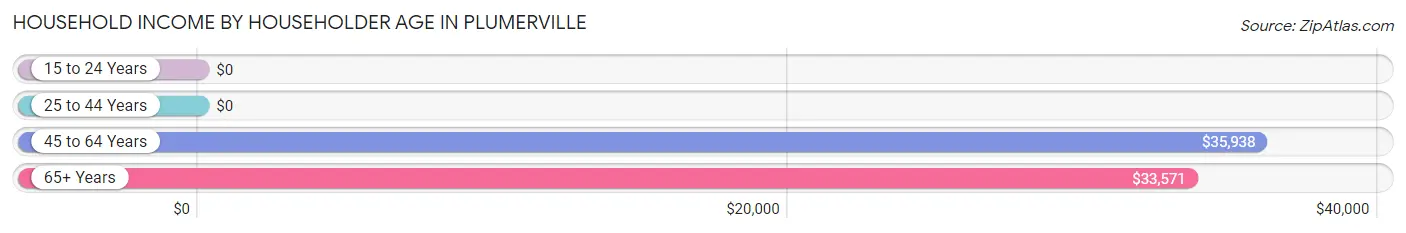
Household Income by Householder Age in Plumerville
The median household income in Plumerville is $34,375, with the highest median household income of $35,938 found in the 45 to 64 years age bracket for the primary householder. A total of 123 households (32.4%) fall into this category. Meanwhile, the 15 to 24 years age bracket for the primary householder has the lowest median household income of $0, with 9 households (2.4%) in this group.
| Income Bracket | # Households | Median Income |
| 15 to 24 Years | 9 (2.4%) | $0 |
| 25 to 44 Years | 110 (28.9%) | $0 |
| 45 to 64 Years | 123 (32.4%) | $35,938 |
| 65+ Years | 138 (36.3%) | $33,571 |
| Total | 380 (100.0%) | $34,375 |
Poverty in Plumerville
Income Below Poverty by Sex and Age in Plumerville
With 27.2% poverty level for males and 22.2% for females among the residents of Plumerville, 16 and 17 year old males and 18 to 24 year old females are the most vulnerable to poverty, with 4 males (100.0%) and 10 females (50.0%) in their respective age groups living below the poverty level.
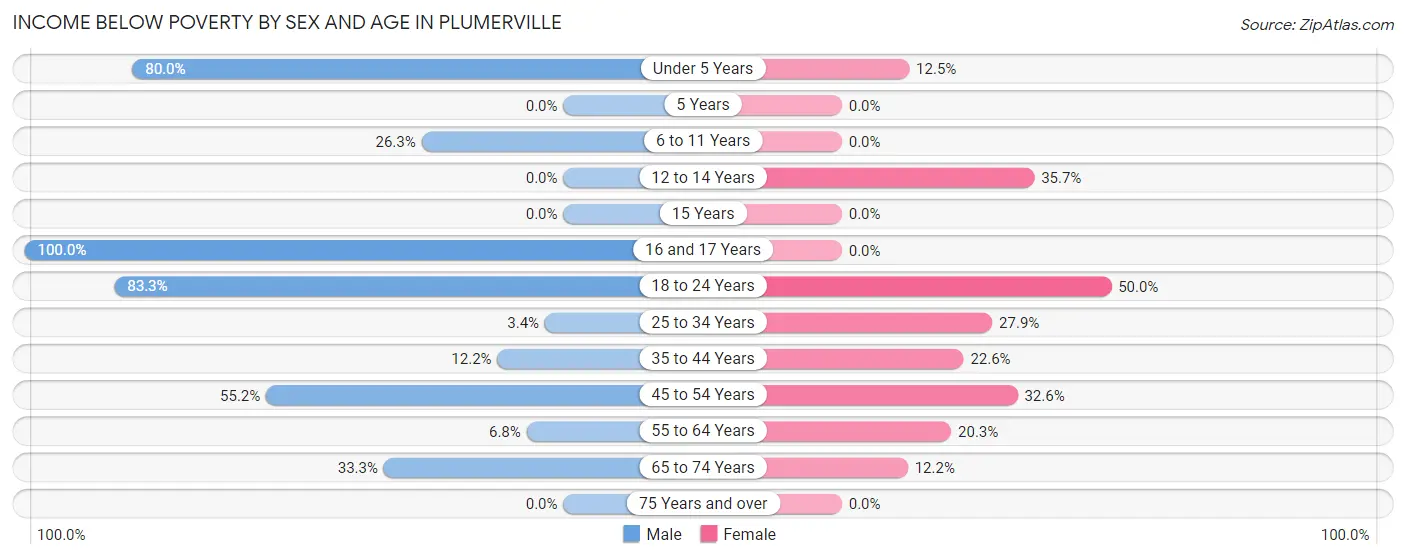
| Age Bracket | Male | Female |
| Under 5 Years | 16 (80.0%) | 2 (12.5%) |
| 5 Years | 0 (0.0%) | 0 (0.0%) |
| 6 to 11 Years | 10 (26.3%) | 0 (0.0%) |
| 12 to 14 Years | 0 (0.0%) | 10 (35.7%) |
| 15 Years | 0 (0.0%) | 0 (0.0%) |
| 16 and 17 Years | 4 (100.0%) | 0 (0.0%) |
| 18 to 24 Years | 30 (83.3%) | 10 (50.0%) |
| 25 to 34 Years | 4 (3.4%) | 12 (27.9%) |
| 35 to 44 Years | 6 (12.2%) | 7 (22.6%) |
| 45 to 54 Years | 32 (55.2%) | 15 (32.6%) |
| 55 to 64 Years | 3 (6.8%) | 14 (20.3%) |
| 65 to 74 Years | 20 (33.3%) | 6 (12.2%) |
| 75 Years and over | 0 (0.0%) | 0 (0.0%) |
| Total | 125 (27.2%) | 76 (22.2%) |
Income Above Poverty by Sex and Age in Plumerville
According to the poverty statistics in Plumerville, males aged 12 to 14 years and females aged 6 to 11 years are the age groups that are most secure financially, with 100.0% of males and 100.0% of females in these age groups living above the poverty line.
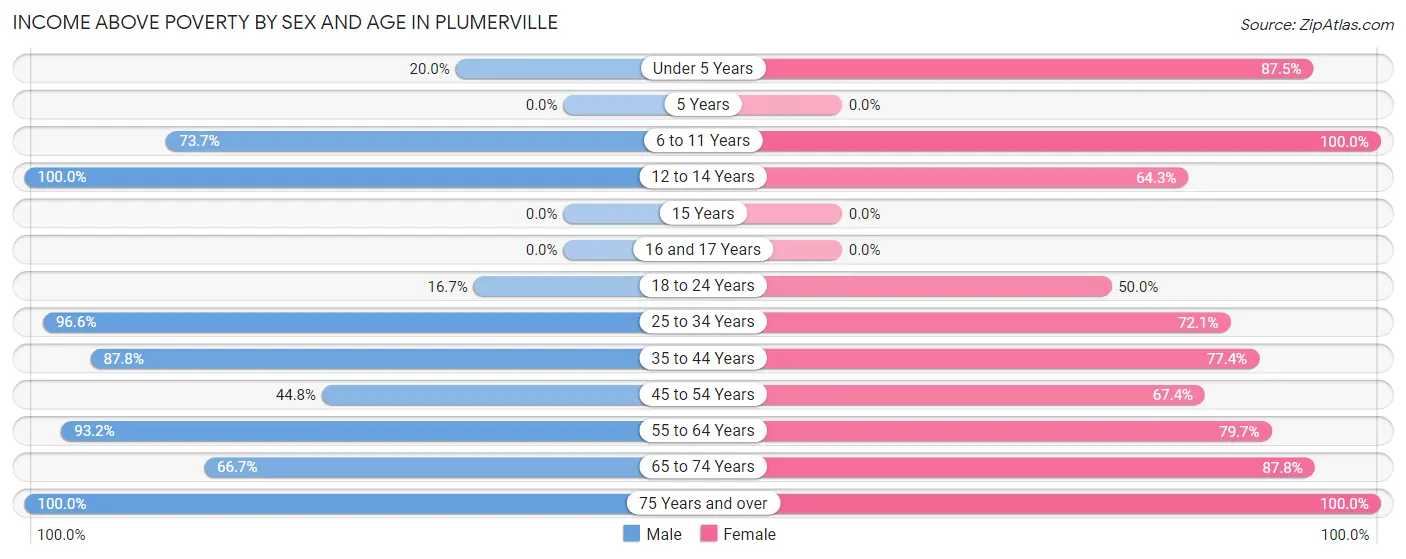
| Age Bracket | Male | Female |
| Under 5 Years | 4 (20.0%) | 14 (87.5%) |
| 5 Years | 0 (0.0%) | 0 (0.0%) |
| 6 to 11 Years | 28 (73.7%) | 1 (100.0%) |
| 12 to 14 Years | 12 (100.0%) | 18 (64.3%) |
| 15 Years | 0 (0.0%) | 0 (0.0%) |
| 16 and 17 Years | 0 (0.0%) | 0 (0.0%) |
| 18 to 24 Years | 6 (16.7%) | 10 (50.0%) |
| 25 to 34 Years | 113 (96.6%) | 31 (72.1%) |
| 35 to 44 Years | 43 (87.8%) | 24 (77.4%) |
| 45 to 54 Years | 26 (44.8%) | 31 (67.4%) |
| 55 to 64 Years | 41 (93.2%) | 55 (79.7%) |
| 65 to 74 Years | 40 (66.7%) | 43 (87.8%) |
| 75 Years and over | 22 (100.0%) | 39 (100.0%) |
| Total | 335 (72.8%) | 266 (77.8%) |
Income Below Poverty Among Married-Couple Families in Plumerville
The poverty statistics for married-couple families in Plumerville show that 22.6% or 21 of the total 93 families live below the poverty line. Families with no children have the highest poverty rate of 25.6%, comprising of 21 families. On the other hand, families with 1 or 2 children have the lowest poverty rate of 0.0%, which includes 0 families.
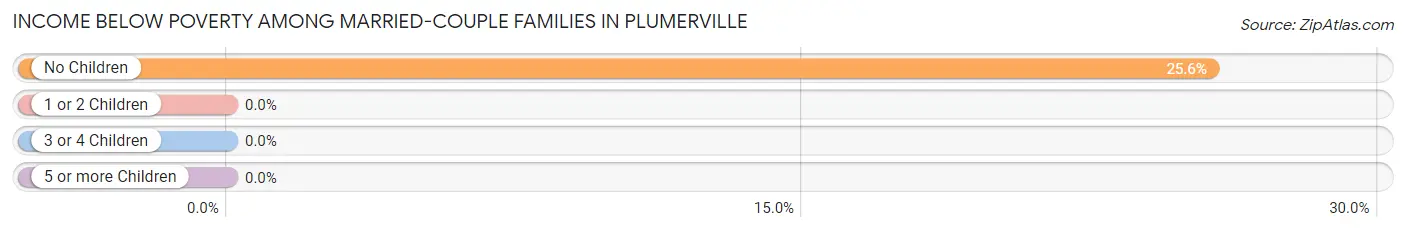
| Children | Above Poverty | Below Poverty |
| No Children | 61 (74.4%) | 21 (25.6%) |
| 1 or 2 Children | 9 (100.0%) | 0 (0.0%) |
| 3 or 4 Children | 2 (100.0%) | 0 (0.0%) |
| 5 or more Children | 0 (0.0%) | 0 (0.0%) |
| Total | 72 (77.4%) | 21 (22.6%) |
Income Below Poverty Among Single-Parent Households in Plumerville
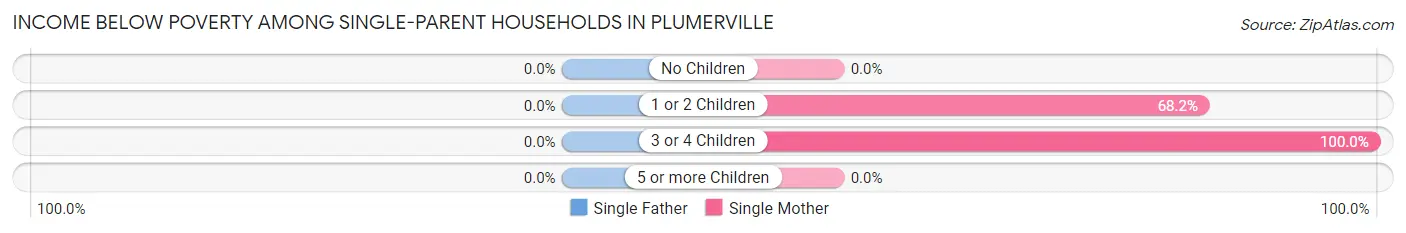
| Children | Single Father | Single Mother |
| No Children | 0 (0.0%) | 0 (0.0%) |
| 1 or 2 Children | 0 (0.0%) | 15 (68.2%) |
| 3 or 4 Children | 0 (0.0%) | 12 (100.0%) |
| 5 or more Children | 0 (0.0%) | 0 (0.0%) |
| Total | 0 (0.0%) | 27 (50.9%) |
Income Below Poverty Among Married-Couple vs Single-Parent Households in Plumerville
The poverty data for Plumerville shows that 21 of the married-couple family households (22.6%) and 27 of the single-parent households (30.3%) are living below the poverty level. Within the married-couple family households, those with no children have the highest poverty rate, with 21 households (25.6%) falling below the poverty line. Among the single-parent households, those with 3 or 4 children have the highest poverty rate, with 12 household (100.0%) living below poverty.
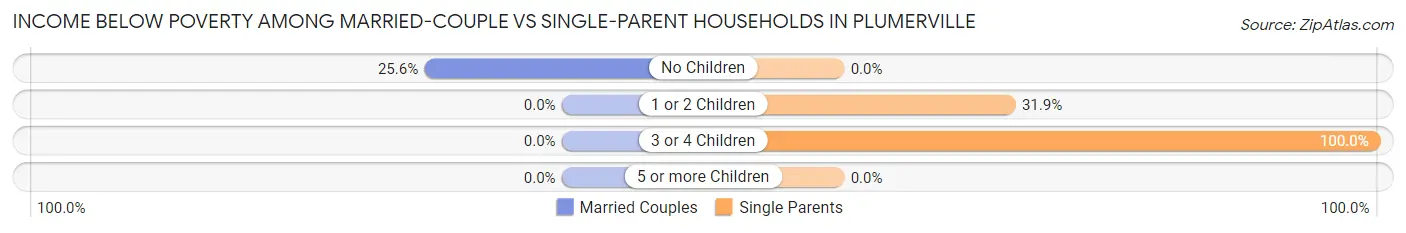
| Children | Married-Couple Families | Single-Parent Households |
| No Children | 21 (25.6%) | 0 (0.0%) |
| 1 or 2 Children | 0 (0.0%) | 15 (31.9%) |
| 3 or 4 Children | 0 (0.0%) | 12 (100.0%) |
| 5 or more Children | 0 (0.0%) | 0 (0.0%) |
| Total | 21 (22.6%) | 27 (30.3%) |
Race in Plumerville
The most populous races in Plumerville are White / Caucasian (560 | 69.8%), Hispanic or Latino (193 | 24.1%), and Some other Race (134 | 16.7%).
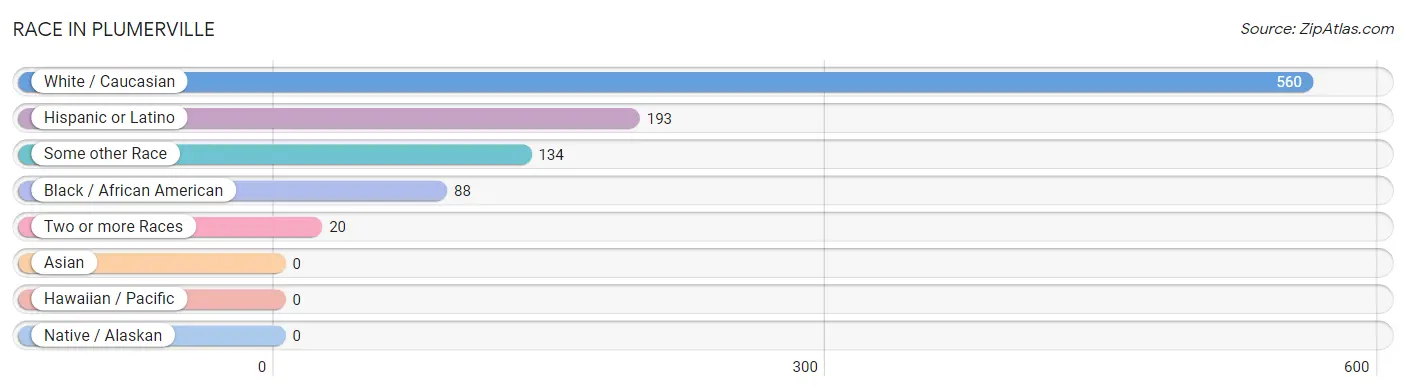
| Race | # Population | % Population |
| Asian | 0 | 0.0% |
| Black / African American | 88 | 11.0% |
| Hawaiian / Pacific | 0 | 0.0% |
| Hispanic or Latino | 193 | 24.1% |
| Native / Alaskan | 0 | 0.0% |
| White / Caucasian | 560 | 69.8% |
| Two or more Races | 20 | 2.5% |
| Some other Race | 134 | 16.7% |
| Total | 802 | 100.0% |
Ancestry in Plumerville
The most populous ancestries reported in Plumerville are Mexican (165 | 20.6%), American (154 | 19.2%), German (94 | 11.7%), English (59 | 7.4%), and French (57 | 7.1%), together accounting for 66.0% of all Plumerville residents.
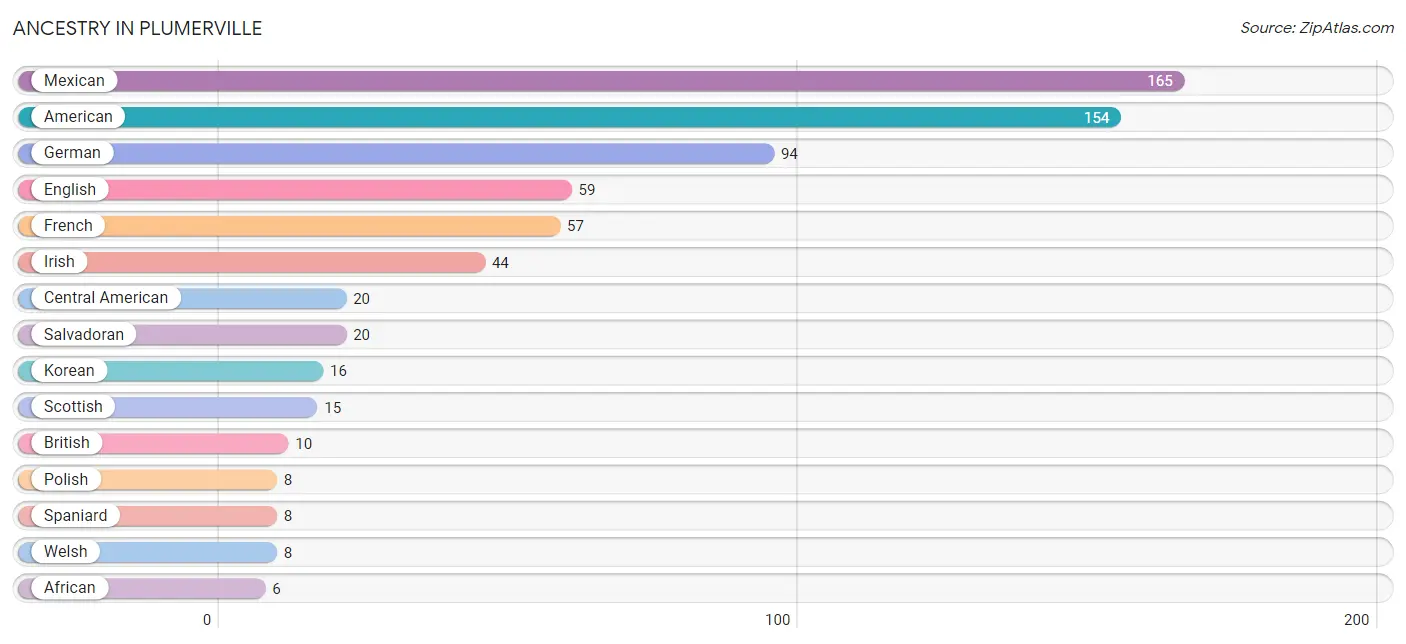
| Ancestry | # Population | % Population |
| African | 6 | 0.7% |
| American | 154 | 19.2% |
| Blackfeet | 2 | 0.3% |
| British | 10 | 1.3% |
| Central American | 20 | 2.5% |
| English | 59 | 7.4% |
| French | 57 | 7.1% |
| German | 94 | 11.7% |
| Irish | 44 | 5.5% |
| Italian | 1 | 0.1% |
| Korean | 16 | 2.0% |
| Mexican | 165 | 20.6% |
| Navajo | 2 | 0.3% |
| Polish | 8 | 1.0% |
| Salvadoran | 20 | 2.5% |
| Scottish | 15 | 1.9% |
| Spaniard | 8 | 1.0% |
| Subsaharan African | 6 | 0.7% |
| Swedish | 2 | 0.3% |
| Welsh | 8 | 1.0% | View All 20 Rows |
Immigrants in Plumerville
The most numerous immigrant groups reported in Plumerville came from Central America (139 | 17.3%), Latin America (139 | 17.3%), Mexico (119 | 14.8%), El Salvador (20 | 2.5%), and Asia (8 | 1.0%), together accounting for 53.0% of all Plumerville residents.
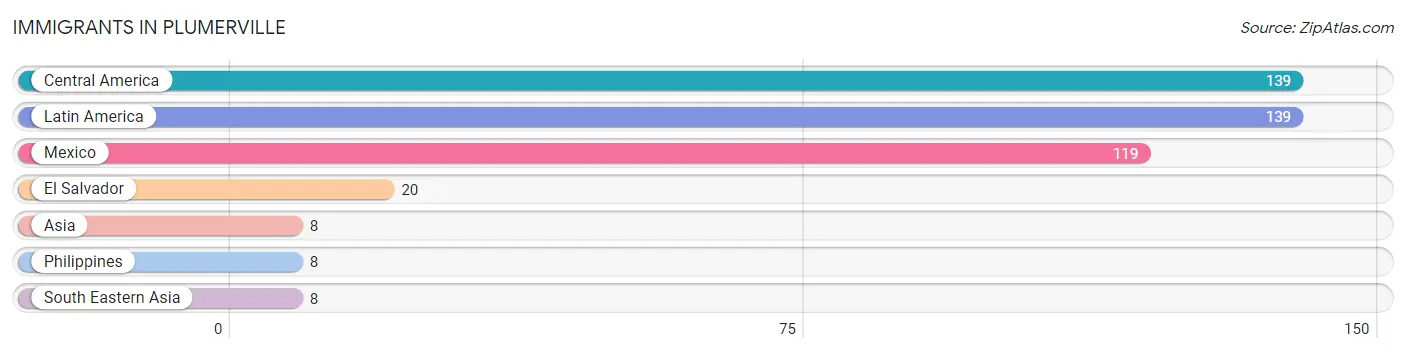
| Immigration Origin | # Population | % Population |
| Asia | 8 | 1.0% |
| Central America | 139 | 17.3% |
| El Salvador | 20 | 2.5% |
| Latin America | 139 | 17.3% |
| Mexico | 119 | 14.8% |
| Philippines | 8 | 1.0% |
| South Eastern Asia | 8 | 1.0% | View All 7 Rows |
Sex and Age in Plumerville
Sex and Age in Plumerville
The most populous age groups in Plumerville are 30 to 34 Years (97 | 21.1%) for men and 55 to 59 Years (40 | 11.7%) for women.
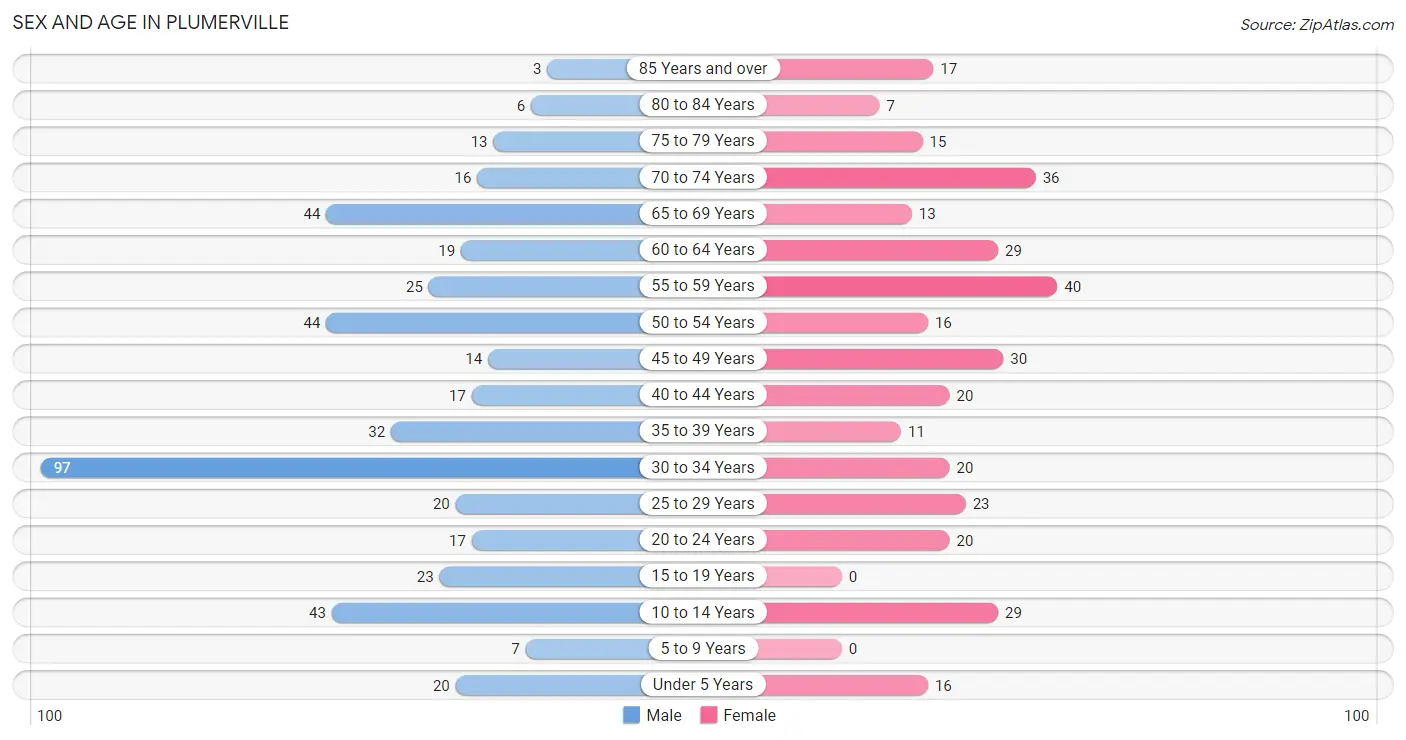
| Age Bracket | Male | Female |
| Under 5 Years | 20 (4.3%) | 16 (4.7%) |
| 5 to 9 Years | 7 (1.5%) | 0 (0.0%) |
| 10 to 14 Years | 43 (9.3%) | 29 (8.5%) |
| 15 to 19 Years | 23 (5.0%) | 0 (0.0%) |
| 20 to 24 Years | 17 (3.7%) | 20 (5.9%) |
| 25 to 29 Years | 20 (4.3%) | 23 (6.7%) |
| 30 to 34 Years | 97 (21.1%) | 20 (5.9%) |
| 35 to 39 Years | 32 (7.0%) | 11 (3.2%) |
| 40 to 44 Years | 17 (3.7%) | 20 (5.9%) |
| 45 to 49 Years | 14 (3.0%) | 30 (8.8%) |
| 50 to 54 Years | 44 (9.6%) | 16 (4.7%) |
| 55 to 59 Years | 25 (5.4%) | 40 (11.7%) |
| 60 to 64 Years | 19 (4.1%) | 29 (8.5%) |
| 65 to 69 Years | 44 (9.6%) | 13 (3.8%) |
| 70 to 74 Years | 16 (3.5%) | 36 (10.5%) |
| 75 to 79 Years | 13 (2.8%) | 15 (4.4%) |
| 80 to 84 Years | 6 (1.3%) | 7 (2.1%) |
| 85 Years and over | 3 (0.6%) | 17 (5.0%) |
| Total | 460 (100.0%) | 342 (100.0%) |
Families and Households in Plumerville
Median Family Size in Plumerville
The median family size in Plumerville is 3.05 persons per family, with single male/father families (36 | 19.8%) accounting for the largest median family size of 4.14 persons per family. On the other hand, single female/mother families (53 | 29.1%) represent the smallest median family size with 2.57 persons per family.
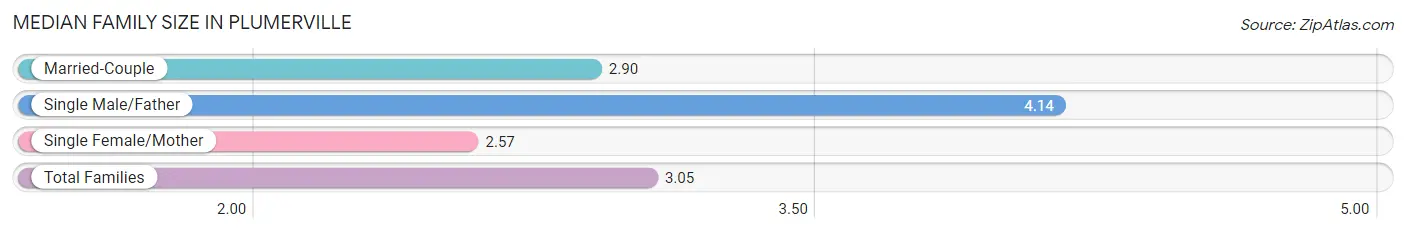
| Family Type | # Families | Family Size |
| Married-Couple | 93 (51.1%) | 2.90 |
| Single Male/Father | 36 (19.8%) | 4.14 |
| Single Female/Mother | 53 (29.1%) | 2.57 |
| Total Families | 182 (100.0%) | 3.05 |
Median Household Size in Plumerville
The median household size in Plumerville is 2.11 persons per household, with single male/father households (36 | 9.5%) accounting for the largest median household size of 4.39 persons per household. non-family households (198 | 52.1%) represent the smallest median household size with 1.12 persons per household.
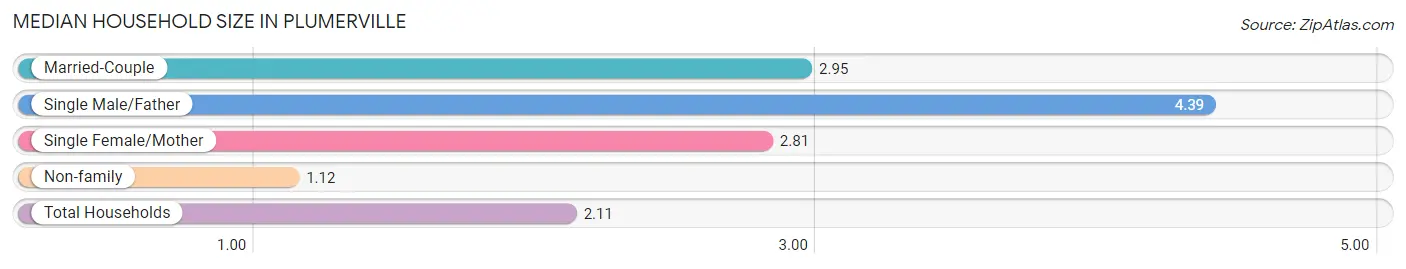
| Household Type | # Households | Household Size |
| Married-Couple | 93 (24.5%) | 2.95 |
| Single Male/Father | 36 (9.5%) | 4.39 |
| Single Female/Mother | 53 (14.0%) | 2.81 |
| Non-family | 198 (52.1%) | 1.12 |
| Total Households | 380 (100.0%) | 2.11 |
Household Size by Marriage Status in Plumerville
Out of a total of 380 households in Plumerville, 182 (47.9%) are family households, while 198 (52.1%) are nonfamily households. The most numerous type of family households are 2-person households, comprising 73, and the most common type of nonfamily households are 1-person households, comprising 175.
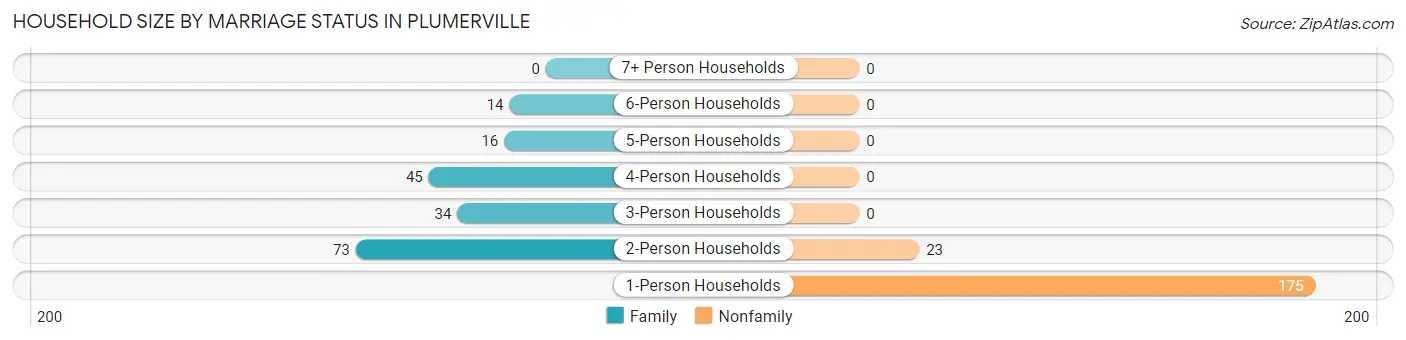
| Household Size | Family Households | Nonfamily Households |
| 1-Person Households | - | 175 (46.1%) |
| 2-Person Households | 73 (19.2%) | 23 (6.0%) |
| 3-Person Households | 34 (8.9%) | 0 (0.0%) |
| 4-Person Households | 45 (11.8%) | 0 (0.0%) |
| 5-Person Households | 16 (4.2%) | 0 (0.0%) |
| 6-Person Households | 14 (3.7%) | 0 (0.0%) |
| 7+ Person Households | 0 (0.0%) | 0 (0.0%) |
| Total | 182 (47.9%) | 198 (52.1%) |
Female Fertility in Plumerville
Fertility by Age in Plumerville
Average fertility rate in Plumerville is 105.0 births per 1,000 women. Women in the age bracket of 20 to 34 years have the highest fertility rate with 206.0 births per 1,000 women. Women in the age bracket of 20 to 34 years acount for 100.0% of all women with births.
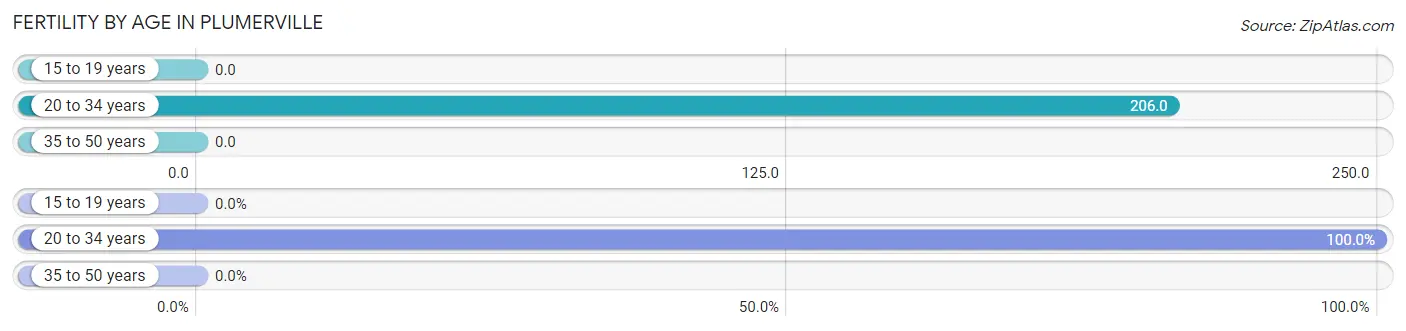
| Age Bracket | Women with Births | Births / 1,000 Women |
| 15 to 19 years | 0 (0.0%) | 0.0 |
| 20 to 34 years | 13 (100.0%) | 206.0 |
| 35 to 50 years | 0 (0.0%) | 0.0 |
| Total | 13 (100.0%) | 105.0 |
Fertility by Age by Marriage Status in Plumerville
7.7% of women with births (13) in Plumerville are married. The highest percentage of unmarried women with births falls into 20 to 34 years age bracket with 92.3% of them unmarried at the time of birth, while the lowest percentage of unmarried women with births belong to 20 to 34 years age bracket with 92.3% of them unmarried.
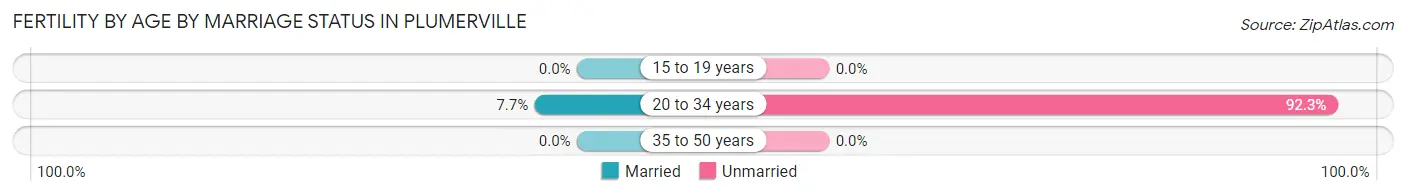
| Age Bracket | Married | Unmarried |
| 15 to 19 years | 0 (0.0%) | 0 (0.0%) |
| 20 to 34 years | 1 (7.7%) | 12 (92.3%) |
| 35 to 50 years | 0 (0.0%) | 0 (0.0%) |
| Total | 1 (7.7%) | 12 (92.3%) |
Fertility by Education in Plumerville
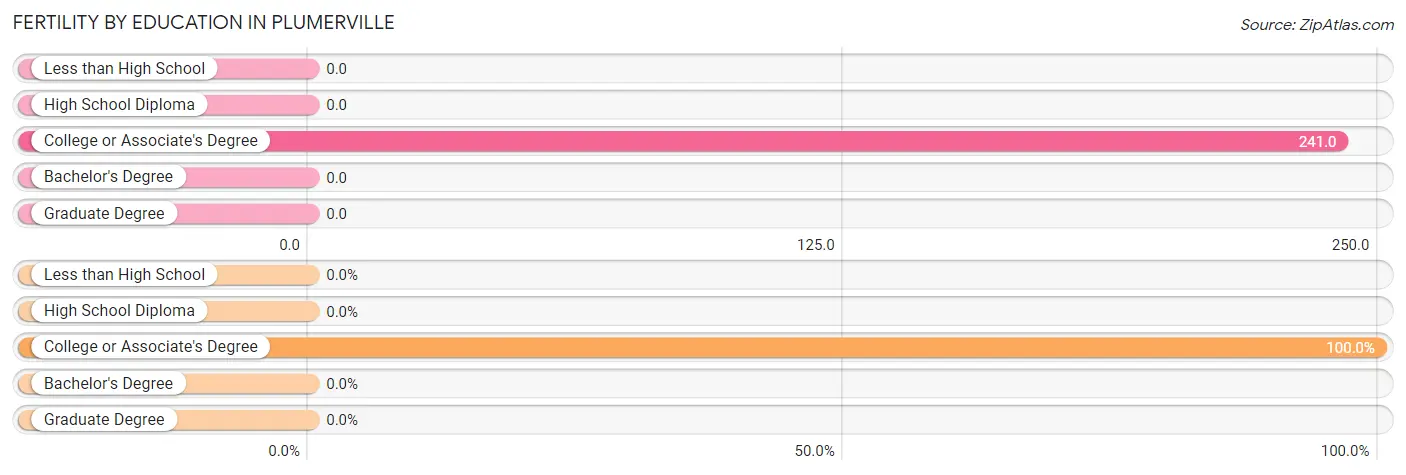
| Educational Attainment | Women with Births | Births / 1,000 Women |
| Less than High School | 0 (0.0%) | 0.0 |
| High School Diploma | 0 (0.0%) | 0.0 |
| College or Associate's Degree | 13 (100.0%) | 241.0 |
| Bachelor's Degree | 0 (0.0%) | 0.0 |
| Graduate Degree | 0 (0.0%) | 0.0 |
| Total | 13 (100.0%) | 105.0 |
Fertility by Education by Marriage Status in Plumerville
92.3% of women with births in Plumerville are unmarried. Women with the educational attainment of college or associate's degree are most likely to be married with 7.7% of them married at childbirth, while women with the educational attainment of college or associate's degree are least likely to be married with 92.3% of them unmarried at childbirth.
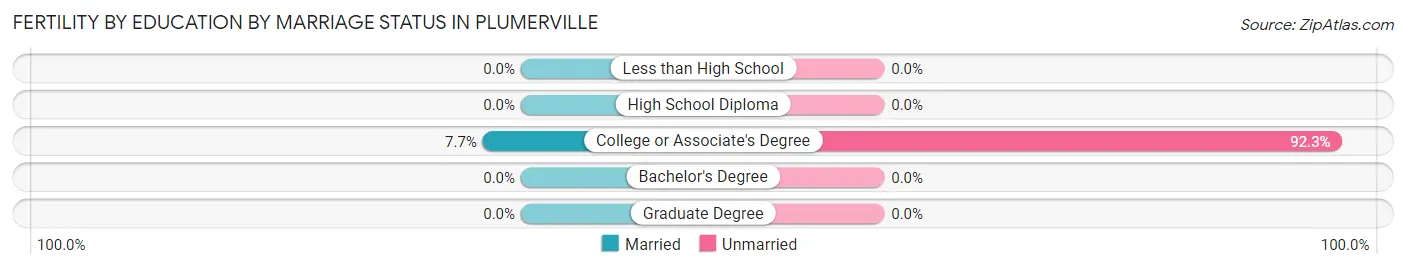
| Educational Attainment | Married | Unmarried |
| Less than High School | 0 (0.0%) | 0 (0.0%) |
| High School Diploma | 0 (0.0%) | 0 (0.0%) |
| College or Associate's Degree | 1 (7.7%) | 12 (92.3%) |
| Bachelor's Degree | 0 (0.0%) | 0 (0.0%) |
| Graduate Degree | 0 (0.0%) | 0 (0.0%) |
| Total | 1 (7.7%) | 12 (92.3%) |
Employment Characteristics in Plumerville
Employment by Class of Employer in Plumerville
Among the 344 employed individuals in Plumerville, private company employees (229 | 66.6%), not-for-profit organizations (40 | 11.6%), and state government employees (32 | 9.3%) make up the most common classes of employment.
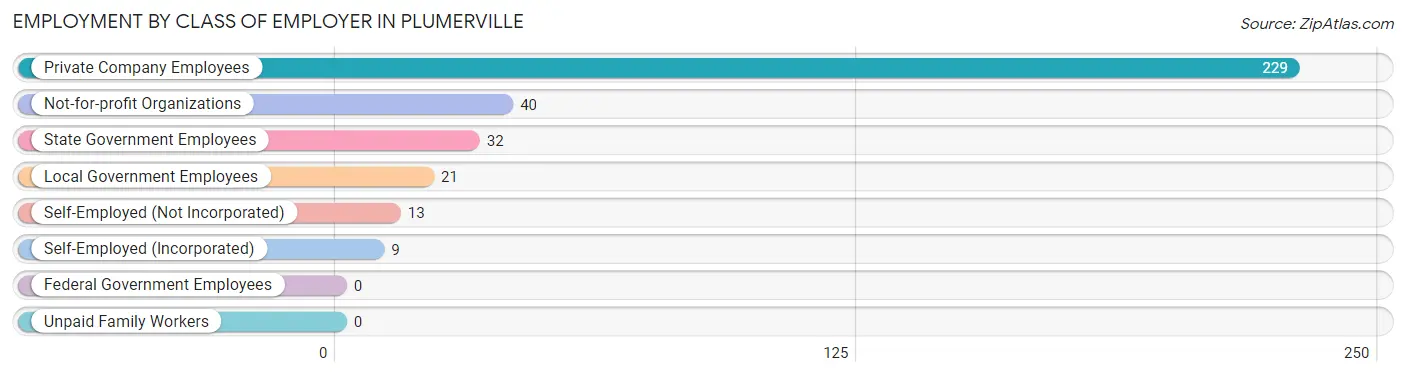
| Employer Class | # Employees | % Employees |
| Private Company Employees | 229 | 66.6% |
| Self-Employed (Incorporated) | 9 | 2.6% |
| Self-Employed (Not Incorporated) | 13 | 3.8% |
| Not-for-profit Organizations | 40 | 11.6% |
| Local Government Employees | 21 | 6.1% |
| State Government Employees | 32 | 9.3% |
| Federal Government Employees | 0 | 0.0% |
| Unpaid Family Workers | 0 | 0.0% |
| Total | 344 | 100.0% |
Employment Status by Age in Plumerville
According to the labor force statistics for Plumerville, out of the total population over 16 years of age (687), 54.4% or 374 individuals are in the labor force, with 4.0% or 15 of them unemployed. The age group with the highest labor force participation rate is 20 to 24 years, with 100.0% or 37 individuals in the labor force. Within the labor force, the 45 to 54 years age range has the highest percentage of unemployed individuals, with 24.2% or 15 of them being unemployed.
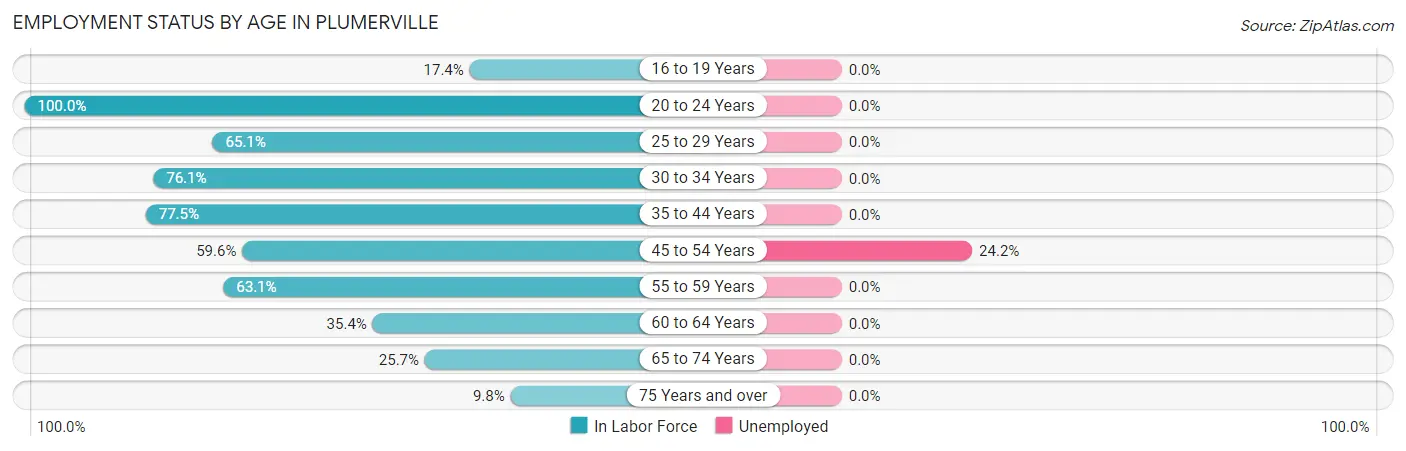
| Age Bracket | In Labor Force | Unemployed |
| 16 to 19 Years | 4 (17.4%) | 0 (0.0%) |
| 20 to 24 Years | 37 (100.0%) | 0 (0.0%) |
| 25 to 29 Years | 28 (65.1%) | 0 (0.0%) |
| 30 to 34 Years | 89 (76.1%) | 0 (0.0%) |
| 35 to 44 Years | 62 (77.5%) | 0 (0.0%) |
| 45 to 54 Years | 62 (59.6%) | 15 (24.2%) |
| 55 to 59 Years | 41 (63.1%) | 0 (0.0%) |
| 60 to 64 Years | 17 (35.4%) | 0 (0.0%) |
| 65 to 74 Years | 28 (25.7%) | 0 (0.0%) |
| 75 Years and over | 6 (9.8%) | 0 (0.0%) |
| Total | 374 (54.4%) | 15 (4.0%) |
Employment Status by Educational Attainment in Plumerville
According to labor force statistics for Plumerville, 65.4% of individuals (299) out of the total population between 25 and 64 years of age (457) are in the labor force, with 5.0% or 15 of them being unemployed. The group with the highest labor force participation rate are those with the educational attainment of bachelor's degree or higher, with 100.0% or 35 individuals in the labor force. Within the labor force, individuals with high school diploma education have the highest percentage of unemployment, with 11.7% or 15 of them being unemployed.
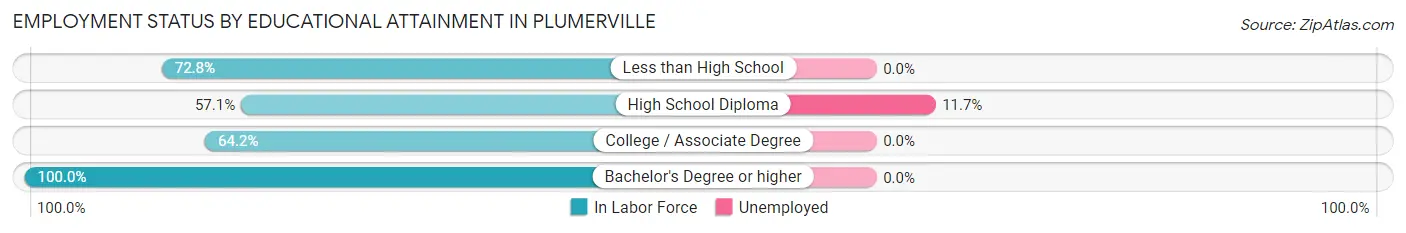
| Educational Attainment | In Labor Force | Unemployed |
| Less than High School | 75 (72.8%) | 0 (0.0%) |
| High School Diploma | 128 (57.1%) | 26 (11.7%) |
| College / Associate Degree | 61 (64.2%) | 0 (0.0%) |
| Bachelor's Degree or higher | 35 (100.0%) | 0 (0.0%) |
| Total | 299 (65.4%) | 23 (5.0%) |
Employment Occupations by Sex in Plumerville
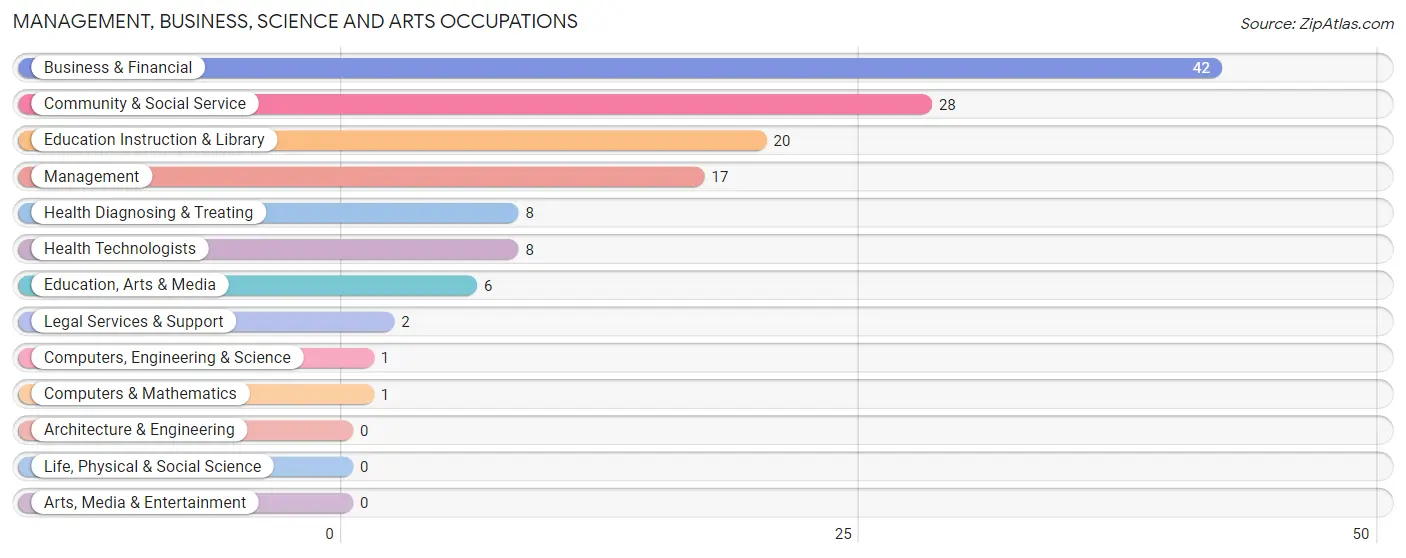
Management, Business, Science and Arts Occupations
The most common Management, Business, Science and Arts occupations in Plumerville are Business & Financial (42 | 11.7%), Community & Social Service (28 | 7.8%), Education Instruction & Library (20 | 5.6%), Management (17 | 4.7%), and Health Diagnosing & Treating (8 | 2.2%).
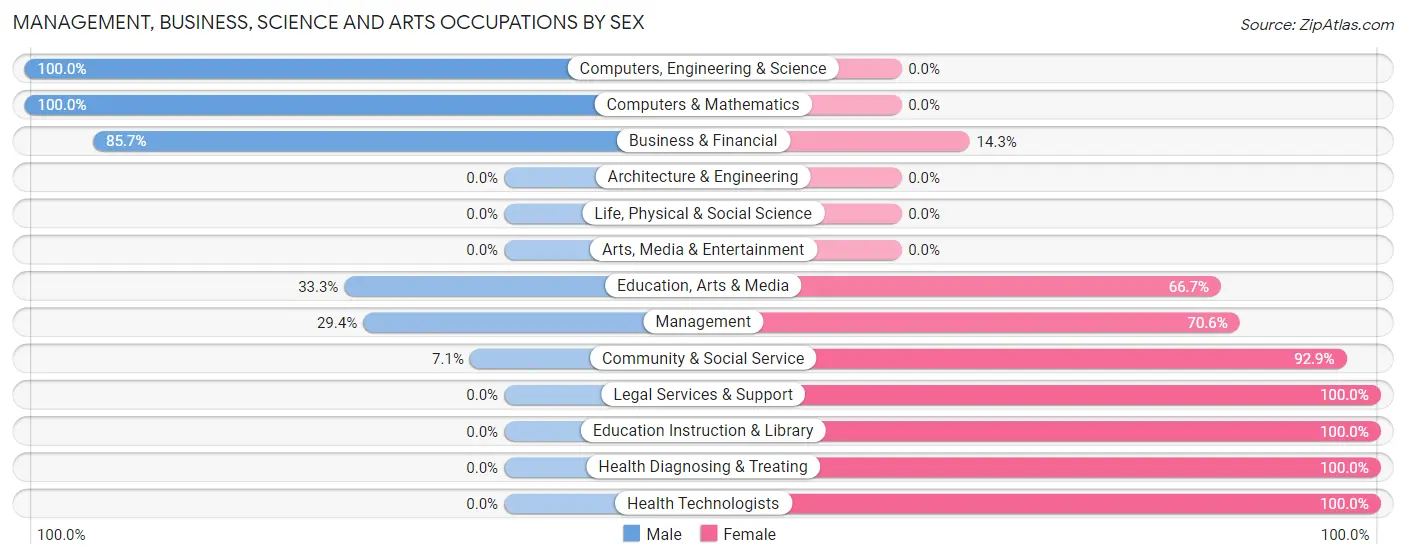
Management, Business, Science and Arts Occupations by Sex
Within the Management, Business, Science and Arts occupations in Plumerville, the most male-oriented occupations are Computers, Engineering & Science (100.0%), Computers & Mathematics (100.0%), and Business & Financial (85.7%), while the most female-oriented occupations are Legal Services & Support (100.0%), Education Instruction & Library (100.0%), and Health Diagnosing & Treating (100.0%).
| Occupation | Male | Female |
| Management | 5 (29.4%) | 12 (70.6%) |
| Business & Financial | 36 (85.7%) | 6 (14.3%) |
| Computers, Engineering & Science | 1 (100.0%) | 0 (0.0%) |
| Computers & Mathematics | 1 (100.0%) | 0 (0.0%) |
| Architecture & Engineering | 0 (0.0%) | 0 (0.0%) |
| Life, Physical & Social Science | 0 (0.0%) | 0 (0.0%) |
| Community & Social Service | 2 (7.1%) | 26 (92.9%) |
| Education, Arts & Media | 2 (33.3%) | 4 (66.7%) |
| Legal Services & Support | 0 (0.0%) | 2 (100.0%) |
| Education Instruction & Library | 0 (0.0%) | 20 (100.0%) |
| Arts, Media & Entertainment | 0 (0.0%) | 0 (0.0%) |
| Health Diagnosing & Treating | 0 (0.0%) | 8 (100.0%) |
| Health Technologists | 0 (0.0%) | 8 (100.0%) |
| Total (Category) | 44 (45.8%) | 52 (54.2%) |
| Total (Overall) | 217 (60.5%) | 142 (39.6%) |
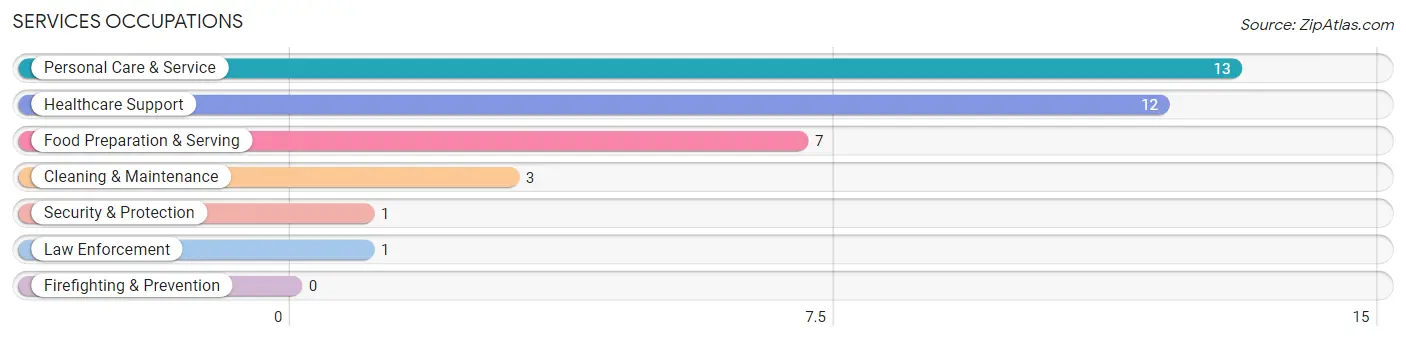
Services Occupations
The most common Services occupations in Plumerville are Personal Care & Service (13 | 3.6%), Healthcare Support (12 | 3.3%), Food Preparation & Serving (7 | 1.9%), Cleaning & Maintenance (3 | 0.8%), and Security & Protection (1 | 0.3%).
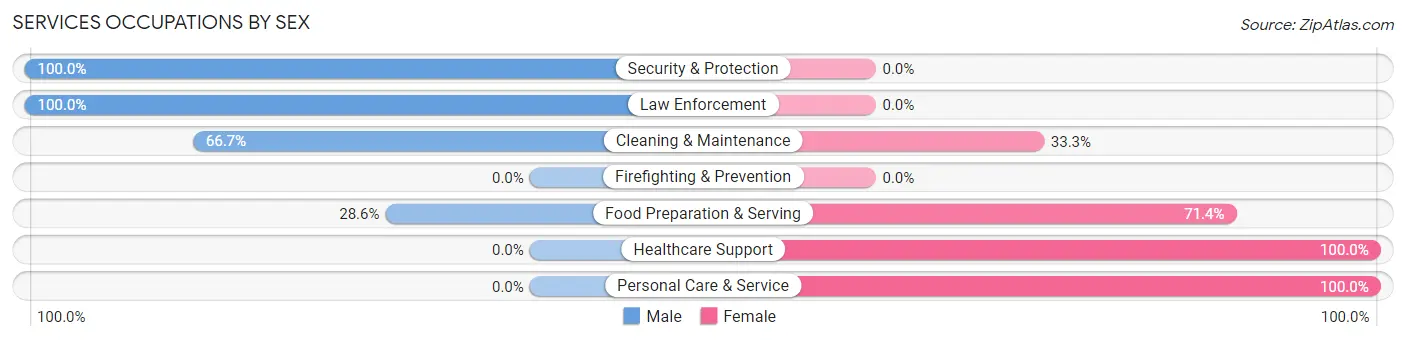
Services Occupations by Sex
Within the Services occupations in Plumerville, the most male-oriented occupations are Security & Protection (100.0%), Law Enforcement (100.0%), and Cleaning & Maintenance (66.7%), while the most female-oriented occupations are Healthcare Support (100.0%), Personal Care & Service (100.0%), and Food Preparation & Serving (71.4%).
| Occupation | Male | Female |
| Healthcare Support | 0 (0.0%) | 12 (100.0%) |
| Security & Protection | 1 (100.0%) | 0 (0.0%) |
| Firefighting & Prevention | 0 (0.0%) | 0 (0.0%) |
| Law Enforcement | 1 (100.0%) | 0 (0.0%) |
| Food Preparation & Serving | 2 (28.6%) | 5 (71.4%) |
| Cleaning & Maintenance | 2 (66.7%) | 1 (33.3%) |
| Personal Care & Service | 0 (0.0%) | 13 (100.0%) |
| Total (Category) | 5 (13.9%) | 31 (86.1%) |
| Total (Overall) | 217 (60.5%) | 142 (39.6%) |
Sales and Office Occupations
The most common Sales and Office occupations in Plumerville are Sales & Related (32 | 8.9%), and Office & Administration (18 | 5.0%).

Sales and Office Occupations by Sex

| Occupation | Male | Female |
| Sales & Related | 18 (56.2%) | 14 (43.8%) |
| Office & Administration | 9 (50.0%) | 9 (50.0%) |
| Total (Category) | 27 (54.0%) | 23 (46.0%) |
| Total (Overall) | 217 (60.5%) | 142 (39.6%) |
Natural Resources, Construction and Maintenance Occupations
The most common Natural Resources, Construction and Maintenance occupations in Plumerville are Construction & Extraction (89 | 24.8%), Installation, Maintenance & Repair (8 | 2.2%), and Farming, Fishing & Forestry (6 | 1.7%).
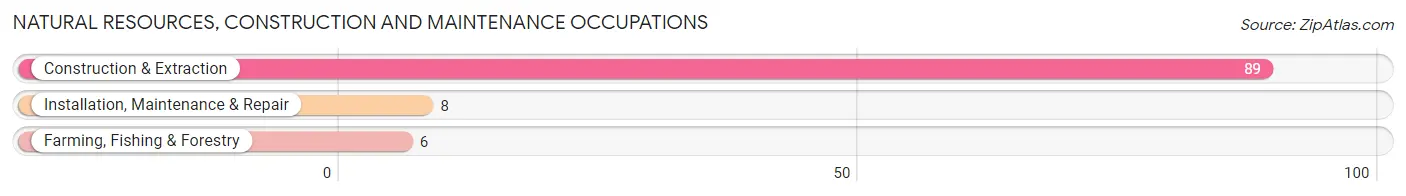
Natural Resources, Construction and Maintenance Occupations by Sex
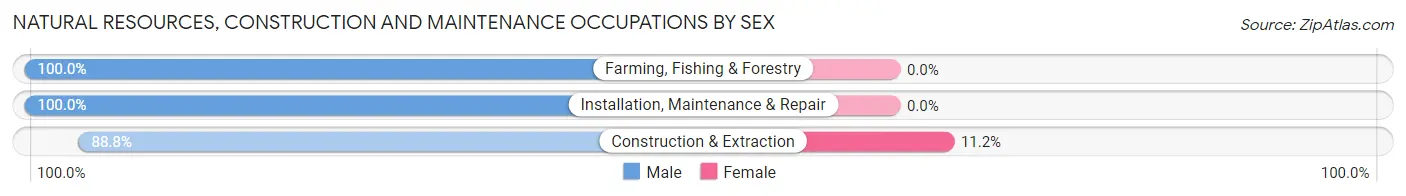
| Occupation | Male | Female |
| Farming, Fishing & Forestry | 6 (100.0%) | 0 (0.0%) |
| Construction & Extraction | 79 (88.8%) | 10 (11.2%) |
| Installation, Maintenance & Repair | 8 (100.0%) | 0 (0.0%) |
| Total (Category) | 93 (90.3%) | 10 (9.7%) |
| Total (Overall) | 217 (60.5%) | 142 (39.6%) |
Production, Transportation and Moving Occupations
The most common Production, Transportation and Moving occupations in Plumerville are Material Moving (50 | 13.9%), Production (12 | 3.3%), and Transportation (12 | 3.3%).
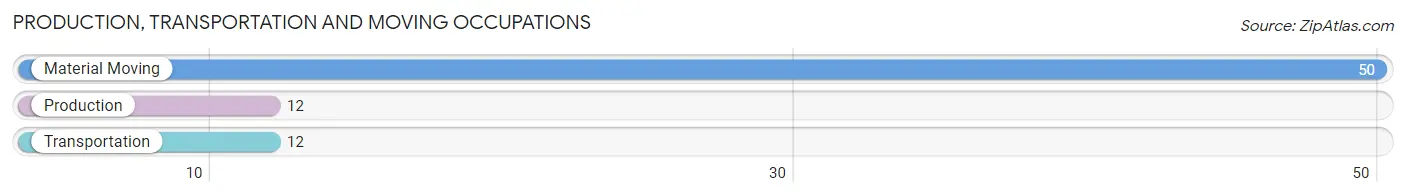
Production, Transportation and Moving Occupations by Sex
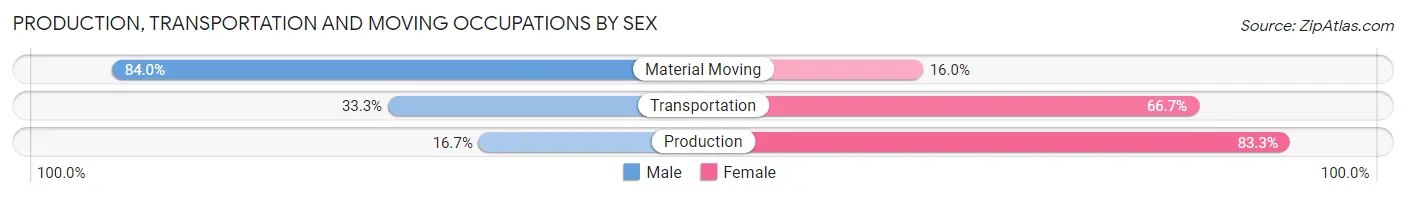
| Occupation | Male | Female |
| Production | 2 (16.7%) | 10 (83.3%) |
| Transportation | 4 (33.3%) | 8 (66.7%) |
| Material Moving | 42 (84.0%) | 8 (16.0%) |
| Total (Category) | 48 (64.9%) | 26 (35.1%) |
| Total (Overall) | 217 (60.5%) | 142 (39.6%) |
Employment Industries by Sex in Plumerville
Employment Industries in Plumerville
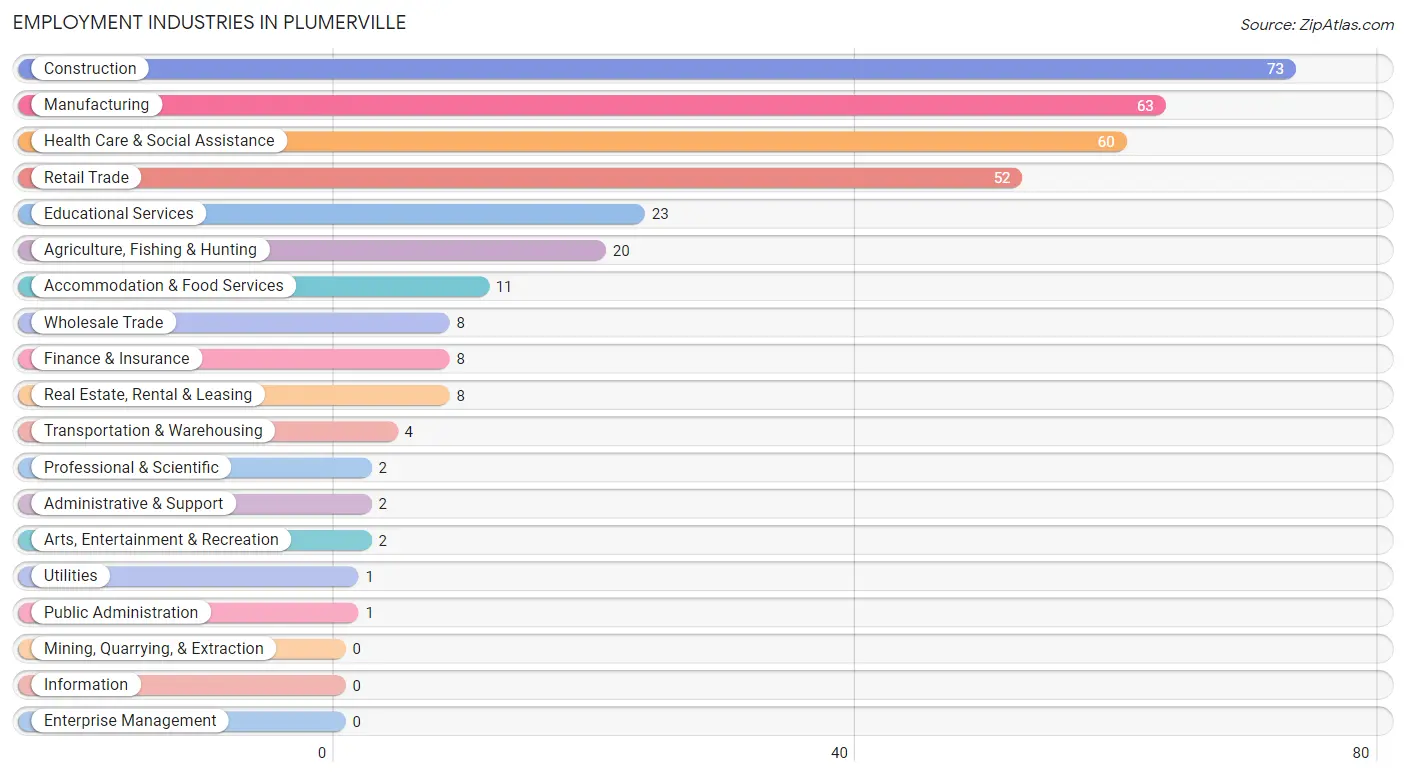
The major employment industries in Plumerville include Construction (73 | 20.3%), Manufacturing (63 | 17.5%), Health Care & Social Assistance (60 | 16.7%), Retail Trade (52 | 14.5%), and Educational Services (23 | 6.4%).
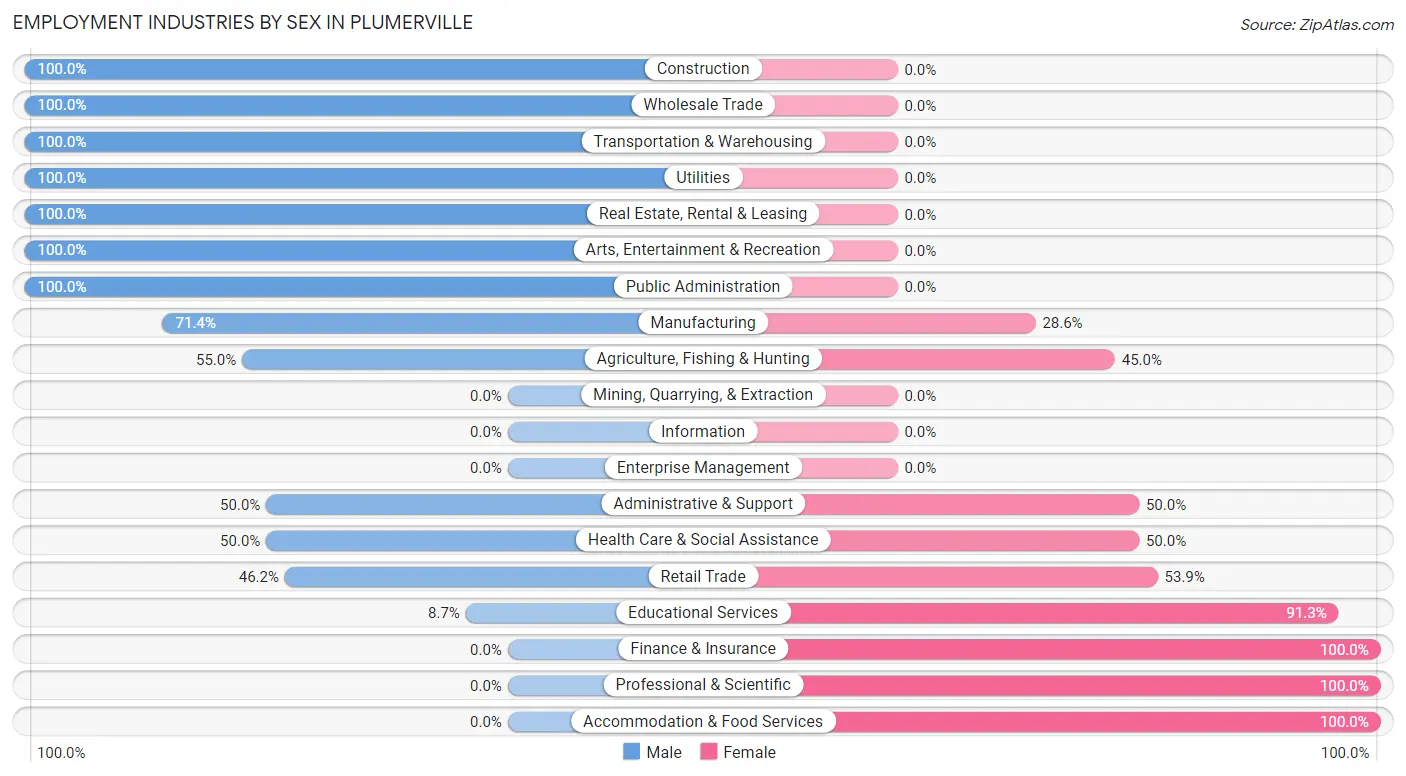
Employment Industries by Sex in Plumerville
The Plumerville industries that see more men than women are Construction (100.0%), Wholesale Trade (100.0%), and Transportation & Warehousing (100.0%), whereas the industries that tend to have a higher number of women are Finance & Insurance (100.0%), Professional & Scientific (100.0%), and Accommodation & Food Services (100.0%).
| Industry | Male | Female |
| Agriculture, Fishing & Hunting | 11 (55.0%) | 9 (45.0%) |
| Mining, Quarrying, & Extraction | 0 (0.0%) | 0 (0.0%) |
| Construction | 73 (100.0%) | 0 (0.0%) |
| Manufacturing | 45 (71.4%) | 18 (28.6%) |
| Wholesale Trade | 8 (100.0%) | 0 (0.0%) |
| Retail Trade | 24 (46.2%) | 28 (53.8%) |
| Transportation & Warehousing | 4 (100.0%) | 0 (0.0%) |
| Utilities | 1 (100.0%) | 0 (0.0%) |
| Information | 0 (0.0%) | 0 (0.0%) |
| Finance & Insurance | 0 (0.0%) | 8 (100.0%) |
| Real Estate, Rental & Leasing | 8 (100.0%) | 0 (0.0%) |
| Professional & Scientific | 0 (0.0%) | 2 (100.0%) |
| Enterprise Management | 0 (0.0%) | 0 (0.0%) |
| Administrative & Support | 1 (50.0%) | 1 (50.0%) |
| Educational Services | 2 (8.7%) | 21 (91.3%) |
| Health Care & Social Assistance | 30 (50.0%) | 30 (50.0%) |
| Arts, Entertainment & Recreation | 2 (100.0%) | 0 (0.0%) |
| Accommodation & Food Services | 0 (0.0%) | 11 (100.0%) |
| Public Administration | 1 (100.0%) | 0 (0.0%) |
| Total | 217 (60.5%) | 142 (39.6%) |
Education in Plumerville
School Enrollment in Plumerville
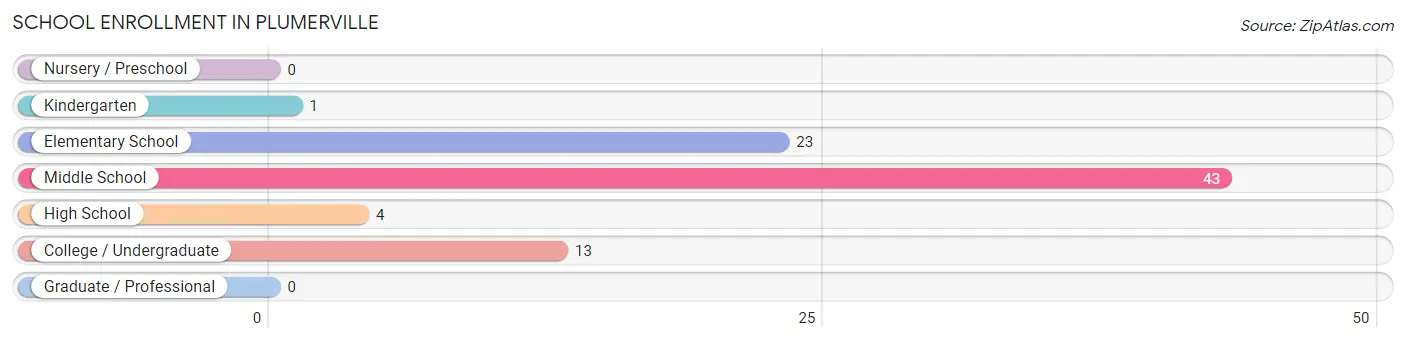
The most common levels of schooling among the 84 students in Plumerville are middle school (43 | 51.2%), elementary school (23 | 27.4%), and college / undergraduate (13 | 15.5%).
| School Level | # Students | % Students |
| Nursery / Preschool | 0 | 0.0% |
| Kindergarten | 1 | 1.2% |
| Elementary School | 23 | 27.4% |
| Middle School | 43 | 51.2% |
| High School | 4 | 4.8% |
| College / Undergraduate | 13 | 15.5% |
| Graduate / Professional | 0 | 0.0% |
| Total | 84 | 100.0% |
School Enrollment by Age by Funding Source in Plumerville
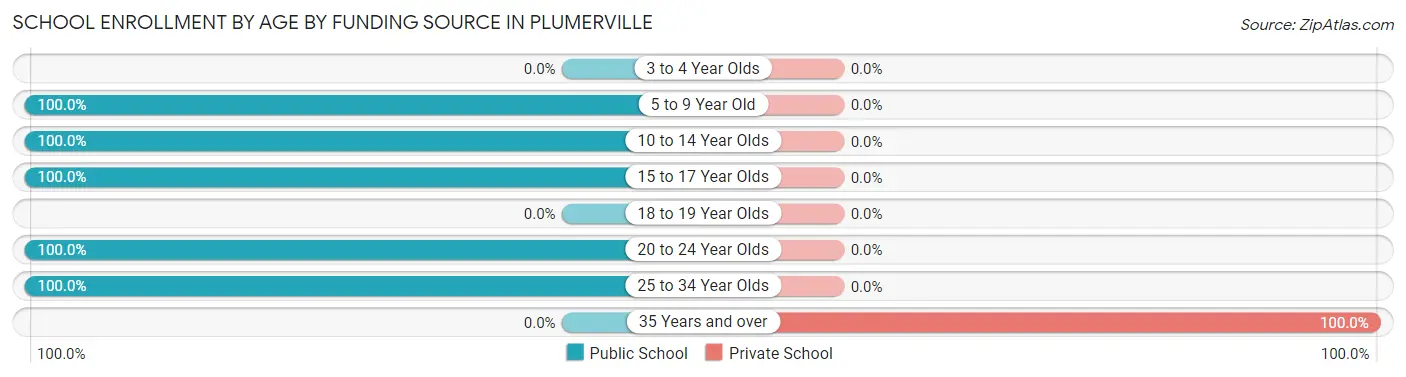
Out of a total of 84 students who are enrolled in schools in Plumerville, 1 (1.2%) attend a private institution, while the remaining 83 (98.8%) are enrolled in public schools. The age group of 35 years and over has the highest likelihood of being enrolled in private schools, with 1 (100.0% in the age bracket) enrolled. Conversely, the age group of 5 to 9 year old has the lowest likelihood of being enrolled in a private school, with 7 (100.0% in the age bracket) attending a public institution.
| Age Bracket | Public School | Private School |
| 3 to 4 Year Olds | 0 (0.0%) | 0 (0.0%) |
| 5 to 9 Year Old | 7 (100.0%) | 0 (0.0%) |
| 10 to 14 Year Olds | 60 (100.0%) | 0 (0.0%) |
| 15 to 17 Year Olds | 4 (100.0%) | 0 (0.0%) |
| 18 to 19 Year Olds | 0 (0.0%) | 0 (0.0%) |
| 20 to 24 Year Olds | 10 (100.0%) | 0 (0.0%) |
| 25 to 34 Year Olds | 2 (100.0%) | 0 (0.0%) |
| 35 Years and over | 0 (0.0%) | 1 (100.0%) |
| Total | 83 (98.8%) | 1 (1.2%) |
Educational Attainment by Field of Study in Plumerville
Education (28 | 33.3%), social sciences (14 | 16.7%), science & technology (13 | 15.5%), visual & performing arts (10 | 11.9%), and communications (6 | 7.1%) are the most common fields of study among 84 individuals in Plumerville who have obtained a bachelor's degree or higher.
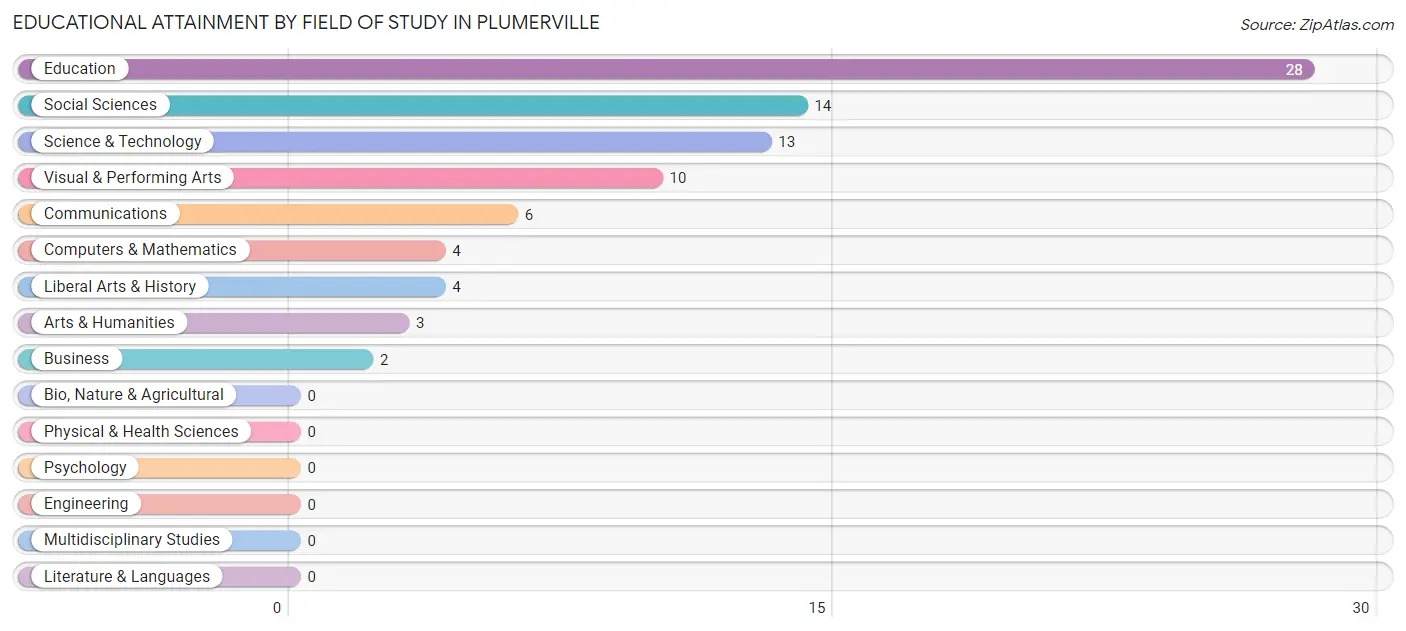
| Field of Study | # Graduates | % Graduates |
| Computers & Mathematics | 4 | 4.8% |
| Bio, Nature & Agricultural | 0 | 0.0% |
| Physical & Health Sciences | 0 | 0.0% |
| Psychology | 0 | 0.0% |
| Social Sciences | 14 | 16.7% |
| Engineering | 0 | 0.0% |
| Multidisciplinary Studies | 0 | 0.0% |
| Science & Technology | 13 | 15.5% |
| Business | 2 | 2.4% |
| Education | 28 | 33.3% |
| Literature & Languages | 0 | 0.0% |
| Liberal Arts & History | 4 | 4.8% |
| Visual & Performing Arts | 10 | 11.9% |
| Communications | 6 | 7.1% |
| Arts & Humanities | 3 | 3.6% |
| Total | 84 | 100.0% |
Transportation & Commute in Plumerville
Vehicle Availability by Sex in Plumerville
The most prevalent vehicle ownership categories in Plumerville are males with 3 vehicles (73, accounting for 36.1%) and females with 3 vehicles (41, making up 51.4%).
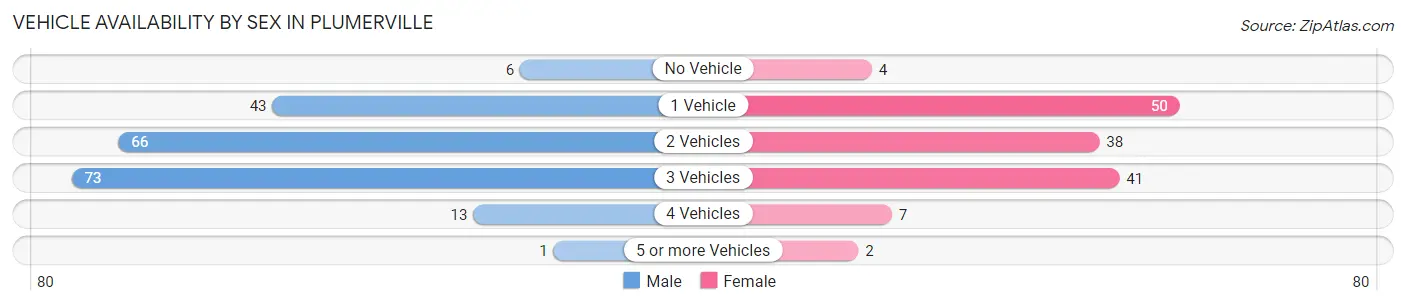
| Vehicles Available | Male | Female |
| No Vehicle | 6 (3.0%) | 4 (2.8%) |
| 1 Vehicle | 43 (21.3%) | 50 (35.2%) |
| 2 Vehicles | 66 (32.7%) | 38 (26.8%) |
| 3 Vehicles | 73 (36.1%) | 41 (28.9%) |
| 4 Vehicles | 13 (6.4%) | 7 (4.9%) |
| 5 or more Vehicles | 1 (0.5%) | 2 (1.4%) |
| Total | 202 (100.0%) | 142 (100.0%) |
Commute Time in Plumerville
The most frequently occuring commute durations in Plumerville are 5 to 9 minutes (77 commuters, 22.5%), 10 to 14 minutes (76 commuters, 22.2%), and 45 to 59 minutes (53 commuters, 15.4%).
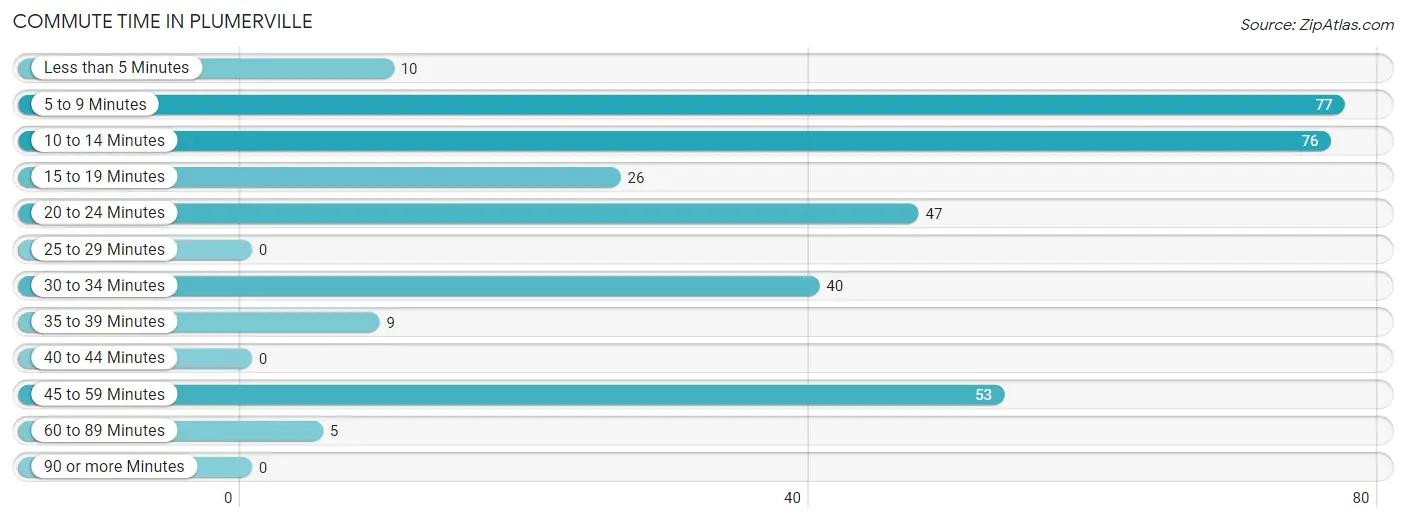
| Commute Time | # Commuters | % Commuters |
| Less than 5 Minutes | 10 | 2.9% |
| 5 to 9 Minutes | 77 | 22.5% |
| 10 to 14 Minutes | 76 | 22.2% |
| 15 to 19 Minutes | 26 | 7.6% |
| 20 to 24 Minutes | 47 | 13.7% |
| 25 to 29 Minutes | 0 | 0.0% |
| 30 to 34 Minutes | 40 | 11.7% |
| 35 to 39 Minutes | 9 | 2.6% |
| 40 to 44 Minutes | 0 | 0.0% |
| 45 to 59 Minutes | 53 | 15.4% |
| 60 to 89 Minutes | 5 | 1.5% |
| 90 or more Minutes | 0 | 0.0% |
Commute Time by Sex in Plumerville
The most common commute times in Plumerville are 5 to 9 minutes (55 commuters, 27.4%) for males and 20 to 24 minutes (37 commuters, 26.1%) for females.
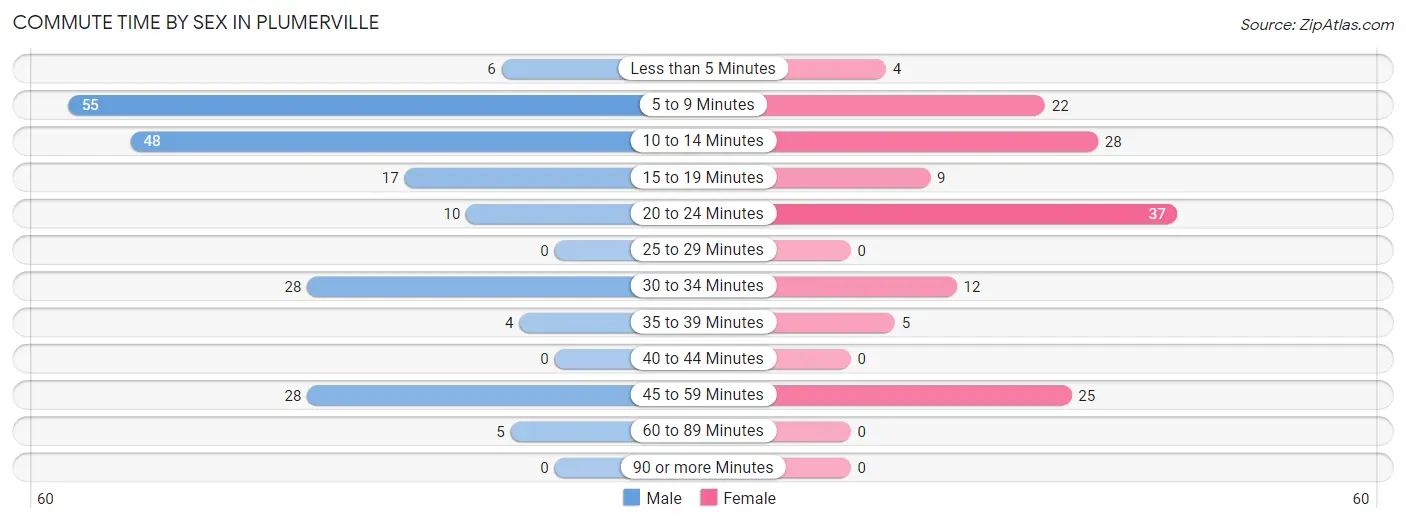
| Commute Time | Male | Female |
| Less than 5 Minutes | 6 (3.0%) | 4 (2.8%) |
| 5 to 9 Minutes | 55 (27.4%) | 22 (15.5%) |
| 10 to 14 Minutes | 48 (23.9%) | 28 (19.7%) |
| 15 to 19 Minutes | 17 (8.5%) | 9 (6.3%) |
| 20 to 24 Minutes | 10 (5.0%) | 37 (26.1%) |
| 25 to 29 Minutes | 0 (0.0%) | 0 (0.0%) |
| 30 to 34 Minutes | 28 (13.9%) | 12 (8.5%) |
| 35 to 39 Minutes | 4 (2.0%) | 5 (3.5%) |
| 40 to 44 Minutes | 0 (0.0%) | 0 (0.0%) |
| 45 to 59 Minutes | 28 (13.9%) | 25 (17.6%) |
| 60 to 89 Minutes | 5 (2.5%) | 0 (0.0%) |
| 90 or more Minutes | 0 (0.0%) | 0 (0.0%) |
Time of Departure to Work by Sex in Plumerville
The most frequent times of departure to work in Plumerville are 6:00 AM to 6:29 AM (54, 26.9%) for males and 12:00 AM to 4:59 AM (36, 25.4%) for females.
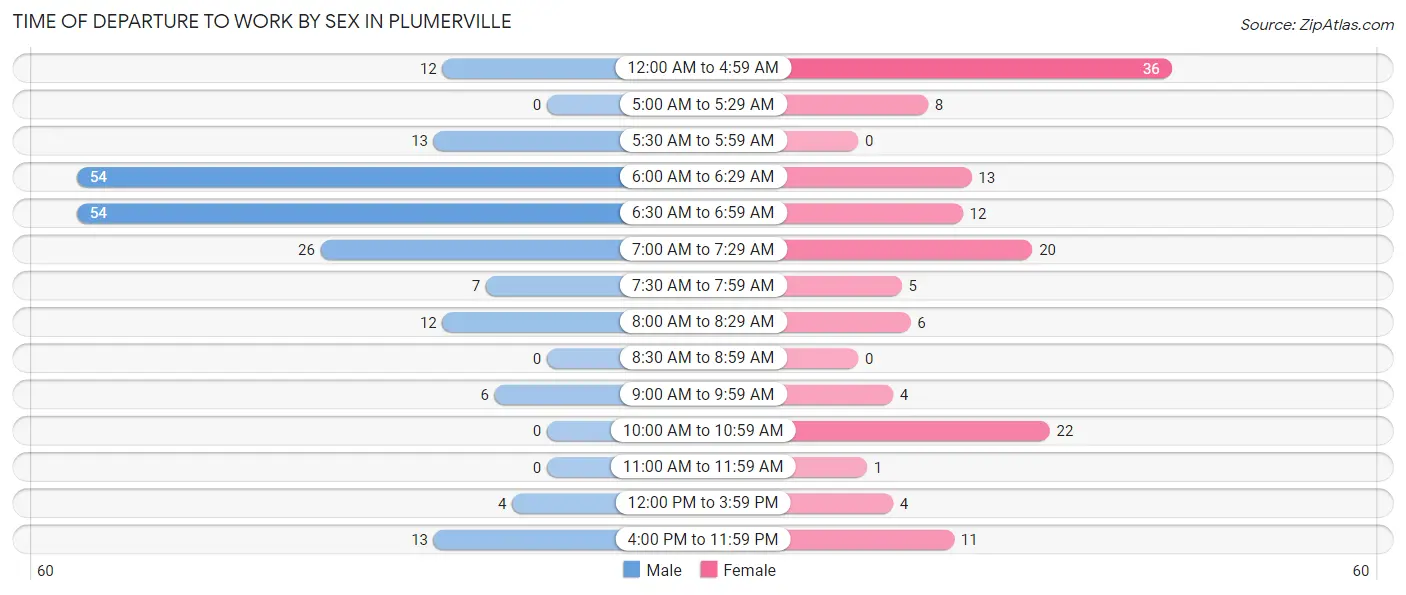
| Time of Departure | Male | Female |
| 12:00 AM to 4:59 AM | 12 (6.0%) | 36 (25.4%) |
| 5:00 AM to 5:29 AM | 0 (0.0%) | 8 (5.6%) |
| 5:30 AM to 5:59 AM | 13 (6.5%) | 0 (0.0%) |
| 6:00 AM to 6:29 AM | 54 (26.9%) | 13 (9.1%) |
| 6:30 AM to 6:59 AM | 54 (26.9%) | 12 (8.5%) |
| 7:00 AM to 7:29 AM | 26 (12.9%) | 20 (14.1%) |
| 7:30 AM to 7:59 AM | 7 (3.5%) | 5 (3.5%) |
| 8:00 AM to 8:29 AM | 12 (6.0%) | 6 (4.2%) |
| 8:30 AM to 8:59 AM | 0 (0.0%) | 0 (0.0%) |
| 9:00 AM to 9:59 AM | 6 (3.0%) | 4 (2.8%) |
| 10:00 AM to 10:59 AM | 0 (0.0%) | 22 (15.5%) |
| 11:00 AM to 11:59 AM | 0 (0.0%) | 1 (0.7%) |
| 12:00 PM to 3:59 PM | 4 (2.0%) | 4 (2.8%) |
| 4:00 PM to 11:59 PM | 13 (6.5%) | 11 (7.7%) |
| Total | 201 (100.0%) | 142 (100.0%) |
Housing Occupancy in Plumerville
Occupancy by Ownership in Plumerville
Of the total 380 dwellings in Plumerville, owner-occupied units account for 237 (62.4%), while renter-occupied units make up 143 (37.6%).
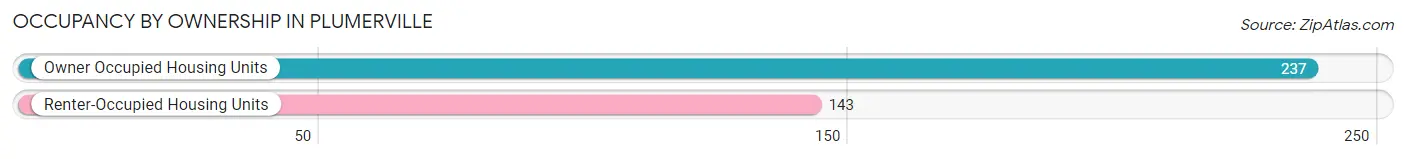
| Occupancy | # Housing Units | % Housing Units |
| Owner Occupied Housing Units | 237 | 62.4% |
| Renter-Occupied Housing Units | 143 | 37.6% |
| Total Occupied Housing Units | 380 | 100.0% |
Occupancy by Household Size in Plumerville
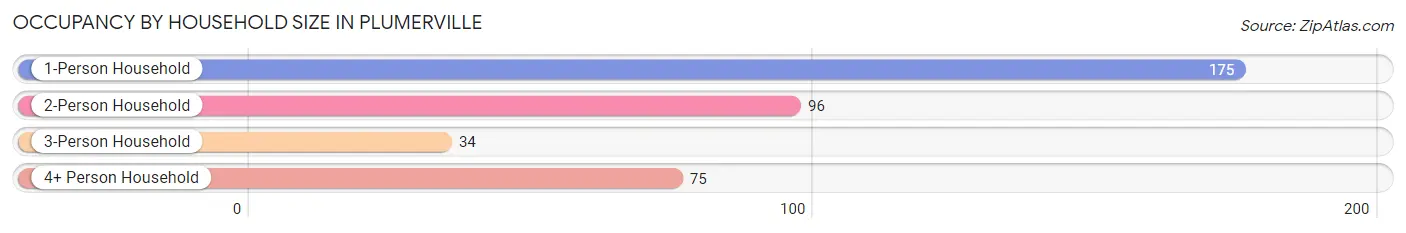
| Household Size | # Housing Units | % Housing Units |
| 1-Person Household | 175 | 46.1% |
| 2-Person Household | 96 | 25.3% |
| 3-Person Household | 34 | 8.9% |
| 4+ Person Household | 75 | 19.7% |
| Total Housing Units | 380 | 100.0% |
Occupancy by Ownership by Household Size in Plumerville
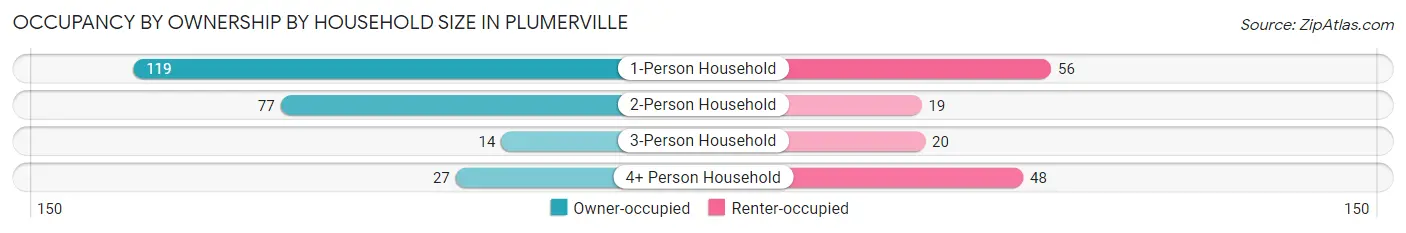
| Household Size | Owner-occupied | Renter-occupied |
| 1-Person Household | 119 (68.0%) | 56 (32.0%) |
| 2-Person Household | 77 (80.2%) | 19 (19.8%) |
| 3-Person Household | 14 (41.2%) | 20 (58.8%) |
| 4+ Person Household | 27 (36.0%) | 48 (64.0%) |
| Total Housing Units | 237 (62.4%) | 143 (37.6%) |
Occupancy by Educational Attainment in Plumerville
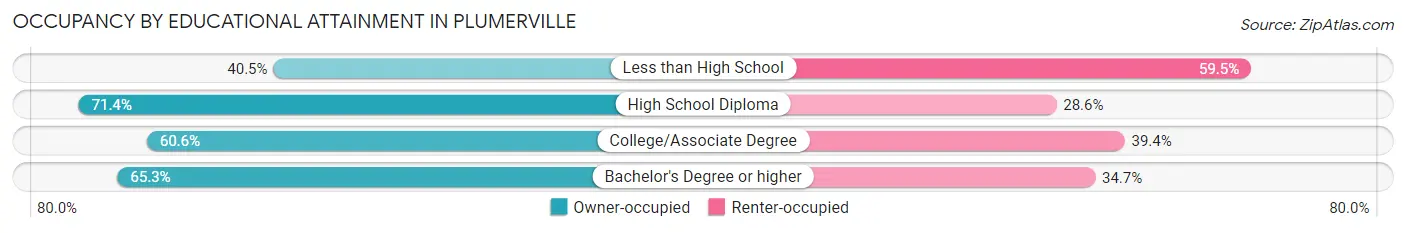
| Household Size | Owner-occupied | Renter-occupied |
| Less than High School | 30 (40.5%) | 44 (59.5%) |
| High School Diploma | 120 (71.4%) | 48 (28.6%) |
| College/Associate Degree | 40 (60.6%) | 26 (39.4%) |
| Bachelor's Degree or higher | 47 (65.3%) | 25 (34.7%) |
Occupancy by Age of Householder in Plumerville
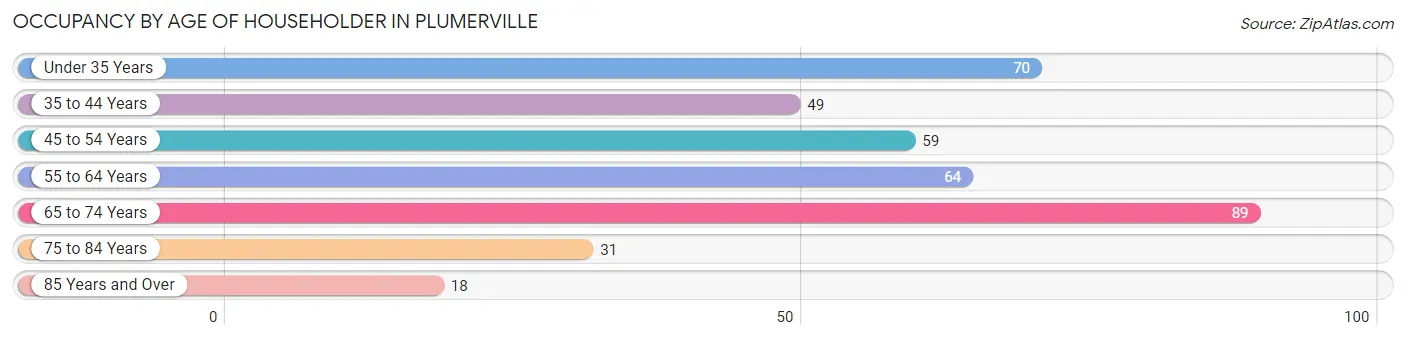
| Age Bracket | # Households | % Households |
| Under 35 Years | 70 | 18.4% |
| 35 to 44 Years | 49 | 12.9% |
| 45 to 54 Years | 59 | 15.5% |
| 55 to 64 Years | 64 | 16.8% |
| 65 to 74 Years | 89 | 23.4% |
| 75 to 84 Years | 31 | 8.2% |
| 85 Years and Over | 18 | 4.7% |
| Total | 380 | 100.0% |
Housing Finances in Plumerville
Median Income by Occupancy in Plumerville
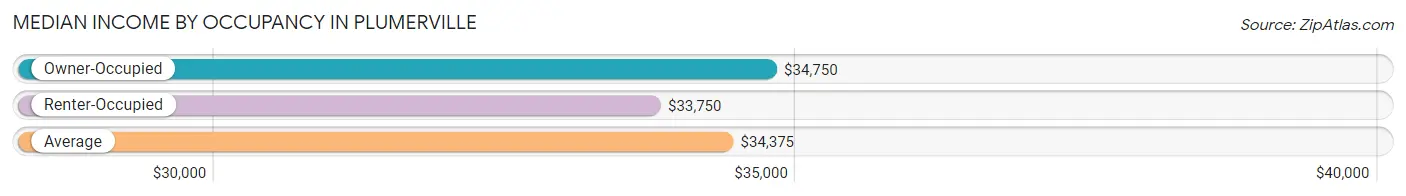
| Occupancy Type | # Households | Median Income |
| Owner-Occupied | 237 (62.4%) | $34,750 |
| Renter-Occupied | 143 (37.6%) | $33,750 |
| Average | 380 (100.0%) | $34,375 |
Occupancy by Householder Income Bracket in Plumerville
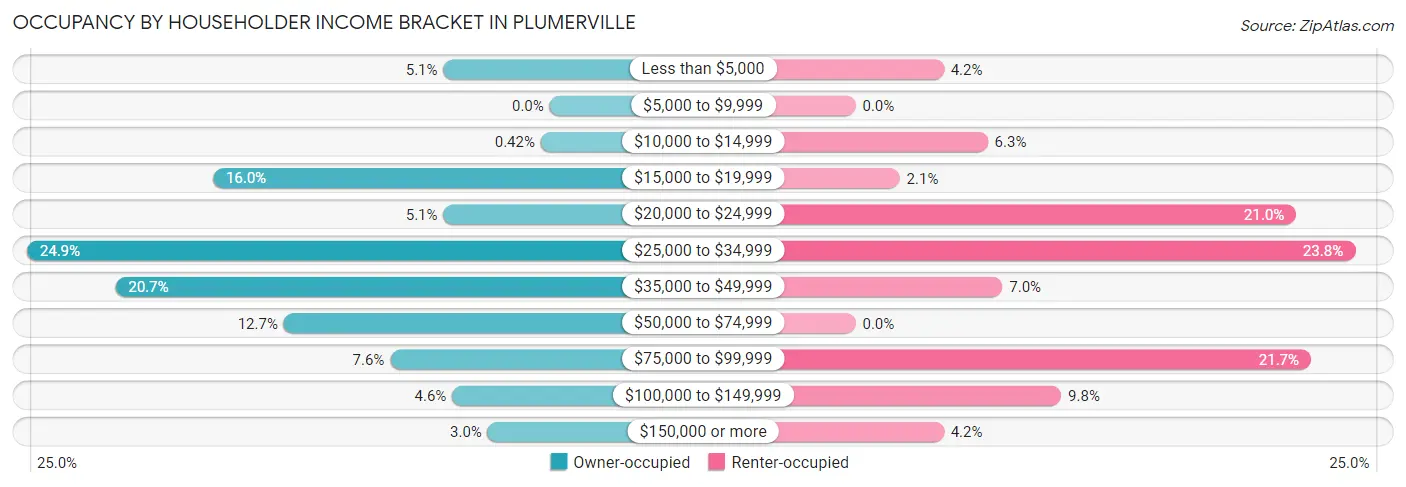
| Income Bracket | Owner-occupied | Renter-occupied |
| Less than $5,000 | 12 (5.1%) | 6 (4.2%) |
| $5,000 to $9,999 | 0 (0.0%) | 0 (0.0%) |
| $10,000 to $14,999 | 1 (0.4%) | 9 (6.3%) |
| $15,000 to $19,999 | 38 (16.0%) | 3 (2.1%) |
| $20,000 to $24,999 | 12 (5.1%) | 30 (21.0%) |
| $25,000 to $34,999 | 59 (24.9%) | 34 (23.8%) |
| $35,000 to $49,999 | 49 (20.7%) | 10 (7.0%) |
| $50,000 to $74,999 | 30 (12.7%) | 0 (0.0%) |
| $75,000 to $99,999 | 18 (7.6%) | 31 (21.7%) |
| $100,000 to $149,999 | 11 (4.6%) | 14 (9.8%) |
| $150,000 or more | 7 (2.9%) | 6 (4.2%) |
| Total | 237 (100.0%) | 143 (100.0%) |
Monthly Housing Cost Tiers in Plumerville
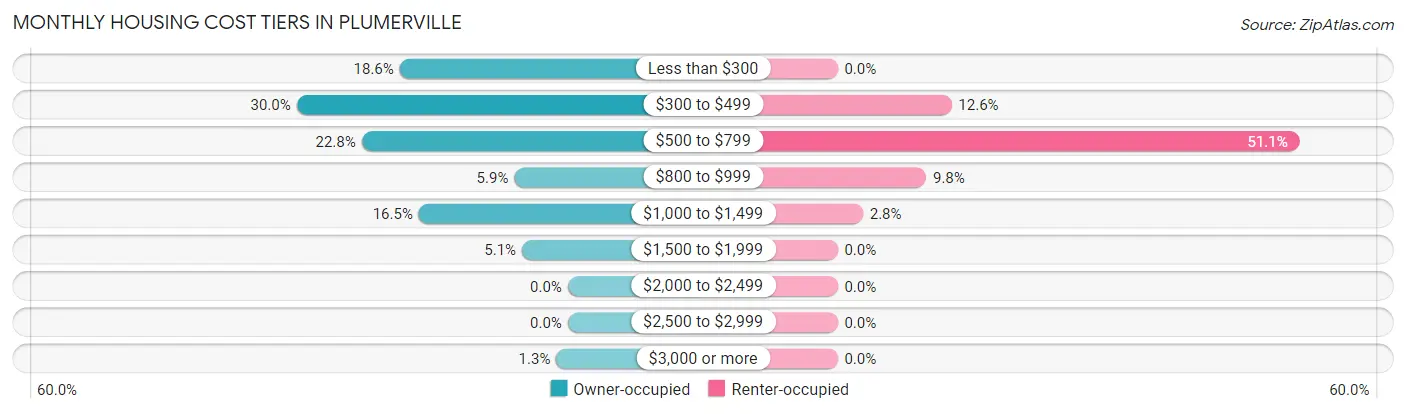
| Monthly Cost | Owner-occupied | Renter-occupied |
| Less than $300 | 44 (18.6%) | 0 (0.0%) |
| $300 to $499 | 71 (30.0%) | 18 (12.6%) |
| $500 to $799 | 54 (22.8%) | 73 (51.0%) |
| $800 to $999 | 14 (5.9%) | 14 (9.8%) |
| $1,000 to $1,499 | 39 (16.5%) | 4 (2.8%) |
| $1,500 to $1,999 | 12 (5.1%) | 0 (0.0%) |
| $2,000 to $2,499 | 0 (0.0%) | 0 (0.0%) |
| $2,500 to $2,999 | 0 (0.0%) | 0 (0.0%) |
| $3,000 or more | 3 (1.3%) | 0 (0.0%) |
| Total | 237 (100.0%) | 143 (100.0%) |
Physical Housing Characteristics in Plumerville
Housing Structures in Plumerville
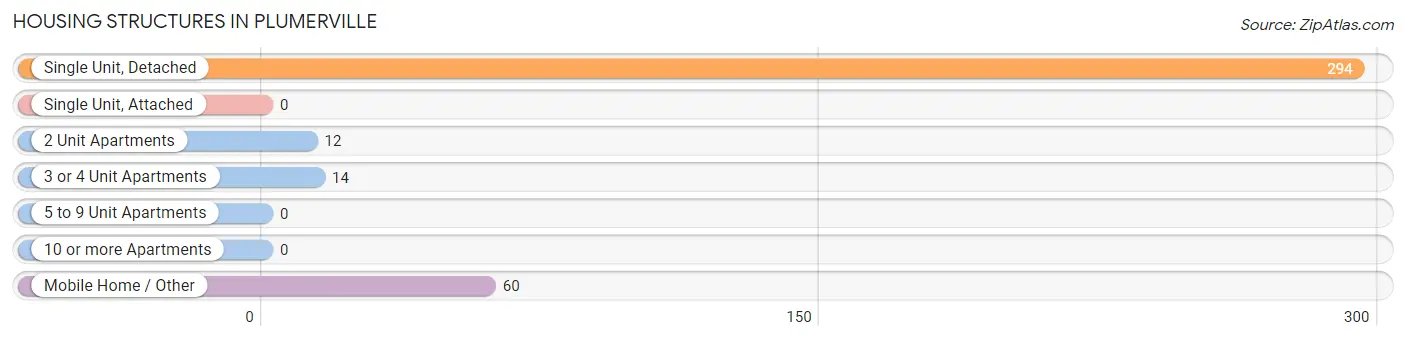
| Structure Type | # Housing Units | % Housing Units |
| Single Unit, Detached | 294 | 77.4% |
| Single Unit, Attached | 0 | 0.0% |
| 2 Unit Apartments | 12 | 3.2% |
| 3 or 4 Unit Apartments | 14 | 3.7% |
| 5 to 9 Unit Apartments | 0 | 0.0% |
| 10 or more Apartments | 0 | 0.0% |
| Mobile Home / Other | 60 | 15.8% |
| Total | 380 | 100.0% |
Housing Structures by Occupancy in Plumerville
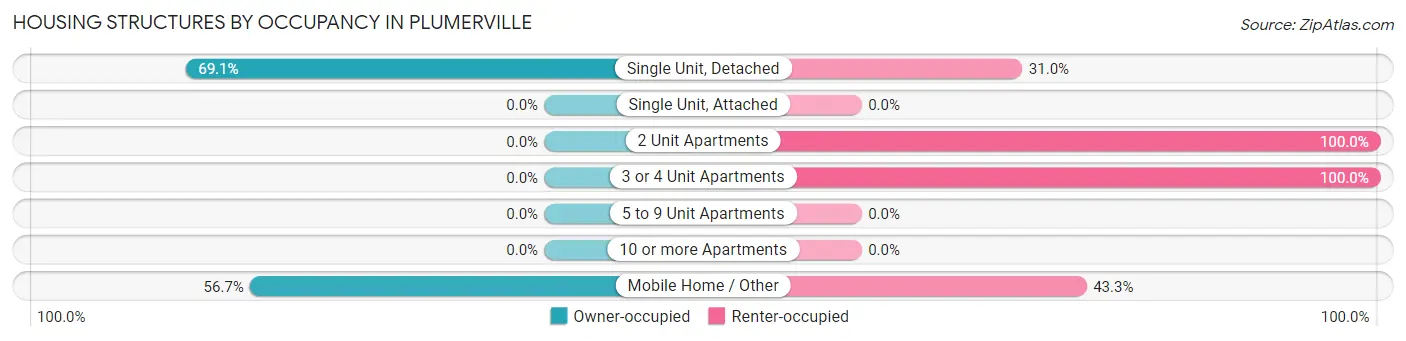
| Structure Type | Owner-occupied | Renter-occupied |
| Single Unit, Detached | 203 (69.1%) | 91 (30.9%) |
| Single Unit, Attached | 0 (0.0%) | 0 (0.0%) |
| 2 Unit Apartments | 0 (0.0%) | 12 (100.0%) |
| 3 or 4 Unit Apartments | 0 (0.0%) | 14 (100.0%) |
| 5 to 9 Unit Apartments | 0 (0.0%) | 0 (0.0%) |
| 10 or more Apartments | 0 (0.0%) | 0 (0.0%) |
| Mobile Home / Other | 34 (56.7%) | 26 (43.3%) |
| Total | 237 (62.4%) | 143 (37.6%) |
Housing Structures by Number of Rooms in Plumerville
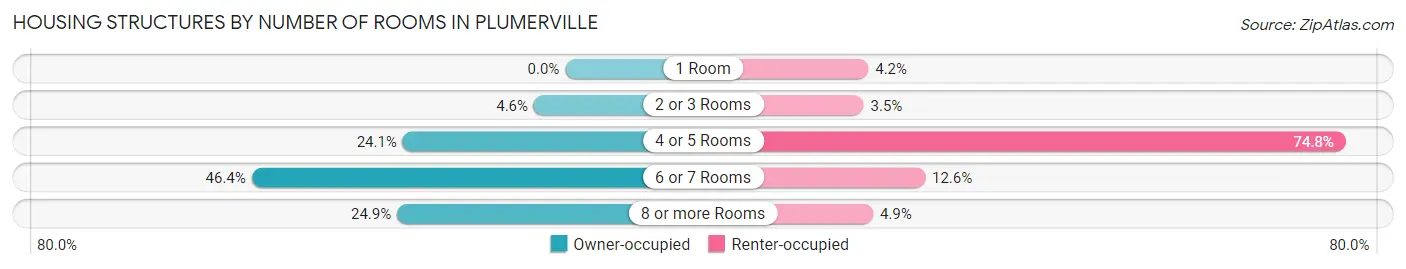
| Number of Rooms | Owner-occupied | Renter-occupied |
| 1 Room | 0 (0.0%) | 6 (4.2%) |
| 2 or 3 Rooms | 11 (4.6%) | 5 (3.5%) |
| 4 or 5 Rooms | 57 (24.0%) | 107 (74.8%) |
| 6 or 7 Rooms | 110 (46.4%) | 18 (12.6%) |
| 8 or more Rooms | 59 (24.9%) | 7 (4.9%) |
| Total | 237 (100.0%) | 143 (100.0%) |
Housing Structure by Heating Type in Plumerville
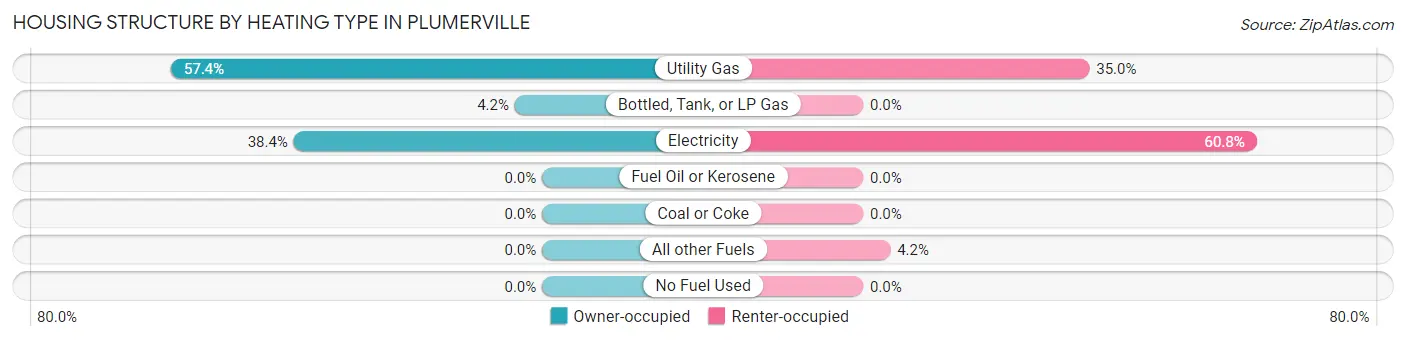
| Heating Type | Owner-occupied | Renter-occupied |
| Utility Gas | 136 (57.4%) | 50 (35.0%) |
| Bottled, Tank, or LP Gas | 10 (4.2%) | 0 (0.0%) |
| Electricity | 91 (38.4%) | 87 (60.8%) |
| Fuel Oil or Kerosene | 0 (0.0%) | 0 (0.0%) |
| Coal or Coke | 0 (0.0%) | 0 (0.0%) |
| All other Fuels | 0 (0.0%) | 6 (4.2%) |
| No Fuel Used | 0 (0.0%) | 0 (0.0%) |
| Total | 237 (100.0%) | 143 (100.0%) |
Household Vehicle Usage in Plumerville
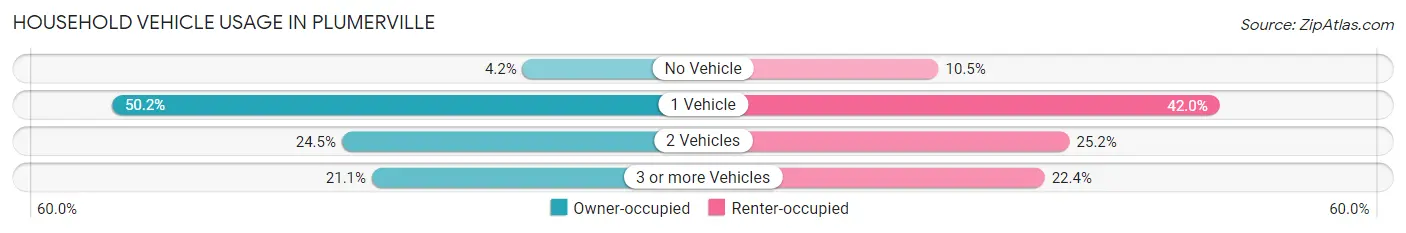
| Vehicles per Household | Owner-occupied | Renter-occupied |
| No Vehicle | 10 (4.2%) | 15 (10.5%) |
| 1 Vehicle | 119 (50.2%) | 60 (42.0%) |
| 2 Vehicles | 58 (24.5%) | 36 (25.2%) |
| 3 or more Vehicles | 50 (21.1%) | 32 (22.4%) |
| Total | 237 (100.0%) | 143 (100.0%) |
Real Estate & Mortgages in Plumerville
Real Estate and Mortgage Overview in Plumerville
| Characteristic | Without Mortgage | With Mortgage |
| Housing Units | 138 | 99 |
| Median Property Value | $142,500 | $72,900 |
| Median Household Income | $37,500 | $0 |
| Monthly Housing Costs | $392 | $0 |
| Real Estate Taxes | $444 | $22 |
Property Value by Mortgage Status in Plumerville
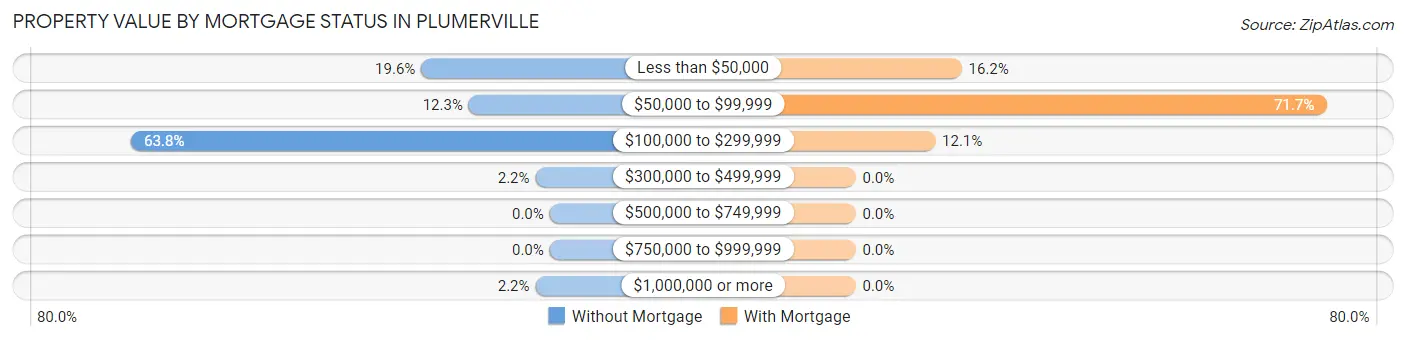
| Property Value | Without Mortgage | With Mortgage |
| Less than $50,000 | 27 (19.6%) | 16 (16.2%) |
| $50,000 to $99,999 | 17 (12.3%) | 71 (71.7%) |
| $100,000 to $299,999 | 88 (63.8%) | 12 (12.1%) |
| $300,000 to $499,999 | 3 (2.2%) | 0 (0.0%) |
| $500,000 to $749,999 | 0 (0.0%) | 0 (0.0%) |
| $750,000 to $999,999 | 0 (0.0%) | 0 (0.0%) |
| $1,000,000 or more | 3 (2.2%) | 0 (0.0%) |
| Total | 138 (100.0%) | 99 (100.0%) |
Household Income by Mortgage Status in Plumerville
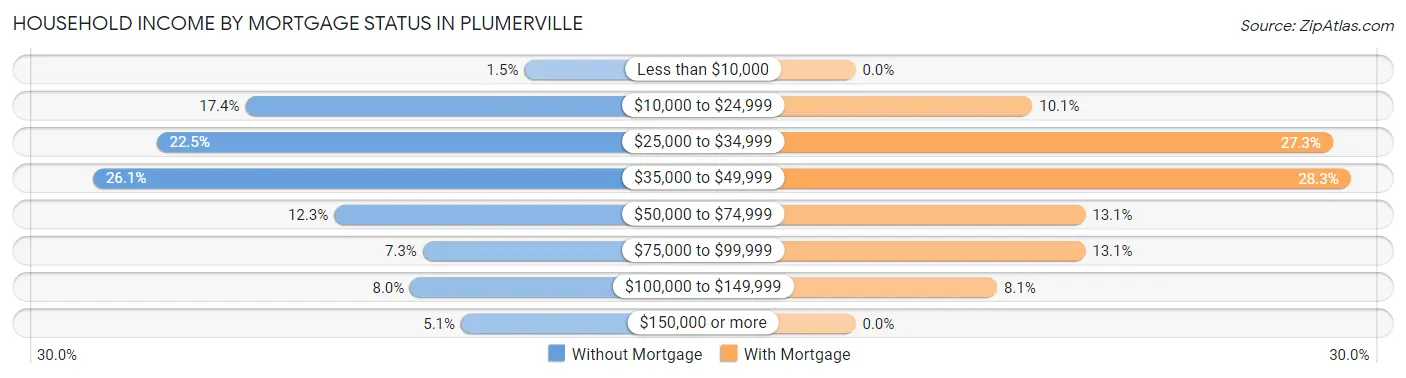
| Household Income | Without Mortgage | With Mortgage |
| Less than $10,000 | 2 (1.5%) | 0 (0.0%) |
| $10,000 to $24,999 | 24 (17.4%) | 10 (10.1%) |
| $25,000 to $34,999 | 31 (22.5%) | 27 (27.3%) |
| $35,000 to $49,999 | 36 (26.1%) | 28 (28.3%) |
| $50,000 to $74,999 | 17 (12.3%) | 13 (13.1%) |
| $75,000 to $99,999 | 10 (7.2%) | 13 (13.1%) |
| $100,000 to $149,999 | 11 (8.0%) | 8 (8.1%) |
| $150,000 or more | 7 (5.1%) | 0 (0.0%) |
| Total | 138 (100.0%) | 99 (100.0%) |
Property Value to Household Income Ratio in Plumerville
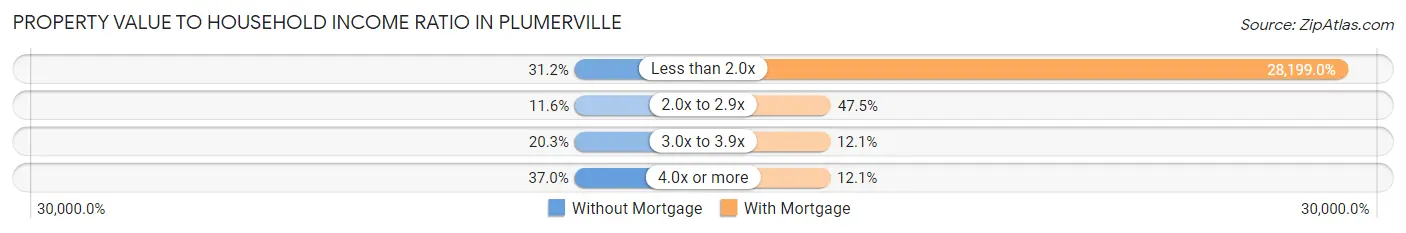
| Value-to-Income Ratio | Without Mortgage | With Mortgage |
| Less than 2.0x | 43 (31.2%) | 27,917 (28,199.0%) |
| 2.0x to 2.9x | 16 (11.6%) | 47 (47.5%) |
| 3.0x to 3.9x | 28 (20.3%) | 12 (12.1%) |
| 4.0x or more | 51 (37.0%) | 12 (12.1%) |
| Total | 138 (100.0%) | 99 (100.0%) |
Real Estate Taxes by Mortgage Status in Plumerville
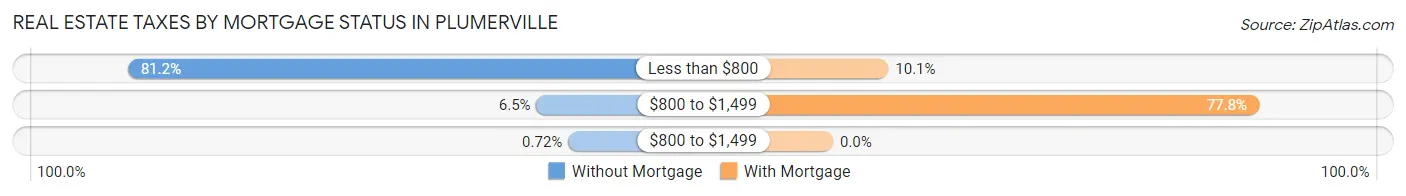
| Property Taxes | Without Mortgage | With Mortgage |
| Less than $800 | 112 (81.2%) | 10 (10.1%) |
| $800 to $1,499 | 9 (6.5%) | 77 (77.8%) |
| $800 to $1,499 | 1 (0.7%) | 0 (0.0%) |
| Total | 138 (100.0%) | 99 (100.0%) |
Health & Disability in Plumerville
Health Insurance Coverage by Age in Plumerville
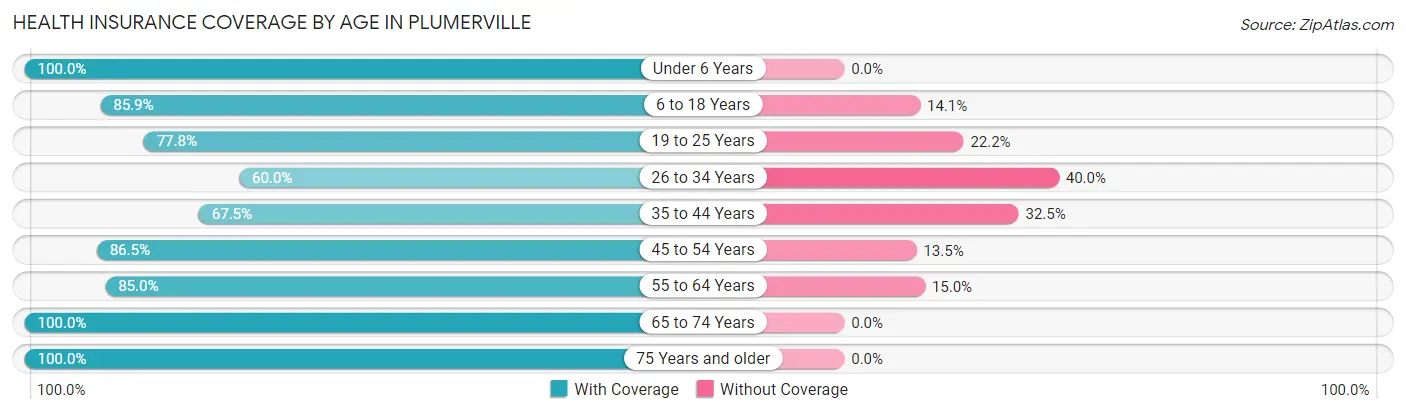
| Age Bracket | With Coverage | Without Coverage |
| Under 6 Years | 36 (100.0%) | 0 (0.0%) |
| 6 to 18 Years | 73 (85.9%) | 12 (14.1%) |
| 19 to 25 Years | 42 (77.8%) | 12 (22.2%) |
| 26 to 34 Years | 96 (60.0%) | 64 (40.0%) |
| 35 to 44 Years | 54 (67.5%) | 26 (32.5%) |
| 45 to 54 Years | 90 (86.5%) | 14 (13.5%) |
| 55 to 64 Years | 96 (85.0%) | 17 (15.0%) |
| 65 to 74 Years | 109 (100.0%) | 0 (0.0%) |
| 75 Years and older | 61 (100.0%) | 0 (0.0%) |
| Total | 657 (81.9%) | 145 (18.1%) |
Health Insurance Coverage by Citizenship Status in Plumerville
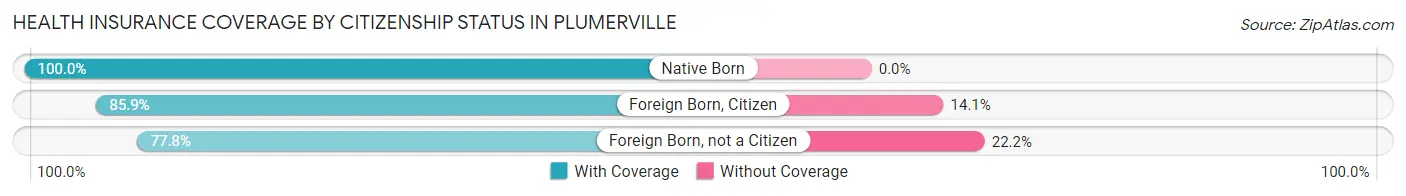
| Citizenship Status | With Coverage | Without Coverage |
| Native Born | 36 (100.0%) | 0 (0.0%) |
| Foreign Born, Citizen | 73 (85.9%) | 12 (14.1%) |
| Foreign Born, not a Citizen | 42 (77.8%) | 12 (22.2%) |
Health Insurance Coverage by Household Income in Plumerville
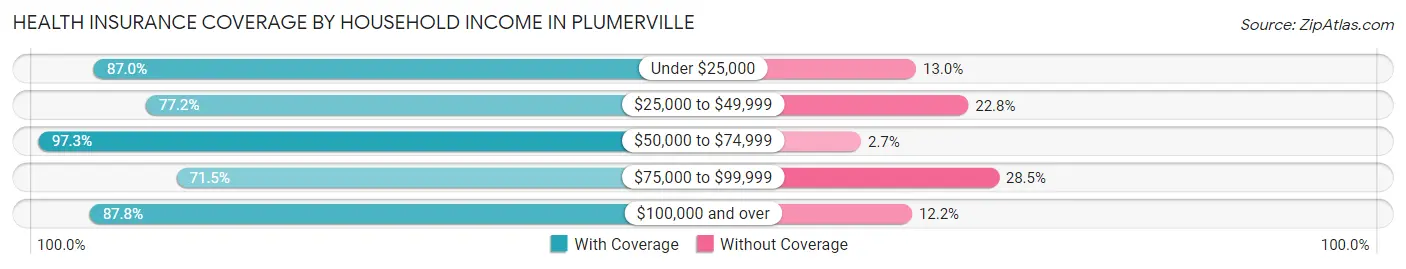
| Household Income | With Coverage | Without Coverage |
| Under $25,000 | 161 (87.0%) | 24 (13.0%) |
| $25,000 to $49,999 | 190 (77.2%) | 56 (22.8%) |
| $50,000 to $74,999 | 73 (97.3%) | 2 (2.7%) |
| $75,000 to $99,999 | 118 (71.5%) | 47 (28.5%) |
| $100,000 and over | 115 (87.8%) | 16 (12.2%) |
Public vs Private Health Insurance Coverage by Age in Plumerville
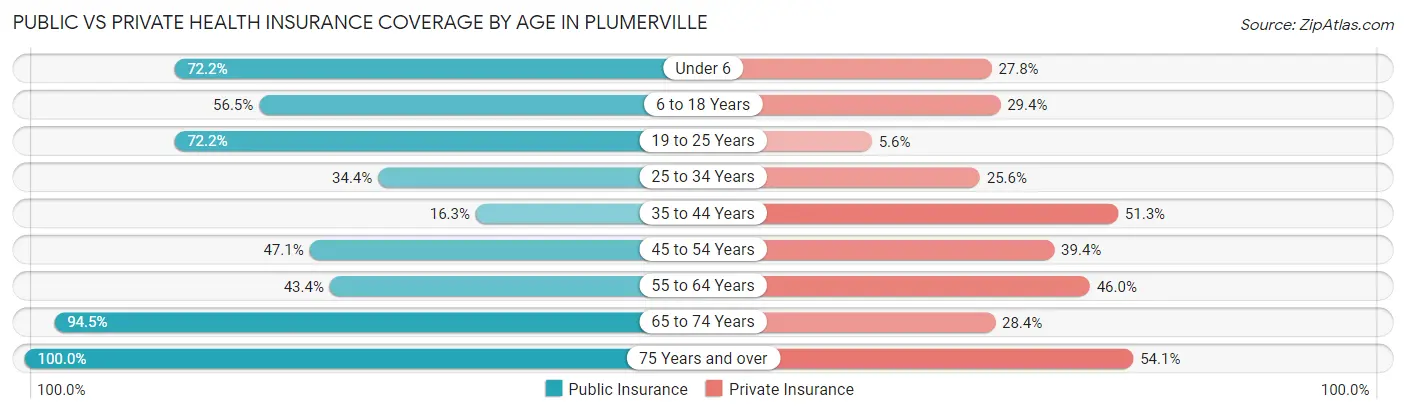
| Age Bracket | Public Insurance | Private Insurance |
| Under 6 | 26 (72.2%) | 10 (27.8%) |
| 6 to 18 Years | 48 (56.5%) | 25 (29.4%) |
| 19 to 25 Years | 39 (72.2%) | 3 (5.6%) |
| 25 to 34 Years | 55 (34.4%) | 41 (25.6%) |
| 35 to 44 Years | 13 (16.3%) | 41 (51.2%) |
| 45 to 54 Years | 49 (47.1%) | 41 (39.4%) |
| 55 to 64 Years | 49 (43.4%) | 52 (46.0%) |
| 65 to 74 Years | 103 (94.5%) | 31 (28.4%) |
| 75 Years and over | 61 (100.0%) | 33 (54.1%) |
| Total | 443 (55.2%) | 277 (34.5%) |
Disability Status by Sex by Age in Plumerville
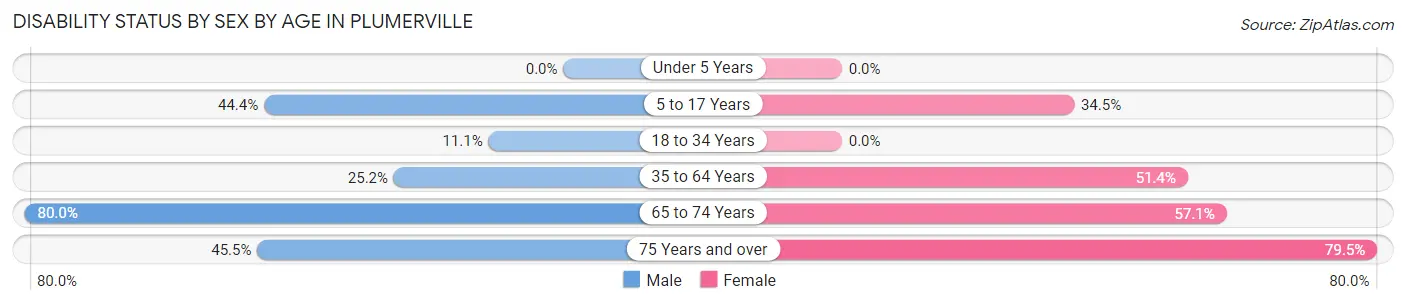
| Age Bracket | Male | Female |
| Under 5 Years | 0 (0.0%) | 0 (0.0%) |
| 5 to 17 Years | 24 (44.4%) | 10 (34.5%) |
| 18 to 34 Years | 17 (11.1%) | 0 (0.0%) |
| 35 to 64 Years | 38 (25.2%) | 75 (51.4%) |
| 65 to 74 Years | 48 (80.0%) | 28 (57.1%) |
| 75 Years and over | 10 (45.5%) | 31 (79.5%) |
Disability Class by Sex by Age in Plumerville
Disability Class: Hearing Difficulty
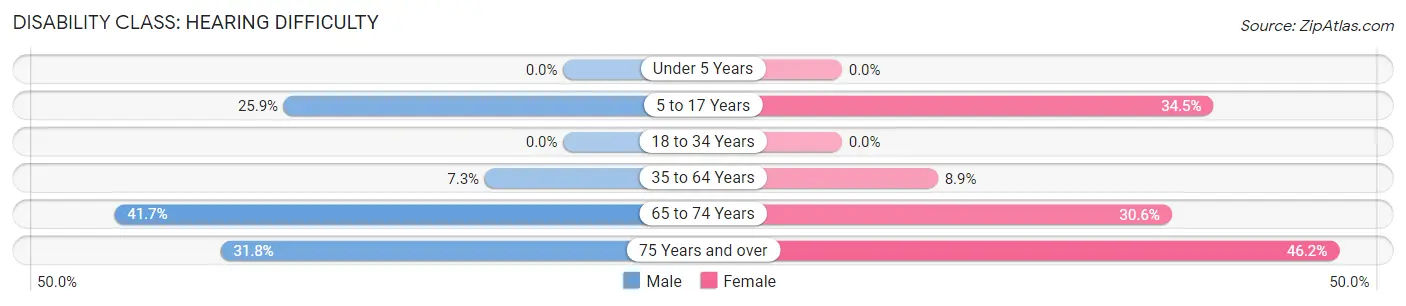
| Age Bracket | Male | Female |
| Under 5 Years | 0 (0.0%) | 0 (0.0%) |
| 5 to 17 Years | 14 (25.9%) | 10 (34.5%) |
| 18 to 34 Years | 0 (0.0%) | 0 (0.0%) |
| 35 to 64 Years | 11 (7.3%) | 13 (8.9%) |
| 65 to 74 Years | 25 (41.7%) | 15 (30.6%) |
| 75 Years and over | 7 (31.8%) | 18 (46.2%) |
Disability Class: Vision Difficulty
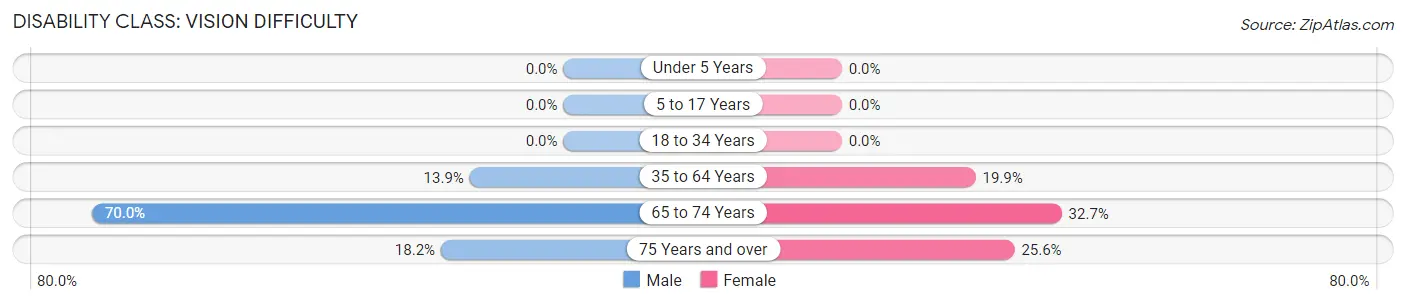
| Age Bracket | Male | Female |
| Under 5 Years | 0 (0.0%) | 0 (0.0%) |
| 5 to 17 Years | 0 (0.0%) | 0 (0.0%) |
| 18 to 34 Years | 0 (0.0%) | 0 (0.0%) |
| 35 to 64 Years | 21 (13.9%) | 29 (19.9%) |
| 65 to 74 Years | 42 (70.0%) | 16 (32.7%) |
| 75 Years and over | 4 (18.2%) | 10 (25.6%) |
Disability Class: Cognitive Difficulty
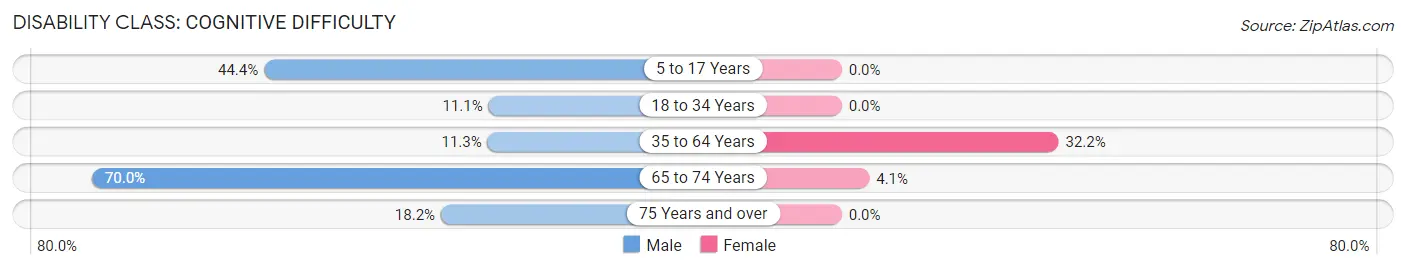
| Age Bracket | Male | Female |
| 5 to 17 Years | 24 (44.4%) | 0 (0.0%) |
| 18 to 34 Years | 17 (11.1%) | 0 (0.0%) |
| 35 to 64 Years | 17 (11.3%) | 47 (32.2%) |
| 65 to 74 Years | 42 (70.0%) | 2 (4.1%) |
| 75 Years and over | 4 (18.2%) | 0 (0.0%) |
Disability Class: Ambulatory Difficulty
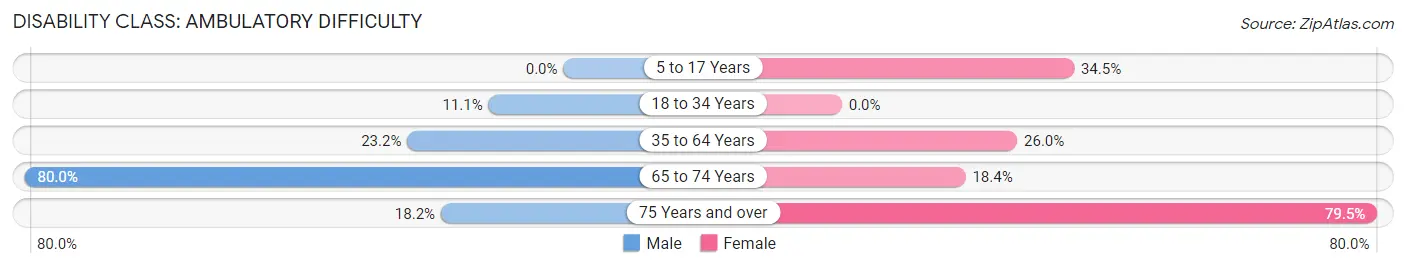
| Age Bracket | Male | Female |
| 5 to 17 Years | 0 (0.0%) | 10 (34.5%) |
| 18 to 34 Years | 17 (11.1%) | 0 (0.0%) |
| 35 to 64 Years | 35 (23.2%) | 38 (26.0%) |
| 65 to 74 Years | 48 (80.0%) | 9 (18.4%) |
| 75 Years and over | 4 (18.2%) | 31 (79.5%) |
Disability Class: Self-Care Difficulty
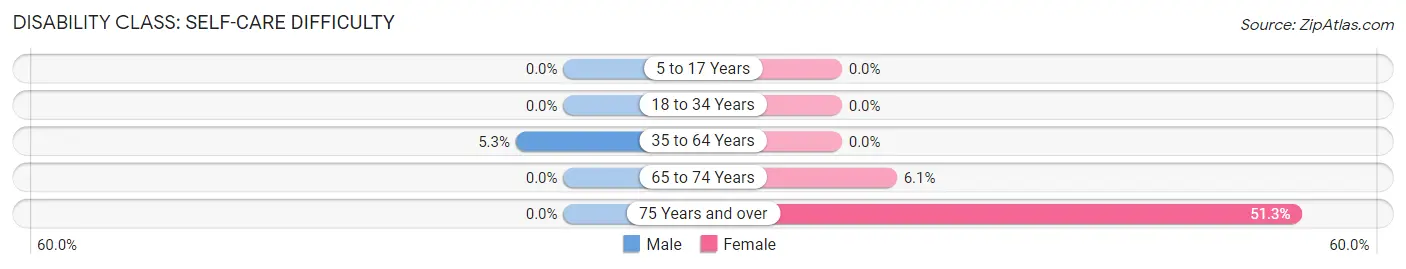
| Age Bracket | Male | Female |
| 5 to 17 Years | 0 (0.0%) | 0 (0.0%) |
| 18 to 34 Years | 0 (0.0%) | 0 (0.0%) |
| 35 to 64 Years | 8 (5.3%) | 0 (0.0%) |
| 65 to 74 Years | 0 (0.0%) | 3 (6.1%) |
| 75 Years and over | 0 (0.0%) | 20 (51.3%) |
Technology Access in Plumerville
Computing Device Access in Plumerville
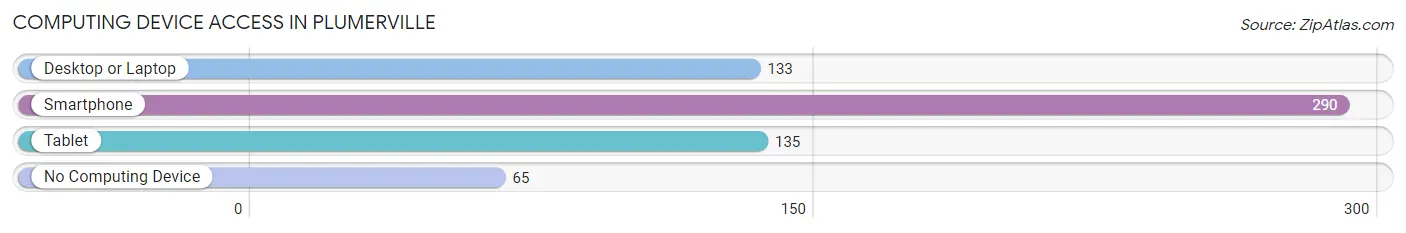
| Device Type | # Households | % Households |
| Desktop or Laptop | 133 | 35.0% |
| Smartphone | 290 | 76.3% |
| Tablet | 135 | 35.5% |
| No Computing Device | 65 | 17.1% |
| Total | 380 | 100.0% |
Internet Access in Plumerville
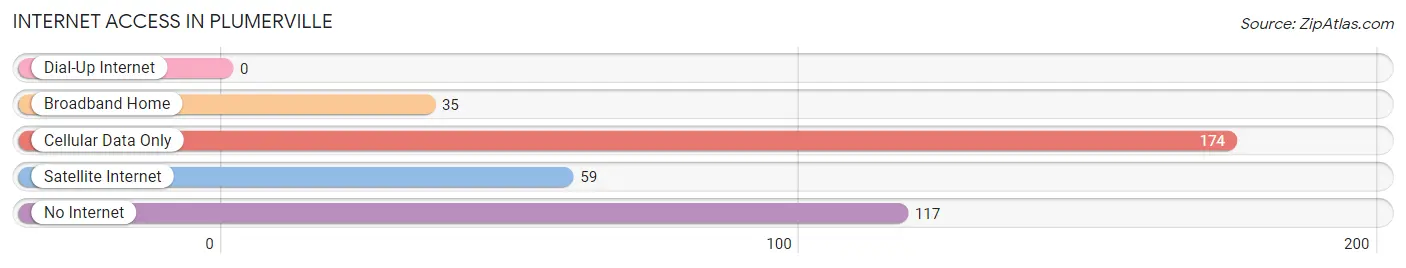
| Internet Type | # Households | % Households |
| Dial-Up Internet | 0 | 0.0% |
| Broadband Home | 35 | 9.2% |
| Cellular Data Only | 174 | 45.8% |
| Satellite Internet | 59 | 15.5% |
| No Internet | 117 | 30.8% |
| Total | 380 | 100.0% |
Plumerville Summary
Plumerville, Arkansas is a small town located in Conway County, Arkansas. It is situated on the banks of the Arkansas River, about 25 miles northwest of Little Rock. The town was founded in 1872 and has a population of approximately 1,000 people.
History
Plumerville was founded in 1872 by a group of settlers from the nearby town of Morrilton. The town was named after the plum trees that grew in the area. The first post office was established in 1873 and the first school was built in 1875.
The town grew slowly but steadily over the years, and by the early 1900s, it had become a thriving agricultural community. The town was home to several cotton gins, a sawmill, and a gristmill. The town also had a hotel, a bank, and several stores.
In the 1920s, the town began to decline as the railroad bypassed it and the population began to move away. The Great Depression further exacerbated the decline, and by the 1940s, the town had become a virtual ghost town.
In the 1950s, the town began to experience a resurgence as new businesses moved in and the population began to grow again. The town was incorporated in 1959 and has continued to grow since then.
Geography
Plumerville is located in the Arkansas River Valley, about 25 miles northwest of Little Rock. The town is situated on the banks of the Arkansas River and is surrounded by rolling hills and forests. The climate is humid subtropical, with hot summers and mild winters.
Economy
The economy of Plumerville is largely based on agriculture. The town is home to several farms that produce cotton, soybeans, corn, and other crops. The town also has several businesses, including a sawmill, a gristmill, and a cotton gin.
The town is also home to several small businesses, including restaurants, stores, and a hotel. The town also has a bank and a post office.
Demographics
As of the 2010 census, the population of Plumerville was 1,000. The racial makeup of the town was 97.2% White, 0.7% African American, 0.3% Native American, 0.2% Asian, and 1.6% from other races. The median household income was $31,250 and the median family income was $37,500.
Conclusion
Plumerville, Arkansas is a small town located in Conway County, Arkansas. It was founded in 1872 and has a population of approximately 1,000 people. The town is situated on the banks of the Arkansas River and is surrounded by rolling hills and forests. The economy of Plumerville is largely based on agriculture, and the town is home to several small businesses. The racial makeup of the town is 97.2% White, 0.7% African American, 0.3% Native American, 0.2% Asian, and 1.6% from other races. The median household income was $31,250 and the median family income was $37,500.
Common Questions
What is Per Capita Income in Plumerville?
Per Capita income in Plumerville is $22,714.
What is the Median Family Income in Plumerville?
Median Family Income in Plumerville is $61,250.
What is the Median Household income in Plumerville?
Median Household Income in Plumerville is $34,375.
What is Income or Wage Gap in Plumerville?
Income or Wage Gap in Plumerville is 32.1%.
Women in Plumerville earn 67.9 cents for every dollar earned by a man.
What is Inequality or Gini Index in Plumerville?
Inequality or Gini Index in Plumerville is 0.39.
What is the Total Population of Plumerville?
Total Population of Plumerville is 802.
What is the Total Male Population of Plumerville?
Total Male Population of Plumerville is 460.
What is the Total Female Population of Plumerville?
Total Female Population of Plumerville is 342.
What is the Ratio of Males per 100 Females in Plumerville?
There are 134.50 Males per 100 Females in Plumerville.
What is the Ratio of Females per 100 Males in Plumerville?
There are 74.35 Females per 100 Males in Plumerville.
What is the Median Population Age in Plumerville?
Median Population Age in Plumerville is 43.2 Years.
What is the Average Family Size in Plumerville
Average Family Size in Plumerville is 3.0 People.
What is the Average Household Size in Plumerville
Average Household Size in Plumerville is 2.1 People.
How Large is the Labor Force in Plumerville?
There are 374 People in the Labor Forcein in Plumerville.
What is the Percentage of People in the Labor Force in Plumerville?
54.4% of People are in the Labor Force in Plumerville.
What is the Unemployment Rate in Plumerville?
Unemployment Rate in Plumerville is 4.0%.