Fairfield Bay, AR Map & Demographics
Fairfield Bay Map
Fairfield Bay Overview
$43,530
PER CAPITA INCOME
$64,652
AVG FAMILY INCOME
$58,750
AVG HOUSEHOLD INCOME
35.2%
WAGE / INCOME GAP [ % ]
64.8¢/ $1
WAGE / INCOME GAP [ $ ]
0.40
INEQUALITY / GINI INDEX
2,291
TOTAL POPULATION
980
MALE POPULATION
1,311
FEMALE POPULATION
74.75
MALES / 100 FEMALES
133.78
FEMALES / 100 MALES
68.2
MEDIAN AGE
2.1
AVG FAMILY SIZE
1.6
AVG HOUSEHOLD SIZE
623
LABOR FORCE [ PEOPLE ]
28.5%
PERCENT IN LABOR FORCE
1.6%
UNEMPLOYMENT RATE
Fairfield Bay Zip Codes
Fairfield Bay Area Codes
Income in Fairfield Bay
Income Overview in Fairfield Bay
Per Capita Income in Fairfield Bay is $43,530, while median incomes of families and households are $64,652 and $58,750 respectively.
| Characteristic | Number | Measure |
| Per Capita Income | 2,291 | $43,530 |
| Median Family Income | 638 | $64,652 |
| Mean Family Income | 638 | $77,843 |
| Median Household Income | 1,462 | $58,750 |
| Mean Household Income | 1,462 | $67,622 |
| Income Deficit | 638 | $0 |
| Wage / Income Gap (%) | 2,291 | 35.20% |
| Wage / Income Gap ($) | 2,291 | 64.80¢ per $1 |
| Gini / Inequality Index | 2,291 | 0.40 |
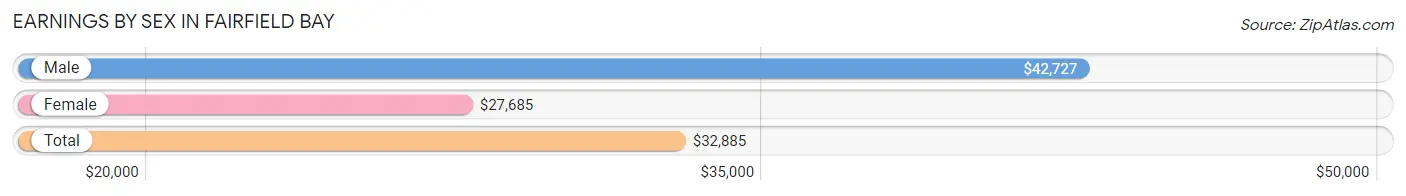
Earnings by Sex in Fairfield Bay
Average Earnings in Fairfield Bay are $32,885, $42,727 for men and $27,685 for women, a difference of 35.2%.
| Sex | Number | Average Earnings |
| Male | 382 (53.2%) | $42,727 |
| Female | 336 (46.8%) | $27,685 |
| Total | 718 (100.0%) | $32,885 |
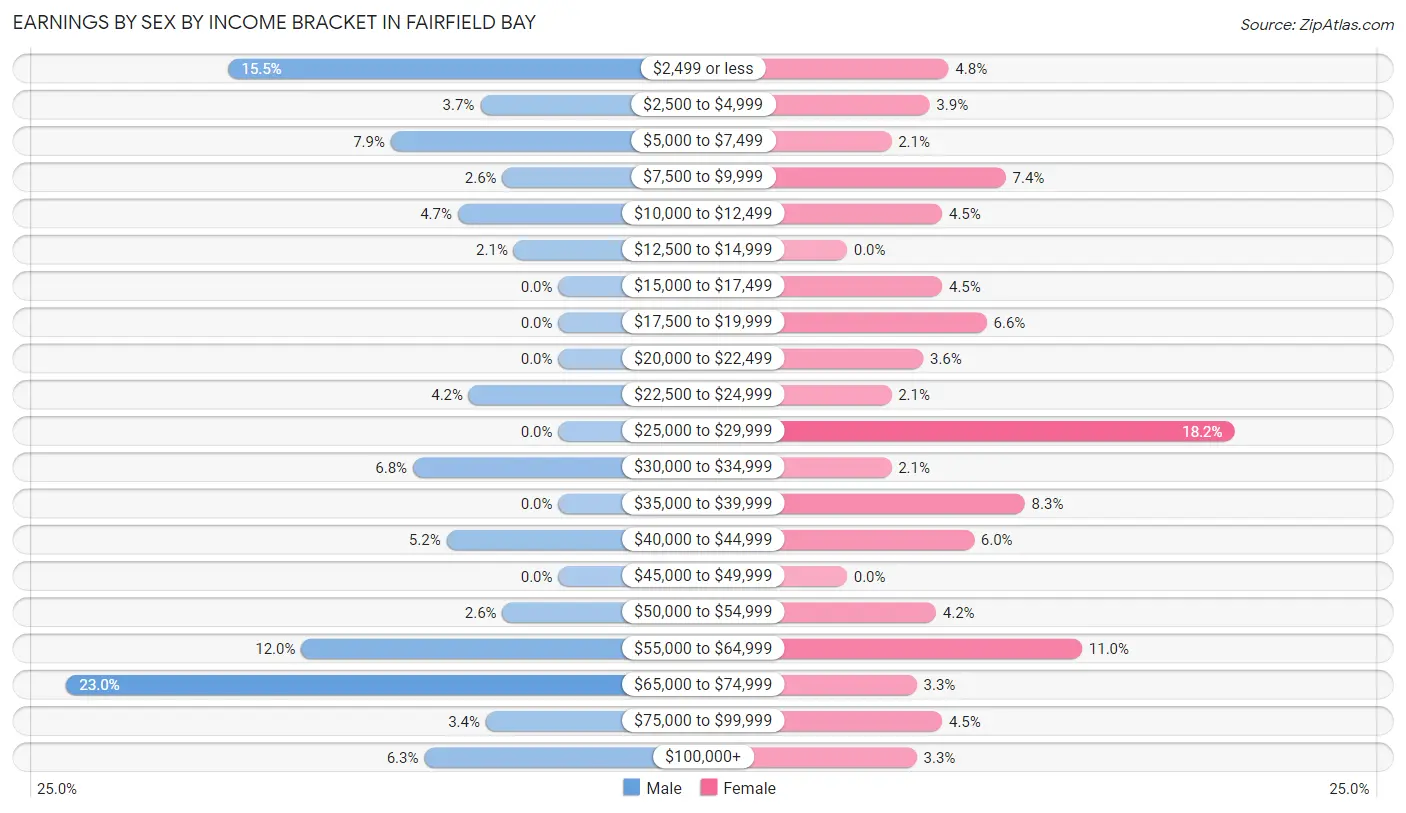
Earnings by Sex by Income Bracket in Fairfield Bay
The most common earnings brackets in Fairfield Bay are $65,000 to $74,999 for men (88 | 23.0%) and $25,000 to $29,999 for women (61 | 18.1%).
| Income | Male | Female |
| $2,499 or less | 59 (15.4%) | 16 (4.8%) |
| $2,500 to $4,999 | 14 (3.7%) | 13 (3.9%) |
| $5,000 to $7,499 | 30 (7.9%) | 7 (2.1%) |
| $7,500 to $9,999 | 10 (2.6%) | 25 (7.4%) |
| $10,000 to $12,499 | 18 (4.7%) | 15 (4.5%) |
| $12,500 to $14,999 | 8 (2.1%) | 0 (0.0%) |
| $15,000 to $17,499 | 0 (0.0%) | 15 (4.5%) |
| $17,500 to $19,999 | 0 (0.0%) | 22 (6.6%) |
| $20,000 to $22,499 | 0 (0.0%) | 12 (3.6%) |
| $22,500 to $24,999 | 16 (4.2%) | 7 (2.1%) |
| $25,000 to $29,999 | 0 (0.0%) | 61 (18.1%) |
| $30,000 to $34,999 | 26 (6.8%) | 7 (2.1%) |
| $35,000 to $39,999 | 0 (0.0%) | 28 (8.3%) |
| $40,000 to $44,999 | 20 (5.2%) | 20 (5.9%) |
| $45,000 to $49,999 | 0 (0.0%) | 0 (0.0%) |
| $50,000 to $54,999 | 10 (2.6%) | 14 (4.2%) |
| $55,000 to $64,999 | 46 (12.0%) | 37 (11.0%) |
| $65,000 to $74,999 | 88 (23.0%) | 11 (3.3%) |
| $75,000 to $99,999 | 13 (3.4%) | 15 (4.5%) |
| $100,000+ | 24 (6.3%) | 11 (3.3%) |
| Total | 382 (100.0%) | 336 (100.0%) |
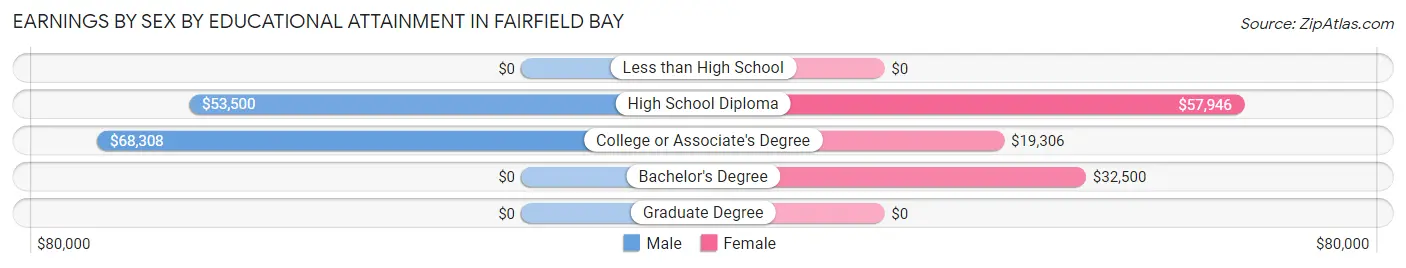
Earnings by Sex by Educational Attainment in Fairfield Bay
Average earnings in Fairfield Bay are $42,841 for men and $29,028 for women, a difference of 32.2%. Men with an educational attainment of college or associate's degree enjoy the highest average annual earnings of $68,308, while those with high school diploma education earn the least with $53,500. Women with an educational attainment of high school diploma earn the most with the average annual earnings of $57,946, while those with college or associate's degree education have the smallest earnings of $19,306.
| Educational Attainment | Male Income | Female Income |
| Less than High School | - | - |
| High School Diploma | $53,500 | $57,946 |
| College or Associate's Degree | $68,308 | $19,306 |
| Bachelor's Degree | - | - |
| Graduate Degree | - | - |
| Total | $42,841 | $29,028 |
Family Income in Fairfield Bay
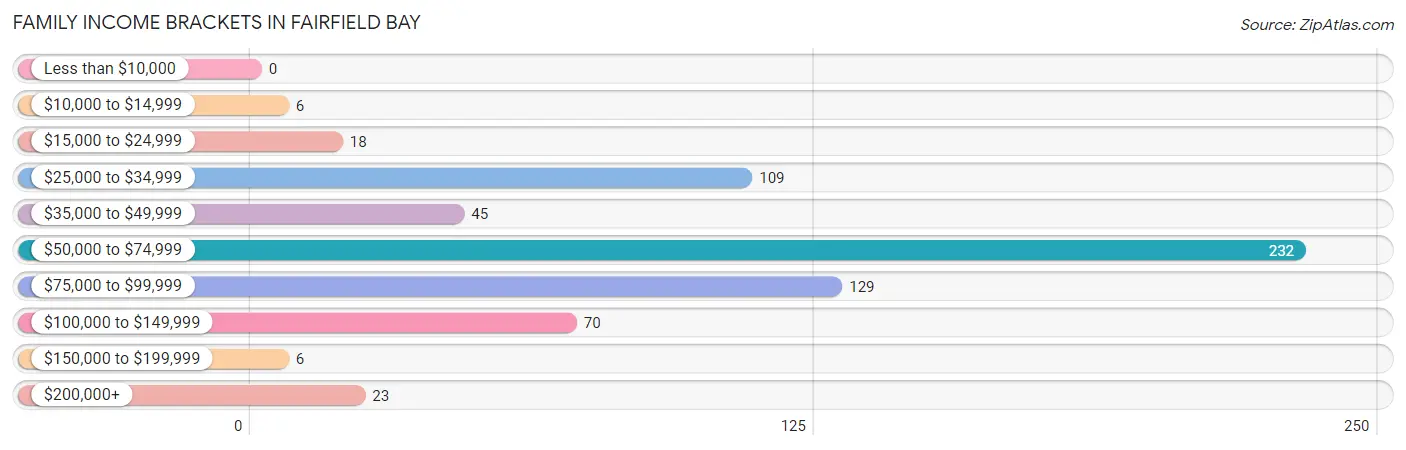
Family Income Brackets in Fairfield Bay
According to the Fairfield Bay family income data, there are 232 families falling into the $50,000 to $74,999 income range, which is the most common income bracket and makes up 36.4% of all families.
| Income Bracket | # Families | % Families |
| Less than $10,000 | 0 | 0.0% |
| $10,000 to $14,999 | 6 | 0.9% |
| $15,000 to $24,999 | 18 | 2.8% |
| $25,000 to $34,999 | 109 | 17.1% |
| $35,000 to $49,999 | 45 | 7.1% |
| $50,000 to $74,999 | 232 | 36.4% |
| $75,000 to $99,999 | 129 | 20.2% |
| $100,000 to $149,999 | 70 | 11.0% |
| $150,000 to $199,999 | 6 | 0.9% |
| $200,000+ | 23 | 3.6% |
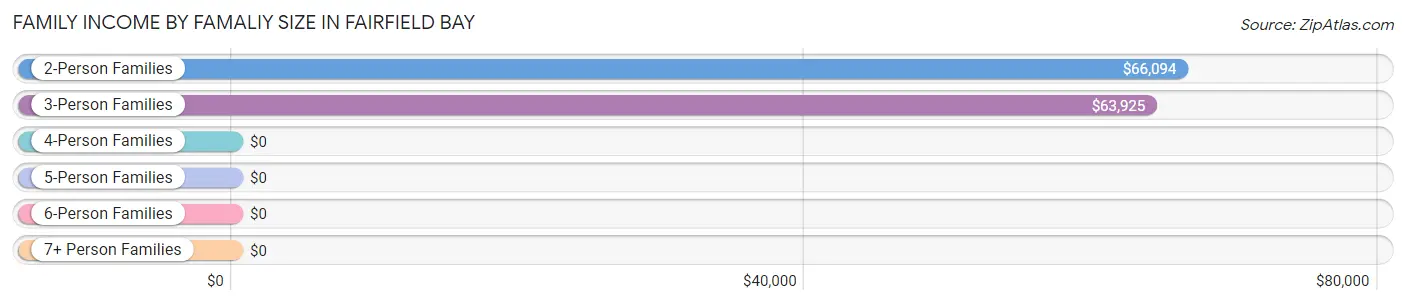
Family Income by Famaliy Size in Fairfield Bay
2-person families (541 | 84.8%) account for the highest median family income in Fairfield Bay with $66,094 per family, while 2-person families (541 | 84.8%) have the highest median income of $33,047 per family member.
| Income Bracket | # Families | Median Income |
| 2-Person Families | 541 (84.8%) | $66,094 |
| 3-Person Families | 87 (13.6%) | $63,925 |
| 4-Person Families | 0 (0.0%) | $0 |
| 5-Person Families | 10 (1.6%) | $0 |
| 6-Person Families | 0 (0.0%) | $0 |
| 7+ Person Families | 0 (0.0%) | $0 |
| Total | 638 (100.0%) | $64,652 |
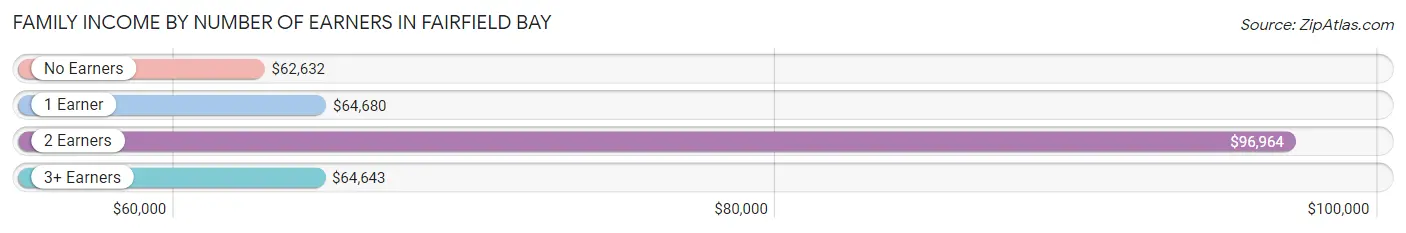
Family Income by Number of Earners in Fairfield Bay
The median family income in Fairfield Bay is $64,652, with families comprising 2 earners (73) having the highest median family income of $96,964, while families with no earners (308) have the lowest median family income of $62,632, accounting for 11.4% and 48.3% of families, respectively.
| Number of Earners | # Families | Median Income |
| No Earners | 308 (48.3%) | $62,632 |
| 1 Earner | 233 (36.5%) | $64,680 |
| 2 Earners | 73 (11.4%) | $96,964 |
| 3+ Earners | 24 (3.8%) | $64,643 |
| Total | 638 (100.0%) | $64,652 |
Household Income in Fairfield Bay
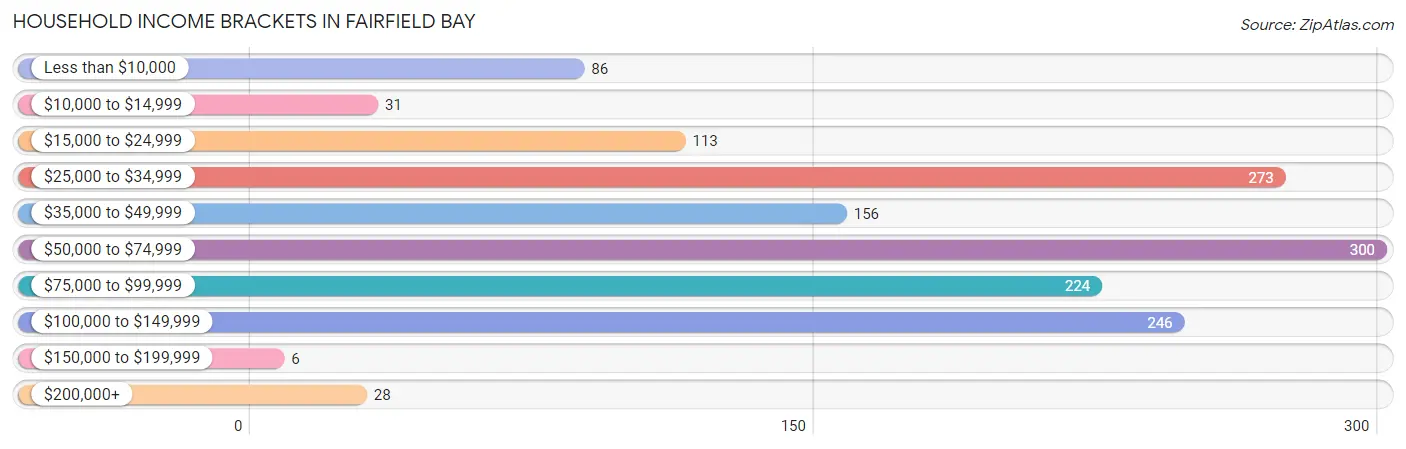
Household Income Brackets in Fairfield Bay
With 300 households falling in the category, the $50,000 to $74,999 income range is the most frequent in Fairfield Bay, accounting for 20.5% of all households. In contrast, only 6 households (0.4%) fall into the $150,000 to $199,999 income bracket, making it the least populous group.
| Income Bracket | # Households | % Households |
| Less than $10,000 | 86 | 5.9% |
| $10,000 to $14,999 | 31 | 2.1% |
| $15,000 to $24,999 | 113 | 7.7% |
| $25,000 to $34,999 | 273 | 18.7% |
| $35,000 to $49,999 | 156 | 10.7% |
| $50,000 to $74,999 | 300 | 20.5% |
| $75,000 to $99,999 | 224 | 15.3% |
| $100,000 to $149,999 | 246 | 16.8% |
| $150,000 to $199,999 | 6 | 0.4% |
| $200,000+ | 28 | 1.9% |
Household Income by Householder Age in Fairfield Bay
The median household income in Fairfield Bay is $58,750, with the highest median household income of $75,897 found in the 25 to 44 years age bracket for the primary householder. A total of 127 households (8.7%) fall into this category. Meanwhile, the 15 to 24 years age bracket for the primary householder has the lowest median household income of $0, with 21 households (1.4%) in this group.
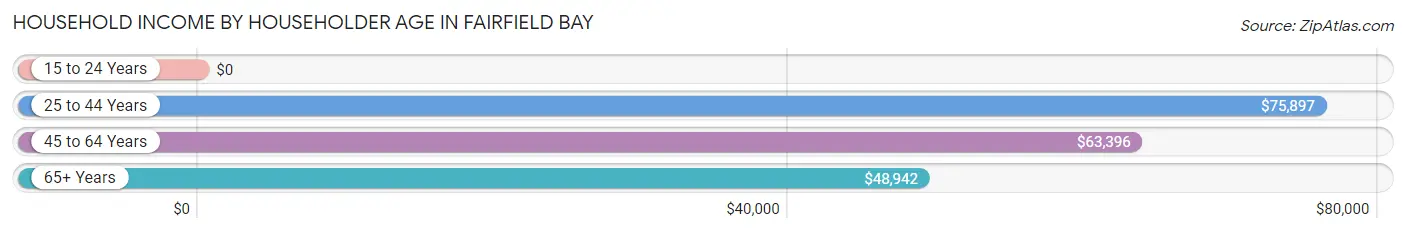
| Income Bracket | # Households | Median Income |
| 15 to 24 Years | 21 (1.4%) | $0 |
| 25 to 44 Years | 127 (8.7%) | $75,897 |
| 45 to 64 Years | 347 (23.7%) | $63,396 |
| 65+ Years | 967 (66.1%) | $48,942 |
| Total | 1,462 (100.0%) | $58,750 |
Poverty in Fairfield Bay
Income Below Poverty by Sex and Age in Fairfield Bay
With 9.8% poverty level for males and 7.4% for females among the residents of Fairfield Bay, 25 to 34 year old males and 18 to 24 year old females are the most vulnerable to poverty, with 30 males (33.3%) and 17 females (58.6%) in their respective age groups living below the poverty level.
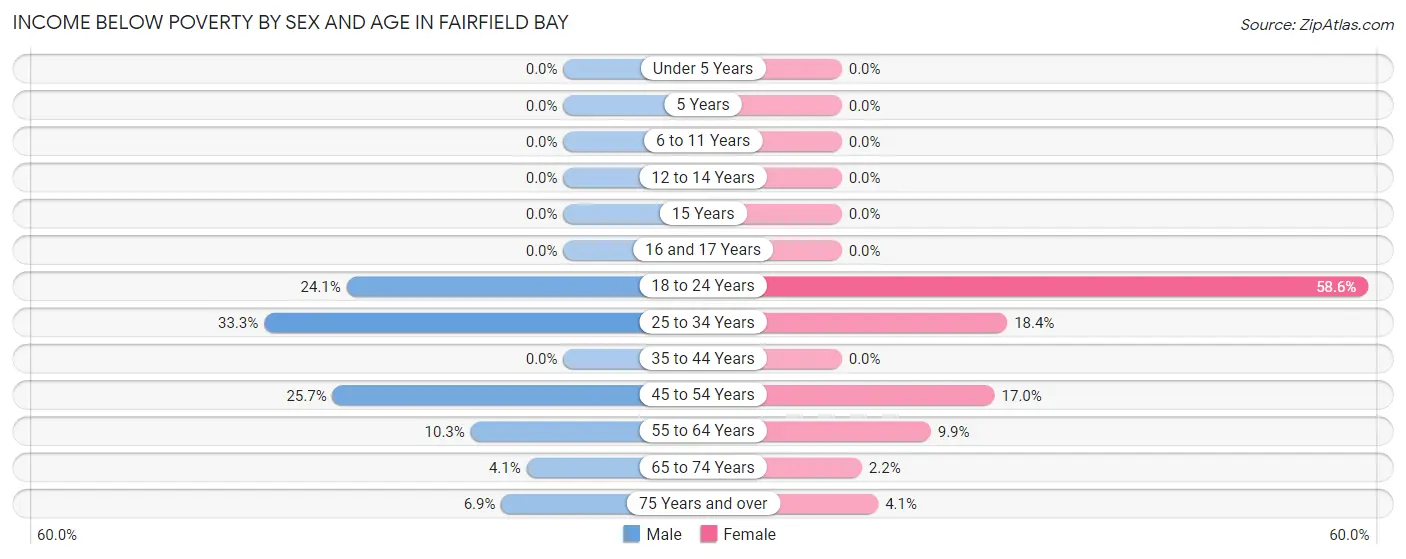
| Age Bracket | Male | Female |
| Under 5 Years | 0 (0.0%) | 0 (0.0%) |
| 5 Years | 0 (0.0%) | 0 (0.0%) |
| 6 to 11 Years | 0 (0.0%) | 0 (0.0%) |
| 12 to 14 Years | 0 (0.0%) | 0 (0.0%) |
| 15 Years | 0 (0.0%) | 0 (0.0%) |
| 16 and 17 Years | 0 (0.0%) | 0 (0.0%) |
| 18 to 24 Years | 7 (24.1%) | 17 (58.6%) |
| 25 to 34 Years | 30 (33.3%) | 14 (18.4%) |
| 35 to 44 Years | 0 (0.0%) | 0 (0.0%) |
| 45 to 54 Years | 9 (25.7%) | 16 (17.0%) |
| 55 to 64 Years | 22 (10.3%) | 23 (9.9%) |
| 65 to 74 Years | 12 (4.1%) | 6 (2.2%) |
| 75 Years and over | 15 (6.9%) | 20 (4.1%) |
| Total | 95 (9.8%) | 96 (7.4%) |
Income Above Poverty by Sex and Age in Fairfield Bay
According to the poverty statistics in Fairfield Bay, males aged under 5 years and females aged under 5 years are the age groups that are most secure financially, with 100.0% of males and 100.0% of females in these age groups living above the poverty line.
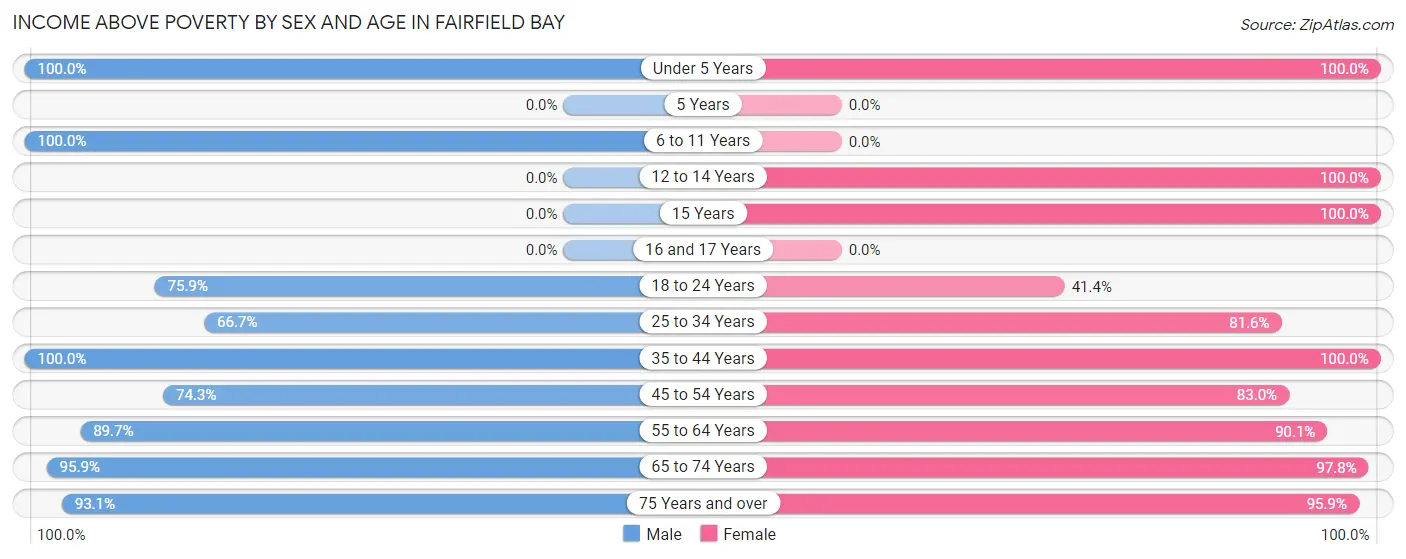
| Age Bracket | Male | Female |
| Under 5 Years | 14 (100.0%) | 16 (100.0%) |
| 5 Years | 0 (0.0%) | 0 (0.0%) |
| 6 to 11 Years | 13 (100.0%) | 0 (0.0%) |
| 12 to 14 Years | 0 (0.0%) | 10 (100.0%) |
| 15 Years | 0 (0.0%) | 52 (100.0%) |
| 16 and 17 Years | 0 (0.0%) | 0 (0.0%) |
| 18 to 24 Years | 22 (75.9%) | 12 (41.4%) |
| 25 to 34 Years | 60 (66.7%) | 62 (81.6%) |
| 35 to 44 Years | 64 (100.0%) | 21 (100.0%) |
| 45 to 54 Years | 26 (74.3%) | 78 (83.0%) |
| 55 to 64 Years | 191 (89.7%) | 209 (90.1%) |
| 65 to 74 Years | 281 (95.9%) | 262 (97.8%) |
| 75 Years and over | 202 (93.1%) | 473 (95.9%) |
| Total | 873 (90.2%) | 1,195 (92.6%) |
Income Below Poverty Among Married-Couple Families in Fairfield Bay
The poverty statistics for married-couple families in Fairfield Bay show that 2.1% or 11 of the total 525 families live below the poverty line. Families with no children have the highest poverty rate of 2.4%, comprising of 11 families. On the other hand, families with 1 or 2 children have the lowest poverty rate of 0.0%, which includes 0 families.
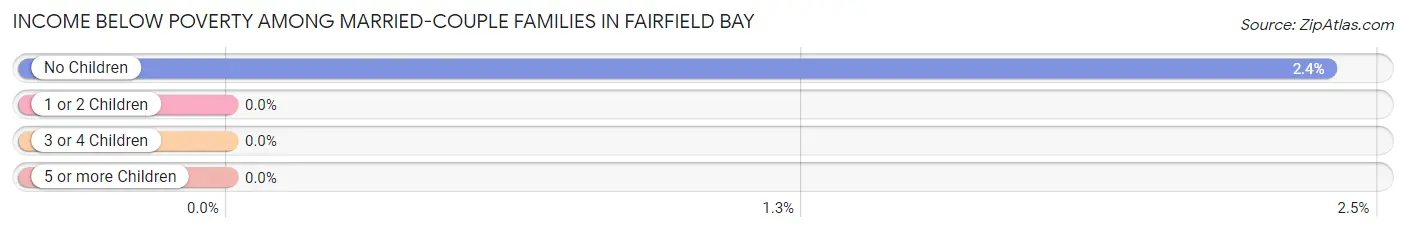
| Children | Above Poverty | Below Poverty |
| No Children | 449 (97.6%) | 11 (2.4%) |
| 1 or 2 Children | 65 (100.0%) | 0 (0.0%) |
| 3 or 4 Children | 0 (0.0%) | 0 (0.0%) |
| 5 or more Children | 0 (0.0%) | 0 (0.0%) |
| Total | 514 (97.9%) | 11 (2.1%) |
Income Below Poverty Among Single-Parent Households in Fairfield Bay
| Children | Single Father | Single Mother |
| No Children | 0 (0.0%) | 0 (0.0%) |
| 1 or 2 Children | 0 (0.0%) | 0 (0.0%) |
| 3 or 4 Children | 0 (0.0%) | 0 (0.0%) |
| 5 or more Children | 0 (0.0%) | 0 (0.0%) |
| Total | 0 (0.0%) | 0 (0.0%) |
Income Below Poverty Among Married-Couple vs Single-Parent Households in Fairfield Bay
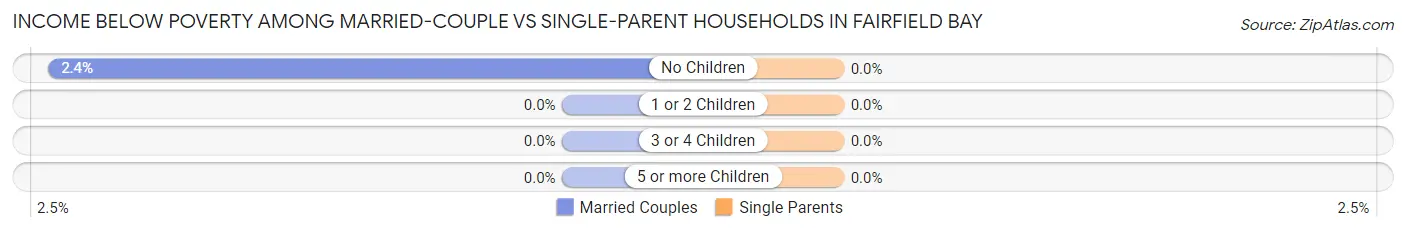
| Children | Married-Couple Families | Single-Parent Households |
| No Children | 11 (2.4%) | 0 (0.0%) |
| 1 or 2 Children | 0 (0.0%) | 0 (0.0%) |
| 3 or 4 Children | 0 (0.0%) | 0 (0.0%) |
| 5 or more Children | 0 (0.0%) | 0 (0.0%) |
| Total | 11 (2.1%) | 0 (0.0%) |
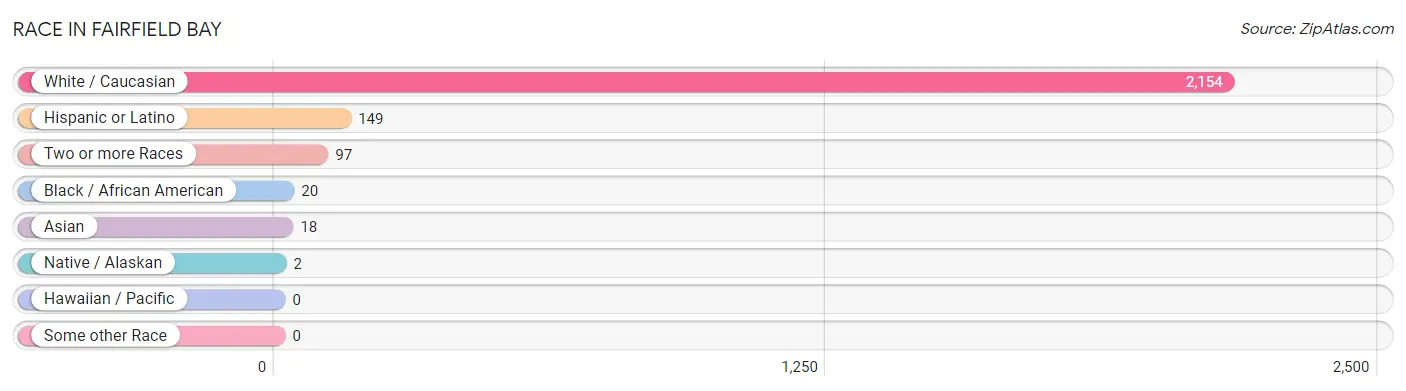
Race in Fairfield Bay
The most populous races in Fairfield Bay are White / Caucasian (2,154 | 94.0%), Hispanic or Latino (149 | 6.5%), and Two or more Races (97 | 4.2%).
| Race | # Population | % Population |
| Asian | 18 | 0.8% |
| Black / African American | 20 | 0.9% |
| Hawaiian / Pacific | 0 | 0.0% |
| Hispanic or Latino | 149 | 6.5% |
| Native / Alaskan | 2 | 0.1% |
| White / Caucasian | 2,154 | 94.0% |
| Two or more Races | 97 | 4.2% |
| Some other Race | 0 | 0.0% |
| Total | 2,291 | 100.0% |
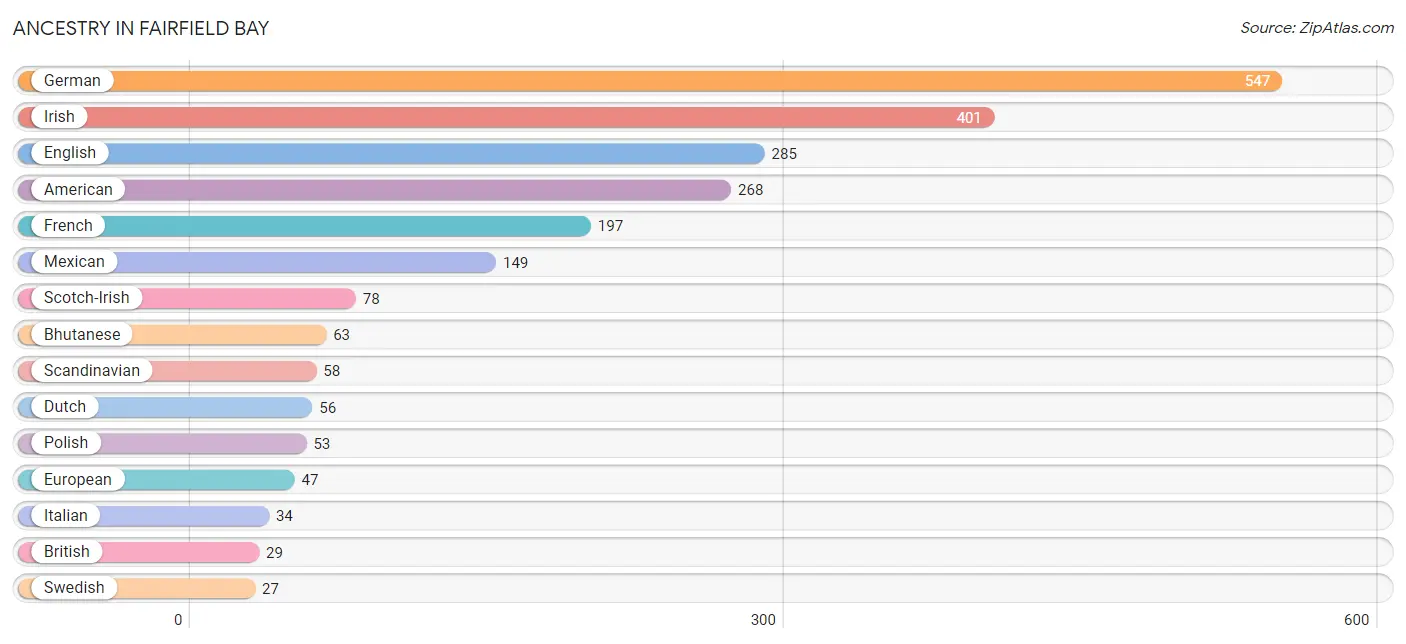
Ancestry in Fairfield Bay
The most populous ancestries reported in Fairfield Bay are German (547 | 23.9%), Irish (401 | 17.5%), English (285 | 12.4%), American (268 | 11.7%), and French (197 | 8.6%), together accounting for 74.1% of all Fairfield Bay residents.
| Ancestry | # Population | % Population |
| American | 268 | 11.7% |
| Austrian | 11 | 0.5% |
| Bhutanese | 63 | 2.8% |
| British | 29 | 1.3% |
| Cherokee | 20 | 0.9% |
| Czech | 14 | 0.6% |
| Danish | 7 | 0.3% |
| Dutch | 56 | 2.4% |
| English | 285 | 12.4% |
| European | 47 | 2.1% |
| Finnish | 25 | 1.1% |
| French | 197 | 8.6% |
| French Canadian | 9 | 0.4% |
| German | 547 | 23.9% |
| Hungarian | 18 | 0.8% |
| Irish | 401 | 17.5% |
| Italian | 34 | 1.5% |
| Korean | 7 | 0.3% |
| Mexican | 149 | 6.5% |
| Norwegian | 6 | 0.3% |
| Polish | 53 | 2.3% |
| Scandinavian | 58 | 2.5% |
| Scotch-Irish | 78 | 3.4% |
| Scottish | 26 | 1.1% |
| Swedish | 27 | 1.2% |
| Swiss | 11 | 0.5% | View All 26 Rows |
Immigrants in Fairfield Bay
The most numerous immigrant groups reported in Fairfield Bay came from Europe (19 | 0.8%), Asia (18 | 0.8%), Eastern Asia (11 | 0.5%), Japan (11 | 0.5%), and Argentina (8 | 0.4%), together accounting for 2.9% of all Fairfield Bay residents.
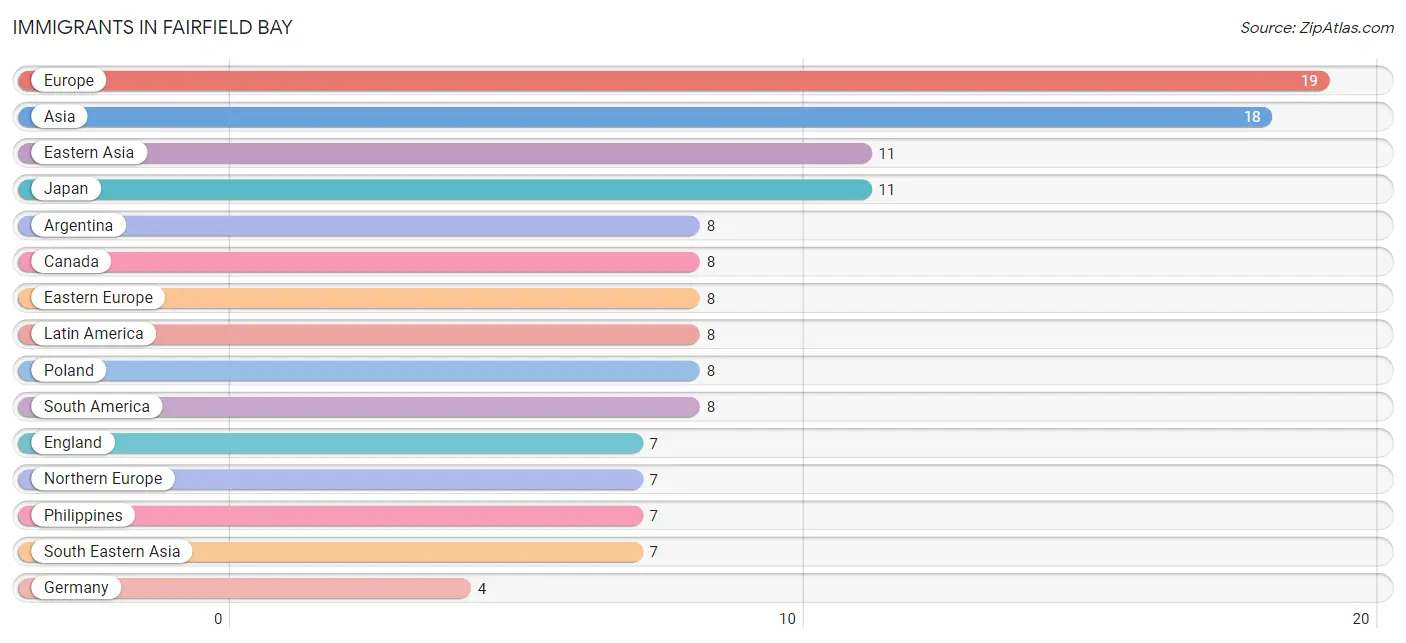
| Immigration Origin | # Population | % Population |
| Argentina | 8 | 0.4% |
| Asia | 18 | 0.8% |
| Canada | 8 | 0.4% |
| Eastern Asia | 11 | 0.5% |
| Eastern Europe | 8 | 0.4% |
| England | 7 | 0.3% |
| Europe | 19 | 0.8% |
| Germany | 4 | 0.2% |
| Japan | 11 | 0.5% |
| Latin America | 8 | 0.4% |
| Northern Europe | 7 | 0.3% |
| Philippines | 7 | 0.3% |
| Poland | 8 | 0.4% |
| South America | 8 | 0.4% |
| South Eastern Asia | 7 | 0.3% |
| Western Europe | 4 | 0.2% | View All 16 Rows |
Sex and Age in Fairfield Bay
Sex and Age in Fairfield Bay
The most populous age groups in Fairfield Bay are 60 to 64 Years (159 | 16.2%) for men and 80 to 84 Years (237 | 18.1%) for women.
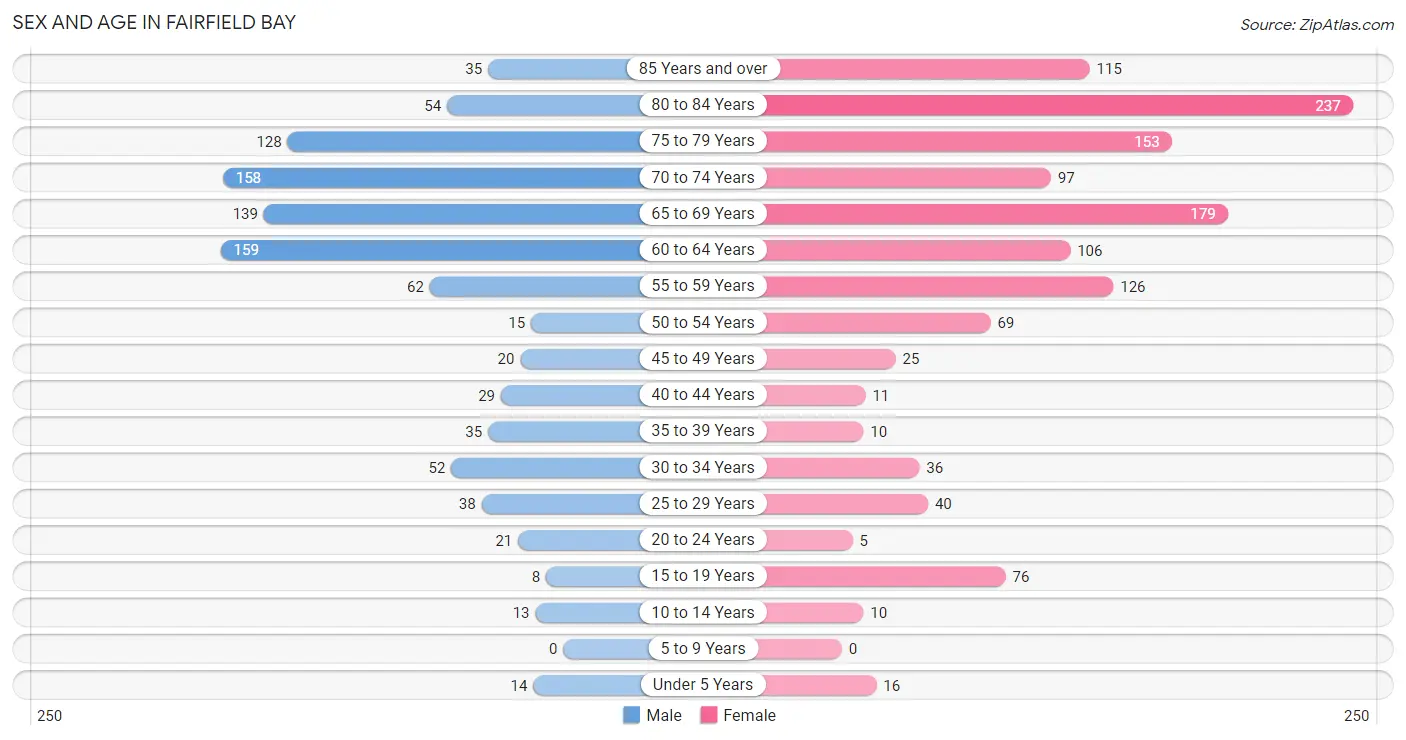
| Age Bracket | Male | Female |
| Under 5 Years | 14 (1.4%) | 16 (1.2%) |
| 5 to 9 Years | 0 (0.0%) | 0 (0.0%) |
| 10 to 14 Years | 13 (1.3%) | 10 (0.8%) |
| 15 to 19 Years | 8 (0.8%) | 76 (5.8%) |
| 20 to 24 Years | 21 (2.1%) | 5 (0.4%) |
| 25 to 29 Years | 38 (3.9%) | 40 (3.0%) |
| 30 to 34 Years | 52 (5.3%) | 36 (2.8%) |
| 35 to 39 Years | 35 (3.6%) | 10 (0.8%) |
| 40 to 44 Years | 29 (3.0%) | 11 (0.8%) |
| 45 to 49 Years | 20 (2.0%) | 25 (1.9%) |
| 50 to 54 Years | 15 (1.5%) | 69 (5.3%) |
| 55 to 59 Years | 62 (6.3%) | 126 (9.6%) |
| 60 to 64 Years | 159 (16.2%) | 106 (8.1%) |
| 65 to 69 Years | 139 (14.2%) | 179 (13.7%) |
| 70 to 74 Years | 158 (16.1%) | 97 (7.4%) |
| 75 to 79 Years | 128 (13.1%) | 153 (11.7%) |
| 80 to 84 Years | 54 (5.5%) | 237 (18.1%) |
| 85 Years and over | 35 (3.6%) | 115 (8.8%) |
| Total | 980 (100.0%) | 1,311 (100.0%) |
Families and Households in Fairfield Bay
Median Family Size in Fairfield Bay
The median family size in Fairfield Bay is 2.13 persons per family, with married-couple families (525 | 82.3%) accounting for the largest median family size of 2.16 persons per family. On the other hand, single male/father families (26 | 4.1%) represent the smallest median family size with 1.96 persons per family.
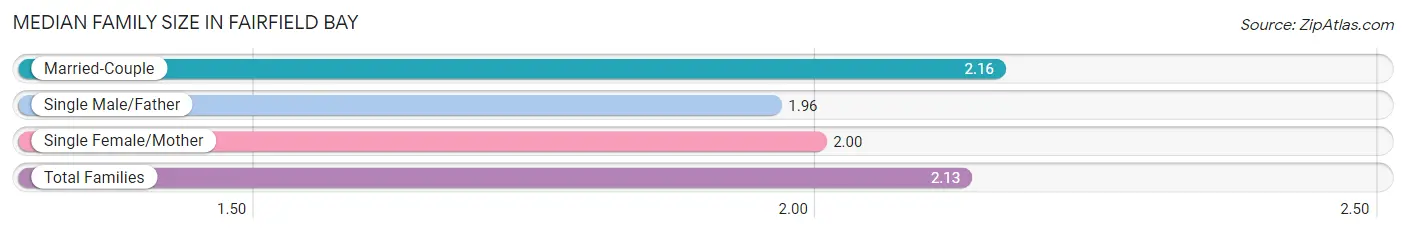
| Family Type | # Families | Family Size |
| Married-Couple | 525 (82.3%) | 2.16 |
| Single Male/Father | 26 (4.1%) | 1.96 |
| Single Female/Mother | 87 (13.6%) | 2.00 |
| Total Families | 638 (100.0%) | 2.13 |
Median Household Size in Fairfield Bay
The median household size in Fairfield Bay is 1.55 persons per household, with single male/father households (26 | 1.8%) accounting for the largest median household size of 2.88 persons per household. non-family households (824 | 56.4%) represent the smallest median household size with 1.06 persons per household.
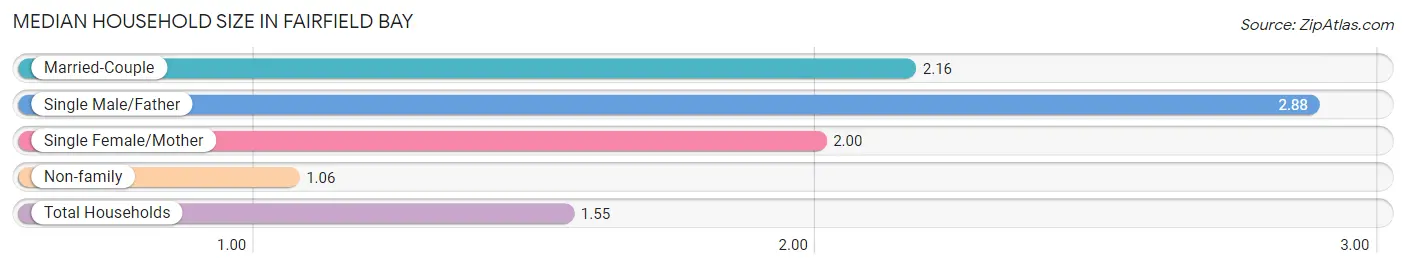
| Household Type | # Households | Household Size |
| Married-Couple | 525 (35.9%) | 2.16 |
| Single Male/Father | 26 (1.8%) | 2.88 |
| Single Female/Mother | 87 (5.9%) | 2.00 |
| Non-family | 824 (56.4%) | 1.06 |
| Total Households | 1,462 (100.0%) | 1.55 |
Household Size by Marriage Status in Fairfield Bay
Out of a total of 1,462 households in Fairfield Bay, 638 (43.6%) are family households, while 824 (56.4%) are nonfamily households. The most numerous type of family households are 2-person households, comprising 515, and the most common type of nonfamily households are 1-person households, comprising 749.
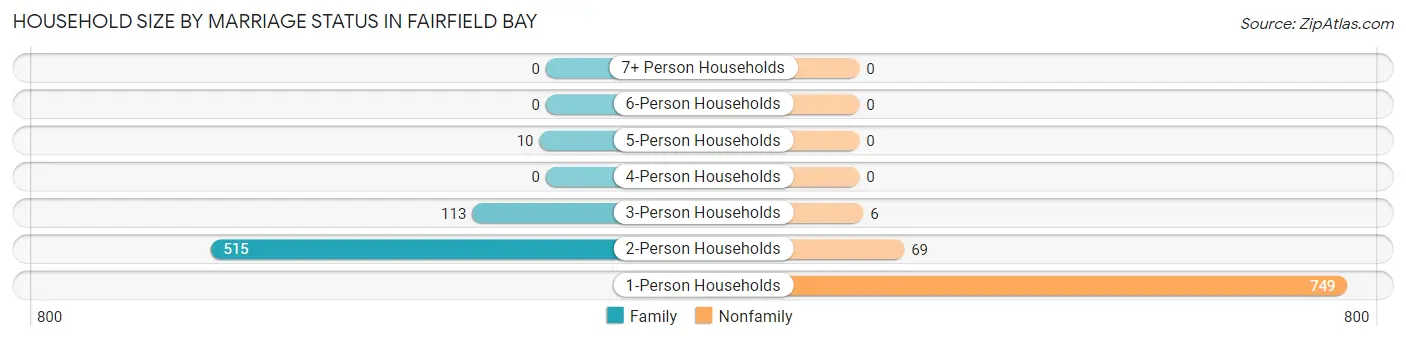
| Household Size | Family Households | Nonfamily Households |
| 1-Person Households | - | 749 (51.2%) |
| 2-Person Households | 515 (35.2%) | 69 (4.7%) |
| 3-Person Households | 113 (7.7%) | 6 (0.4%) |
| 4-Person Households | 0 (0.0%) | 0 (0.0%) |
| 5-Person Households | 10 (0.7%) | 0 (0.0%) |
| 6-Person Households | 0 (0.0%) | 0 (0.0%) |
| 7+ Person Households | 0 (0.0%) | 0 (0.0%) |
| Total | 638 (43.6%) | 824 (56.4%) |
Female Fertility in Fairfield Bay
Fertility by Age in Fairfield Bay
| Age Bracket | Women with Births | Births / 1,000 Women |
| 15 to 19 years | 0 (0.0%) | 0.0 |
| 20 to 34 years | 0 (0.0%) | 0.0 |
| 35 to 50 years | 0 (0.0%) | 0.0 |
| Total | 0 (0.0%) | 0.0 |
Fertility by Age by Marriage Status in Fairfield Bay
| Age Bracket | Married | Unmarried |
| 15 to 19 years | 0 (0.0%) | 0 (0.0%) |
| 20 to 34 years | 0 (0.0%) | 0 (0.0%) |
| 35 to 50 years | 0 (0.0%) | 0 (0.0%) |
| Total | 0 (0.0%) | 0 (0.0%) |
Fertility by Education in Fairfield Bay
| Educational Attainment | Women with Births | Births / 1,000 Women |
| Less than High School | 0 (0.0%) | 0.0 |
| High School Diploma | 0 (0.0%) | 0.0 |
| College or Associate's Degree | 0 (0.0%) | 0.0 |
| Bachelor's Degree | 0 (0.0%) | 0.0 |
| Graduate Degree | 0 (0.0%) | 0.0 |
| Total | 0 (0.0%) | 0.0 |
Fertility by Education by Marriage Status in Fairfield Bay
| Educational Attainment | Married | Unmarried |
| Less than High School | 0 (0.0%) | 0 (0.0%) |
| High School Diploma | 0 (0.0%) | 0 (0.0%) |
| College or Associate's Degree | 0 (0.0%) | 0 (0.0%) |
| Bachelor's Degree | 0 (0.0%) | 0 (0.0%) |
| Graduate Degree | 0 (0.0%) | 0 (0.0%) |
| Total | 0 (0.0%) | 0 (0.0%) |
Employment Characteristics in Fairfield Bay
Employment by Class of Employer in Fairfield Bay
Among the 614 employed individuals in Fairfield Bay, private company employees (345 | 56.2%), self-employed (not incorporated) (73 | 11.9%), and not-for-profit organizations (72 | 11.7%) make up the most common classes of employment.
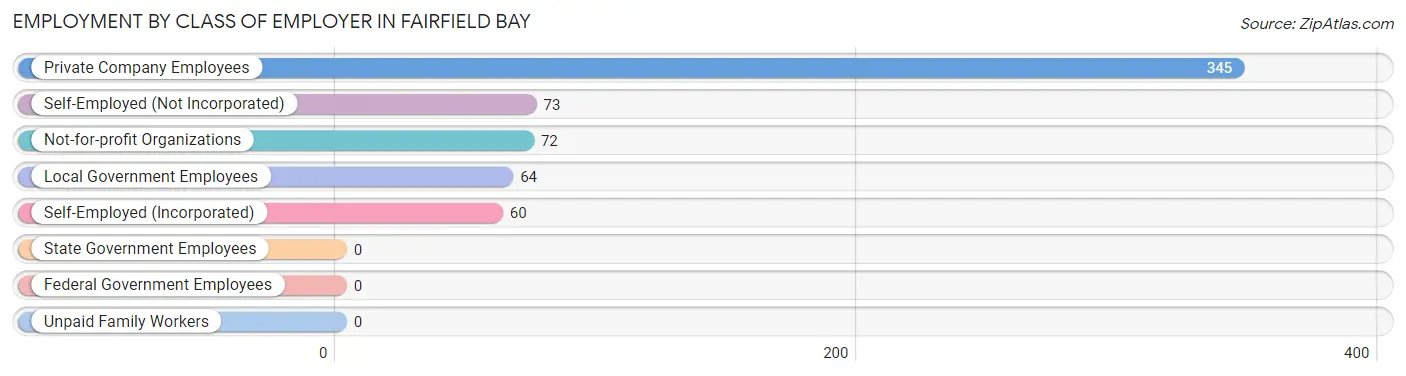
| Employer Class | # Employees | % Employees |
| Private Company Employees | 345 | 56.2% |
| Self-Employed (Incorporated) | 60 | 9.8% |
| Self-Employed (Not Incorporated) | 73 | 11.9% |
| Not-for-profit Organizations | 72 | 11.7% |
| Local Government Employees | 64 | 10.4% |
| State Government Employees | 0 | 0.0% |
| Federal Government Employees | 0 | 0.0% |
| Unpaid Family Workers | 0 | 0.0% |
| Total | 614 | 100.0% |
Employment Status by Age in Fairfield Bay
According to the labor force statistics for Fairfield Bay, out of the total population over 16 years of age (2,186), 28.5% or 623 individuals are in the labor force, with 1.6% or 10 of them unemployed. The age group with the highest labor force participation rate is 16 to 19 years, with 100.0% or 32 individuals in the labor force. Within the labor force, the 30 to 34 years age range has the highest percentage of unemployed individuals, with 5.4% or 4 of them being unemployed.
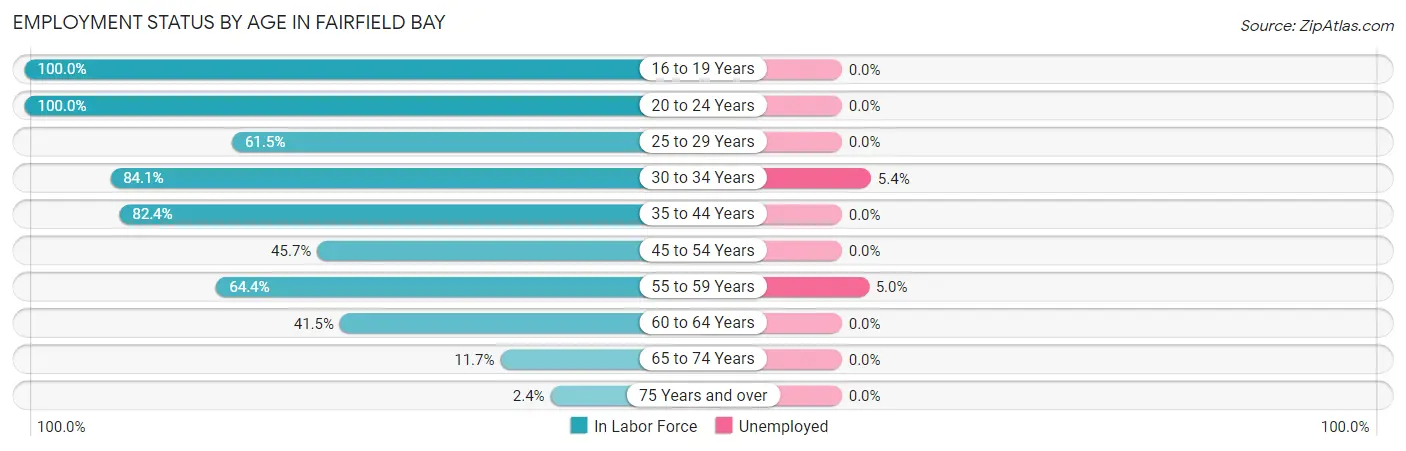
| Age Bracket | In Labor Force | Unemployed |
| 16 to 19 Years | 32 (100.0%) | 0 (0.0%) |
| 20 to 24 Years | 26 (100.0%) | 0 (0.0%) |
| 25 to 29 Years | 48 (61.5%) | 0 (0.0%) |
| 30 to 34 Years | 74 (84.1%) | 4 (5.4%) |
| 35 to 44 Years | 70 (82.4%) | 0 (0.0%) |
| 45 to 54 Years | 59 (45.7%) | 0 (0.0%) |
| 55 to 59 Years | 121 (64.4%) | 6 (5.0%) |
| 60 to 64 Years | 110 (41.5%) | 0 (0.0%) |
| 65 to 74 Years | 67 (11.7%) | 0 (0.0%) |
| 75 Years and over | 17 (2.4%) | 0 (0.0%) |
| Total | 623 (28.5%) | 10 (1.6%) |
Employment Status by Educational Attainment in Fairfield Bay
According to labor force statistics for Fairfield Bay, 57.9% of individuals (482) out of the total population between 25 and 64 years of age (833) are in the labor force, with 2.1% or 10 of them being unemployed. The group with the highest labor force participation rate are those with the educational attainment of less than high school, with 84.9% or 62 individuals in the labor force. Within the labor force, individuals with high school diploma education have the highest percentage of unemployment, with 6.7% or 10 of them being unemployed.
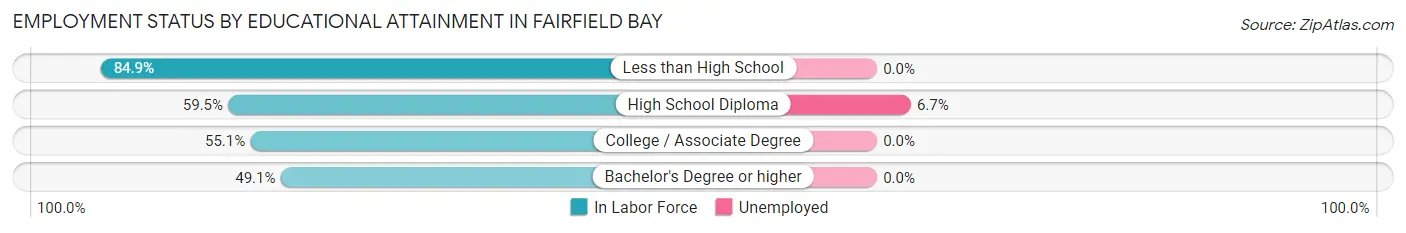
| Educational Attainment | In Labor Force | Unemployed |
| Less than High School | 62 (84.9%) | 0 (0.0%) |
| High School Diploma | 150 (59.5%) | 17 (6.7%) |
| College / Associate Degree | 190 (55.1%) | 0 (0.0%) |
| Bachelor's Degree or higher | 80 (49.1%) | 0 (0.0%) |
| Total | 482 (57.9%) | 17 (2.1%) |
Employment Occupations by Sex in Fairfield Bay
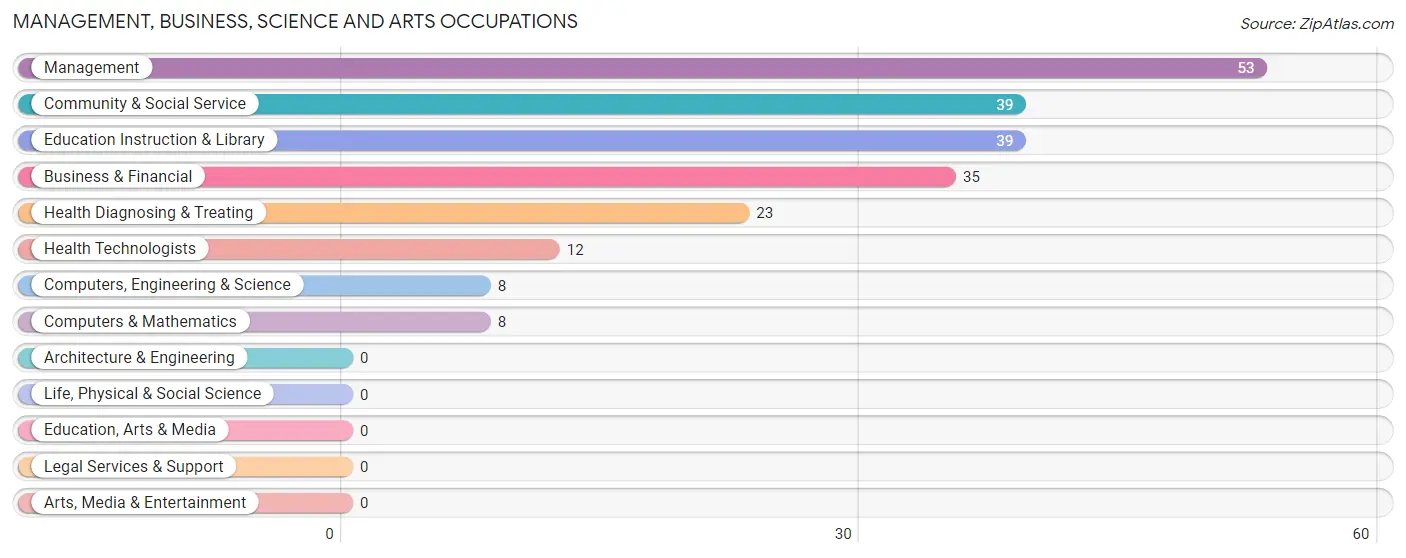
Management, Business, Science and Arts Occupations
The most common Management, Business, Science and Arts occupations in Fairfield Bay are Management (53 | 8.6%), Community & Social Service (39 | 6.4%), Education Instruction & Library (39 | 6.4%), Business & Financial (35 | 5.7%), and Health Diagnosing & Treating (23 | 3.7%).
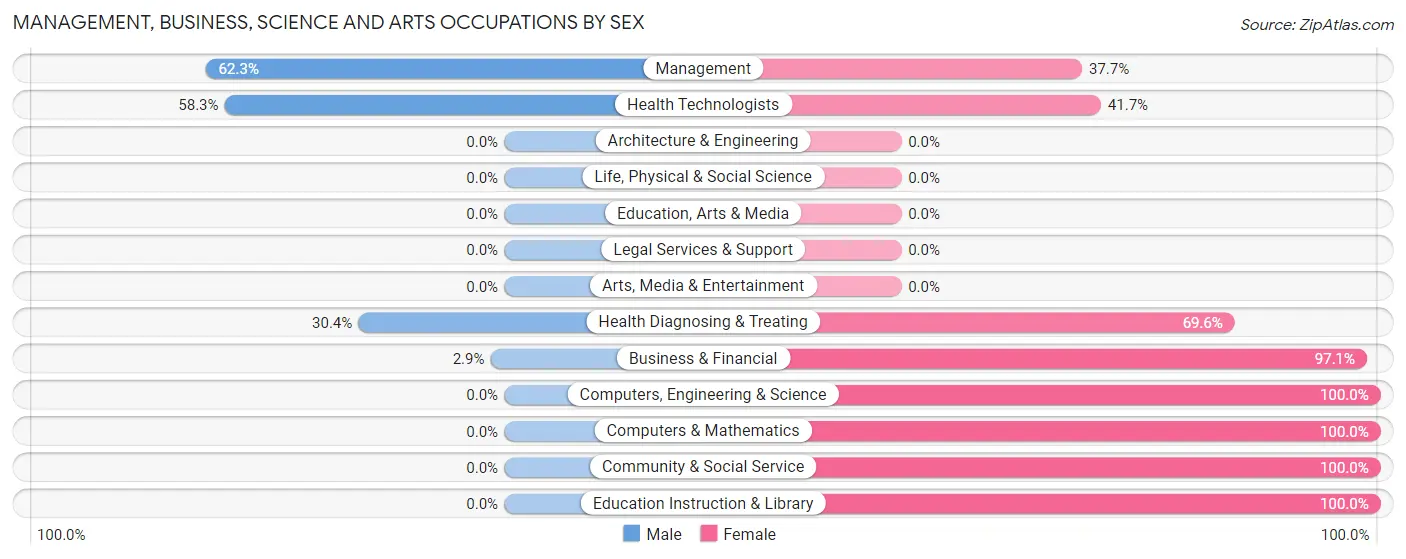
Management, Business, Science and Arts Occupations by Sex
Within the Management, Business, Science and Arts occupations in Fairfield Bay, the most male-oriented occupations are Management (62.3%), Health Technologists (58.3%), and Health Diagnosing & Treating (30.4%), while the most female-oriented occupations are Computers, Engineering & Science (100.0%), Computers & Mathematics (100.0%), and Community & Social Service (100.0%).
| Occupation | Male | Female |
| Management | 33 (62.3%) | 20 (37.7%) |
| Business & Financial | 1 (2.9%) | 34 (97.1%) |
| Computers, Engineering & Science | 0 (0.0%) | 8 (100.0%) |
| Computers & Mathematics | 0 (0.0%) | 8 (100.0%) |
| Architecture & Engineering | 0 (0.0%) | 0 (0.0%) |
| Life, Physical & Social Science | 0 (0.0%) | 0 (0.0%) |
| Community & Social Service | 0 (0.0%) | 39 (100.0%) |
| Education, Arts & Media | 0 (0.0%) | 0 (0.0%) |
| Legal Services & Support | 0 (0.0%) | 0 (0.0%) |
| Education Instruction & Library | 0 (0.0%) | 39 (100.0%) |
| Arts, Media & Entertainment | 0 (0.0%) | 0 (0.0%) |
| Health Diagnosing & Treating | 7 (30.4%) | 16 (69.6%) |
| Health Technologists | 7 (58.3%) | 5 (41.7%) |
| Total (Category) | 41 (26.0%) | 117 (74.1%) |
| Total (Overall) | 324 (52.8%) | 290 (47.2%) |
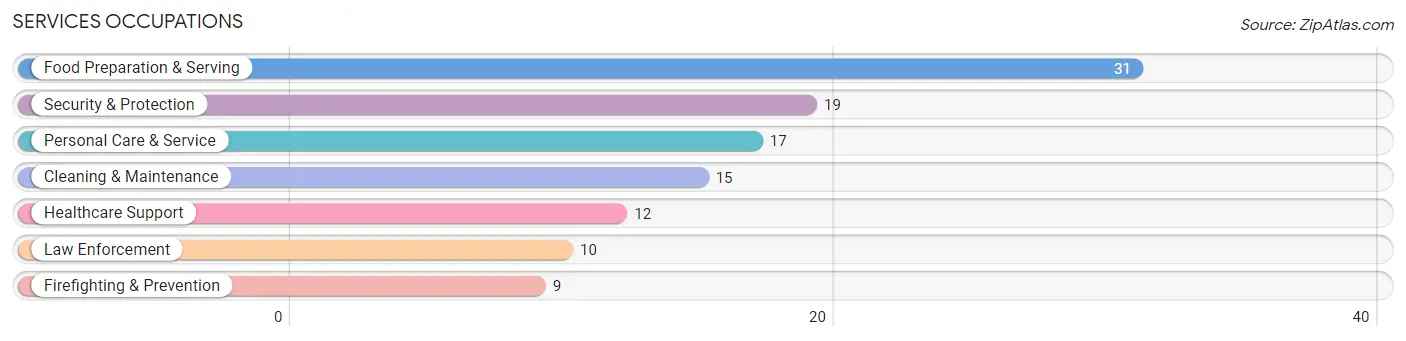
Services Occupations
The most common Services occupations in Fairfield Bay are Food Preparation & Serving (31 | 5.1%), Security & Protection (19 | 3.1%), Personal Care & Service (17 | 2.8%), Cleaning & Maintenance (15 | 2.4%), and Healthcare Support (12 | 1.9%).
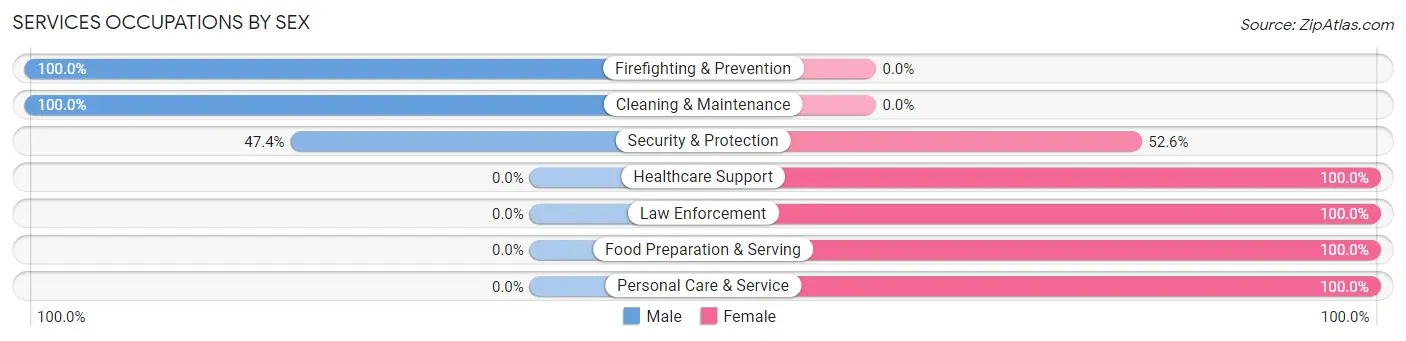
Services Occupations by Sex
Within the Services occupations in Fairfield Bay, the most male-oriented occupations are Firefighting & Prevention (100.0%), Cleaning & Maintenance (100.0%), and Security & Protection (47.4%), while the most female-oriented occupations are Healthcare Support (100.0%), Law Enforcement (100.0%), and Food Preparation & Serving (100.0%).
| Occupation | Male | Female |
| Healthcare Support | 0 (0.0%) | 12 (100.0%) |
| Security & Protection | 9 (47.4%) | 10 (52.6%) |
| Firefighting & Prevention | 9 (100.0%) | 0 (0.0%) |
| Law Enforcement | 0 (0.0%) | 10 (100.0%) |
| Food Preparation & Serving | 0 (0.0%) | 31 (100.0%) |
| Cleaning & Maintenance | 15 (100.0%) | 0 (0.0%) |
| Personal Care & Service | 0 (0.0%) | 17 (100.0%) |
| Total (Category) | 24 (25.5%) | 70 (74.5%) |
| Total (Overall) | 324 (52.8%) | 290 (47.2%) |
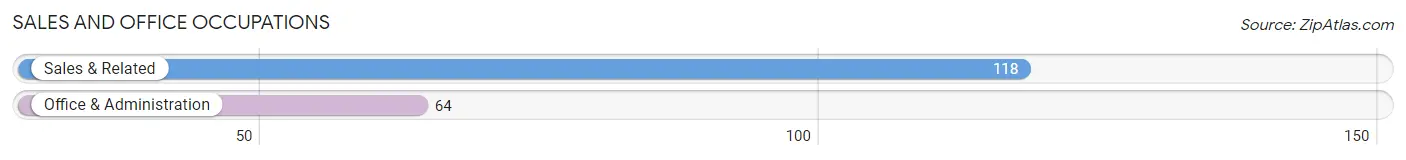
Sales and Office Occupations
The most common Sales and Office occupations in Fairfield Bay are Sales & Related (118 | 19.2%), and Office & Administration (64 | 10.4%).
Sales and Office Occupations by Sex
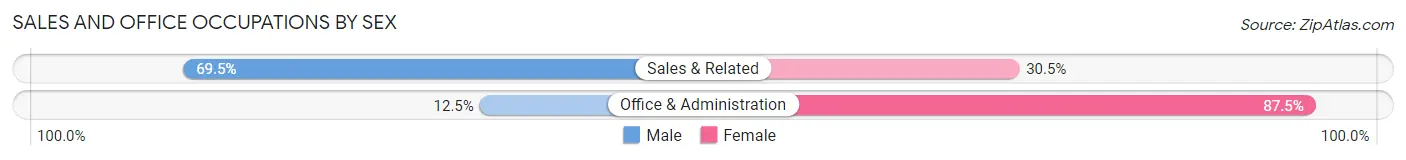
| Occupation | Male | Female |
| Sales & Related | 82 (69.5%) | 36 (30.5%) |
| Office & Administration | 8 (12.5%) | 56 (87.5%) |
| Total (Category) | 90 (49.4%) | 92 (50.5%) |
| Total (Overall) | 324 (52.8%) | 290 (47.2%) |
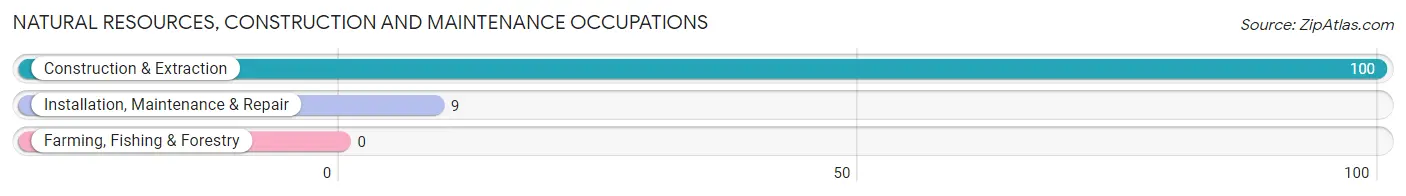
Natural Resources, Construction and Maintenance Occupations
The most common Natural Resources, Construction and Maintenance occupations in Fairfield Bay are Construction & Extraction (100 | 16.3%), and Installation, Maintenance & Repair (9 | 1.5%).
Natural Resources, Construction and Maintenance Occupations by Sex
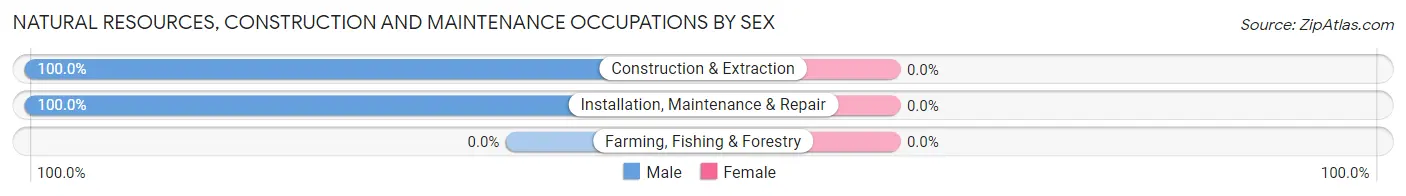
| Occupation | Male | Female |
| Farming, Fishing & Forestry | 0 (0.0%) | 0 (0.0%) |
| Construction & Extraction | 100 (100.0%) | 0 (0.0%) |
| Installation, Maintenance & Repair | 9 (100.0%) | 0 (0.0%) |
| Total (Category) | 109 (100.0%) | 0 (0.0%) |
| Total (Overall) | 324 (52.8%) | 290 (47.2%) |
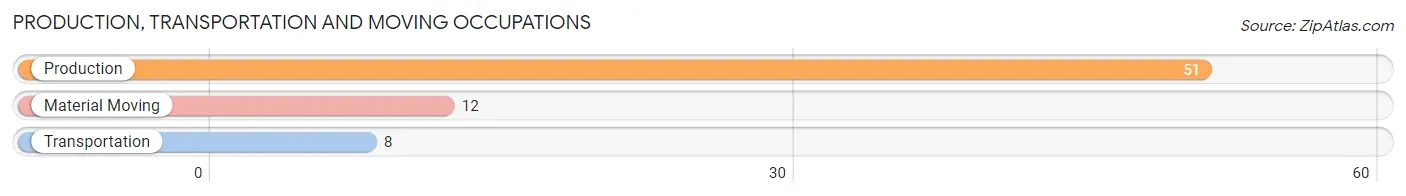
Production, Transportation and Moving Occupations
The most common Production, Transportation and Moving occupations in Fairfield Bay are Production (51 | 8.3%), Material Moving (12 | 1.9%), and Transportation (8 | 1.3%).
Production, Transportation and Moving Occupations by Sex
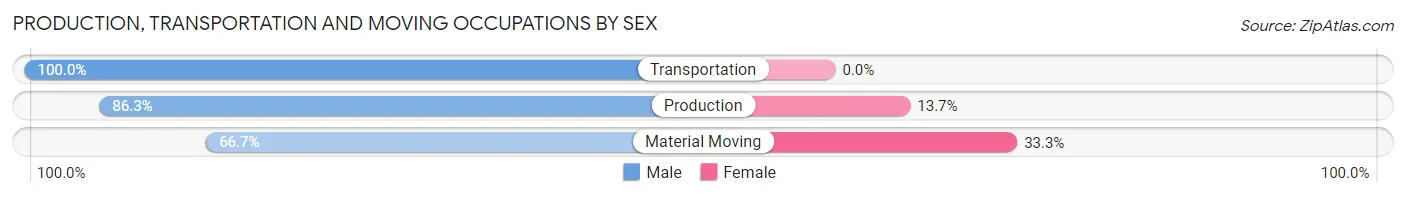
| Occupation | Male | Female |
| Production | 44 (86.3%) | 7 (13.7%) |
| Transportation | 8 (100.0%) | 0 (0.0%) |
| Material Moving | 8 (66.7%) | 4 (33.3%) |
| Total (Category) | 60 (84.5%) | 11 (15.5%) |
| Total (Overall) | 324 (52.8%) | 290 (47.2%) |
Employment Industries by Sex in Fairfield Bay
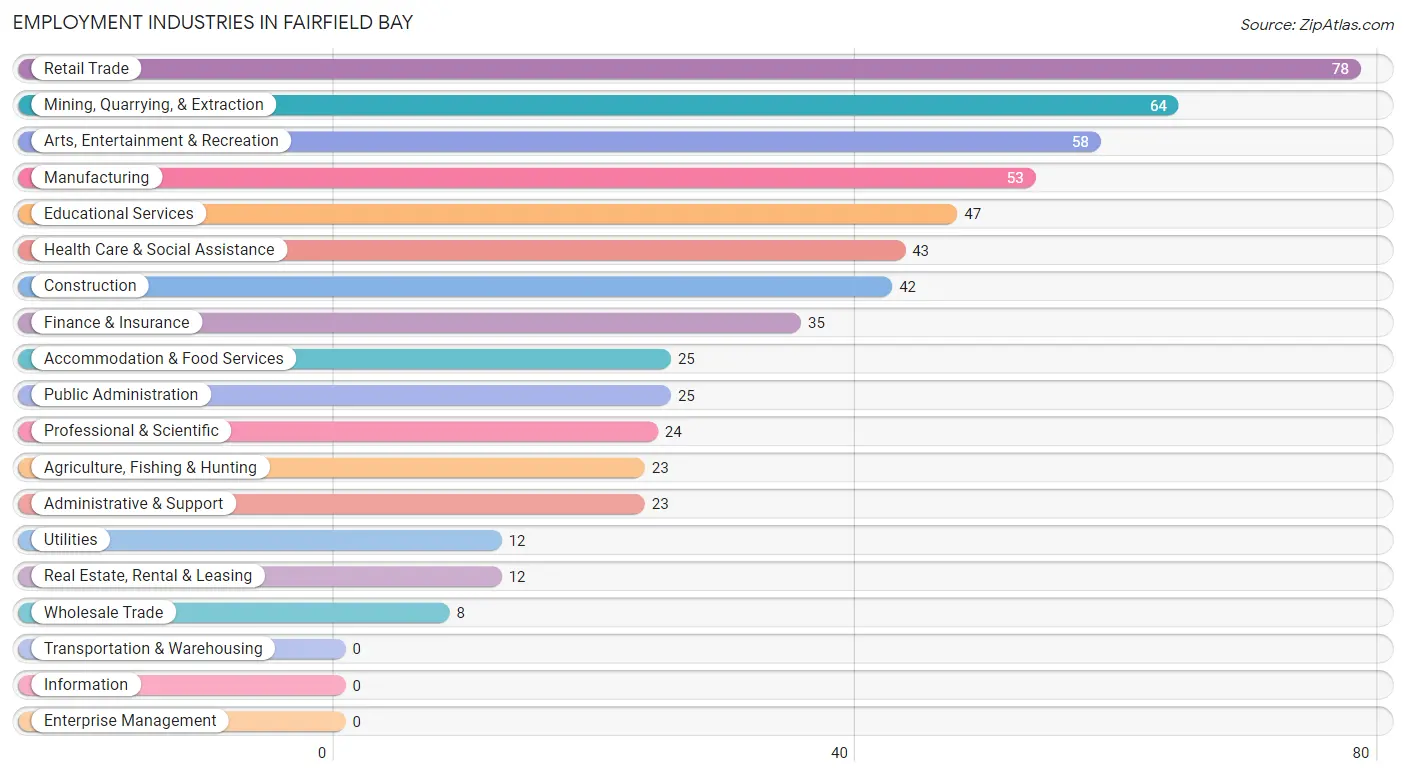
Employment Industries in Fairfield Bay
The major employment industries in Fairfield Bay include Retail Trade (78 | 12.7%), Mining, Quarrying, & Extraction (64 | 10.4%), Arts, Entertainment & Recreation (58 | 9.5%), Manufacturing (53 | 8.6%), and Educational Services (47 | 7.6%).
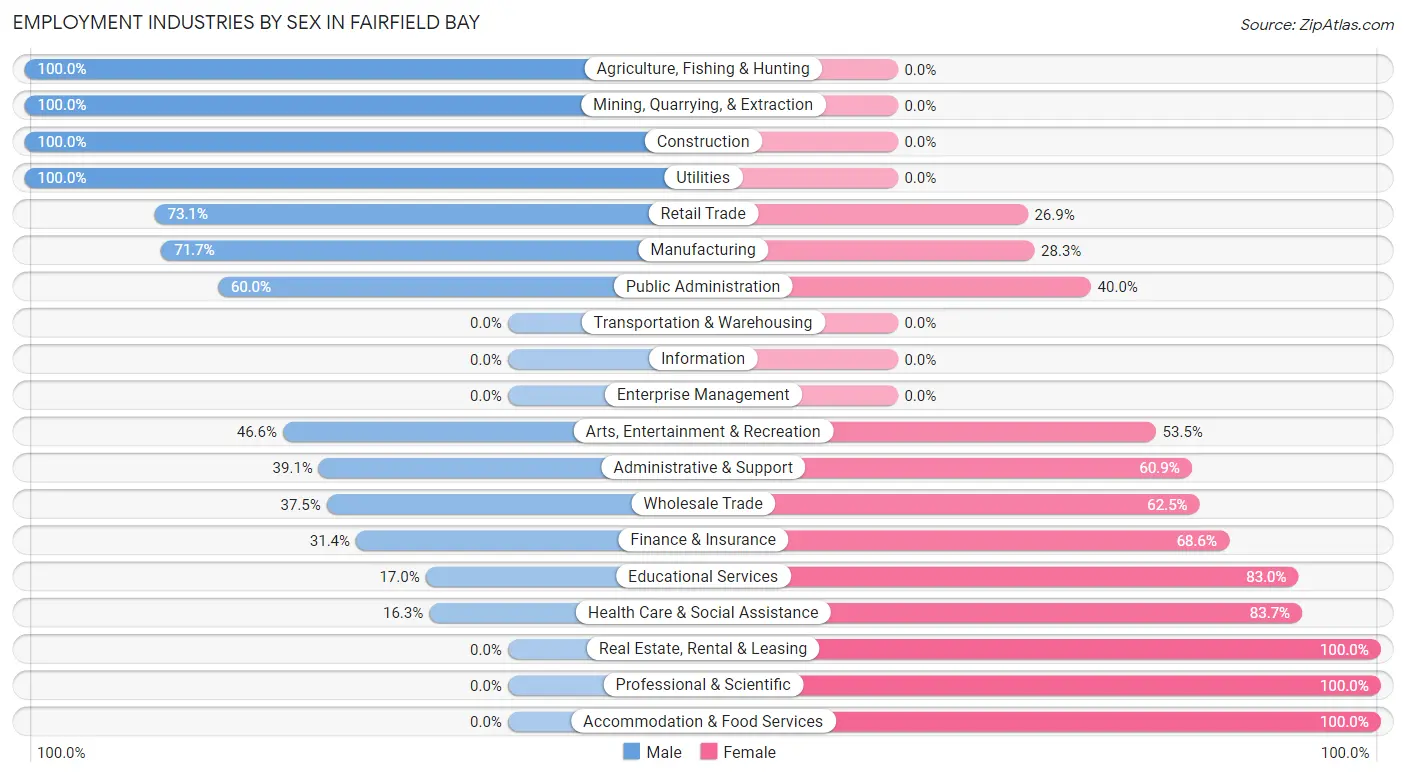
Employment Industries by Sex in Fairfield Bay
The Fairfield Bay industries that see more men than women are Agriculture, Fishing & Hunting (100.0%), Mining, Quarrying, & Extraction (100.0%), and Construction (100.0%), whereas the industries that tend to have a higher number of women are Real Estate, Rental & Leasing (100.0%), Professional & Scientific (100.0%), and Accommodation & Food Services (100.0%).
| Industry | Male | Female |
| Agriculture, Fishing & Hunting | 23 (100.0%) | 0 (0.0%) |
| Mining, Quarrying, & Extraction | 64 (100.0%) | 0 (0.0%) |
| Construction | 42 (100.0%) | 0 (0.0%) |
| Manufacturing | 38 (71.7%) | 15 (28.3%) |
| Wholesale Trade | 3 (37.5%) | 5 (62.5%) |
| Retail Trade | 57 (73.1%) | 21 (26.9%) |
| Transportation & Warehousing | 0 (0.0%) | 0 (0.0%) |
| Utilities | 12 (100.0%) | 0 (0.0%) |
| Information | 0 (0.0%) | 0 (0.0%) |
| Finance & Insurance | 11 (31.4%) | 24 (68.6%) |
| Real Estate, Rental & Leasing | 0 (0.0%) | 12 (100.0%) |
| Professional & Scientific | 0 (0.0%) | 24 (100.0%) |
| Enterprise Management | 0 (0.0%) | 0 (0.0%) |
| Administrative & Support | 9 (39.1%) | 14 (60.9%) |
| Educational Services | 8 (17.0%) | 39 (83.0%) |
| Health Care & Social Assistance | 7 (16.3%) | 36 (83.7%) |
| Arts, Entertainment & Recreation | 27 (46.6%) | 31 (53.4%) |
| Accommodation & Food Services | 0 (0.0%) | 25 (100.0%) |
| Public Administration | 15 (60.0%) | 10 (40.0%) |
| Total | 324 (52.8%) | 290 (47.2%) |
Education in Fairfield Bay
School Enrollment in Fairfield Bay
The most common levels of schooling among the 155 students in Fairfield Bay are high school (88 | 56.8%), college / undergraduate (33 | 21.3%), and middle school (23 | 14.8%).
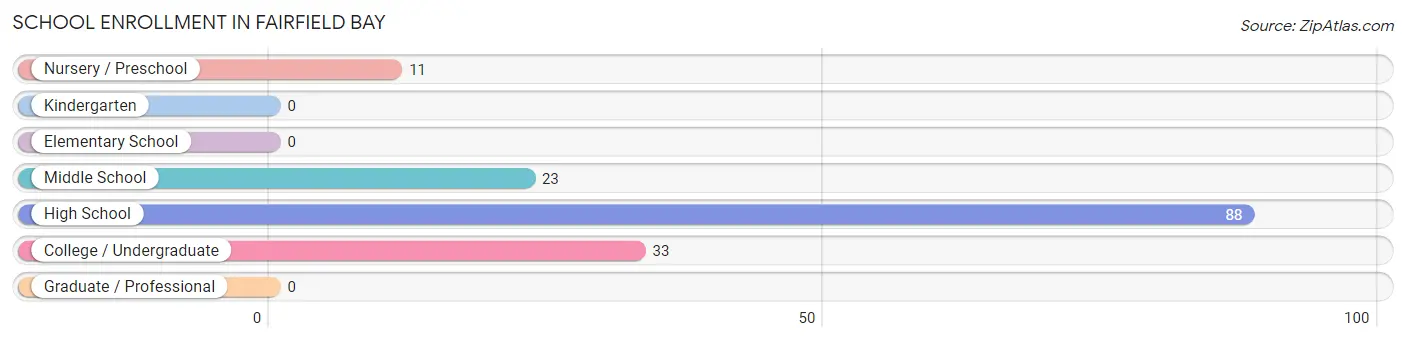
| School Level | # Students | % Students |
| Nursery / Preschool | 11 | 7.1% |
| Kindergarten | 0 | 0.0% |
| Elementary School | 0 | 0.0% |
| Middle School | 23 | 14.8% |
| High School | 88 | 56.8% |
| College / Undergraduate | 33 | 21.3% |
| Graduate / Professional | 0 | 0.0% |
| Total | 155 | 100.0% |
School Enrollment by Age by Funding Source in Fairfield Bay
Out of a total of 155 students who are enrolled in schools in Fairfield Bay, 8 (5.2%) attend a private institution, while the remaining 147 (94.8%) are enrolled in public schools. The age group of 25 to 34 year olds has the highest likelihood of being enrolled in private schools, with 8 (100.0% in the age bracket) enrolled. Conversely, the age group of 3 to 4 year olds has the lowest likelihood of being enrolled in a private school, with 11 (100.0% in the age bracket) attending a public institution.
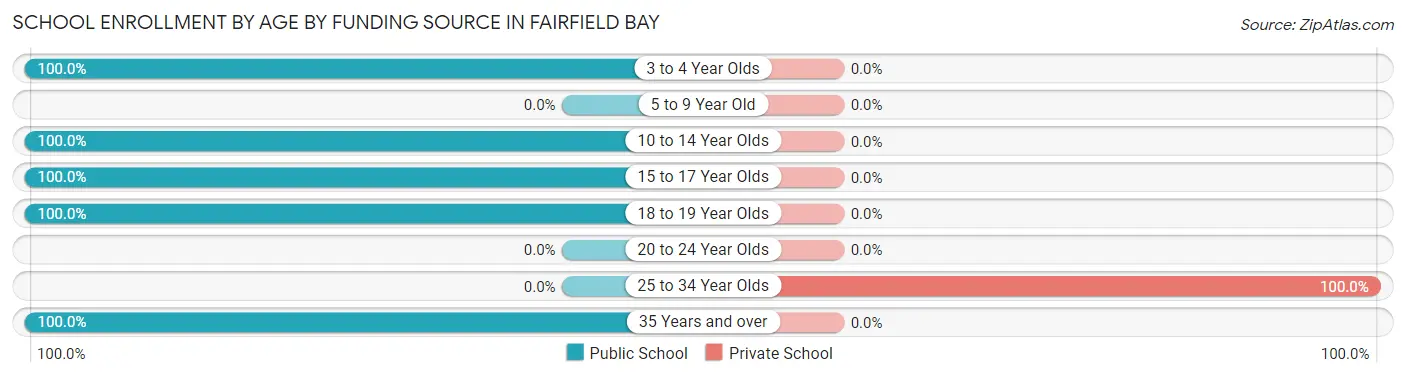
| Age Bracket | Public School | Private School |
| 3 to 4 Year Olds | 11 (100.0%) | 0 (0.0%) |
| 5 to 9 Year Old | 0 (0.0%) | 0 (0.0%) |
| 10 to 14 Year Olds | 23 (100.0%) | 0 (0.0%) |
| 15 to 17 Year Olds | 52 (100.0%) | 0 (0.0%) |
| 18 to 19 Year Olds | 25 (100.0%) | 0 (0.0%) |
| 20 to 24 Year Olds | 0 (0.0%) | 0 (0.0%) |
| 25 to 34 Year Olds | 0 (0.0%) | 8 (100.0%) |
| 35 Years and over | 36 (100.0%) | 0 (0.0%) |
| Total | 147 (94.8%) | 8 (5.2%) |
Educational Attainment by Field of Study in Fairfield Bay
Business (255 | 33.5%), education (119 | 15.6%), science & technology (102 | 13.4%), literature & languages (47 | 6.2%), and psychology (39 | 5.1%) are the most common fields of study among 762 individuals in Fairfield Bay who have obtained a bachelor's degree or higher.
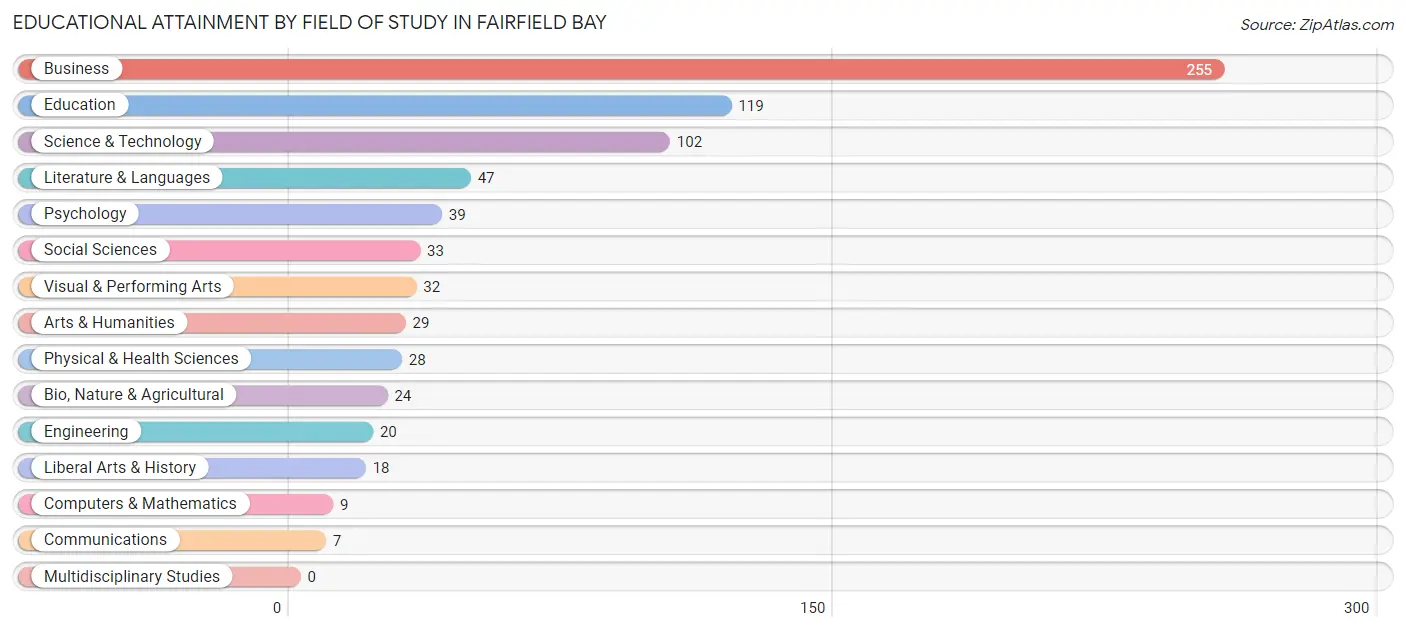
| Field of Study | # Graduates | % Graduates |
| Computers & Mathematics | 9 | 1.2% |
| Bio, Nature & Agricultural | 24 | 3.2% |
| Physical & Health Sciences | 28 | 3.7% |
| Psychology | 39 | 5.1% |
| Social Sciences | 33 | 4.3% |
| Engineering | 20 | 2.6% |
| Multidisciplinary Studies | 0 | 0.0% |
| Science & Technology | 102 | 13.4% |
| Business | 255 | 33.5% |
| Education | 119 | 15.6% |
| Literature & Languages | 47 | 6.2% |
| Liberal Arts & History | 18 | 2.4% |
| Visual & Performing Arts | 32 | 4.2% |
| Communications | 7 | 0.9% |
| Arts & Humanities | 29 | 3.8% |
| Total | 762 | 100.0% |
Transportation & Commute in Fairfield Bay
Vehicle Availability by Sex in Fairfield Bay
The most prevalent vehicle ownership categories in Fairfield Bay are males with 2 vehicles (179, accounting for 55.2%) and females with 2 vehicles (169, making up 61.7%).
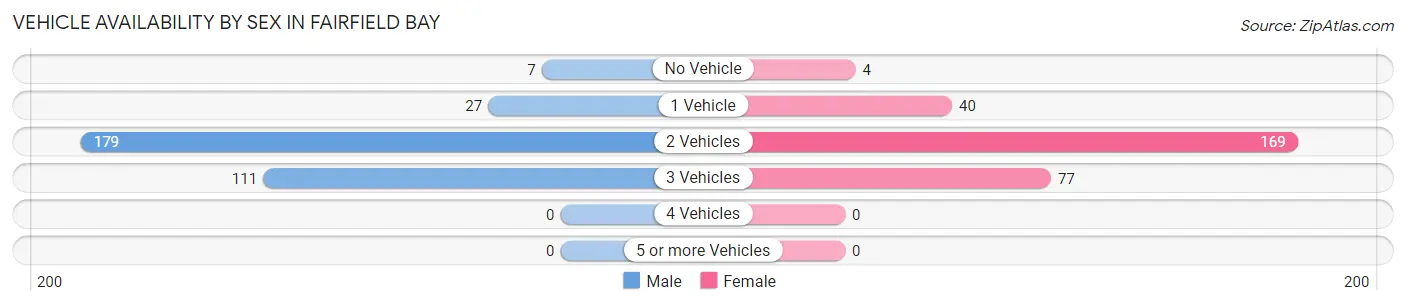
| Vehicles Available | Male | Female |
| No Vehicle | 7 (2.2%) | 4 (1.4%) |
| 1 Vehicle | 27 (8.3%) | 40 (13.8%) |
| 2 Vehicles | 179 (55.2%) | 169 (58.3%) |
| 3 Vehicles | 111 (34.3%) | 77 (26.6%) |
| 4 Vehicles | 0 (0.0%) | 0 (0.0%) |
| 5 or more Vehicles | 0 (0.0%) | 0 (0.0%) |
| Total | 324 (100.0%) | 290 (100.0%) |
Commute Time in Fairfield Bay
The most frequently occuring commute durations in Fairfield Bay are 5 to 9 minutes (121 commuters, 21.9%), 10 to 14 minutes (100 commuters, 18.1%), and 30 to 34 minutes (80 commuters, 14.5%).
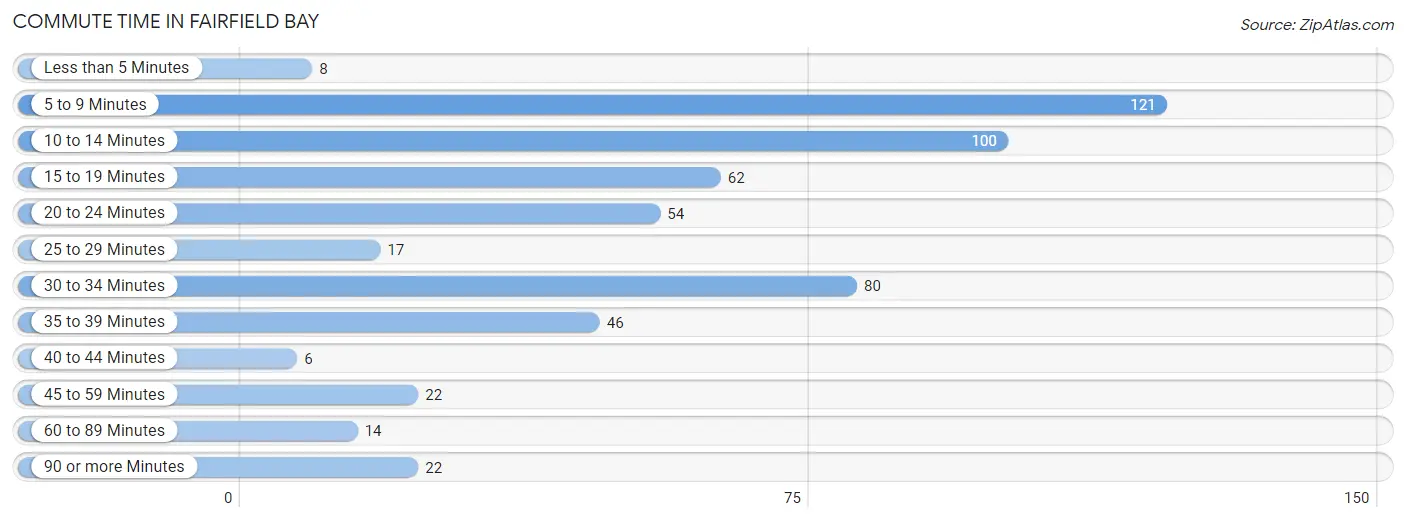
| Commute Time | # Commuters | % Commuters |
| Less than 5 Minutes | 8 | 1.5% |
| 5 to 9 Minutes | 121 | 21.9% |
| 10 to 14 Minutes | 100 | 18.1% |
| 15 to 19 Minutes | 62 | 11.2% |
| 20 to 24 Minutes | 54 | 9.8% |
| 25 to 29 Minutes | 17 | 3.1% |
| 30 to 34 Minutes | 80 | 14.5% |
| 35 to 39 Minutes | 46 | 8.3% |
| 40 to 44 Minutes | 6 | 1.1% |
| 45 to 59 Minutes | 22 | 4.0% |
| 60 to 89 Minutes | 14 | 2.5% |
| 90 or more Minutes | 22 | 4.0% |
Commute Time by Sex in Fairfield Bay
The most common commute times in Fairfield Bay are 30 to 34 minutes (64 commuters, 21.3%) for males and 5 to 9 minutes (79 commuters, 31.4%) for females.
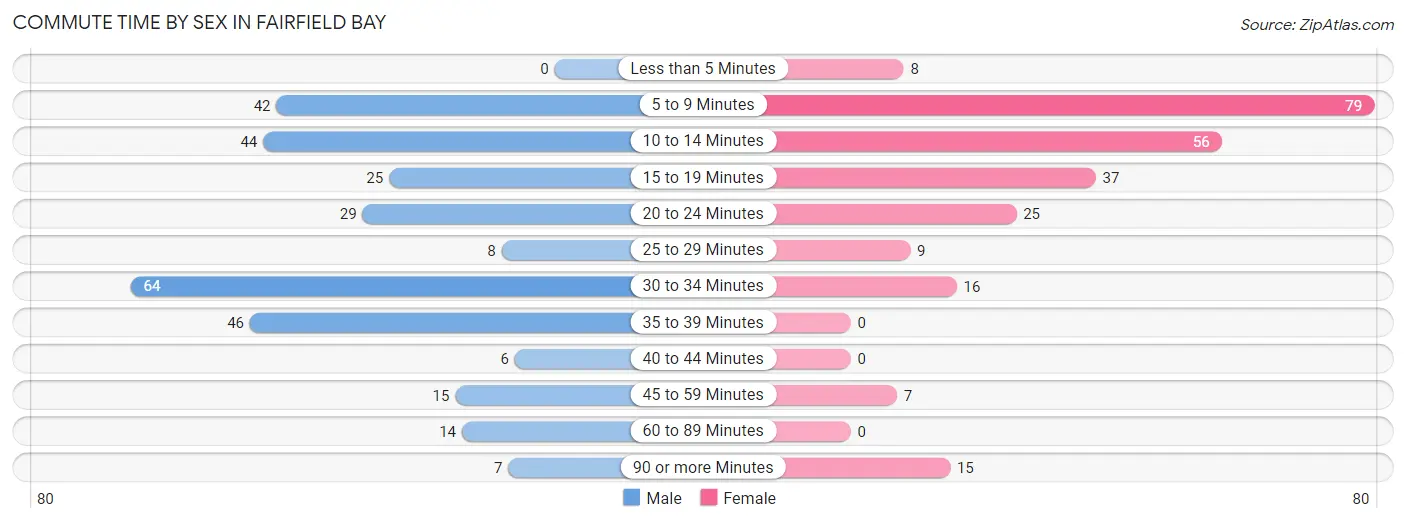
| Commute Time | Male | Female |
| Less than 5 Minutes | 0 (0.0%) | 8 (3.2%) |
| 5 to 9 Minutes | 42 (14.0%) | 79 (31.4%) |
| 10 to 14 Minutes | 44 (14.7%) | 56 (22.2%) |
| 15 to 19 Minutes | 25 (8.3%) | 37 (14.7%) |
| 20 to 24 Minutes | 29 (9.7%) | 25 (9.9%) |
| 25 to 29 Minutes | 8 (2.7%) | 9 (3.6%) |
| 30 to 34 Minutes | 64 (21.3%) | 16 (6.4%) |
| 35 to 39 Minutes | 46 (15.3%) | 0 (0.0%) |
| 40 to 44 Minutes | 6 (2.0%) | 0 (0.0%) |
| 45 to 59 Minutes | 15 (5.0%) | 7 (2.8%) |
| 60 to 89 Minutes | 14 (4.7%) | 0 (0.0%) |
| 90 or more Minutes | 7 (2.3%) | 15 (5.9%) |
Time of Departure to Work by Sex in Fairfield Bay
The most frequent times of departure to work in Fairfield Bay are 6:30 AM to 6:59 AM (92, 30.7%) for males and 7:00 AM to 7:29 AM (71, 28.2%) for females.
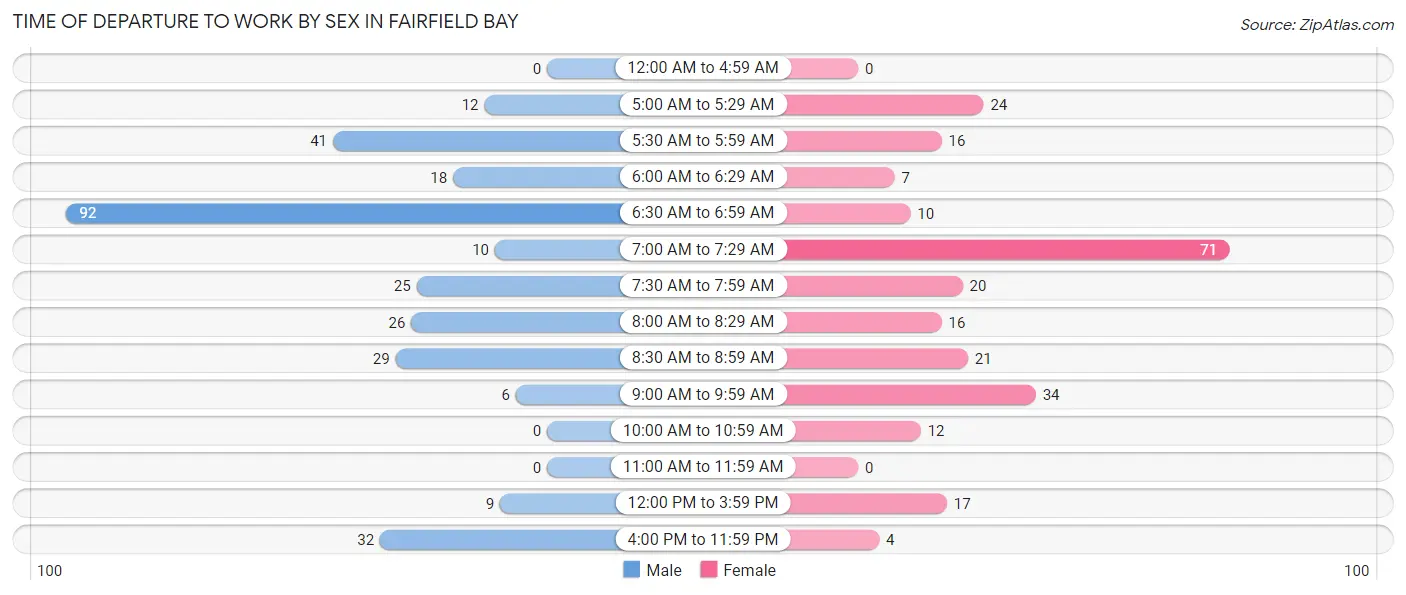
| Time of Departure | Male | Female |
| 12:00 AM to 4:59 AM | 0 (0.0%) | 0 (0.0%) |
| 5:00 AM to 5:29 AM | 12 (4.0%) | 24 (9.5%) |
| 5:30 AM to 5:59 AM | 41 (13.7%) | 16 (6.4%) |
| 6:00 AM to 6:29 AM | 18 (6.0%) | 7 (2.8%) |
| 6:30 AM to 6:59 AM | 92 (30.7%) | 10 (4.0%) |
| 7:00 AM to 7:29 AM | 10 (3.3%) | 71 (28.2%) |
| 7:30 AM to 7:59 AM | 25 (8.3%) | 20 (7.9%) |
| 8:00 AM to 8:29 AM | 26 (8.7%) | 16 (6.4%) |
| 8:30 AM to 8:59 AM | 29 (9.7%) | 21 (8.3%) |
| 9:00 AM to 9:59 AM | 6 (2.0%) | 34 (13.5%) |
| 10:00 AM to 10:59 AM | 0 (0.0%) | 12 (4.8%) |
| 11:00 AM to 11:59 AM | 0 (0.0%) | 0 (0.0%) |
| 12:00 PM to 3:59 PM | 9 (3.0%) | 17 (6.8%) |
| 4:00 PM to 11:59 PM | 32 (10.7%) | 4 (1.6%) |
| Total | 300 (100.0%) | 252 (100.0%) |
Housing Occupancy in Fairfield Bay
Occupancy by Ownership in Fairfield Bay
Of the total 1,462 dwellings in Fairfield Bay, owner-occupied units account for 1,269 (86.8%), while renter-occupied units make up 193 (13.2%).
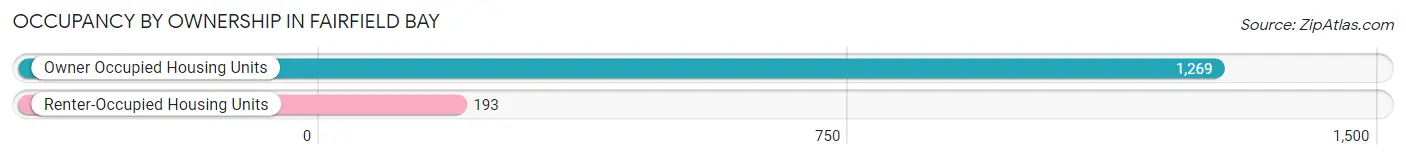
| Occupancy | # Housing Units | % Housing Units |
| Owner Occupied Housing Units | 1,269 | 86.8% |
| Renter-Occupied Housing Units | 193 | 13.2% |
| Total Occupied Housing Units | 1,462 | 100.0% |
Occupancy by Household Size in Fairfield Bay
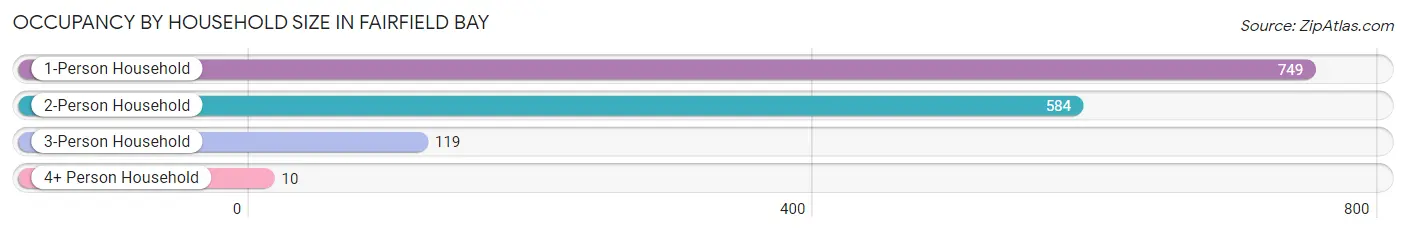
| Household Size | # Housing Units | % Housing Units |
| 1-Person Household | 749 | 51.2% |
| 2-Person Household | 584 | 40.0% |
| 3-Person Household | 119 | 8.1% |
| 4+ Person Household | 10 | 0.7% |
| Total Housing Units | 1,462 | 100.0% |
Occupancy by Ownership by Household Size in Fairfield Bay
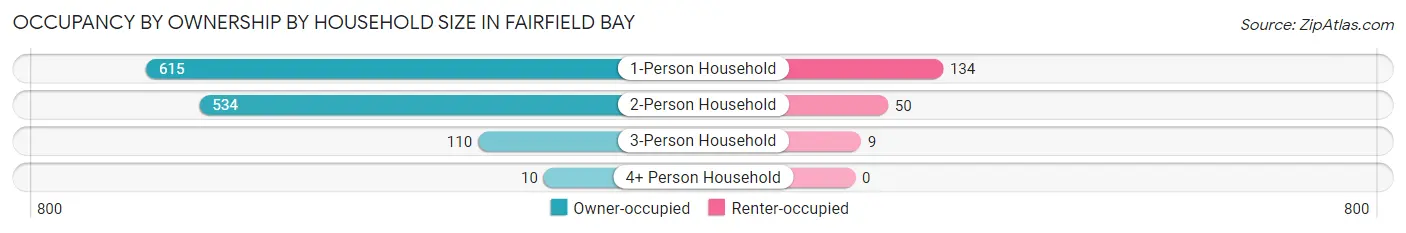
| Household Size | Owner-occupied | Renter-occupied |
| 1-Person Household | 615 (82.1%) | 134 (17.9%) |
| 2-Person Household | 534 (91.4%) | 50 (8.6%) |
| 3-Person Household | 110 (92.4%) | 9 (7.6%) |
| 4+ Person Household | 10 (100.0%) | 0 (0.0%) |
| Total Housing Units | 1,269 (86.8%) | 193 (13.2%) |
Occupancy by Educational Attainment in Fairfield Bay
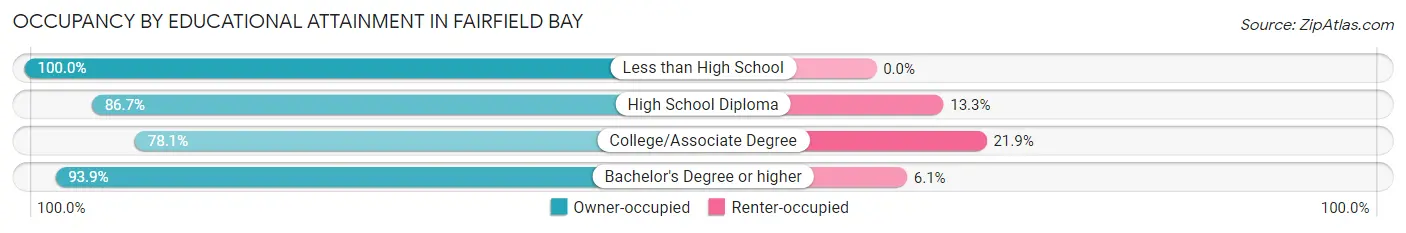
| Household Size | Owner-occupied | Renter-occupied |
| Less than High School | 14 (100.0%) | 0 (0.0%) |
| High School Diploma | 306 (86.7%) | 47 (13.3%) |
| College/Associate Degree | 393 (78.1%) | 110 (21.9%) |
| Bachelor's Degree or higher | 556 (93.9%) | 36 (6.1%) |
Occupancy by Age of Householder in Fairfield Bay
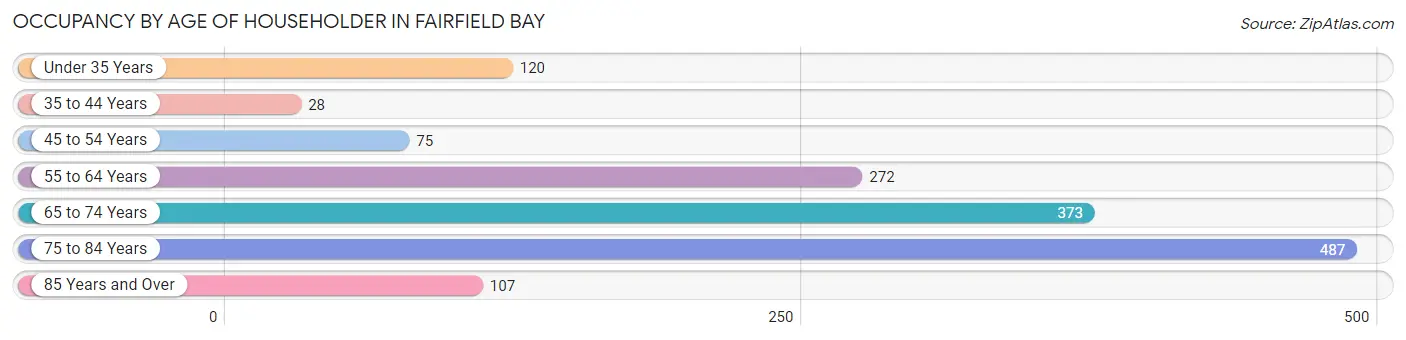
| Age Bracket | # Households | % Households |
| Under 35 Years | 120 | 8.2% |
| 35 to 44 Years | 28 | 1.9% |
| 45 to 54 Years | 75 | 5.1% |
| 55 to 64 Years | 272 | 18.6% |
| 65 to 74 Years | 373 | 25.5% |
| 75 to 84 Years | 487 | 33.3% |
| 85 Years and Over | 107 | 7.3% |
| Total | 1,462 | 100.0% |
Housing Finances in Fairfield Bay
Median Income by Occupancy in Fairfield Bay
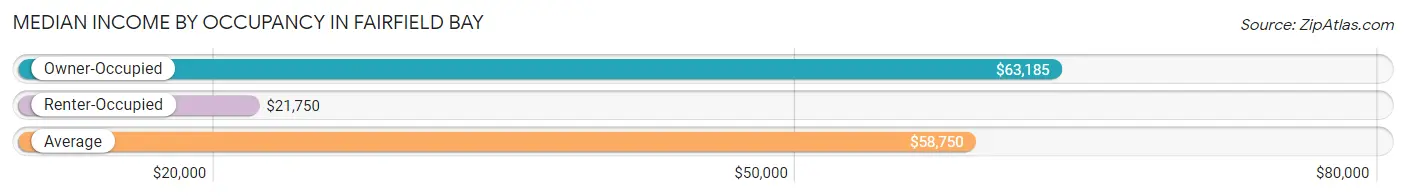
| Occupancy Type | # Households | Median Income |
| Owner-Occupied | 1,269 (86.8%) | $63,185 |
| Renter-Occupied | 193 (13.2%) | $21,750 |
| Average | 1,462 (100.0%) | $58,750 |
Occupancy by Householder Income Bracket in Fairfield Bay
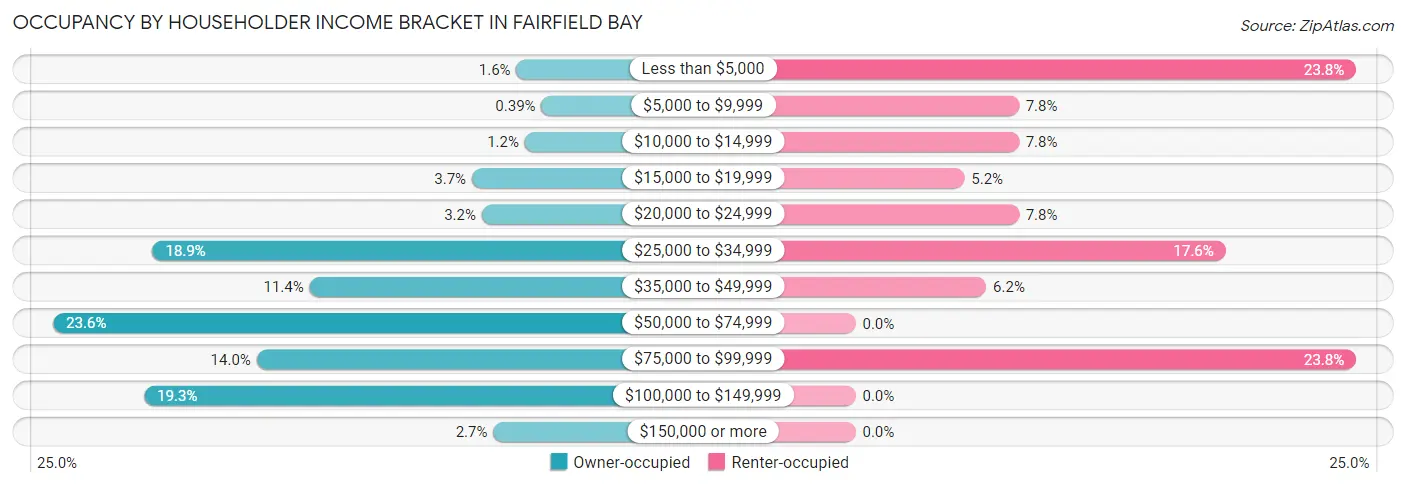
| Income Bracket | Owner-occupied | Renter-occupied |
| Less than $5,000 | 20 (1.6%) | 46 (23.8%) |
| $5,000 to $9,999 | 5 (0.4%) | 15 (7.8%) |
| $10,000 to $14,999 | 15 (1.2%) | 15 (7.8%) |
| $15,000 to $19,999 | 47 (3.7%) | 10 (5.2%) |
| $20,000 to $24,999 | 41 (3.2%) | 15 (7.8%) |
| $25,000 to $34,999 | 240 (18.9%) | 34 (17.6%) |
| $35,000 to $49,999 | 145 (11.4%) | 12 (6.2%) |
| $50,000 to $74,999 | 300 (23.6%) | 0 (0.0%) |
| $75,000 to $99,999 | 177 (14.0%) | 46 (23.8%) |
| $100,000 to $149,999 | 245 (19.3%) | 0 (0.0%) |
| $150,000 or more | 34 (2.7%) | 0 (0.0%) |
| Total | 1,269 (100.0%) | 193 (100.0%) |
Monthly Housing Cost Tiers in Fairfield Bay
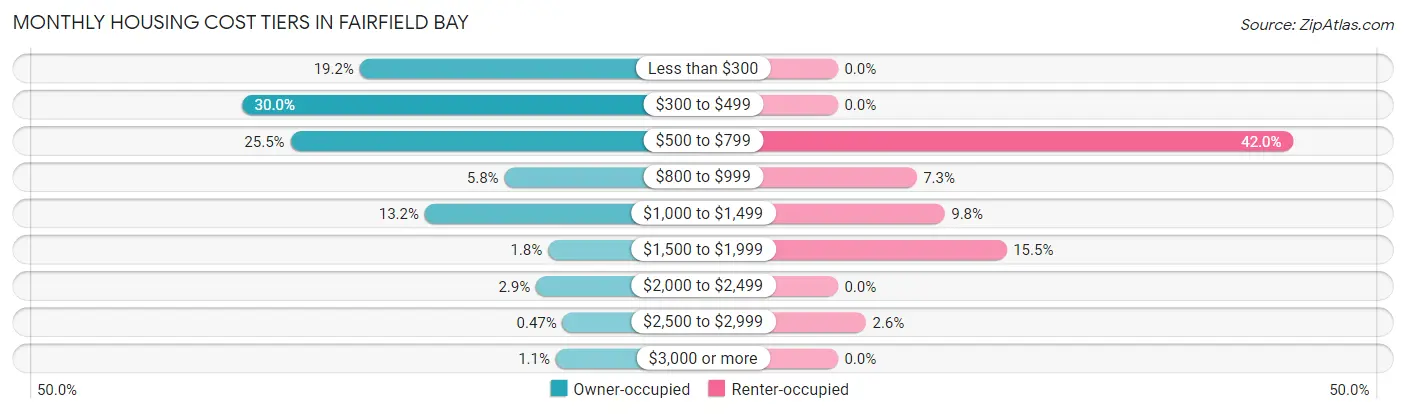
| Monthly Cost | Owner-occupied | Renter-occupied |
| Less than $300 | 243 (19.2%) | 0 (0.0%) |
| $300 to $499 | 381 (30.0%) | 0 (0.0%) |
| $500 to $799 | 324 (25.5%) | 81 (42.0%) |
| $800 to $999 | 74 (5.8%) | 14 (7.2%) |
| $1,000 to $1,499 | 167 (13.2%) | 19 (9.8%) |
| $1,500 to $1,999 | 23 (1.8%) | 30 (15.5%) |
| $2,000 to $2,499 | 37 (2.9%) | 0 (0.0%) |
| $2,500 to $2,999 | 6 (0.5%) | 5 (2.6%) |
| $3,000 or more | 14 (1.1%) | 0 (0.0%) |
| Total | 1,269 (100.0%) | 193 (100.0%) |
Physical Housing Characteristics in Fairfield Bay
Housing Structures in Fairfield Bay
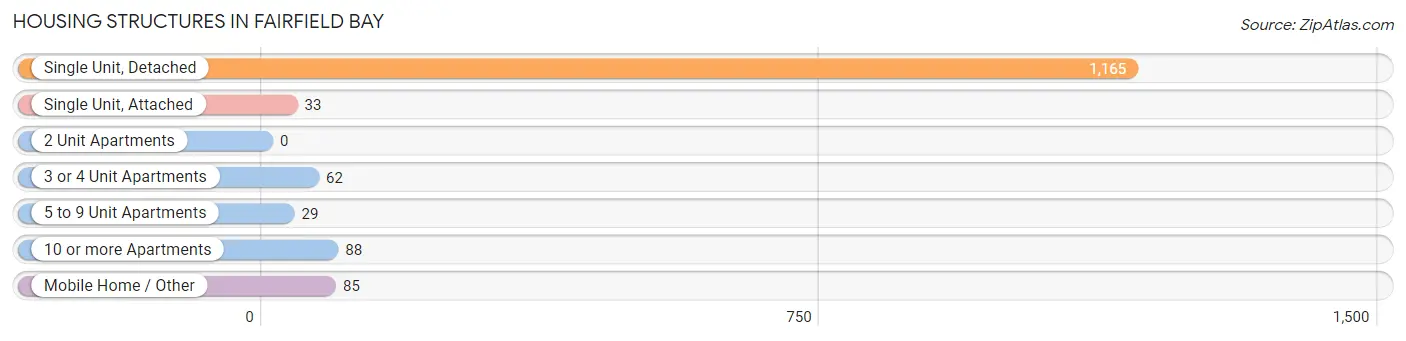
| Structure Type | # Housing Units | % Housing Units |
| Single Unit, Detached | 1,165 | 79.7% |
| Single Unit, Attached | 33 | 2.3% |
| 2 Unit Apartments | 0 | 0.0% |
| 3 or 4 Unit Apartments | 62 | 4.2% |
| 5 to 9 Unit Apartments | 29 | 2.0% |
| 10 or more Apartments | 88 | 6.0% |
| Mobile Home / Other | 85 | 5.8% |
| Total | 1,462 | 100.0% |
Housing Structures by Occupancy in Fairfield Bay
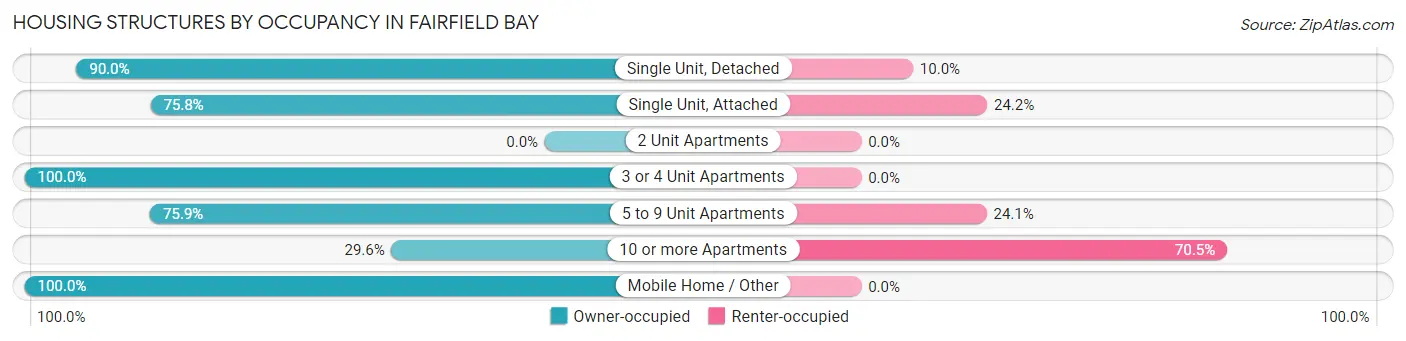
| Structure Type | Owner-occupied | Renter-occupied |
| Single Unit, Detached | 1,049 (90.0%) | 116 (10.0%) |
| Single Unit, Attached | 25 (75.8%) | 8 (24.2%) |
| 2 Unit Apartments | 0 (0.0%) | 0 (0.0%) |
| 3 or 4 Unit Apartments | 62 (100.0%) | 0 (0.0%) |
| 5 to 9 Unit Apartments | 22 (75.9%) | 7 (24.1%) |
| 10 or more Apartments | 26 (29.5%) | 62 (70.5%) |
| Mobile Home / Other | 85 (100.0%) | 0 (0.0%) |
| Total | 1,269 (86.8%) | 193 (13.2%) |
Housing Structures by Number of Rooms in Fairfield Bay
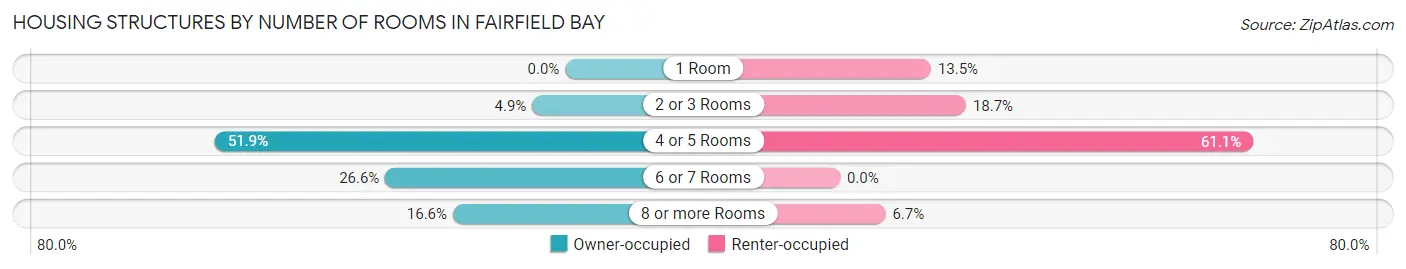
| Number of Rooms | Owner-occupied | Renter-occupied |
| 1 Room | 0 (0.0%) | 26 (13.5%) |
| 2 or 3 Rooms | 62 (4.9%) | 36 (18.6%) |
| 4 or 5 Rooms | 658 (51.8%) | 118 (61.1%) |
| 6 or 7 Rooms | 338 (26.6%) | 0 (0.0%) |
| 8 or more Rooms | 211 (16.6%) | 13 (6.7%) |
| Total | 1,269 (100.0%) | 193 (100.0%) |
Housing Structure by Heating Type in Fairfield Bay
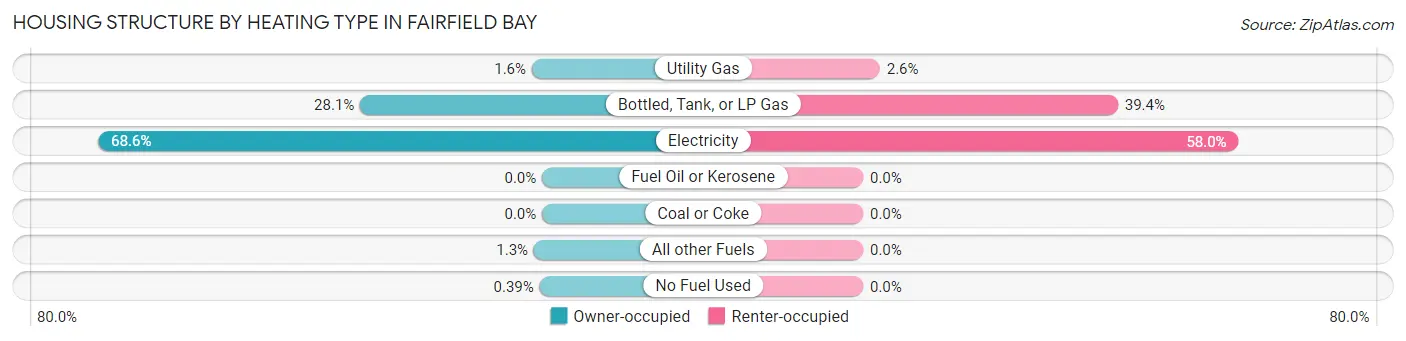
| Heating Type | Owner-occupied | Renter-occupied |
| Utility Gas | 20 (1.6%) | 5 (2.6%) |
| Bottled, Tank, or LP Gas | 357 (28.1%) | 76 (39.4%) |
| Electricity | 871 (68.6%) | 112 (58.0%) |
| Fuel Oil or Kerosene | 0 (0.0%) | 0 (0.0%) |
| Coal or Coke | 0 (0.0%) | 0 (0.0%) |
| All other Fuels | 16 (1.3%) | 0 (0.0%) |
| No Fuel Used | 5 (0.4%) | 0 (0.0%) |
| Total | 1,269 (100.0%) | 193 (100.0%) |
Household Vehicle Usage in Fairfield Bay
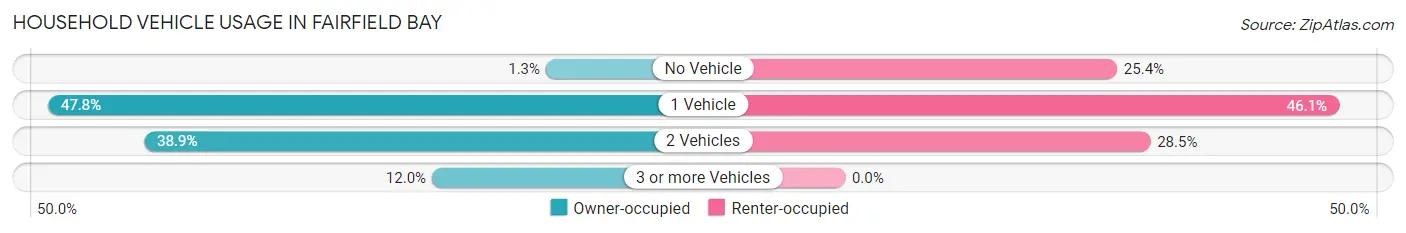
| Vehicles per Household | Owner-occupied | Renter-occupied |
| No Vehicle | 17 (1.3%) | 49 (25.4%) |
| 1 Vehicle | 607 (47.8%) | 89 (46.1%) |
| 2 Vehicles | 493 (38.9%) | 55 (28.5%) |
| 3 or more Vehicles | 152 (12.0%) | 0 (0.0%) |
| Total | 1,269 (100.0%) | 193 (100.0%) |
Real Estate & Mortgages in Fairfield Bay
Real Estate and Mortgage Overview in Fairfield Bay
| Characteristic | Without Mortgage | With Mortgage |
| Housing Units | 871 | 398 |
| Median Property Value | $154,800 | $152,100 |
| Median Household Income | $63,469 | $6 |
| Monthly Housing Costs | $389 | $14 |
| Real Estate Taxes | $1,100 | $28 |
Property Value by Mortgage Status in Fairfield Bay
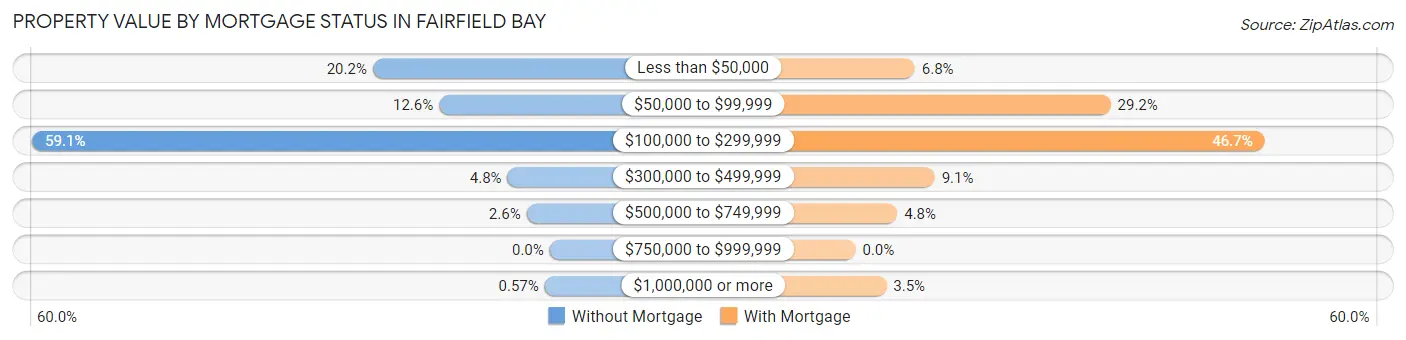
| Property Value | Without Mortgage | With Mortgage |
| Less than $50,000 | 176 (20.2%) | 27 (6.8%) |
| $50,000 to $99,999 | 110 (12.6%) | 116 (29.1%) |
| $100,000 to $299,999 | 515 (59.1%) | 186 (46.7%) |
| $300,000 to $499,999 | 42 (4.8%) | 36 (9.0%) |
| $500,000 to $749,999 | 23 (2.6%) | 19 (4.8%) |
| $750,000 to $999,999 | 0 (0.0%) | 0 (0.0%) |
| $1,000,000 or more | 5 (0.6%) | 14 (3.5%) |
| Total | 871 (100.0%) | 398 (100.0%) |
Household Income by Mortgage Status in Fairfield Bay
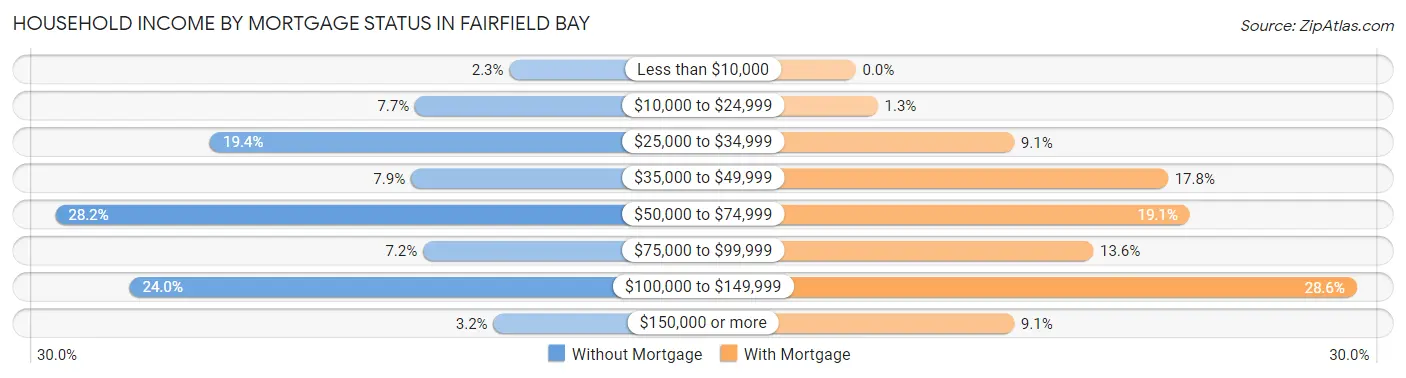
| Household Income | Without Mortgage | With Mortgage |
| Less than $10,000 | 20 (2.3%) | 0 (0.0%) |
| $10,000 to $24,999 | 67 (7.7%) | 5 (1.3%) |
| $25,000 to $34,999 | 169 (19.4%) | 36 (9.0%) |
| $35,000 to $49,999 | 69 (7.9%) | 71 (17.8%) |
| $50,000 to $74,999 | 246 (28.2%) | 76 (19.1%) |
| $75,000 to $99,999 | 63 (7.2%) | 54 (13.6%) |
| $100,000 to $149,999 | 209 (24.0%) | 114 (28.6%) |
| $150,000 or more | 28 (3.2%) | 36 (9.0%) |
| Total | 871 (100.0%) | 398 (100.0%) |
Property Value to Household Income Ratio in Fairfield Bay
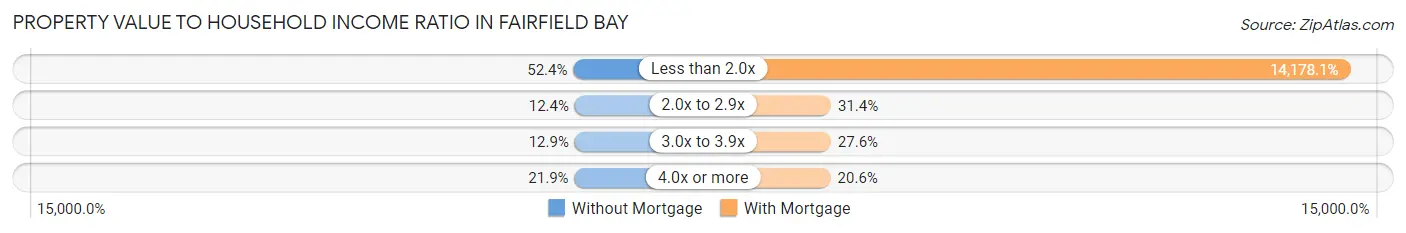
| Value-to-Income Ratio | Without Mortgage | With Mortgage |
| Less than 2.0x | 456 (52.3%) | 56,429 (14,178.1%) |
| 2.0x to 2.9x | 108 (12.4%) | 125 (31.4%) |
| 3.0x to 3.9x | 112 (12.9%) | 110 (27.6%) |
| 4.0x or more | 191 (21.9%) | 82 (20.6%) |
| Total | 871 (100.0%) | 398 (100.0%) |
Real Estate Taxes by Mortgage Status in Fairfield Bay
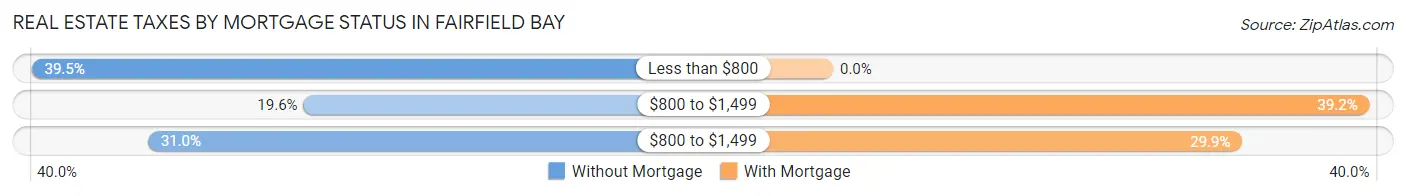
| Property Taxes | Without Mortgage | With Mortgage |
| Less than $800 | 344 (39.5%) | 0 (0.0%) |
| $800 to $1,499 | 171 (19.6%) | 156 (39.2%) |
| $800 to $1,499 | 270 (31.0%) | 119 (29.9%) |
| Total | 871 (100.0%) | 398 (100.0%) |
Health & Disability in Fairfield Bay
Health Insurance Coverage by Age in Fairfield Bay
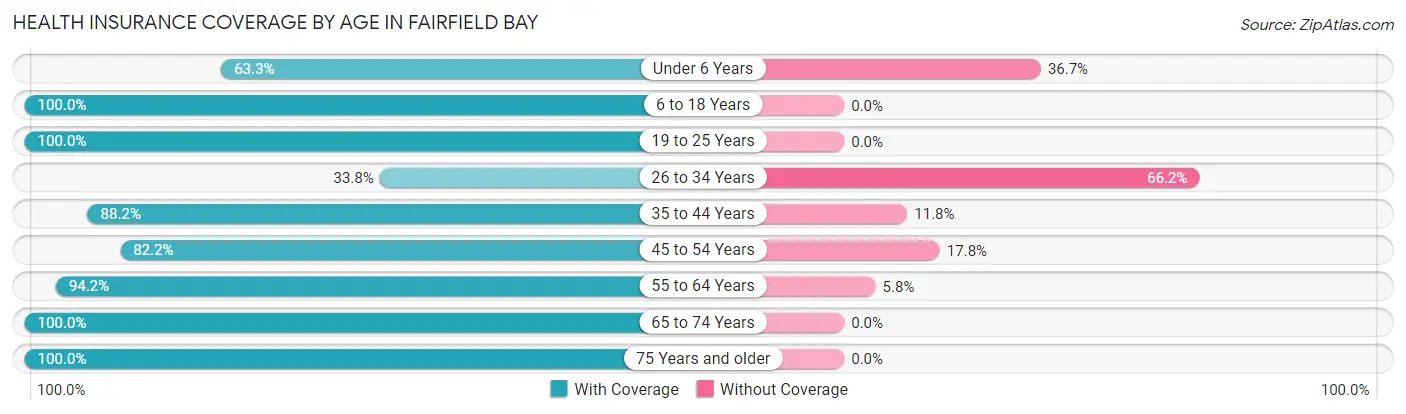
| Age Bracket | With Coverage | Without Coverage |
| Under 6 Years | 19 (63.3%) | 11 (36.7%) |
| 6 to 18 Years | 90 (100.0%) | 0 (0.0%) |
| 19 to 25 Years | 70 (100.0%) | 0 (0.0%) |
| 26 to 34 Years | 47 (33.8%) | 92 (66.2%) |
| 35 to 44 Years | 75 (88.2%) | 10 (11.8%) |
| 45 to 54 Years | 106 (82.2%) | 23 (17.8%) |
| 55 to 64 Years | 419 (94.2%) | 26 (5.8%) |
| 65 to 74 Years | 561 (100.0%) | 0 (0.0%) |
| 75 Years and older | 710 (100.0%) | 0 (0.0%) |
| Total | 2,097 (92.8%) | 162 (7.2%) |
Health Insurance Coverage by Citizenship Status in Fairfield Bay
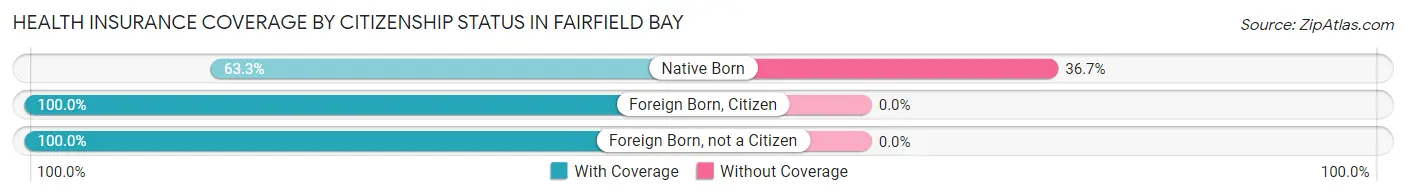
| Citizenship Status | With Coverage | Without Coverage |
| Native Born | 19 (63.3%) | 11 (36.7%) |
| Foreign Born, Citizen | 90 (100.0%) | 0 (0.0%) |
| Foreign Born, not a Citizen | 70 (100.0%) | 0 (0.0%) |
Health Insurance Coverage by Household Income in Fairfield Bay
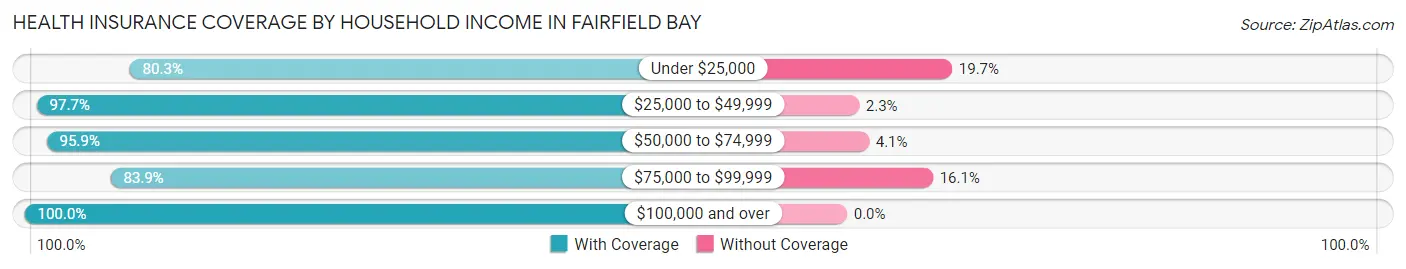
| Household Income | With Coverage | Without Coverage |
| Under $25,000 | 204 (80.3%) | 50 (19.7%) |
| $25,000 to $49,999 | 563 (97.7%) | 13 (2.3%) |
| $50,000 to $74,999 | 558 (95.9%) | 24 (4.1%) |
| $75,000 to $99,999 | 391 (83.9%) | 75 (16.1%) |
| $100,000 and over | 381 (100.0%) | 0 (0.0%) |
Public vs Private Health Insurance Coverage by Age in Fairfield Bay
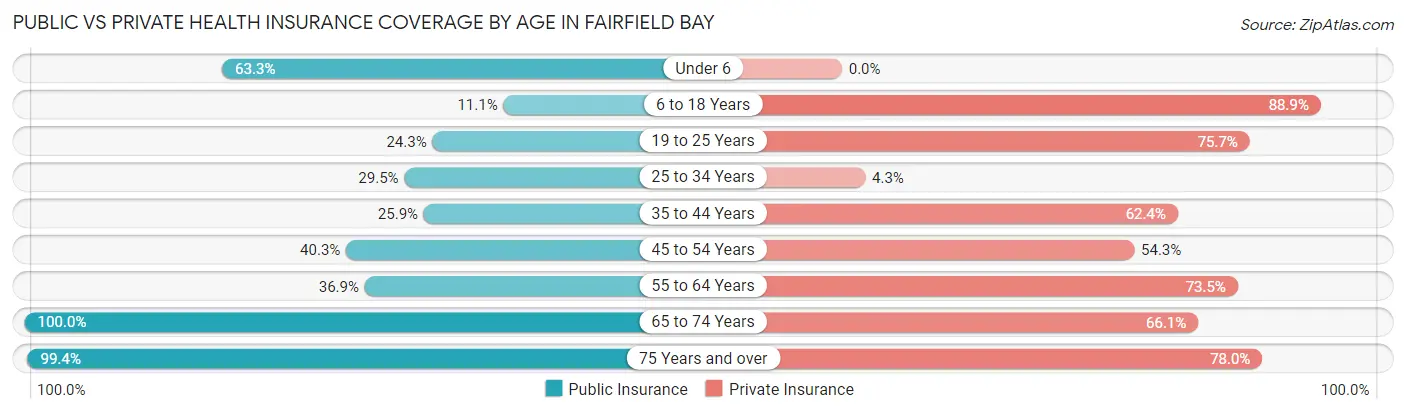
| Age Bracket | Public Insurance | Private Insurance |
| Under 6 | 19 (63.3%) | 0 (0.0%) |
| 6 to 18 Years | 10 (11.1%) | 80 (88.9%) |
| 19 to 25 Years | 17 (24.3%) | 53 (75.7%) |
| 25 to 34 Years | 41 (29.5%) | 6 (4.3%) |
| 35 to 44 Years | 22 (25.9%) | 53 (62.4%) |
| 45 to 54 Years | 52 (40.3%) | 70 (54.3%) |
| 55 to 64 Years | 164 (36.8%) | 327 (73.5%) |
| 65 to 74 Years | 561 (100.0%) | 371 (66.1%) |
| 75 Years and over | 706 (99.4%) | 554 (78.0%) |
| Total | 1,592 (70.5%) | 1,514 (67.0%) |
Disability Status by Sex by Age in Fairfield Bay
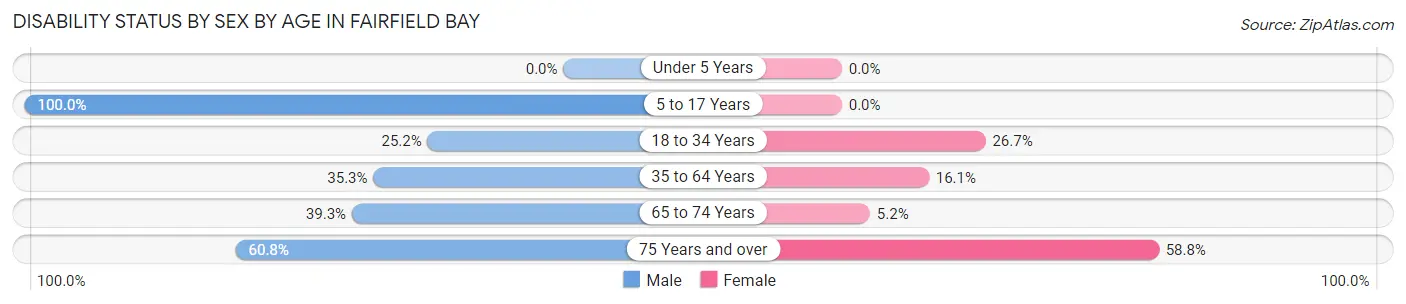
| Age Bracket | Male | Female |
| Under 5 Years | 0 (0.0%) | 0 (0.0%) |
| 5 to 17 Years | 13 (100.0%) | 0 (0.0%) |
| 18 to 34 Years | 30 (25.2%) | 28 (26.7%) |
| 35 to 64 Years | 110 (35.3%) | 56 (16.1%) |
| 65 to 74 Years | 115 (39.3%) | 14 (5.2%) |
| 75 Years and over | 132 (60.8%) | 290 (58.8%) |
Disability Class by Sex by Age in Fairfield Bay
Disability Class: Hearing Difficulty
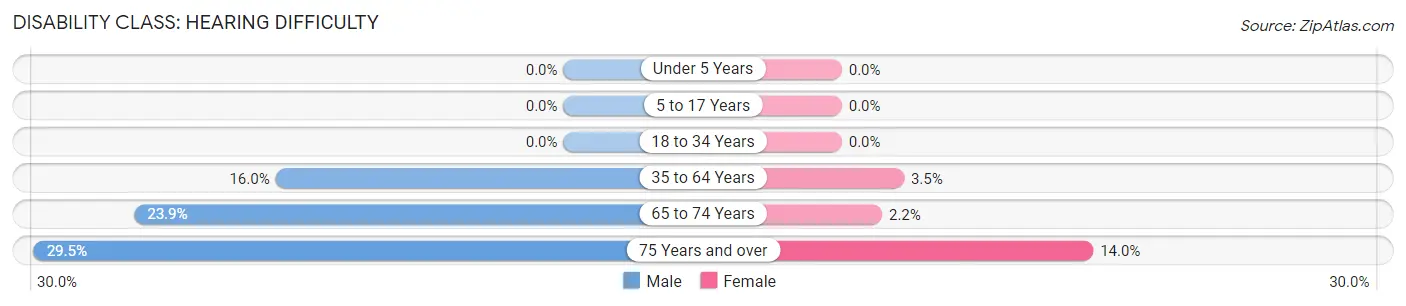
| Age Bracket | Male | Female |
| Under 5 Years | 0 (0.0%) | 0 (0.0%) |
| 5 to 17 Years | 0 (0.0%) | 0 (0.0%) |
| 18 to 34 Years | 0 (0.0%) | 0 (0.0%) |
| 35 to 64 Years | 50 (16.0%) | 12 (3.5%) |
| 65 to 74 Years | 70 (23.9%) | 6 (2.2%) |
| 75 Years and over | 64 (29.5%) | 69 (14.0%) |
Disability Class: Vision Difficulty
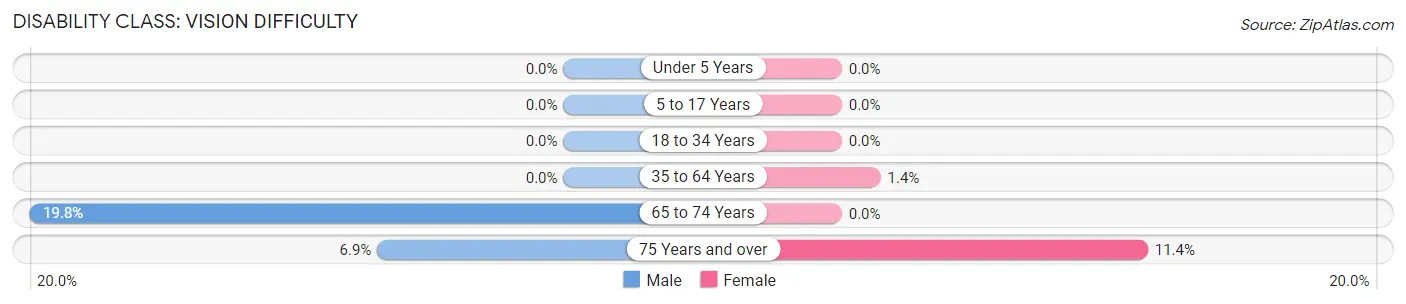
| Age Bracket | Male | Female |
| Under 5 Years | 0 (0.0%) | 0 (0.0%) |
| 5 to 17 Years | 0 (0.0%) | 0 (0.0%) |
| 18 to 34 Years | 0 (0.0%) | 0 (0.0%) |
| 35 to 64 Years | 0 (0.0%) | 5 (1.4%) |
| 65 to 74 Years | 58 (19.8%) | 0 (0.0%) |
| 75 Years and over | 15 (6.9%) | 56 (11.4%) |
Disability Class: Cognitive Difficulty
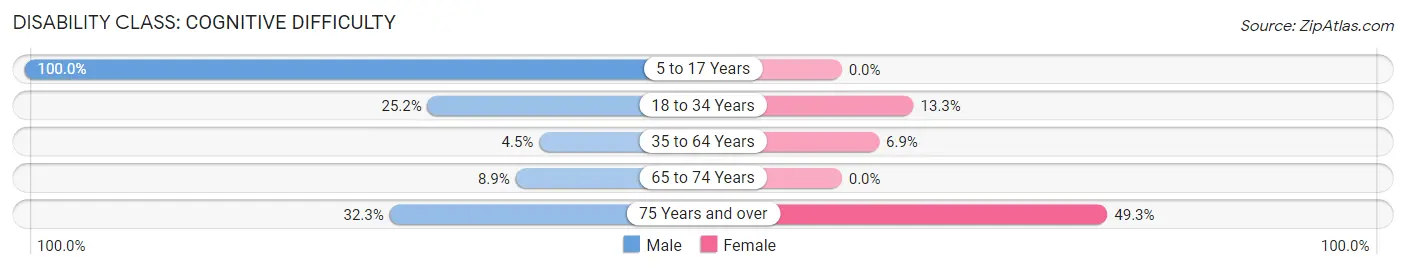
| Age Bracket | Male | Female |
| 5 to 17 Years | 13 (100.0%) | 0 (0.0%) |
| 18 to 34 Years | 30 (25.2%) | 14 (13.3%) |
| 35 to 64 Years | 14 (4.5%) | 24 (6.9%) |
| 65 to 74 Years | 26 (8.9%) | 0 (0.0%) |
| 75 Years and over | 70 (32.3%) | 243 (49.3%) |
Disability Class: Ambulatory Difficulty
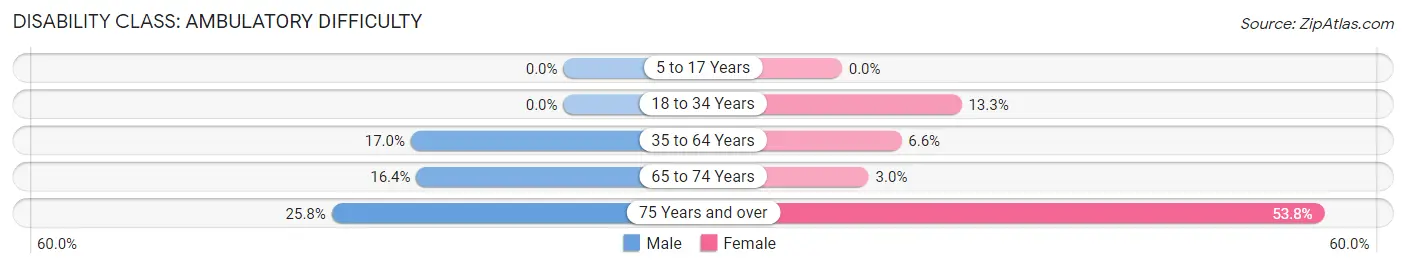
| Age Bracket | Male | Female |
| 5 to 17 Years | 0 (0.0%) | 0 (0.0%) |
| 18 to 34 Years | 0 (0.0%) | 14 (13.3%) |
| 35 to 64 Years | 53 (17.0%) | 23 (6.6%) |
| 65 to 74 Years | 48 (16.4%) | 8 (3.0%) |
| 75 Years and over | 56 (25.8%) | 265 (53.7%) |
Disability Class: Self-Care Difficulty
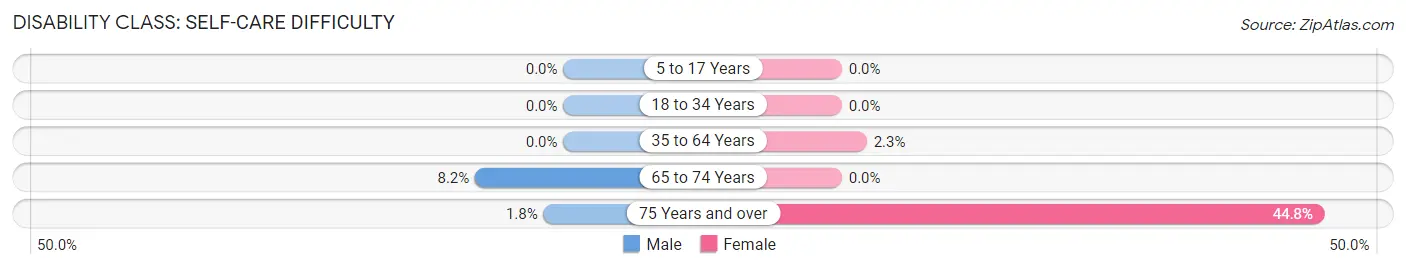
| Age Bracket | Male | Female |
| 5 to 17 Years | 0 (0.0%) | 0 (0.0%) |
| 18 to 34 Years | 0 (0.0%) | 0 (0.0%) |
| 35 to 64 Years | 0 (0.0%) | 8 (2.3%) |
| 65 to 74 Years | 24 (8.2%) | 0 (0.0%) |
| 75 Years and over | 4 (1.8%) | 221 (44.8%) |
Technology Access in Fairfield Bay
Computing Device Access in Fairfield Bay
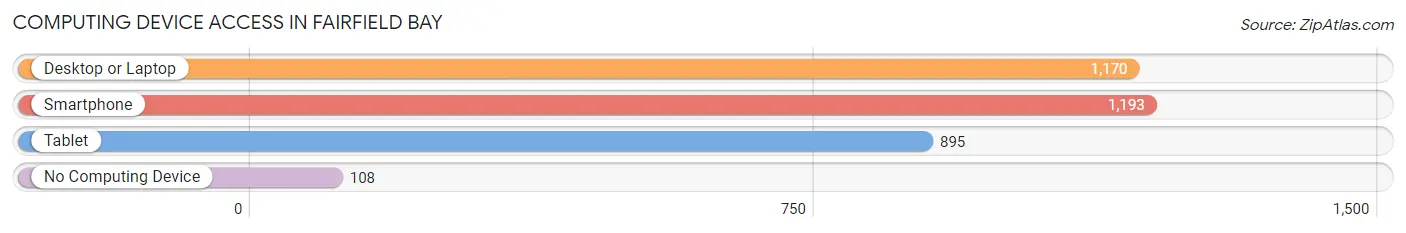
| Device Type | # Households | % Households |
| Desktop or Laptop | 1,170 | 80.0% |
| Smartphone | 1,193 | 81.6% |
| Tablet | 895 | 61.2% |
| No Computing Device | 108 | 7.4% |
| Total | 1,462 | 100.0% |
Internet Access in Fairfield Bay
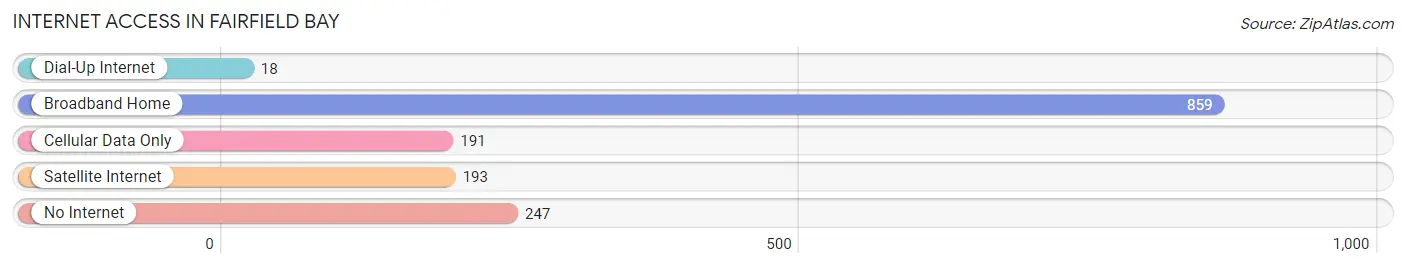
| Internet Type | # Households | % Households |
| Dial-Up Internet | 18 | 1.2% |
| Broadband Home | 859 | 58.8% |
| Cellular Data Only | 191 | 13.1% |
| Satellite Internet | 193 | 13.2% |
| No Internet | 247 | 16.9% |
| Total | 1,462 | 100.0% |
Fairfield Bay Summary
Fairfield Bay is a city located in the northern part of Van Buren County, Arkansas. It is situated on the shore of Greers Ferry Lake, a reservoir created by the Greers Ferry Dam. The city is located about 25 miles north of Heber Springs, the county seat, and about 50 miles north of Little Rock, the state capital. The population of Fairfield Bay was 2,118 at the 2010 census, an increase of 8.3% since 2000.
History
The area that is now Fairfield Bay was first settled in the early 1800s by the Osage Indians. The first white settlers arrived in the area in the 1840s, and the town was officially established in the 1950s. The city was named after the nearby Fairfield Bay, which was named after the Fairfield Plantation, a large cotton plantation owned by the family of William E. Woodruff, the founder of the Arkansas Gazette.
The city was incorporated in 1959, and the first mayor was elected in 1960. The city was developed as a resort community, and the first hotel was built in 1961. The city has since grown to include a variety of businesses, including a marina, golf course, and several restaurants.
Geography
Fairfield Bay is located at 35°30'25" North, 92°14'17" West (35.506944, -92.238056). The city is situated on the shore of Greers Ferry Lake, a reservoir created by the Greers Ferry Dam. The lake covers an area of approximately 30,000 acres and is a popular destination for fishing, boating, and other recreational activities.
The city has a total area of 4.2 square miles, all of which is land. The city is located in the Ozark Mountains, and the terrain is mostly hilly and forested.
Economy
The economy of Fairfield Bay is largely based on tourism and recreation. The city is home to a variety of businesses, including a marina, golf course, and several restaurants. The city also has a number of hotels and resorts, as well as a number of shops and other businesses.
The city is also home to a number of manufacturing and industrial businesses, including a paper mill and a plastics factory. The city is also home to a number of government offices, including the Van Buren County Courthouse and the Arkansas Department of Transportation.
Demographics
As of the 2010 census, there were 2,118 people, 890 households, and 590 families residing in the city. The population density was 503.3 people per square mile. There were 1,039 housing units at an average density of 246.7 per square mile. The racial makeup of the city was 95.2% White, 0.7% African American, 0.7% Native American, 0.7% Asian, 0.1% Pacific Islander, 0.7% from other races, and 2.0% from two or more races. Hispanic or Latino of any race were 2.2% of the population.
There were 890 households, out of which 22.2% had children under the age of 18 living with them, 51.7% were married couples living together, 10.3% had a female householder with no husband present, and 33.7% were non-families. 28.7% of all households were made up of individuals, and 11.7% had someone living alone who was 65 years of age or older. The average household size was 2.35 and the average family size was 2.86.
In the city, the population was spread out, with 20.7% under the age of 18, 6.2% from 18 to 24, 22.7% from 25 to 44, 28.7% from 45 to 64, and 21.7% who were 65 years of age or older. The median age was 45 years. For every 100 females, there were 94.2 males. For every 100 females age 18 and over, there were 91.2 males.
The median income for a household in the city was $35,938, and the median income for a family was $41,964. Males had a median income of $30,000 versus $21,250 for females. The per capita income for the city was $20,945. About 8.2% of families and 11.2% of the population were below the poverty line, including 16.2% of those under age 18 and 8.2% of those age 65 or over.
Common Questions
What is Per Capita Income in Fairfield Bay?
Per Capita income in Fairfield Bay is $43,530.
What is the Median Family Income in Fairfield Bay?
Median Family Income in Fairfield Bay is $64,652.
What is the Median Household income in Fairfield Bay?
Median Household Income in Fairfield Bay is $58,750.
What is Income or Wage Gap in Fairfield Bay?
Income or Wage Gap in Fairfield Bay is 35.2%.
Women in Fairfield Bay earn 64.8 cents for every dollar earned by a man.
What is Inequality or Gini Index in Fairfield Bay?
Inequality or Gini Index in Fairfield Bay is 0.40.
What is the Total Population of Fairfield Bay?
Total Population of Fairfield Bay is 2,291.
What is the Total Male Population of Fairfield Bay?
Total Male Population of Fairfield Bay is 980.
What is the Total Female Population of Fairfield Bay?
Total Female Population of Fairfield Bay is 1,311.
What is the Ratio of Males per 100 Females in Fairfield Bay?
There are 74.75 Males per 100 Females in Fairfield Bay.
What is the Ratio of Females per 100 Males in Fairfield Bay?
There are 133.78 Females per 100 Males in Fairfield Bay.
What is the Median Population Age in Fairfield Bay?
Median Population Age in Fairfield Bay is 68.2 Years.
What is the Average Family Size in Fairfield Bay
Average Family Size in Fairfield Bay is 2.1 People.
What is the Average Household Size in Fairfield Bay
Average Household Size in Fairfield Bay is 1.6 People.
How Large is the Labor Force in Fairfield Bay?
There are 623 People in the Labor Forcein in Fairfield Bay.
What is the Percentage of People in the Labor Force in Fairfield Bay?
28.5% of People are in the Labor Force in Fairfield Bay.
What is the Unemployment Rate in Fairfield Bay?
Unemployment Rate in Fairfield Bay is 1.6%.