Ratcliff, AR Map & Demographics
Ratcliff Map
Ratcliff Overview
$31,620
PER CAPITA INCOME
$55,417
AVG FAMILY INCOME
$51,250
AVG HOUSEHOLD INCOME
0.46
INEQUALITY / GINI INDEX
142
TOTAL POPULATION
66
MALE POPULATION
76
FEMALE POPULATION
86.84
MALES / 100 FEMALES
115.15
FEMALES / 100 MALES
46.8
MEDIAN AGE
2.9
AVG FAMILY SIZE
1.9
AVG HOUSEHOLD SIZE
77
LABOR FORCE [ PEOPLE ]
65.3%
PERCENT IN LABOR FORCE
14.3%
UNEMPLOYMENT RATE
Ratcliff Zip Codes
Ratcliff Area Codes
Income in Ratcliff
Income Overview in Ratcliff
Per Capita Income in Ratcliff is $31,620, while median incomes of families and households are $55,417 and $51,250 respectively.
| Characteristic | Number | Measure |
| Per Capita Income | 142 | $31,620 |
| Median Family Income | 31 | $55,417 |
| Mean Family Income | 31 | $76,777 |
| Median Household Income | 75 | $51,250 |
| Mean Household Income | 75 | $58,203 |
| Income Deficit | 31 | $0 |
| Wage / Income Gap (%) | 142 | 0.00% |
| Wage / Income Gap ($) | 142 | 100.00¢ per $1 |
| Gini / Inequality Index | 142 | 0.46 |
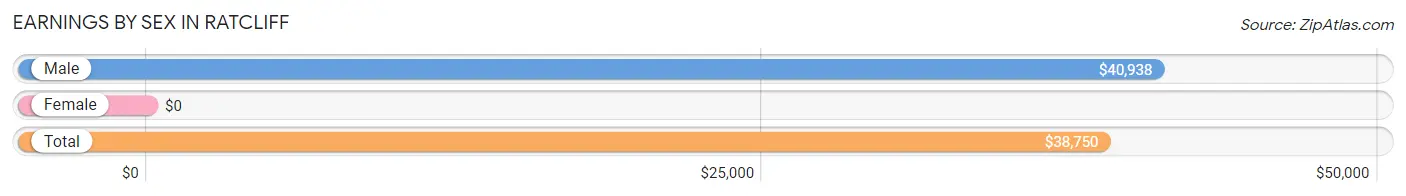
Earnings by Sex in Ratcliff
| Sex | Number | Average Earnings |
| Male | 33 (41.2%) | $40,938 |
| Female | 47 (58.8%) | $0 |
| Total | 80 (100.0%) | $38,750 |
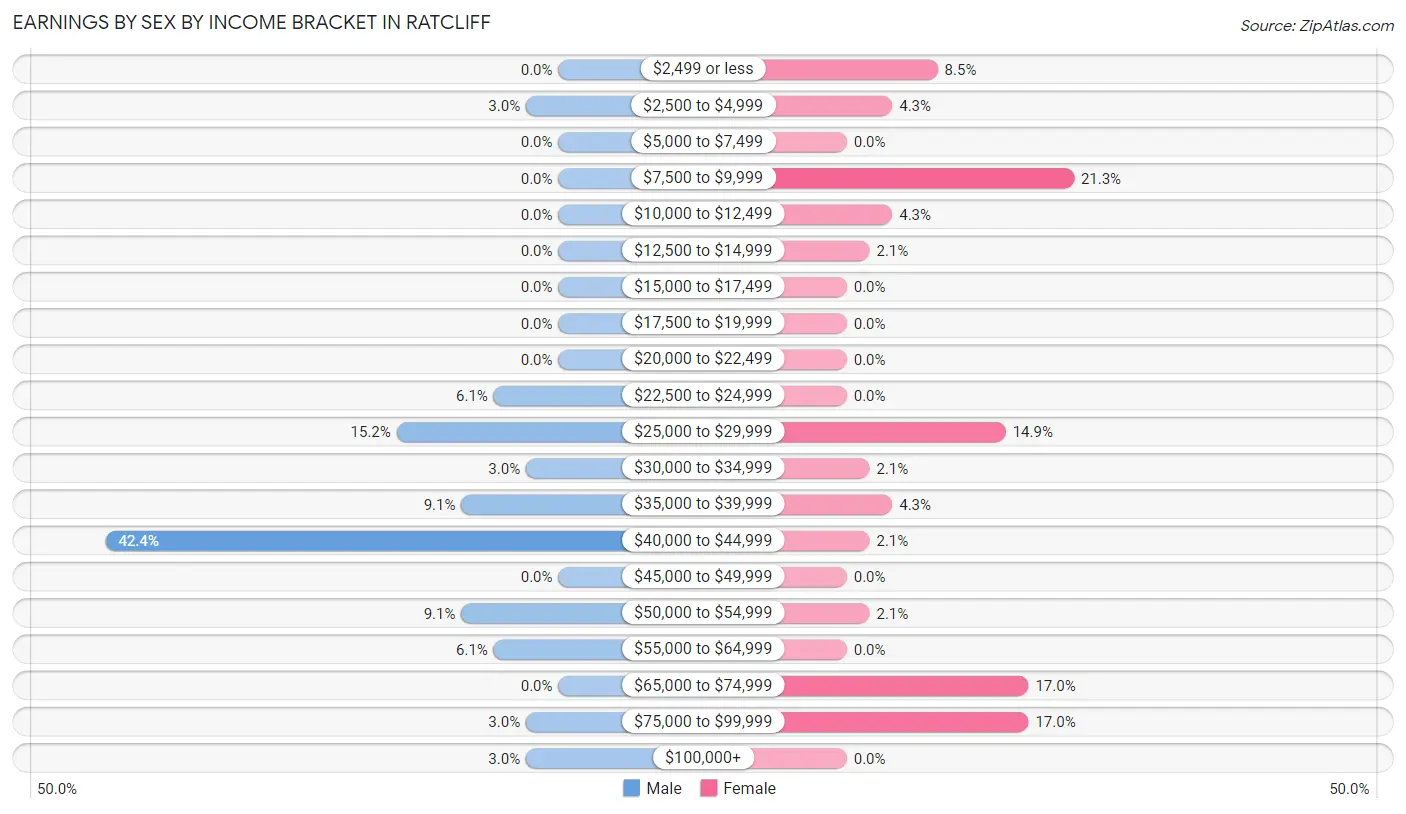
Earnings by Sex by Income Bracket in Ratcliff
The most common earnings brackets in Ratcliff are $40,000 to $44,999 for men (14 | 42.4%) and $7,500 to $9,999 for women (10 | 21.3%).
| Income | Male | Female |
| $2,499 or less | 0 (0.0%) | 4 (8.5%) |
| $2,500 to $4,999 | 1 (3.0%) | 2 (4.3%) |
| $5,000 to $7,499 | 0 (0.0%) | 0 (0.0%) |
| $7,500 to $9,999 | 0 (0.0%) | 10 (21.3%) |
| $10,000 to $12,499 | 0 (0.0%) | 2 (4.3%) |
| $12,500 to $14,999 | 0 (0.0%) | 1 (2.1%) |
| $15,000 to $17,499 | 0 (0.0%) | 0 (0.0%) |
| $17,500 to $19,999 | 0 (0.0%) | 0 (0.0%) |
| $20,000 to $22,499 | 0 (0.0%) | 0 (0.0%) |
| $22,500 to $24,999 | 2 (6.1%) | 0 (0.0%) |
| $25,000 to $29,999 | 5 (15.1%) | 7 (14.9%) |
| $30,000 to $34,999 | 1 (3.0%) | 1 (2.1%) |
| $35,000 to $39,999 | 3 (9.1%) | 2 (4.3%) |
| $40,000 to $44,999 | 14 (42.4%) | 1 (2.1%) |
| $45,000 to $49,999 | 0 (0.0%) | 0 (0.0%) |
| $50,000 to $54,999 | 3 (9.1%) | 1 (2.1%) |
| $55,000 to $64,999 | 2 (6.1%) | 0 (0.0%) |
| $65,000 to $74,999 | 0 (0.0%) | 8 (17.0%) |
| $75,000 to $99,999 | 1 (3.0%) | 8 (17.0%) |
| $100,000+ | 1 (3.0%) | 0 (0.0%) |
| Total | 33 (100.0%) | 47 (100.0%) |
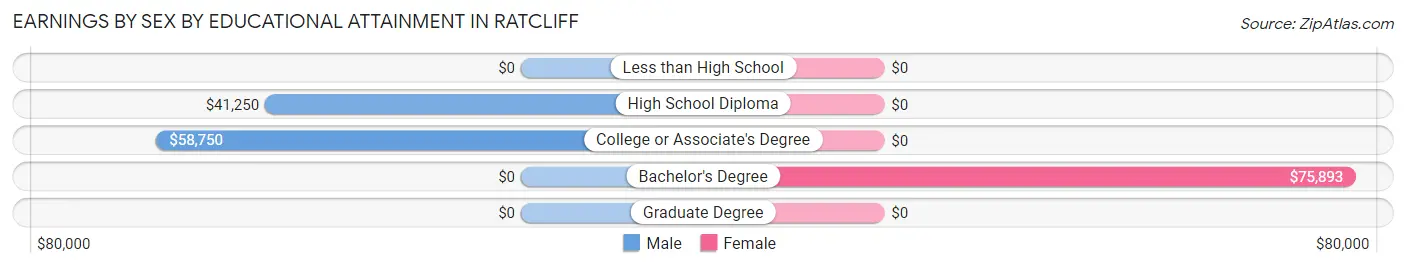
Earnings by Sex by Educational Attainment in Ratcliff
| Educational Attainment | Male Income | Female Income |
| Less than High School | - | - |
| High School Diploma | $41,250 | $0 |
| College or Associate's Degree | $58,750 | $0 |
| Bachelor's Degree | - | - |
| Graduate Degree | - | - |
| Total | $41,563 | $0 |
Family Income in Ratcliff
Family Income Brackets in Ratcliff
According to the Ratcliff family income data, there are 8 families falling into the $35,000 to $49,999 income range, which is the most common income bracket and makes up 25.8% of all families.
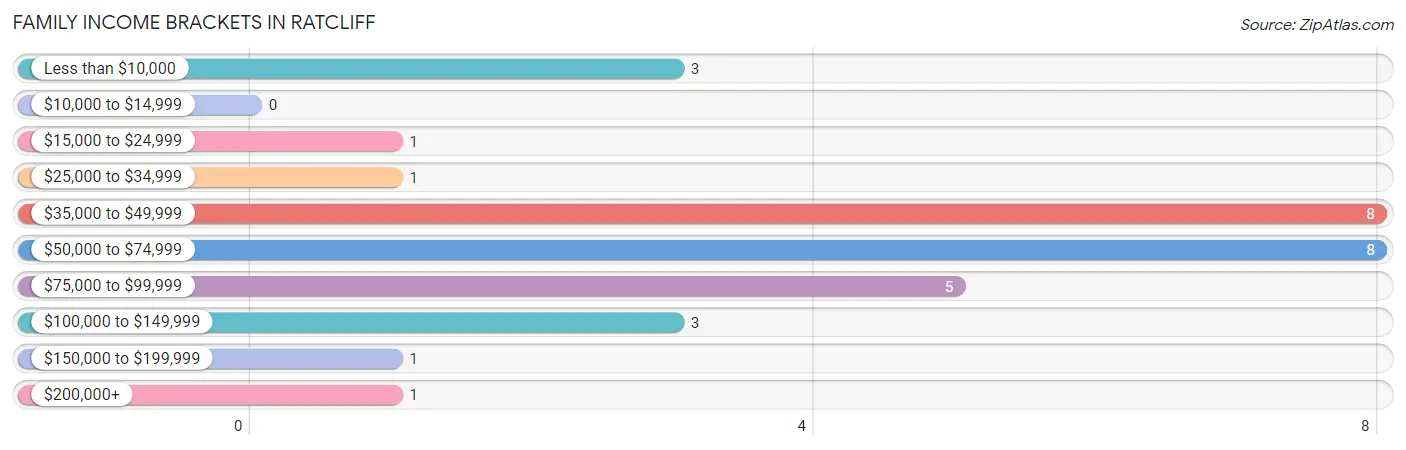
| Income Bracket | # Families | % Families |
| Less than $10,000 | 3 | 9.7% |
| $10,000 to $14,999 | 0 | 0.0% |
| $15,000 to $24,999 | 1 | 3.2% |
| $25,000 to $34,999 | 1 | 3.2% |
| $35,000 to $49,999 | 8 | 25.8% |
| $50,000 to $74,999 | 8 | 25.8% |
| $75,000 to $99,999 | 5 | 16.1% |
| $100,000 to $149,999 | 3 | 9.7% |
| $150,000 to $199,999 | 1 | 3.2% |
| $200,000+ | 1 | 3.2% |
Family Income by Famaliy Size in Ratcliff
2-person families (20 | 64.5%) account for the highest median family income in Ratcliff with $70,000 per family, while 2-person families (20 | 64.5%) have the highest median income of $35,000 per family member.
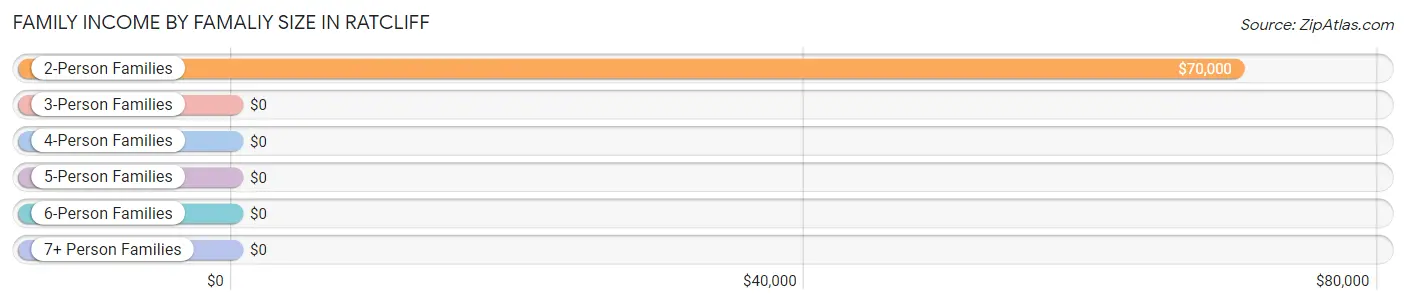
| Income Bracket | # Families | Median Income |
| 2-Person Families | 20 (64.5%) | $70,000 |
| 3-Person Families | 2 (6.5%) | $0 |
| 4-Person Families | 3 (9.7%) | $0 |
| 5-Person Families | 3 (9.7%) | $0 |
| 6-Person Families | 3 (9.7%) | $0 |
| 7+ Person Families | 0 (0.0%) | $0 |
| Total | 31 (100.0%) | $55,417 |
Family Income by Number of Earners in Ratcliff
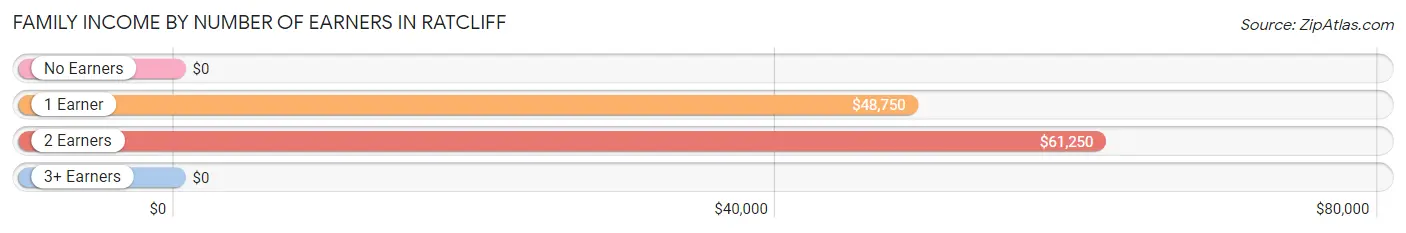
| Number of Earners | # Families | Median Income |
| No Earners | 5 (16.1%) | $0 |
| 1 Earner | 16 (51.6%) | $48,750 |
| 2 Earners | 9 (29.0%) | $61,250 |
| 3+ Earners | 1 (3.2%) | $0 |
| Total | 31 (100.0%) | $55,417 |
Household Income in Ratcliff
Household Income Brackets in Ratcliff
With 16 households falling in the category, the less than $10,000 income range is the most frequent in Ratcliff, accounting for 21.3% of all households.
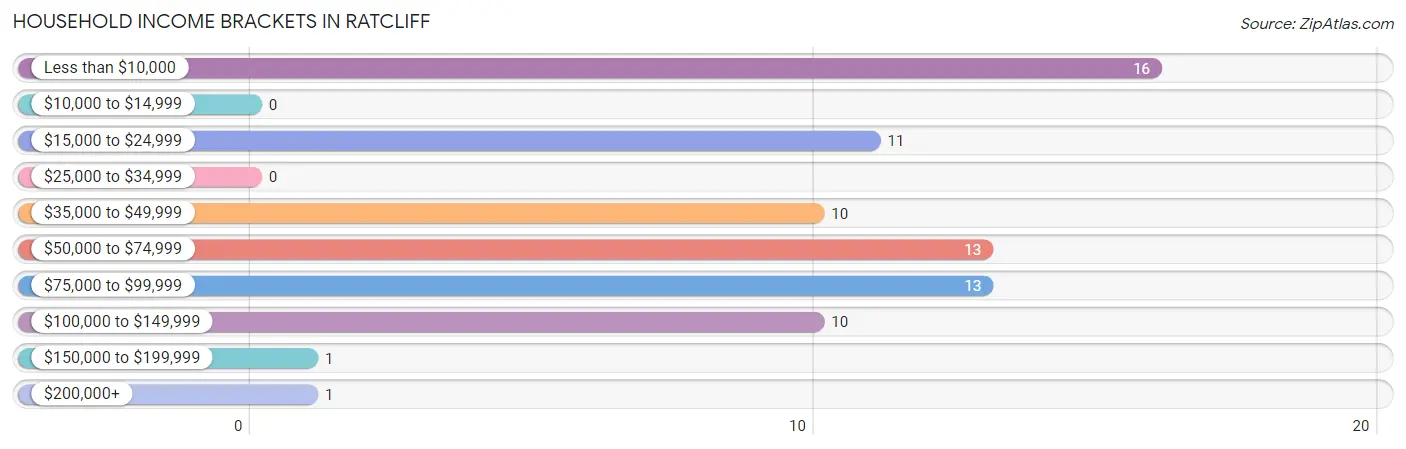
| Income Bracket | # Households | % Households |
| Less than $10,000 | 16 | 21.3% |
| $10,000 to $14,999 | 0 | 0.0% |
| $15,000 to $24,999 | 11 | 14.7% |
| $25,000 to $34,999 | 0 | 0.0% |
| $35,000 to $49,999 | 10 | 13.3% |
| $50,000 to $74,999 | 13 | 17.3% |
| $75,000 to $99,999 | 13 | 17.3% |
| $100,000 to $149,999 | 10 | 13.3% |
| $150,000 to $199,999 | 1 | 1.3% |
| $200,000+ | 1 | 1.3% |
Household Income by Householder Age in Ratcliff
The median household income in Ratcliff is $51,250, with the highest median household income of $76,250 found in the 45 to 64 years age bracket for the primary householder. A total of 27 households (36.0%) fall into this category. Meanwhile, the 15 to 24 years age bracket for the primary householder has the lowest median household income of $0, with 3 households (4.0%) in this group.
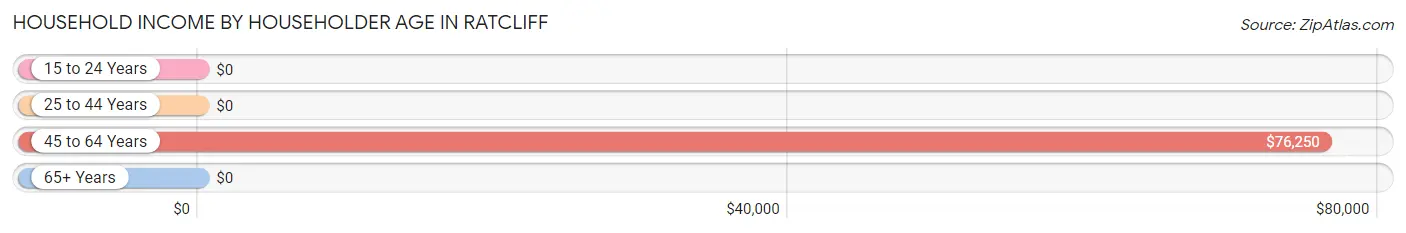
| Income Bracket | # Households | Median Income |
| 15 to 24 Years | 3 (4.0%) | $0 |
| 25 to 44 Years | 22 (29.3%) | $0 |
| 45 to 64 Years | 27 (36.0%) | $76,250 |
| 65+ Years | 23 (30.7%) | $0 |
| Total | 75 (100.0%) | $51,250 |
Poverty in Ratcliff
Income Below Poverty by Sex and Age in Ratcliff
With 12.1% poverty level for males and 19.7% for females among the residents of Ratcliff, 5 year old males and 6 to 11 year old females are the most vulnerable to poverty, with 3 males (100.0%) and 2 females (100.0%) in their respective age groups living below the poverty level.
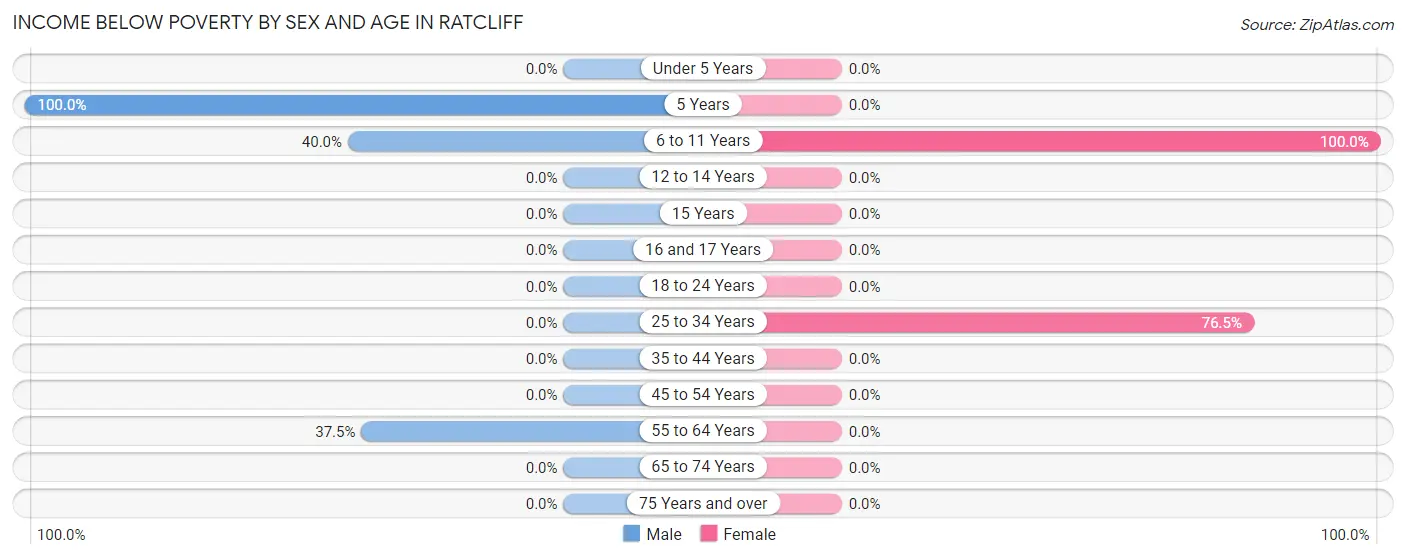
| Age Bracket | Male | Female |
| Under 5 Years | 0 (0.0%) | 0 (0.0%) |
| 5 Years | 3 (100.0%) | 0 (0.0%) |
| 6 to 11 Years | 2 (40.0%) | 2 (100.0%) |
| 12 to 14 Years | 0 (0.0%) | 0 (0.0%) |
| 15 Years | 0 (0.0%) | 0 (0.0%) |
| 16 and 17 Years | 0 (0.0%) | 0 (0.0%) |
| 18 to 24 Years | 0 (0.0%) | 0 (0.0%) |
| 25 to 34 Years | 0 (0.0%) | 13 (76.5%) |
| 35 to 44 Years | 0 (0.0%) | 0 (0.0%) |
| 45 to 54 Years | 0 (0.0%) | 0 (0.0%) |
| 55 to 64 Years | 3 (37.5%) | 0 (0.0%) |
| 65 to 74 Years | 0 (0.0%) | 0 (0.0%) |
| 75 Years and over | 0 (0.0%) | 0 (0.0%) |
| Total | 8 (12.1%) | 15 (19.7%) |
Income Above Poverty by Sex and Age in Ratcliff
According to the poverty statistics in Ratcliff, males aged under 5 years and females aged under 5 years are the age groups that are most secure financially, with 100.0% of males and 100.0% of females in these age groups living above the poverty line.
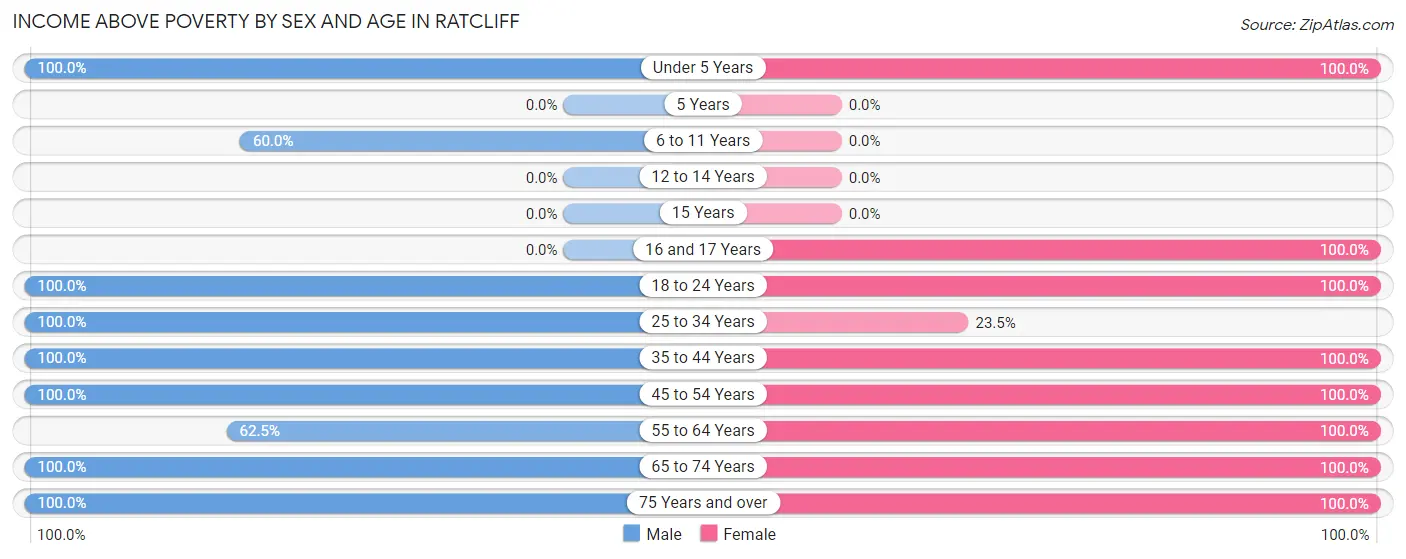
| Age Bracket | Male | Female |
| Under 5 Years | 7 (100.0%) | 7 (100.0%) |
| 5 Years | 0 (0.0%) | 0 (0.0%) |
| 6 to 11 Years | 3 (60.0%) | 0 (0.0%) |
| 12 to 14 Years | 0 (0.0%) | 0 (0.0%) |
| 15 Years | 0 (0.0%) | 0 (0.0%) |
| 16 and 17 Years | 0 (0.0%) | 1 (100.0%) |
| 18 to 24 Years | 6 (100.0%) | 2 (100.0%) |
| 25 to 34 Years | 5 (100.0%) | 4 (23.5%) |
| 35 to 44 Years | 5 (100.0%) | 4 (100.0%) |
| 45 to 54 Years | 9 (100.0%) | 18 (100.0%) |
| 55 to 64 Years | 5 (62.5%) | 5 (100.0%) |
| 65 to 74 Years | 7 (100.0%) | 11 (100.0%) |
| 75 Years and over | 11 (100.0%) | 9 (100.0%) |
| Total | 58 (87.9%) | 61 (80.3%) |
Income Below Poverty Among Married-Couple Families in Ratcliff
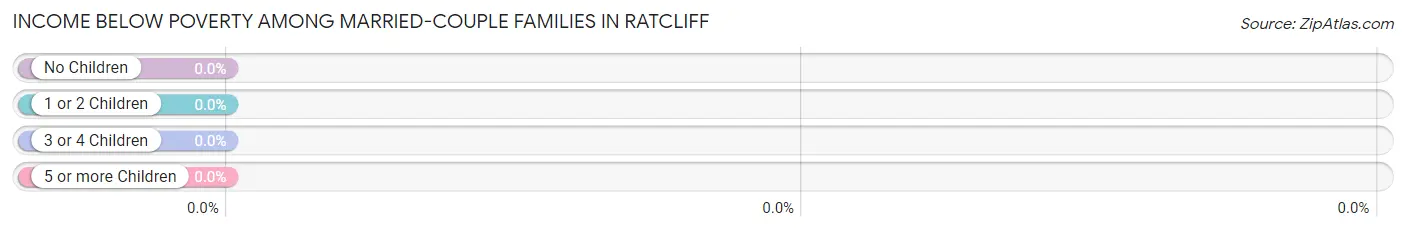
| Children | Above Poverty | Below Poverty |
| No Children | 20 (100.0%) | 0 (0.0%) |
| 1 or 2 Children | 3 (100.0%) | 0 (0.0%) |
| 3 or 4 Children | 3 (100.0%) | 0 (0.0%) |
| 5 or more Children | 0 (0.0%) | 0 (0.0%) |
| Total | 26 (100.0%) | 0 (0.0%) |
Income Below Poverty Among Single-Parent Households in Ratcliff
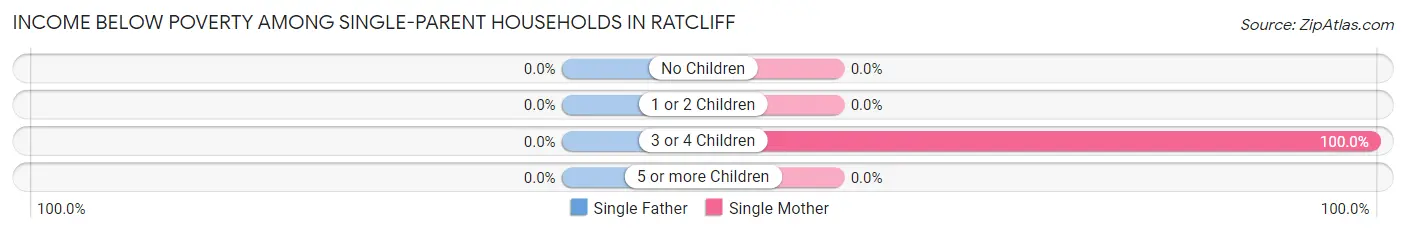
| Children | Single Father | Single Mother |
| No Children | 0 (0.0%) | 0 (0.0%) |
| 1 or 2 Children | 0 (0.0%) | 0 (0.0%) |
| 3 or 4 Children | 0 (0.0%) | 3 (100.0%) |
| 5 or more Children | 0 (0.0%) | 0 (0.0%) |
| Total | 0 (0.0%) | 3 (60.0%) |
Income Below Poverty Among Married-Couple vs Single-Parent Households in Ratcliff
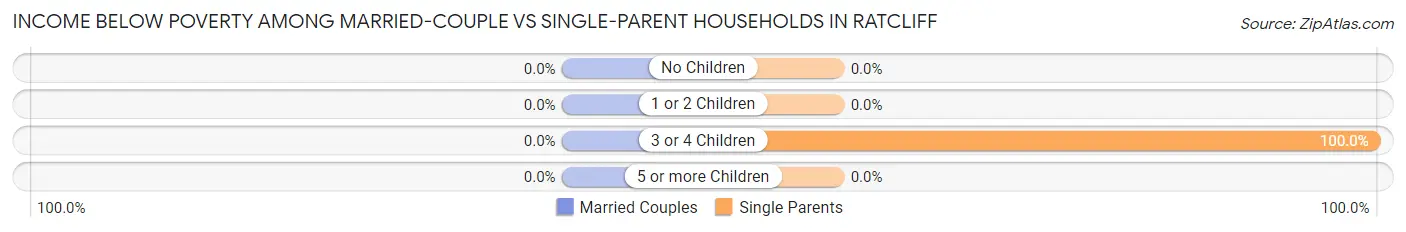
| Children | Married-Couple Families | Single-Parent Households |
| No Children | 0 (0.0%) | 0 (0.0%) |
| 1 or 2 Children | 0 (0.0%) | 0 (0.0%) |
| 3 or 4 Children | 0 (0.0%) | 3 (100.0%) |
| 5 or more Children | 0 (0.0%) | 0 (0.0%) |
| Total | 0 (0.0%) | 3 (60.0%) |
Race in Ratcliff
The most populous races in Ratcliff are White / Caucasian (136 | 95.8%), Asian (3 | 2.1%), and Two or more Races (2 | 1.4%).
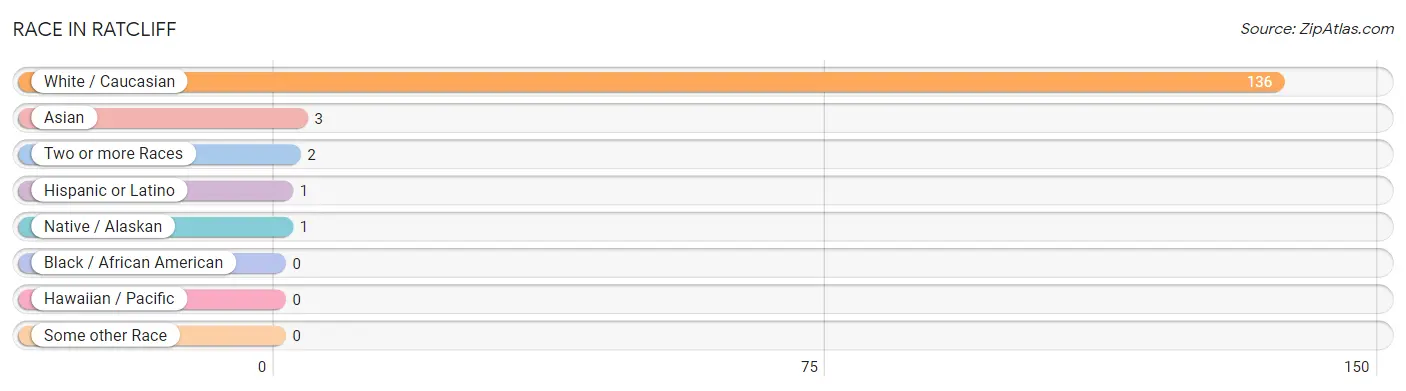
| Race | # Population | % Population |
| Asian | 3 | 2.1% |
| Black / African American | 0 | 0.0% |
| Hawaiian / Pacific | 0 | 0.0% |
| Hispanic or Latino | 1 | 0.7% |
| Native / Alaskan | 1 | 0.7% |
| White / Caucasian | 136 | 95.8% |
| Two or more Races | 2 | 1.4% |
| Some other Race | 0 | 0.0% |
| Total | 142 | 100.0% |
Ancestry in Ratcliff
The most populous ancestries reported in Ratcliff are Irish (15 | 10.6%), German (11 | 7.7%), American (6 | 4.2%), English (4 | 2.8%), and Korean (3 | 2.1%), together accounting for 27.5% of all Ratcliff residents.
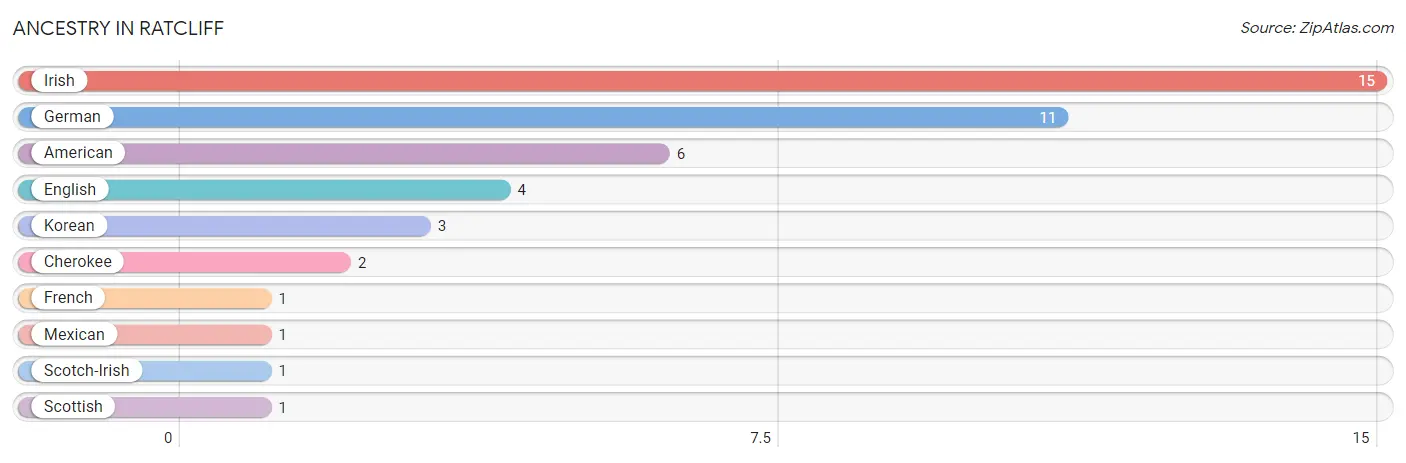
| Ancestry | # Population | % Population |
| American | 6 | 4.2% |
| Cherokee | 2 | 1.4% |
| English | 4 | 2.8% |
| French | 1 | 0.7% |
| German | 11 | 7.7% |
| Irish | 15 | 10.6% |
| Korean | 3 | 2.1% |
| Mexican | 1 | 0.7% |
| Scotch-Irish | 1 | 0.7% |
| Scottish | 1 | 0.7% | View All 10 Rows |
Immigrants in Ratcliff
The most numerous immigrant groups reported in Ratcliff came from Asia (2 | 1.4%), Philippines (2 | 1.4%), and South Eastern Asia (2 | 1.4%), together accounting for 4.2% of all Ratcliff residents.
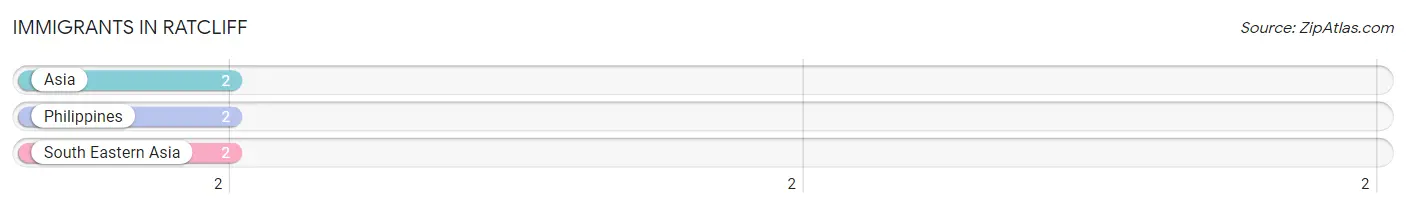
| Immigration Origin | # Population | % Population |
| Asia | 2 | 1.4% |
| Philippines | 2 | 1.4% |
| South Eastern Asia | 2 | 1.4% | View All 3 Rows |
Sex and Age in Ratcliff
Sex and Age in Ratcliff
The most populous age groups in Ratcliff are 80 to 84 Years (8 | 12.1%) for men and 25 to 29 Years (14 | 18.4%) for women.
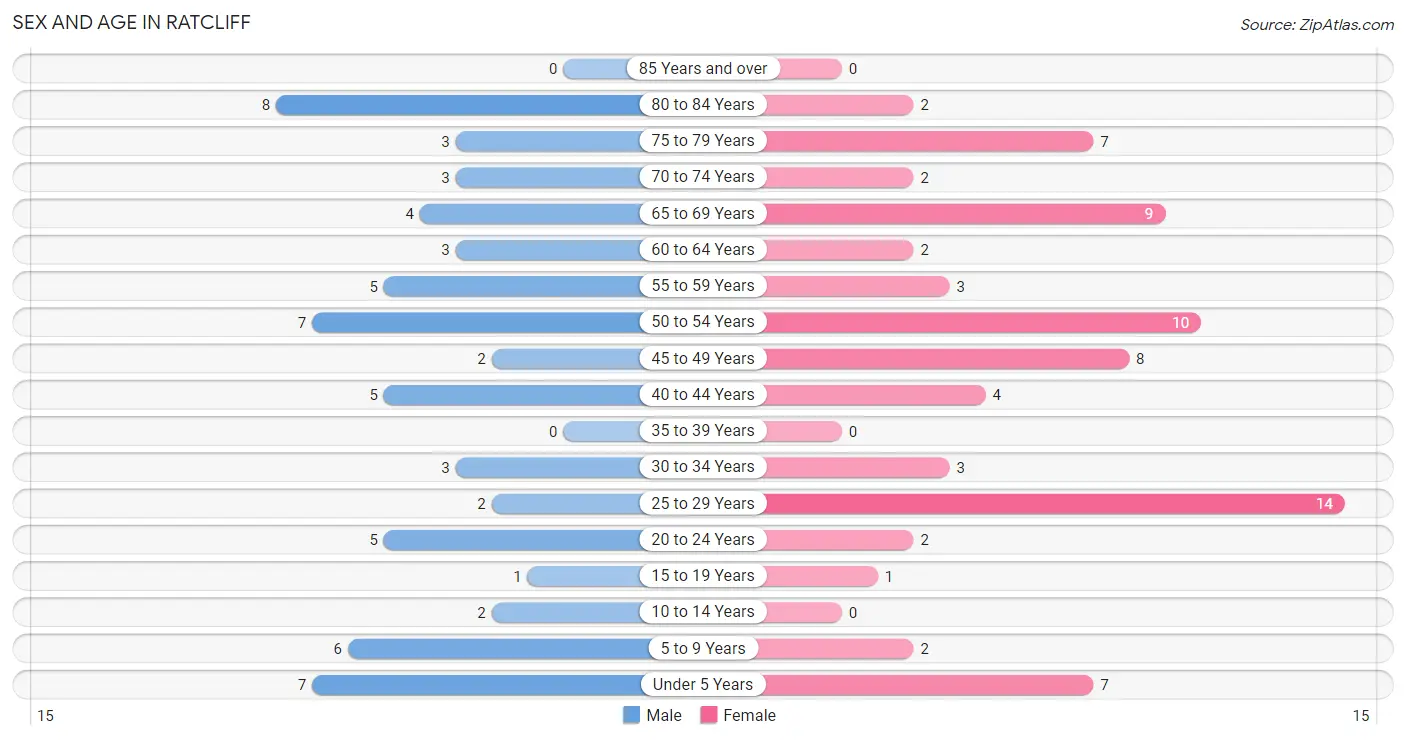
| Age Bracket | Male | Female |
| Under 5 Years | 7 (10.6%) | 7 (9.2%) |
| 5 to 9 Years | 6 (9.1%) | 2 (2.6%) |
| 10 to 14 Years | 2 (3.0%) | 0 (0.0%) |
| 15 to 19 Years | 1 (1.5%) | 1 (1.3%) |
| 20 to 24 Years | 5 (7.6%) | 2 (2.6%) |
| 25 to 29 Years | 2 (3.0%) | 14 (18.4%) |
| 30 to 34 Years | 3 (4.5%) | 3 (4.0%) |
| 35 to 39 Years | 0 (0.0%) | 0 (0.0%) |
| 40 to 44 Years | 5 (7.6%) | 4 (5.3%) |
| 45 to 49 Years | 2 (3.0%) | 8 (10.5%) |
| 50 to 54 Years | 7 (10.6%) | 10 (13.2%) |
| 55 to 59 Years | 5 (7.6%) | 3 (4.0%) |
| 60 to 64 Years | 3 (4.5%) | 2 (2.6%) |
| 65 to 69 Years | 4 (6.1%) | 9 (11.8%) |
| 70 to 74 Years | 3 (4.5%) | 2 (2.6%) |
| 75 to 79 Years | 3 (4.5%) | 7 (9.2%) |
| 80 to 84 Years | 8 (12.1%) | 2 (2.6%) |
| 85 Years and over | 0 (0.0%) | 0 (0.0%) |
| Total | 66 (100.0%) | 76 (100.0%) |
Families and Households in Ratcliff
Median Family Size in Ratcliff
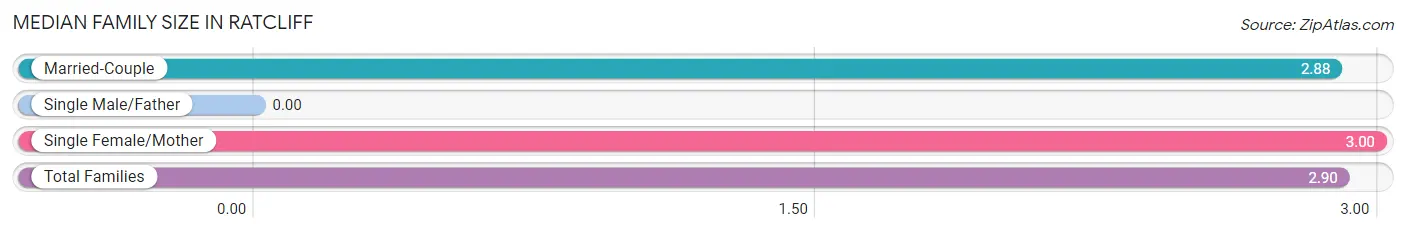
| Family Type | # Families | Family Size |
| Married-Couple | 26 (83.9%) | 2.88 |
| Single Male/Father | 0 (0.0%) | - |
| Single Female/Mother | 5 (16.1%) | 3.00 |
| Total Families | 31 (100.0%) | 2.90 |
Median Household Size in Ratcliff
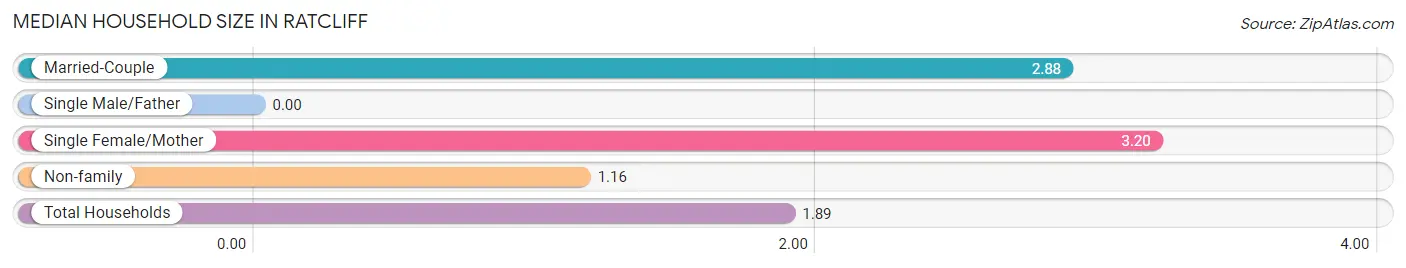
| Household Type | # Households | Household Size |
| Married-Couple | 26 (34.7%) | 2.88 |
| Single Male/Father | 0 (0.0%) | - |
| Single Female/Mother | 5 (6.7%) | 3.20 |
| Non-family | 44 (58.7%) | 1.16 |
| Total Households | 75 (100.0%) | 1.89 |
Household Size by Marriage Status in Ratcliff
Out of a total of 75 households in Ratcliff, 31 (41.3%) are family households, while 44 (58.7%) are nonfamily households. The most numerous type of family households are 2-person households, comprising 19, and the most common type of nonfamily households are 1-person households, comprising 37.
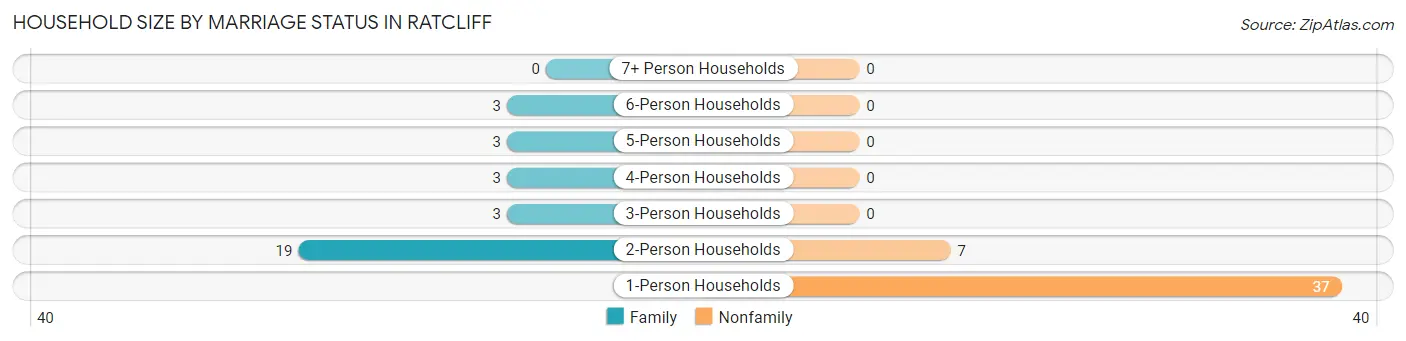
| Household Size | Family Households | Nonfamily Households |
| 1-Person Households | - | 37 (49.3%) |
| 2-Person Households | 19 (25.3%) | 7 (9.3%) |
| 3-Person Households | 3 (4.0%) | 0 (0.0%) |
| 4-Person Households | 3 (4.0%) | 0 (0.0%) |
| 5-Person Households | 3 (4.0%) | 0 (0.0%) |
| 6-Person Households | 3 (4.0%) | 0 (0.0%) |
| 7+ Person Households | 0 (0.0%) | 0 (0.0%) |
| Total | 31 (41.3%) | 44 (58.7%) |
Female Fertility in Ratcliff
Fertility by Age in Ratcliff
Average fertility rate in Ratcliff is 154.0 births per 1,000 women. Women in the age bracket of 20 to 34 years have the highest fertility rate with 316.0 births per 1,000 women. Women in the age bracket of 20 to 34 years acount for 100.0% of all women with births.
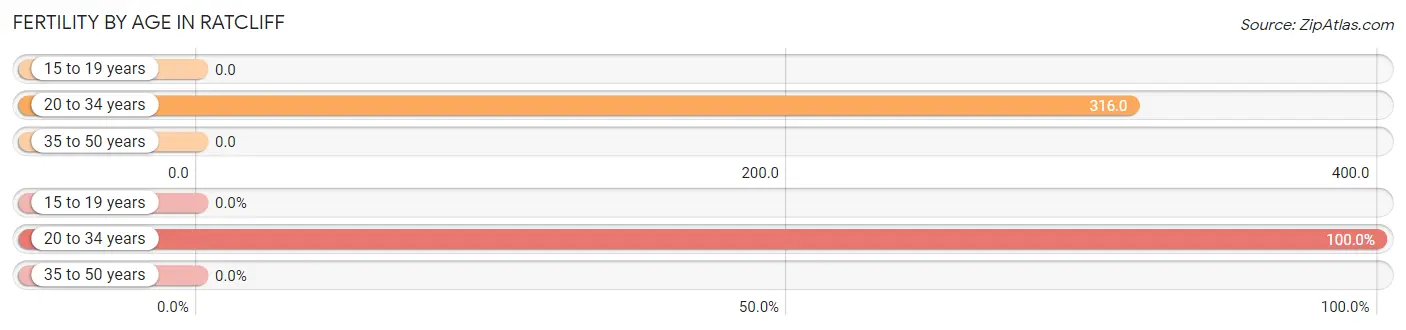
| Age Bracket | Women with Births | Births / 1,000 Women |
| 15 to 19 years | 0 (0.0%) | 0.0 |
| 20 to 34 years | 6 (100.0%) | 316.0 |
| 35 to 50 years | 0 (0.0%) | 0.0 |
| Total | 6 (100.0%) | 154.0 |
Fertility by Age by Marriage Status in Ratcliff
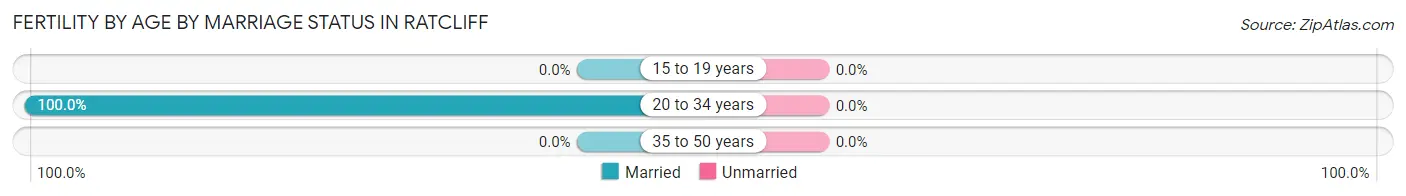
| Age Bracket | Married | Unmarried |
| 15 to 19 years | 0 (0.0%) | 0 (0.0%) |
| 20 to 34 years | 6 (100.0%) | 0 (0.0%) |
| 35 to 50 years | 0 (0.0%) | 0 (0.0%) |
| Total | 6 (100.0%) | 0 (0.0%) |
Fertility by Education in Ratcliff
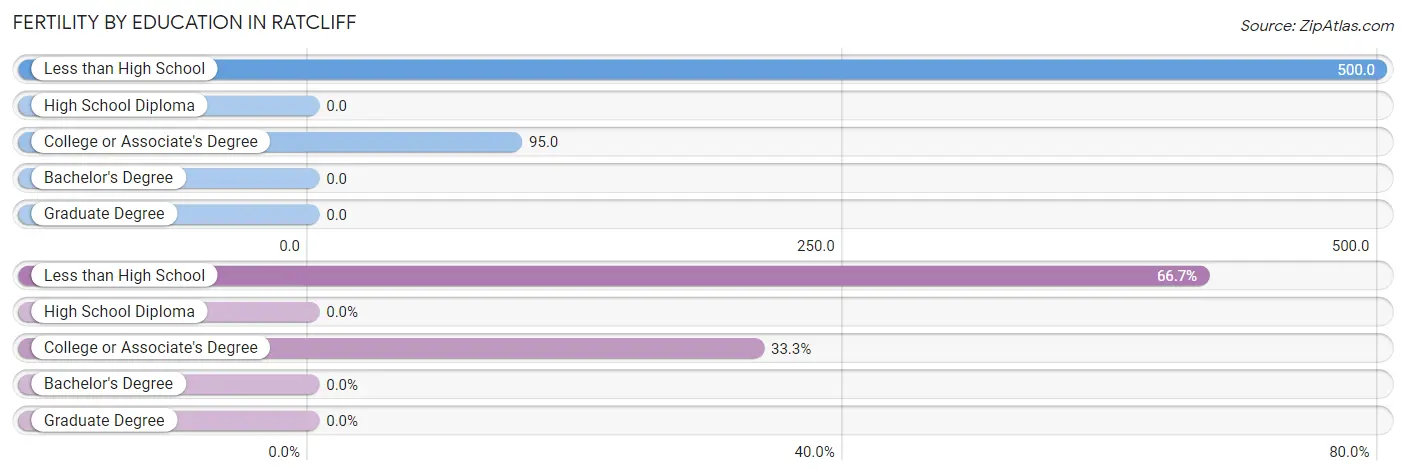
| Educational Attainment | Women with Births | Births / 1,000 Women |
| Less than High School | 4 (66.7%) | 500.0 |
| High School Diploma | 0 (0.0%) | 0.0 |
| College or Associate's Degree | 2 (33.3%) | 95.0 |
| Bachelor's Degree | 0 (0.0%) | 0.0 |
| Graduate Degree | 0 (0.0%) | 0.0 |
| Total | 6 (100.0%) | 154.0 |
Fertility by Education by Marriage Status in Ratcliff
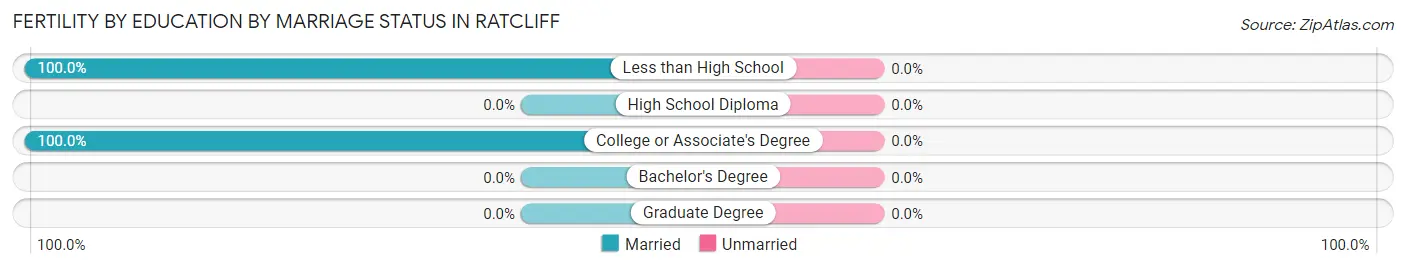
| Educational Attainment | Married | Unmarried |
| Less than High School | 4 (100.0%) | 0 (0.0%) |
| High School Diploma | 0 (0.0%) | 0 (0.0%) |
| College or Associate's Degree | 2 (100.0%) | 0 (0.0%) |
| Bachelor's Degree | 0 (0.0%) | 0 (0.0%) |
| Graduate Degree | 0 (0.0%) | 0 (0.0%) |
| Total | 6 (100.0%) | 0 (0.0%) |
Employment Characteristics in Ratcliff
Employment by Class of Employer in Ratcliff
Among the 66 employed individuals in Ratcliff, private company employees (19 | 28.8%), not-for-profit organizations (13 | 19.7%), and local government employees (13 | 19.7%) make up the most common classes of employment.
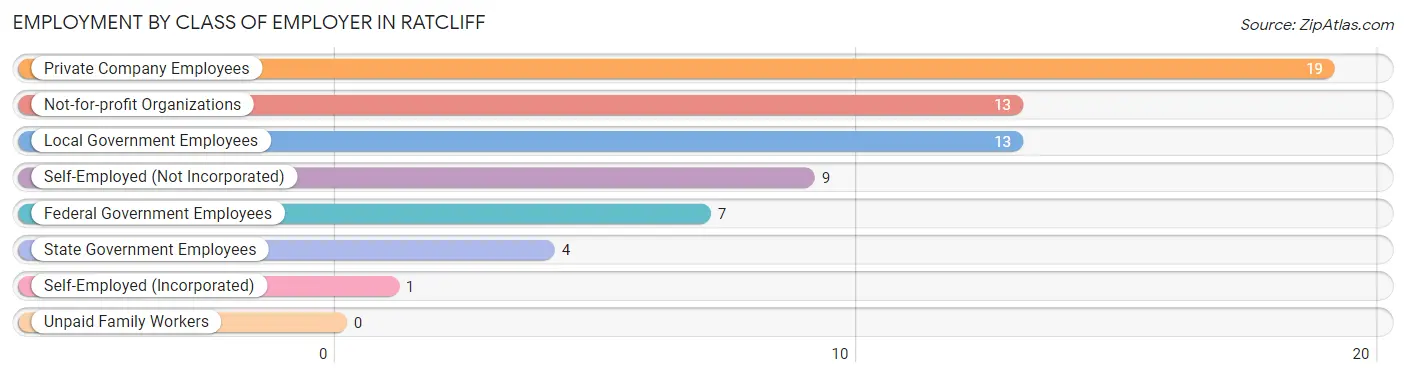
| Employer Class | # Employees | % Employees |
| Private Company Employees | 19 | 28.8% |
| Self-Employed (Incorporated) | 1 | 1.5% |
| Self-Employed (Not Incorporated) | 9 | 13.6% |
| Not-for-profit Organizations | 13 | 19.7% |
| Local Government Employees | 13 | 19.7% |
| State Government Employees | 4 | 6.1% |
| Federal Government Employees | 7 | 10.6% |
| Unpaid Family Workers | 0 | 0.0% |
| Total | 66 | 100.0% |
Employment Status by Age in Ratcliff
According to the labor force statistics for Ratcliff, out of the total population over 16 years of age (118), 65.3% or 77 individuals are in the labor force, with 14.3% or 11 of them unemployed. The age group with the highest labor force participation rate is 16 to 19 years, with 100.0% or 2 individuals in the labor force. Within the labor force, the 25 to 29 years age range has the highest percentage of unemployed individuals, with 83.3% or 10 of them being unemployed.
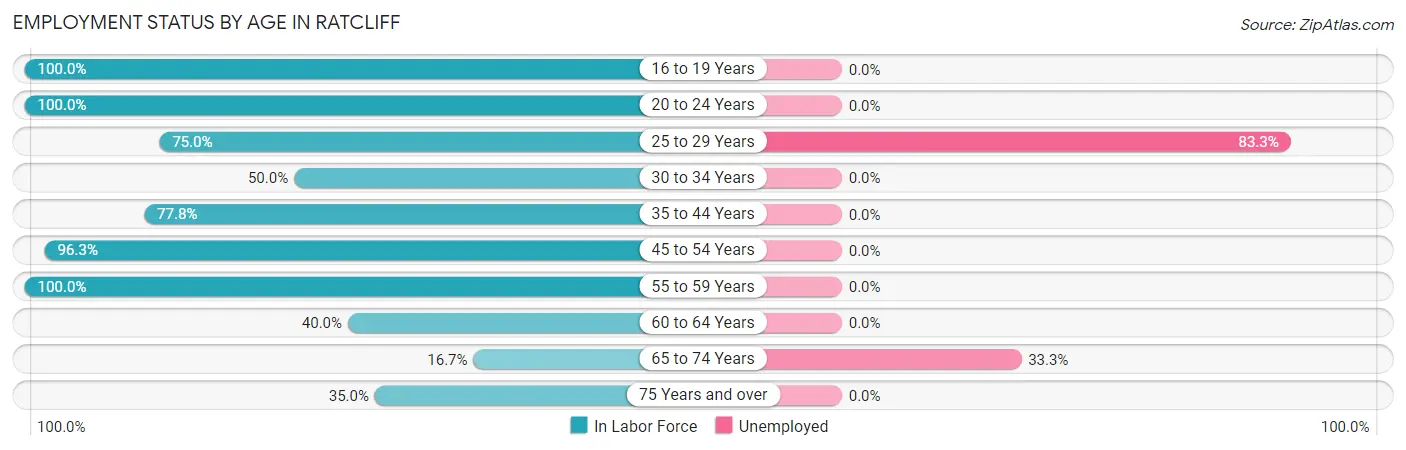
| Age Bracket | In Labor Force | Unemployed |
| 16 to 19 Years | 2 (100.0%) | 0 (0.0%) |
| 20 to 24 Years | 7 (100.0%) | 0 (0.0%) |
| 25 to 29 Years | 12 (75.0%) | 10 (83.3%) |
| 30 to 34 Years | 3 (50.0%) | 0 (0.0%) |
| 35 to 44 Years | 7 (77.8%) | 0 (0.0%) |
| 45 to 54 Years | 26 (96.3%) | 0 (0.0%) |
| 55 to 59 Years | 8 (100.0%) | 0 (0.0%) |
| 60 to 64 Years | 2 (40.0%) | 0 (0.0%) |
| 65 to 74 Years | 3 (16.7%) | 1 (33.3%) |
| 75 Years and over | 7 (35.0%) | 0 (0.0%) |
| Total | 77 (65.3%) | 11 (14.3%) |
Employment Status by Educational Attainment in Ratcliff
According to labor force statistics for Ratcliff, 81.7% of individuals (58) out of the total population between 25 and 64 years of age (71) are in the labor force, with 17.2% or 10 of them being unemployed. The group with the highest labor force participation rate are those with the educational attainment of bachelor's degree or higher, with 100.0% or 12 individuals in the labor force. Within the labor force, individuals with college / associate degree education have the highest percentage of unemployment, with 43.5% or 10 of them being unemployed.
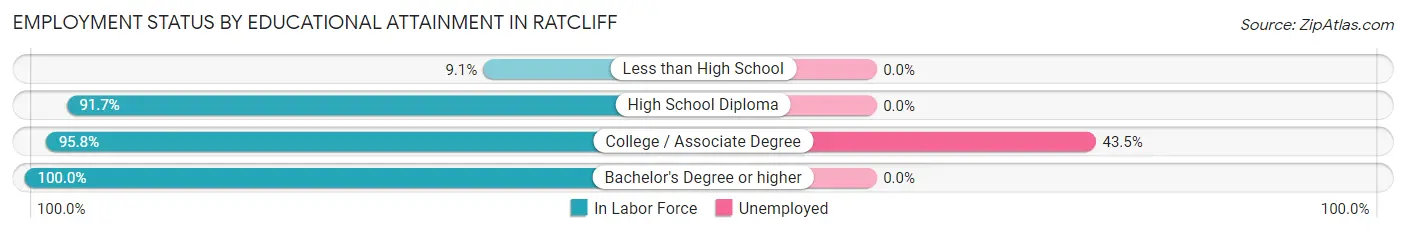
| Educational Attainment | In Labor Force | Unemployed |
| Less than High School | 1 (9.1%) | 0 (0.0%) |
| High School Diploma | 22 (91.7%) | 0 (0.0%) |
| College / Associate Degree | 23 (95.8%) | 10 (43.5%) |
| Bachelor's Degree or higher | 12 (100.0%) | 0 (0.0%) |
| Total | 58 (81.7%) | 12 (17.2%) |
Employment Occupations by Sex in Ratcliff
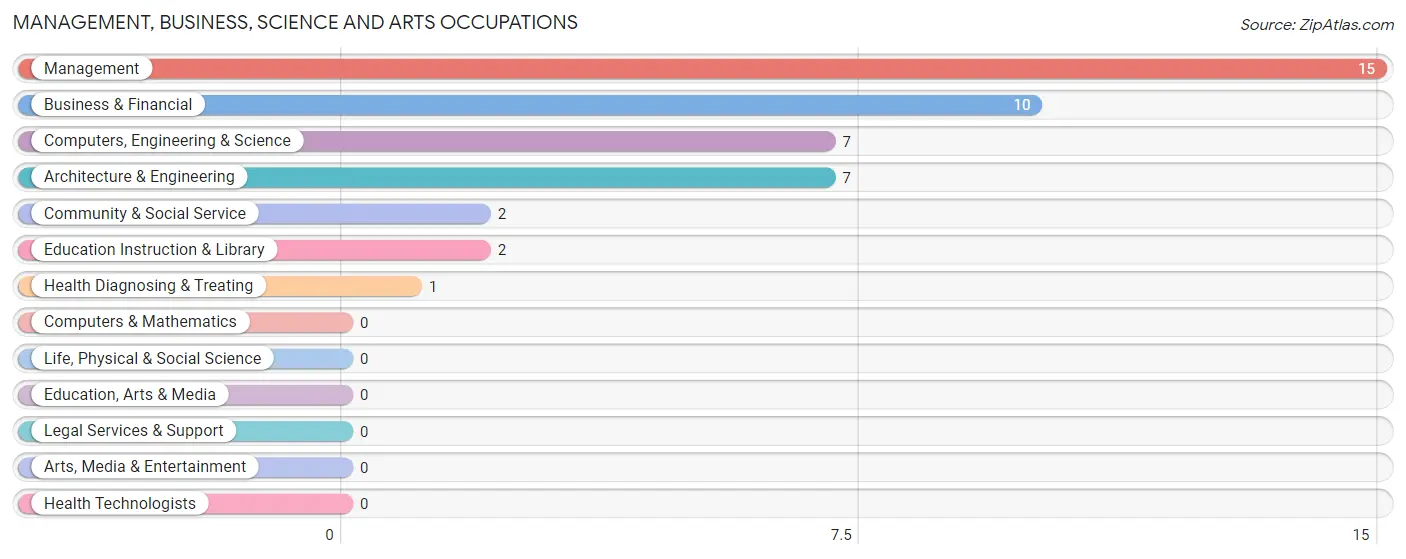
Management, Business, Science and Arts Occupations
The most common Management, Business, Science and Arts occupations in Ratcliff are Management (15 | 22.7%), Business & Financial (10 | 15.1%), Computers, Engineering & Science (7 | 10.6%), Architecture & Engineering (7 | 10.6%), and Community & Social Service (2 | 3.0%).
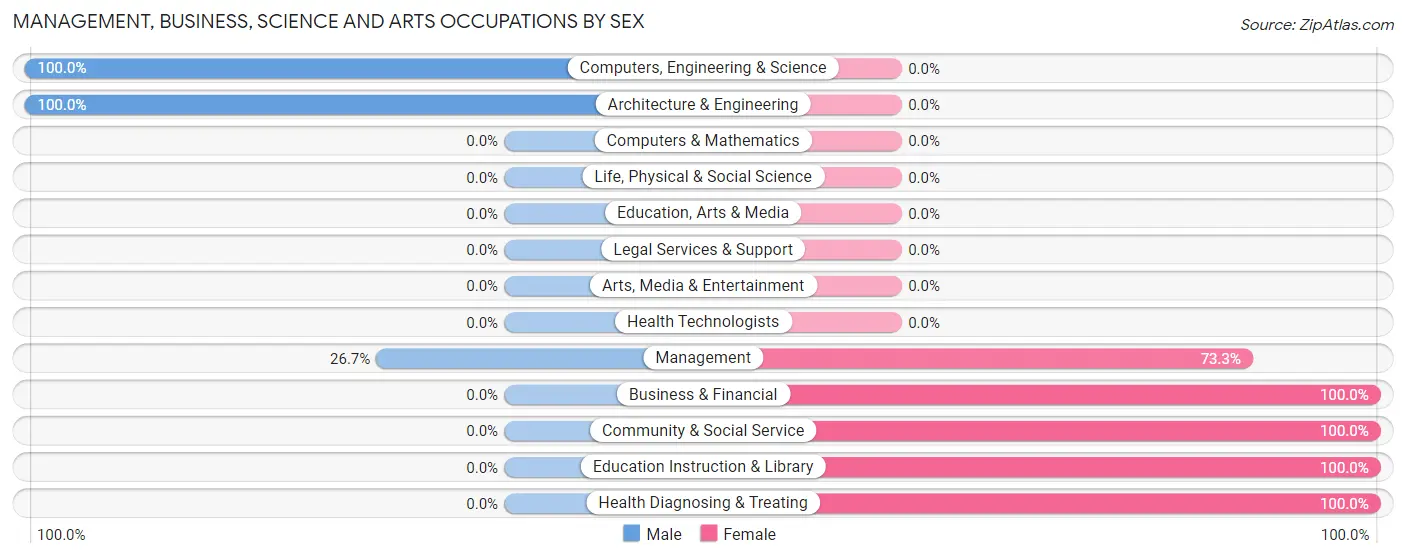
Management, Business, Science and Arts Occupations by Sex
Within the Management, Business, Science and Arts occupations in Ratcliff, the most male-oriented occupations are Computers, Engineering & Science (100.0%), Architecture & Engineering (100.0%), and Management (26.7%), while the most female-oriented occupations are Business & Financial (100.0%), Community & Social Service (100.0%), and Education Instruction & Library (100.0%).
| Occupation | Male | Female |
| Management | 4 (26.7%) | 11 (73.3%) |
| Business & Financial | 0 (0.0%) | 10 (100.0%) |
| Computers, Engineering & Science | 7 (100.0%) | 0 (0.0%) |
| Computers & Mathematics | 0 (0.0%) | 0 (0.0%) |
| Architecture & Engineering | 7 (100.0%) | 0 (0.0%) |
| Life, Physical & Social Science | 0 (0.0%) | 0 (0.0%) |
| Community & Social Service | 0 (0.0%) | 2 (100.0%) |
| Education, Arts & Media | 0 (0.0%) | 0 (0.0%) |
| Legal Services & Support | 0 (0.0%) | 0 (0.0%) |
| Education Instruction & Library | 0 (0.0%) | 2 (100.0%) |
| Arts, Media & Entertainment | 0 (0.0%) | 0 (0.0%) |
| Health Diagnosing & Treating | 0 (0.0%) | 1 (100.0%) |
| Health Technologists | 0 (0.0%) | 0 (0.0%) |
| Total (Category) | 11 (31.4%) | 24 (68.6%) |
| Total (Overall) | 32 (48.5%) | 34 (51.5%) |
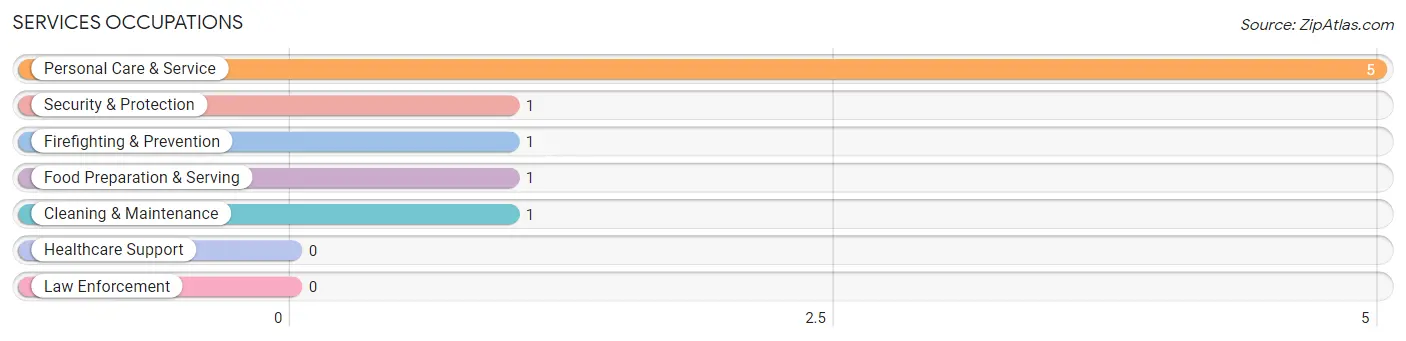
Services Occupations
The most common Services occupations in Ratcliff are Personal Care & Service (5 | 7.6%), Security & Protection (1 | 1.5%), Firefighting & Prevention (1 | 1.5%), Food Preparation & Serving (1 | 1.5%), and Cleaning & Maintenance (1 | 1.5%).
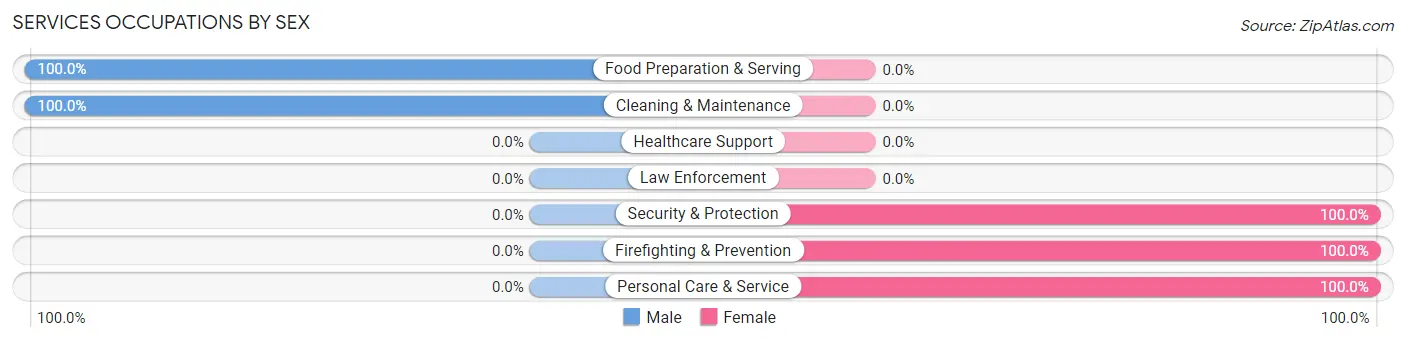
Services Occupations by Sex
Within the Services occupations in Ratcliff, the most male-oriented occupations are Food Preparation & Serving (100.0%), and Cleaning & Maintenance (100.0%), while the most female-oriented occupations are Security & Protection (100.0%), Firefighting & Prevention (100.0%), and Personal Care & Service (100.0%).
| Occupation | Male | Female |
| Healthcare Support | 0 (0.0%) | 0 (0.0%) |
| Security & Protection | 0 (0.0%) | 1 (100.0%) |
| Firefighting & Prevention | 0 (0.0%) | 1 (100.0%) |
| Law Enforcement | 0 (0.0%) | 0 (0.0%) |
| Food Preparation & Serving | 1 (100.0%) | 0 (0.0%) |
| Cleaning & Maintenance | 1 (100.0%) | 0 (0.0%) |
| Personal Care & Service | 0 (0.0%) | 5 (100.0%) |
| Total (Category) | 2 (25.0%) | 6 (75.0%) |
| Total (Overall) | 32 (48.5%) | 34 (51.5%) |
Sales and Office Occupations
Sales and Office Occupations by Sex
| Occupation | Male | Female |
| Sales & Related | 0 (0.0%) | 0 (0.0%) |
| Office & Administration | 0 (0.0%) | 0 (0.0%) |
| Total (Category) | 0 (0.0%) | 0 (0.0%) |
| Total (Overall) | 32 (48.5%) | 34 (51.5%) |
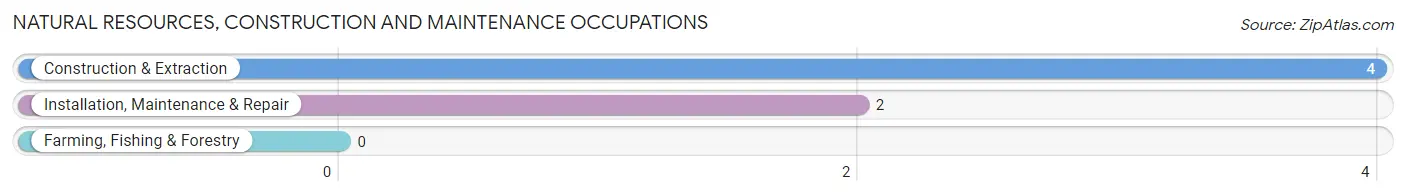
Natural Resources, Construction and Maintenance Occupations
The most common Natural Resources, Construction and Maintenance occupations in Ratcliff are Construction & Extraction (4 | 6.1%), and Installation, Maintenance & Repair (2 | 3.0%).
Natural Resources, Construction and Maintenance Occupations by Sex
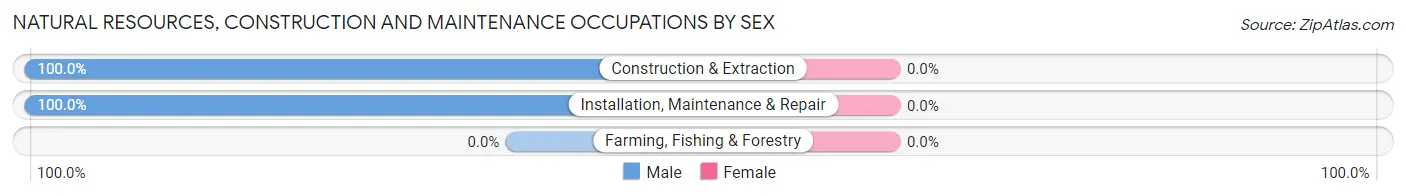
| Occupation | Male | Female |
| Farming, Fishing & Forestry | 0 (0.0%) | 0 (0.0%) |
| Construction & Extraction | 4 (100.0%) | 0 (0.0%) |
| Installation, Maintenance & Repair | 2 (100.0%) | 0 (0.0%) |
| Total (Category) | 6 (100.0%) | 0 (0.0%) |
| Total (Overall) | 32 (48.5%) | 34 (51.5%) |
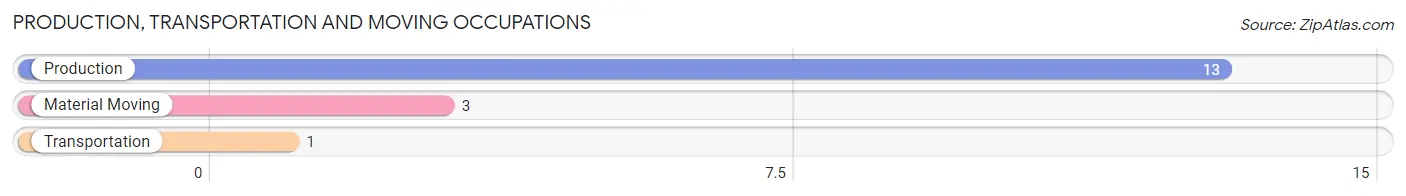
Production, Transportation and Moving Occupations
The most common Production, Transportation and Moving occupations in Ratcliff are Production (13 | 19.7%), Material Moving (3 | 4.5%), and Transportation (1 | 1.5%).
Production, Transportation and Moving Occupations by Sex
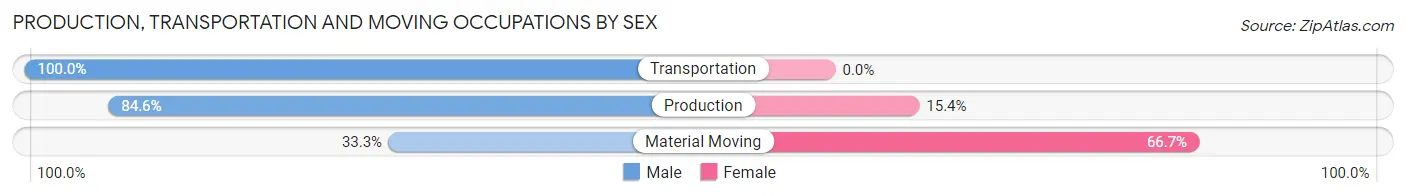
| Occupation | Male | Female |
| Production | 11 (84.6%) | 2 (15.4%) |
| Transportation | 1 (100.0%) | 0 (0.0%) |
| Material Moving | 1 (33.3%) | 2 (66.7%) |
| Total (Category) | 13 (76.5%) | 4 (23.5%) |
| Total (Overall) | 32 (48.5%) | 34 (51.5%) |
Employment Industries by Sex in Ratcliff
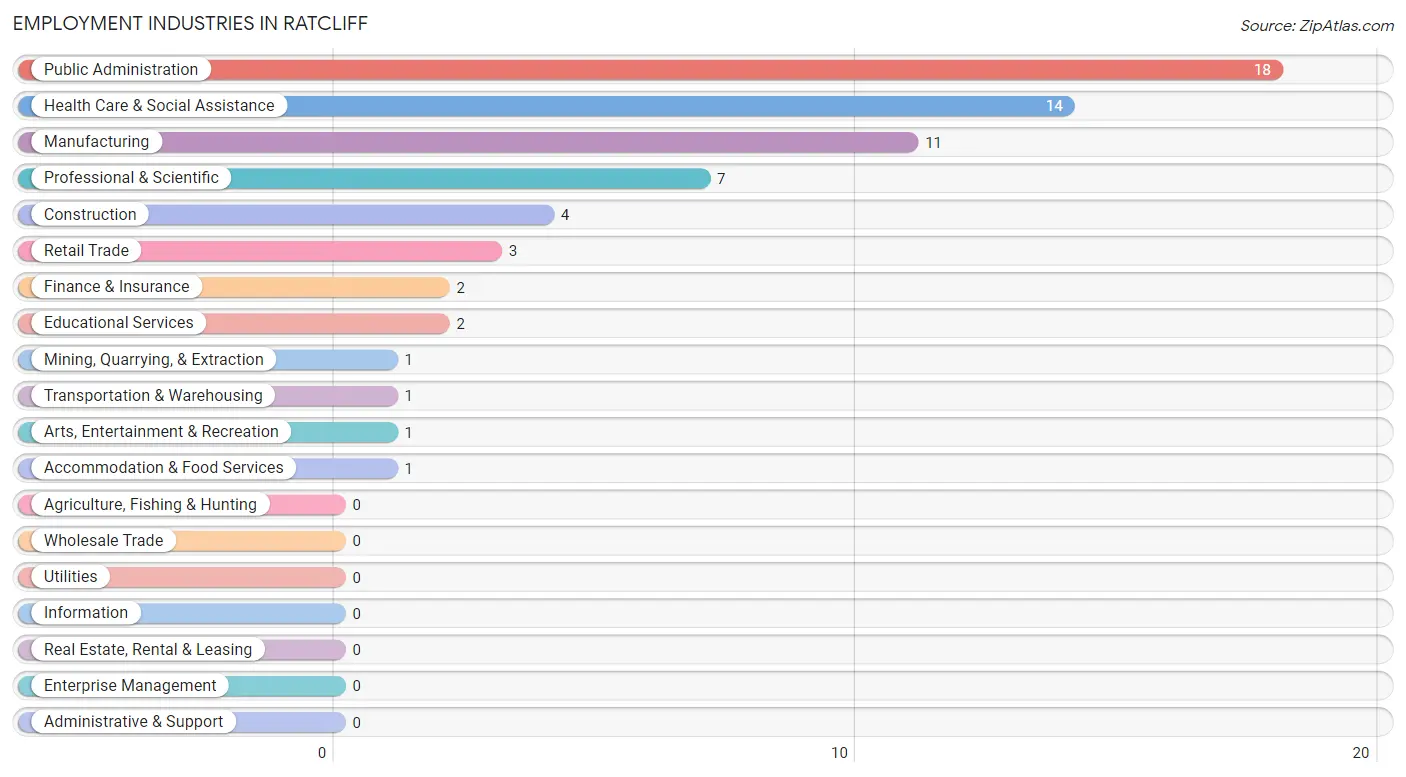
Employment Industries in Ratcliff
The major employment industries in Ratcliff include Public Administration (18 | 27.3%), Health Care & Social Assistance (14 | 21.2%), Manufacturing (11 | 16.7%), Professional & Scientific (7 | 10.6%), and Construction (4 | 6.1%).
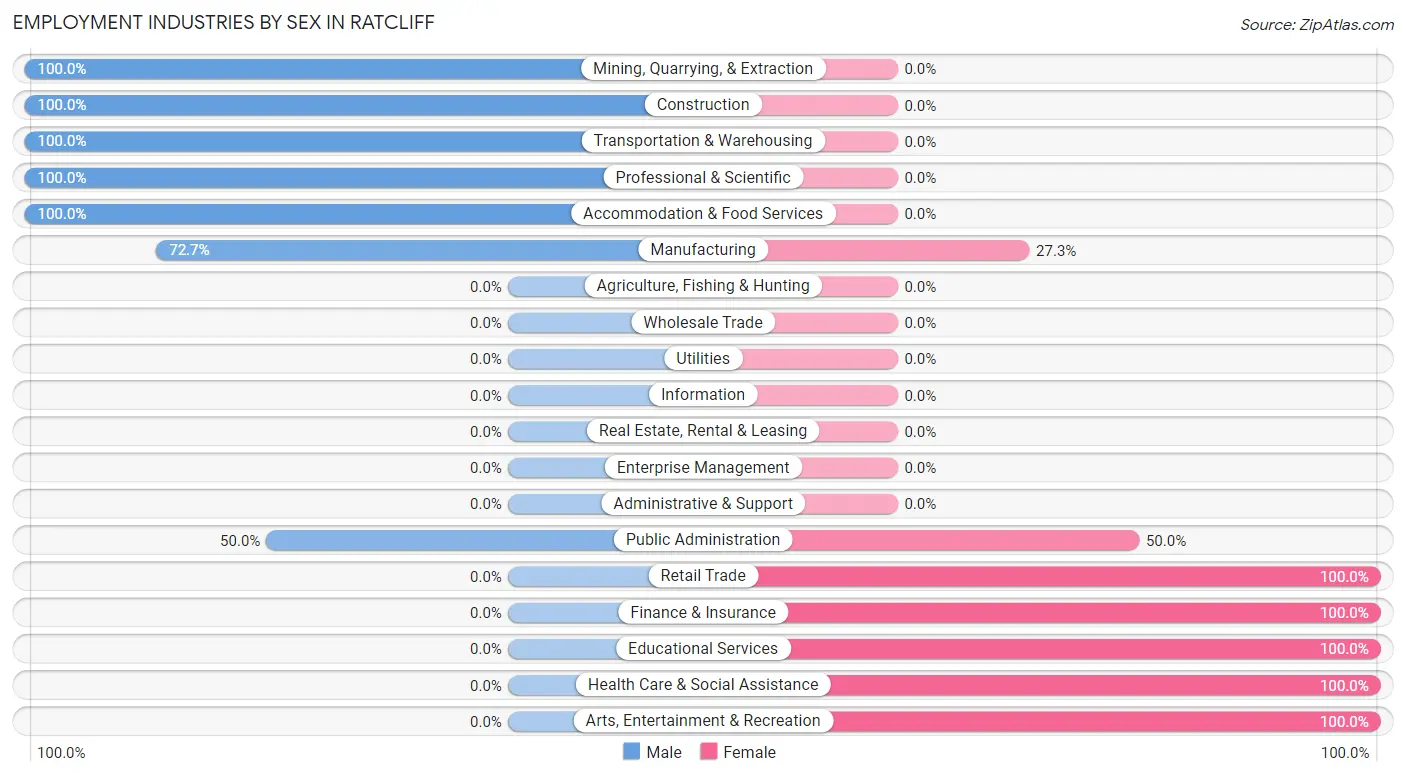
Employment Industries by Sex in Ratcliff
The Ratcliff industries that see more men than women are Mining, Quarrying, & Extraction (100.0%), Construction (100.0%), and Transportation & Warehousing (100.0%), whereas the industries that tend to have a higher number of women are Retail Trade (100.0%), Finance & Insurance (100.0%), and Educational Services (100.0%).
| Industry | Male | Female |
| Agriculture, Fishing & Hunting | 0 (0.0%) | 0 (0.0%) |
| Mining, Quarrying, & Extraction | 1 (100.0%) | 0 (0.0%) |
| Construction | 4 (100.0%) | 0 (0.0%) |
| Manufacturing | 8 (72.7%) | 3 (27.3%) |
| Wholesale Trade | 0 (0.0%) | 0 (0.0%) |
| Retail Trade | 0 (0.0%) | 3 (100.0%) |
| Transportation & Warehousing | 1 (100.0%) | 0 (0.0%) |
| Utilities | 0 (0.0%) | 0 (0.0%) |
| Information | 0 (0.0%) | 0 (0.0%) |
| Finance & Insurance | 0 (0.0%) | 2 (100.0%) |
| Real Estate, Rental & Leasing | 0 (0.0%) | 0 (0.0%) |
| Professional & Scientific | 7 (100.0%) | 0 (0.0%) |
| Enterprise Management | 0 (0.0%) | 0 (0.0%) |
| Administrative & Support | 0 (0.0%) | 0 (0.0%) |
| Educational Services | 0 (0.0%) | 2 (100.0%) |
| Health Care & Social Assistance | 0 (0.0%) | 14 (100.0%) |
| Arts, Entertainment & Recreation | 0 (0.0%) | 1 (100.0%) |
| Accommodation & Food Services | 1 (100.0%) | 0 (0.0%) |
| Public Administration | 9 (50.0%) | 9 (50.0%) |
| Total | 32 (48.5%) | 34 (51.5%) |
Education in Ratcliff
School Enrollment in Ratcliff
The most common levels of schooling among the 15 students in Ratcliff are kindergarten (6 | 40.0%), nursery / preschool (3 | 20.0%), and elementary school (2 | 13.3%).
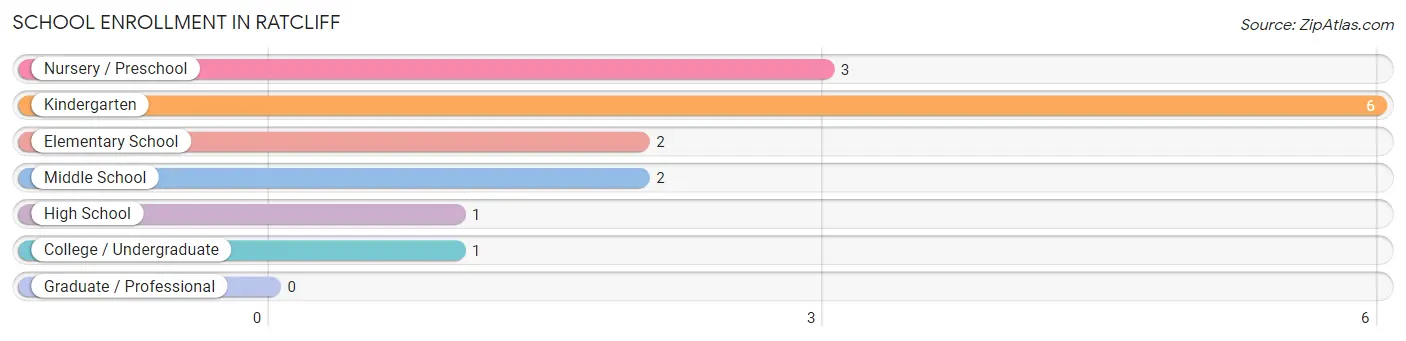
| School Level | # Students | % Students |
| Nursery / Preschool | 3 | 20.0% |
| Kindergarten | 6 | 40.0% |
| Elementary School | 2 | 13.3% |
| Middle School | 2 | 13.3% |
| High School | 1 | 6.7% |
| College / Undergraduate | 1 | 6.7% |
| Graduate / Professional | 0 | 0.0% |
| Total | 15 | 100.0% |
School Enrollment by Age by Funding Source in Ratcliff
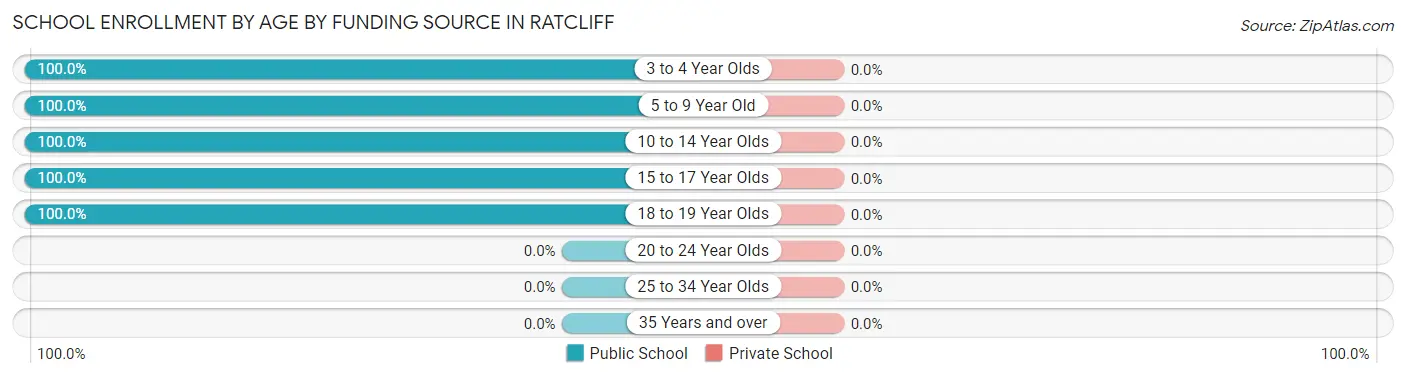
| Age Bracket | Public School | Private School |
| 3 to 4 Year Olds | 3 (100.0%) | 0 (0.0%) |
| 5 to 9 Year Old | 8 (100.0%) | 0 (0.0%) |
| 10 to 14 Year Olds | 2 (100.0%) | 0 (0.0%) |
| 15 to 17 Year Olds | 1 (100.0%) | 0 (0.0%) |
| 18 to 19 Year Olds | 1 (100.0%) | 0 (0.0%) |
| 20 to 24 Year Olds | 0 (0.0%) | 0 (0.0%) |
| 25 to 34 Year Olds | 0 (0.0%) | 0 (0.0%) |
| 35 Years and over | 0 (0.0%) | 0 (0.0%) |
| Total | 15 (100.0%) | 0 (0.0%) |
Educational Attainment by Field of Study in Ratcliff
Business (8 | 66.7%), bio, nature & agricultural (2 | 16.7%), and education (2 | 16.7%) are the most common fields of study among 12 individuals in Ratcliff who have obtained a bachelor's degree or higher.
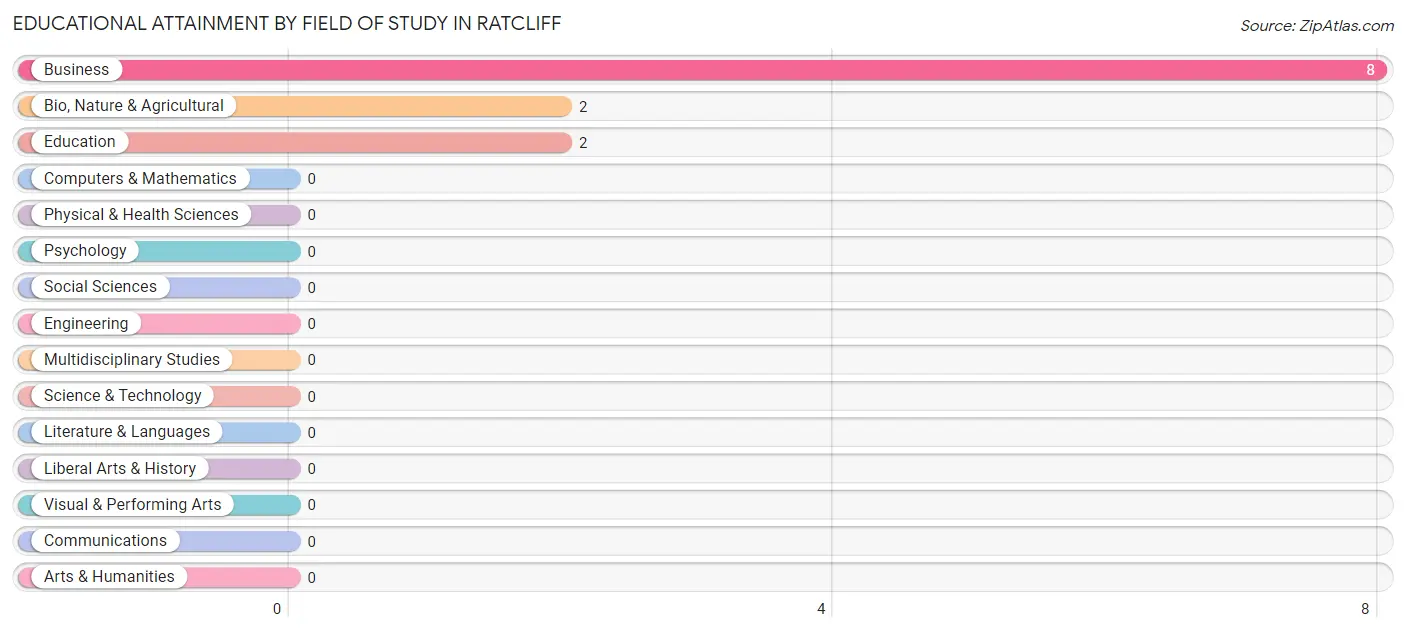
| Field of Study | # Graduates | % Graduates |
| Computers & Mathematics | 0 | 0.0% |
| Bio, Nature & Agricultural | 2 | 16.7% |
| Physical & Health Sciences | 0 | 0.0% |
| Psychology | 0 | 0.0% |
| Social Sciences | 0 | 0.0% |
| Engineering | 0 | 0.0% |
| Multidisciplinary Studies | 0 | 0.0% |
| Science & Technology | 0 | 0.0% |
| Business | 8 | 66.7% |
| Education | 2 | 16.7% |
| Literature & Languages | 0 | 0.0% |
| Liberal Arts & History | 0 | 0.0% |
| Visual & Performing Arts | 0 | 0.0% |
| Communications | 0 | 0.0% |
| Arts & Humanities | 0 | 0.0% |
| Total | 12 | 100.0% |
Transportation & Commute in Ratcliff
Vehicle Availability by Sex in Ratcliff
The most prevalent vehicle ownership categories in Ratcliff are males with 3 vehicles (13, accounting for 40.6%) and females with 3 vehicles (6, making up 38.2%).
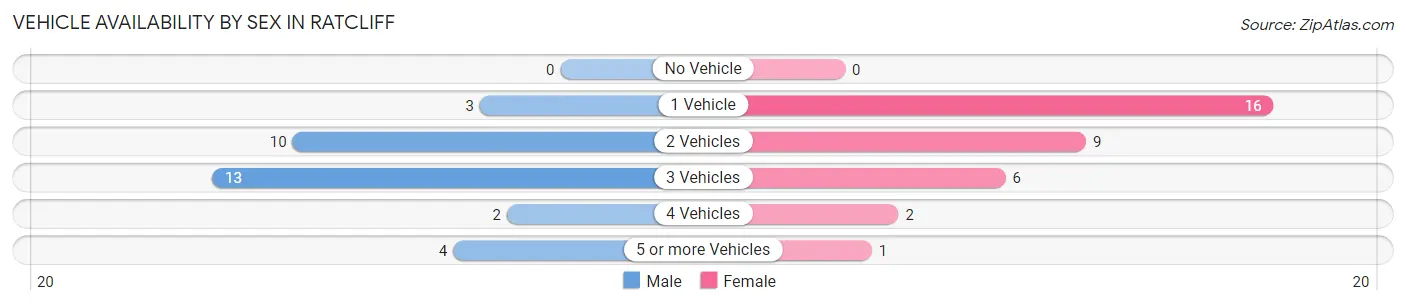
| Vehicles Available | Male | Female |
| No Vehicle | 0 (0.0%) | 0 (0.0%) |
| 1 Vehicle | 3 (9.4%) | 16 (47.1%) |
| 2 Vehicles | 10 (31.2%) | 9 (26.5%) |
| 3 Vehicles | 13 (40.6%) | 6 (17.6%) |
| 4 Vehicles | 2 (6.2%) | 2 (5.9%) |
| 5 or more Vehicles | 4 (12.5%) | 1 (2.9%) |
| Total | 32 (100.0%) | 34 (100.0%) |
Commute Time in Ratcliff
The most frequently occuring commute durations in Ratcliff are 60 to 89 minutes (15 commuters, 23.4%), 20 to 24 minutes (11 commuters, 17.2%), and 15 to 19 minutes (10 commuters, 15.6%).
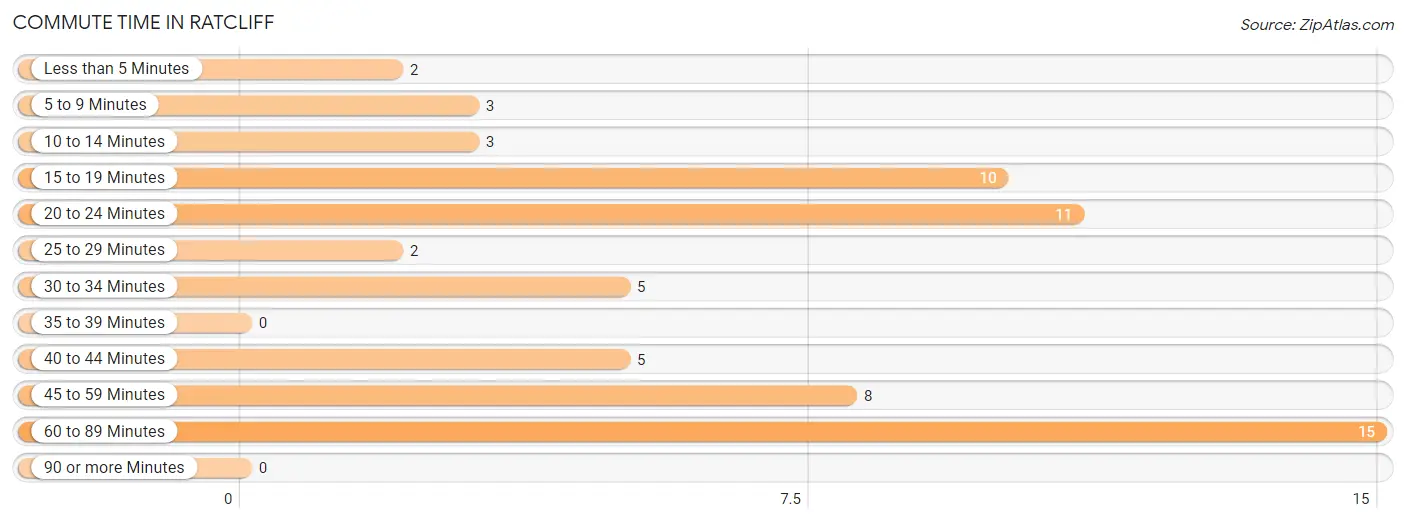
| Commute Time | # Commuters | % Commuters |
| Less than 5 Minutes | 2 | 3.1% |
| 5 to 9 Minutes | 3 | 4.7% |
| 10 to 14 Minutes | 3 | 4.7% |
| 15 to 19 Minutes | 10 | 15.6% |
| 20 to 24 Minutes | 11 | 17.2% |
| 25 to 29 Minutes | 2 | 3.1% |
| 30 to 34 Minutes | 5 | 7.8% |
| 35 to 39 Minutes | 0 | 0.0% |
| 40 to 44 Minutes | 5 | 7.8% |
| 45 to 59 Minutes | 8 | 12.5% |
| 60 to 89 Minutes | 15 | 23.4% |
| 90 or more Minutes | 0 | 0.0% |
Commute Time by Sex in Ratcliff
The most common commute times in Ratcliff are 60 to 89 minutes (8 commuters, 25.0%) for males and 20 to 24 minutes (11 commuters, 34.4%) for females.
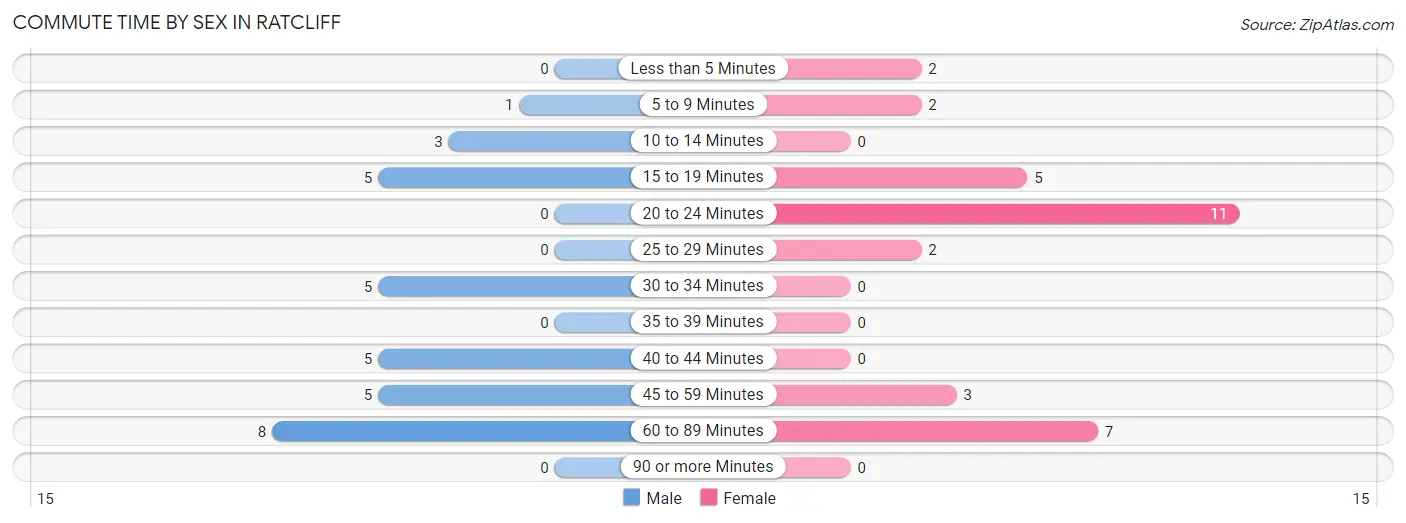
| Commute Time | Male | Female |
| Less than 5 Minutes | 0 (0.0%) | 2 (6.2%) |
| 5 to 9 Minutes | 1 (3.1%) | 2 (6.2%) |
| 10 to 14 Minutes | 3 (9.4%) | 0 (0.0%) |
| 15 to 19 Minutes | 5 (15.6%) | 5 (15.6%) |
| 20 to 24 Minutes | 0 (0.0%) | 11 (34.4%) |
| 25 to 29 Minutes | 0 (0.0%) | 2 (6.2%) |
| 30 to 34 Minutes | 5 (15.6%) | 0 (0.0%) |
| 35 to 39 Minutes | 0 (0.0%) | 0 (0.0%) |
| 40 to 44 Minutes | 5 (15.6%) | 0 (0.0%) |
| 45 to 59 Minutes | 5 (15.6%) | 3 (9.4%) |
| 60 to 89 Minutes | 8 (25.0%) | 7 (21.9%) |
| 90 or more Minutes | 0 (0.0%) | 0 (0.0%) |
Time of Departure to Work by Sex in Ratcliff
The most frequent times of departure to work in Ratcliff are 5:30 AM to 5:59 AM (13, 40.6%) for males and 7:00 AM to 7:29 AM (9, 28.1%) for females.
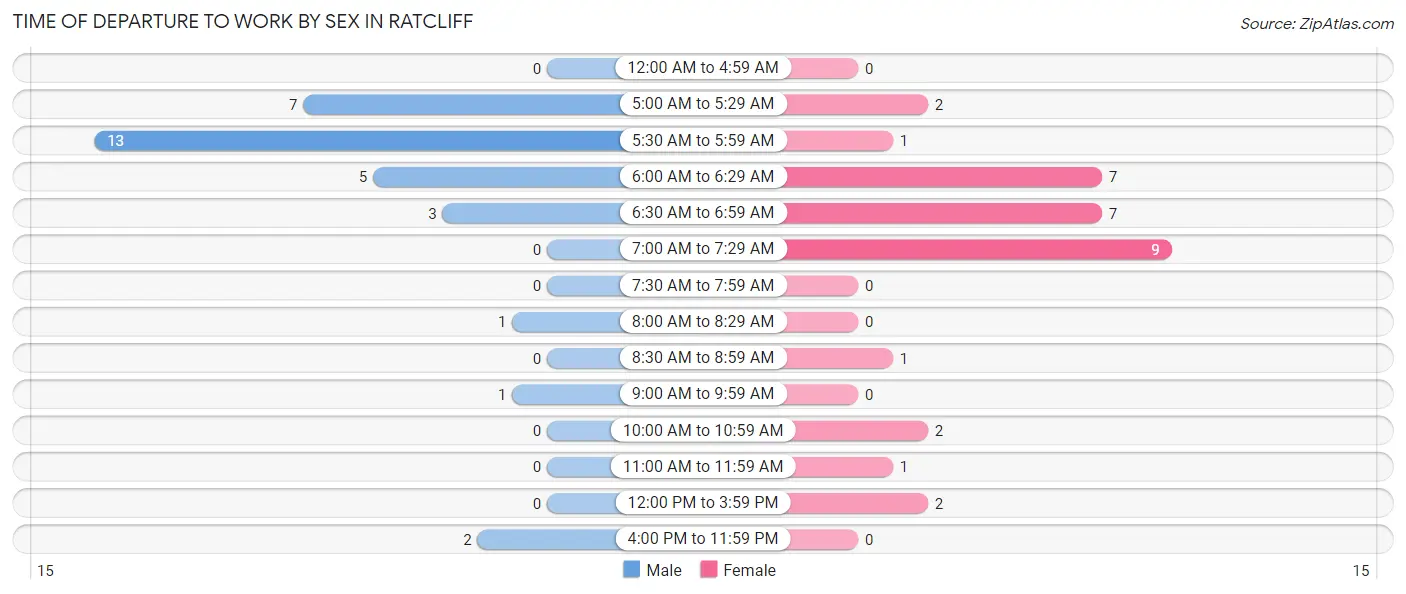
| Time of Departure | Male | Female |
| 12:00 AM to 4:59 AM | 0 (0.0%) | 0 (0.0%) |
| 5:00 AM to 5:29 AM | 7 (21.9%) | 2 (6.2%) |
| 5:30 AM to 5:59 AM | 13 (40.6%) | 1 (3.1%) |
| 6:00 AM to 6:29 AM | 5 (15.6%) | 7 (21.9%) |
| 6:30 AM to 6:59 AM | 3 (9.4%) | 7 (21.9%) |
| 7:00 AM to 7:29 AM | 0 (0.0%) | 9 (28.1%) |
| 7:30 AM to 7:59 AM | 0 (0.0%) | 0 (0.0%) |
| 8:00 AM to 8:29 AM | 1 (3.1%) | 0 (0.0%) |
| 8:30 AM to 8:59 AM | 0 (0.0%) | 1 (3.1%) |
| 9:00 AM to 9:59 AM | 1 (3.1%) | 0 (0.0%) |
| 10:00 AM to 10:59 AM | 0 (0.0%) | 2 (6.2%) |
| 11:00 AM to 11:59 AM | 0 (0.0%) | 1 (3.1%) |
| 12:00 PM to 3:59 PM | 0 (0.0%) | 2 (6.2%) |
| 4:00 PM to 11:59 PM | 2 (6.2%) | 0 (0.0%) |
| Total | 32 (100.0%) | 32 (100.0%) |
Housing Occupancy in Ratcliff
Occupancy by Ownership in Ratcliff
Of the total 75 dwellings in Ratcliff, owner-occupied units account for 56 (74.7%), while renter-occupied units make up 19 (25.3%).
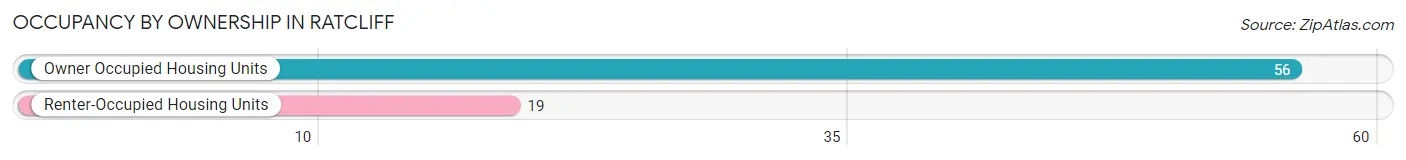
| Occupancy | # Housing Units | % Housing Units |
| Owner Occupied Housing Units | 56 | 74.7% |
| Renter-Occupied Housing Units | 19 | 25.3% |
| Total Occupied Housing Units | 75 | 100.0% |
Occupancy by Household Size in Ratcliff
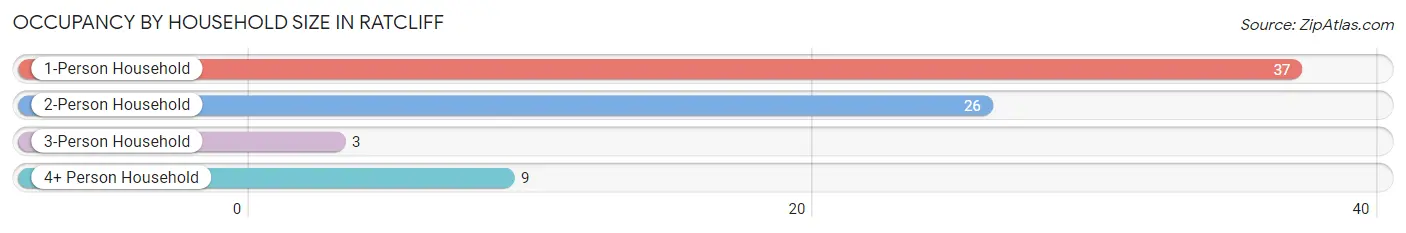
| Household Size | # Housing Units | % Housing Units |
| 1-Person Household | 37 | 49.3% |
| 2-Person Household | 26 | 34.7% |
| 3-Person Household | 3 | 4.0% |
| 4+ Person Household | 9 | 12.0% |
| Total Housing Units | 75 | 100.0% |
Occupancy by Ownership by Household Size in Ratcliff
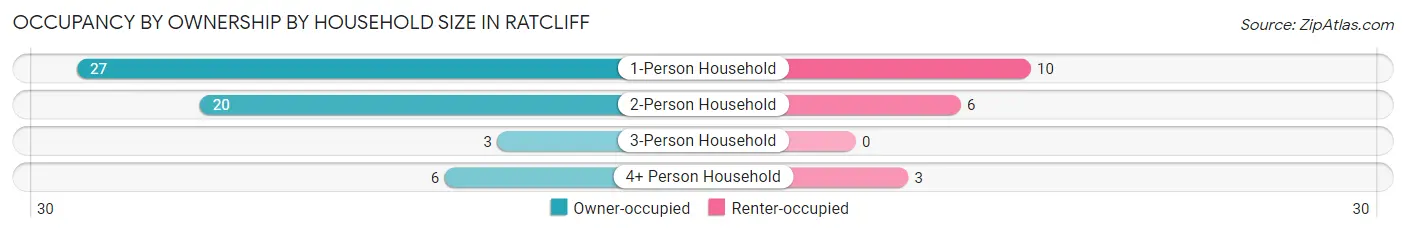
| Household Size | Owner-occupied | Renter-occupied |
| 1-Person Household | 27 (73.0%) | 10 (27.0%) |
| 2-Person Household | 20 (76.9%) | 6 (23.1%) |
| 3-Person Household | 3 (100.0%) | 0 (0.0%) |
| 4+ Person Household | 6 (66.7%) | 3 (33.3%) |
| Total Housing Units | 56 (74.7%) | 19 (25.3%) |
Occupancy by Educational Attainment in Ratcliff
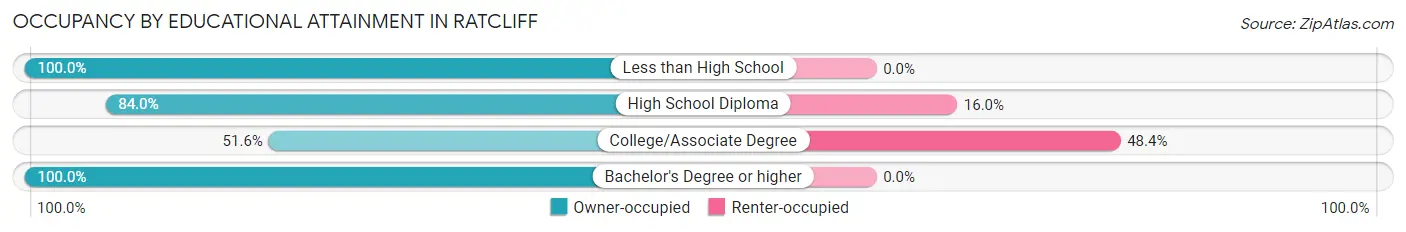
| Household Size | Owner-occupied | Renter-occupied |
| Less than High School | 9 (100.0%) | 0 (0.0%) |
| High School Diploma | 21 (84.0%) | 4 (16.0%) |
| College/Associate Degree | 16 (51.6%) | 15 (48.4%) |
| Bachelor's Degree or higher | 10 (100.0%) | 0 (0.0%) |
Occupancy by Age of Householder in Ratcliff
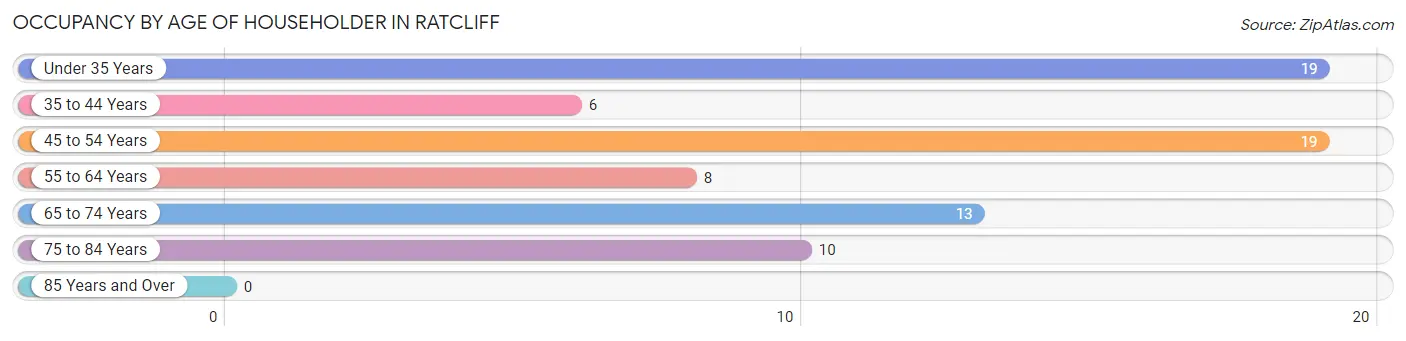
| Age Bracket | # Households | % Households |
| Under 35 Years | 19 | 25.3% |
| 35 to 44 Years | 6 | 8.0% |
| 45 to 54 Years | 19 | 25.3% |
| 55 to 64 Years | 8 | 10.7% |
| 65 to 74 Years | 13 | 17.3% |
| 75 to 84 Years | 10 | 13.3% |
| 85 Years and Over | 0 | 0.0% |
| Total | 75 | 100.0% |
Housing Finances in Ratcliff
Median Income by Occupancy in Ratcliff
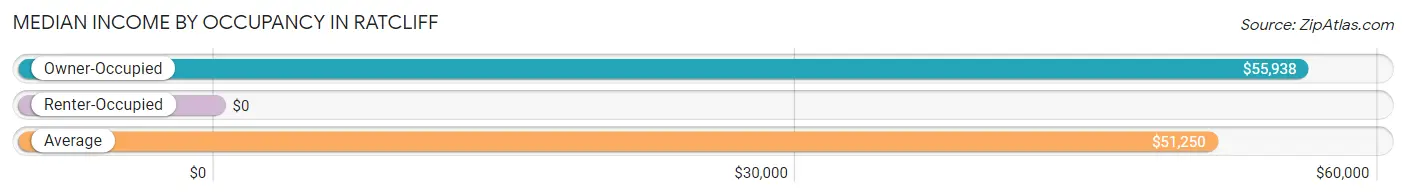
| Occupancy Type | # Households | Median Income |
| Owner-Occupied | 56 (74.7%) | $55,938 |
| Renter-Occupied | 19 (25.3%) | $0 |
| Average | 75 (100.0%) | $51,250 |
Occupancy by Householder Income Bracket in Ratcliff
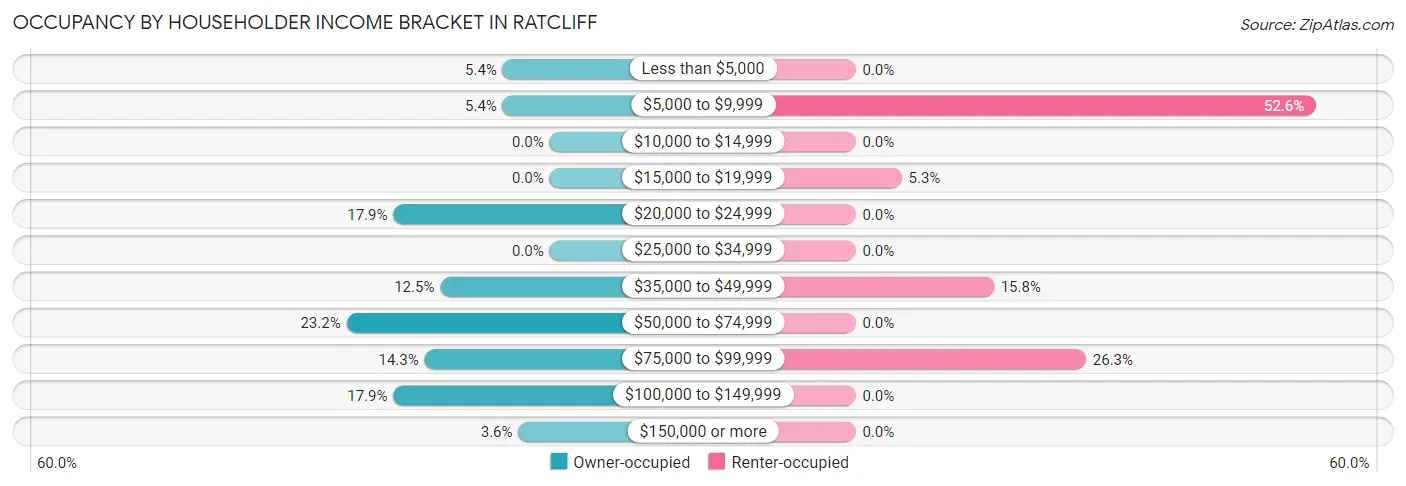
| Income Bracket | Owner-occupied | Renter-occupied |
| Less than $5,000 | 3 (5.4%) | 0 (0.0%) |
| $5,000 to $9,999 | 3 (5.4%) | 10 (52.6%) |
| $10,000 to $14,999 | 0 (0.0%) | 0 (0.0%) |
| $15,000 to $19,999 | 0 (0.0%) | 1 (5.3%) |
| $20,000 to $24,999 | 10 (17.9%) | 0 (0.0%) |
| $25,000 to $34,999 | 0 (0.0%) | 0 (0.0%) |
| $35,000 to $49,999 | 7 (12.5%) | 3 (15.8%) |
| $50,000 to $74,999 | 13 (23.2%) | 0 (0.0%) |
| $75,000 to $99,999 | 8 (14.3%) | 5 (26.3%) |
| $100,000 to $149,999 | 10 (17.9%) | 0 (0.0%) |
| $150,000 or more | 2 (3.6%) | 0 (0.0%) |
| Total | 56 (100.0%) | 19 (100.0%) |
Monthly Housing Cost Tiers in Ratcliff
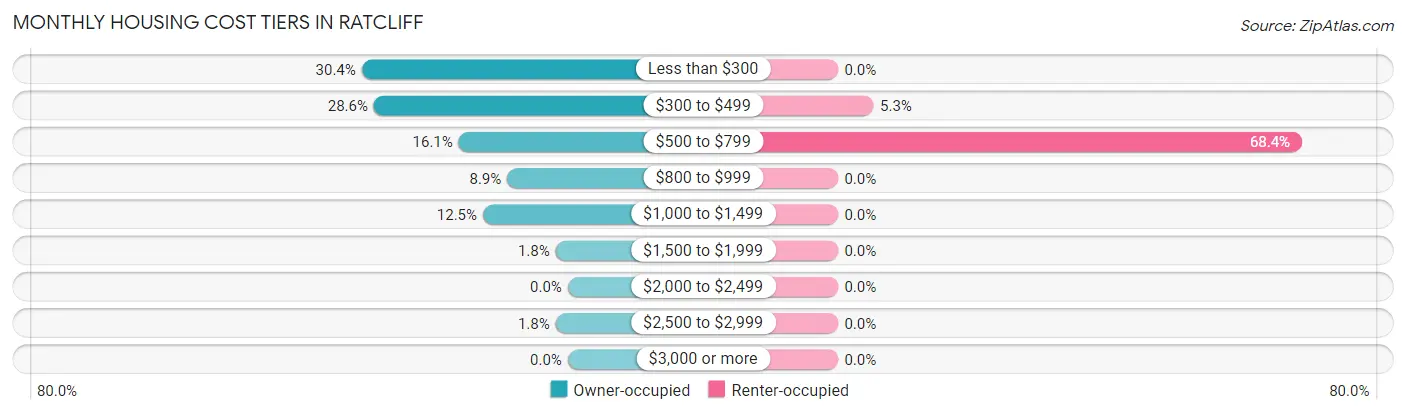
| Monthly Cost | Owner-occupied | Renter-occupied |
| Less than $300 | 17 (30.4%) | 0 (0.0%) |
| $300 to $499 | 16 (28.6%) | 1 (5.3%) |
| $500 to $799 | 9 (16.1%) | 13 (68.4%) |
| $800 to $999 | 5 (8.9%) | 0 (0.0%) |
| $1,000 to $1,499 | 7 (12.5%) | 0 (0.0%) |
| $1,500 to $1,999 | 1 (1.8%) | 0 (0.0%) |
| $2,000 to $2,499 | 0 (0.0%) | 0 (0.0%) |
| $2,500 to $2,999 | 1 (1.8%) | 0 (0.0%) |
| $3,000 or more | 0 (0.0%) | 0 (0.0%) |
| Total | 56 (100.0%) | 19 (100.0%) |
Physical Housing Characteristics in Ratcliff
Housing Structures in Ratcliff
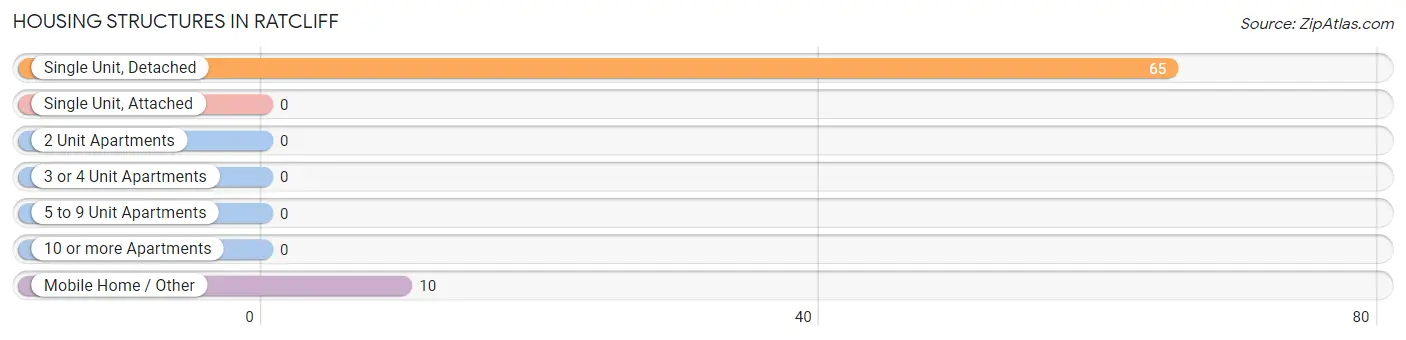
| Structure Type | # Housing Units | % Housing Units |
| Single Unit, Detached | 65 | 86.7% |
| Single Unit, Attached | 0 | 0.0% |
| 2 Unit Apartments | 0 | 0.0% |
| 3 or 4 Unit Apartments | 0 | 0.0% |
| 5 to 9 Unit Apartments | 0 | 0.0% |
| 10 or more Apartments | 0 | 0.0% |
| Mobile Home / Other | 10 | 13.3% |
| Total | 75 | 100.0% |
Housing Structures by Occupancy in Ratcliff
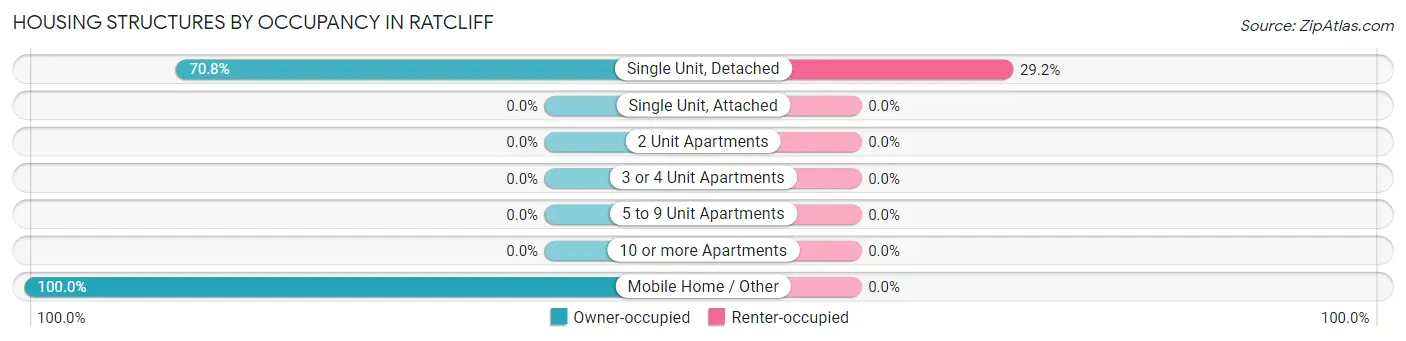
| Structure Type | Owner-occupied | Renter-occupied |
| Single Unit, Detached | 46 (70.8%) | 19 (29.2%) |
| Single Unit, Attached | 0 (0.0%) | 0 (0.0%) |
| 2 Unit Apartments | 0 (0.0%) | 0 (0.0%) |
| 3 or 4 Unit Apartments | 0 (0.0%) | 0 (0.0%) |
| 5 to 9 Unit Apartments | 0 (0.0%) | 0 (0.0%) |
| 10 or more Apartments | 0 (0.0%) | 0 (0.0%) |
| Mobile Home / Other | 10 (100.0%) | 0 (0.0%) |
| Total | 56 (74.7%) | 19 (25.3%) |
Housing Structures by Number of Rooms in Ratcliff
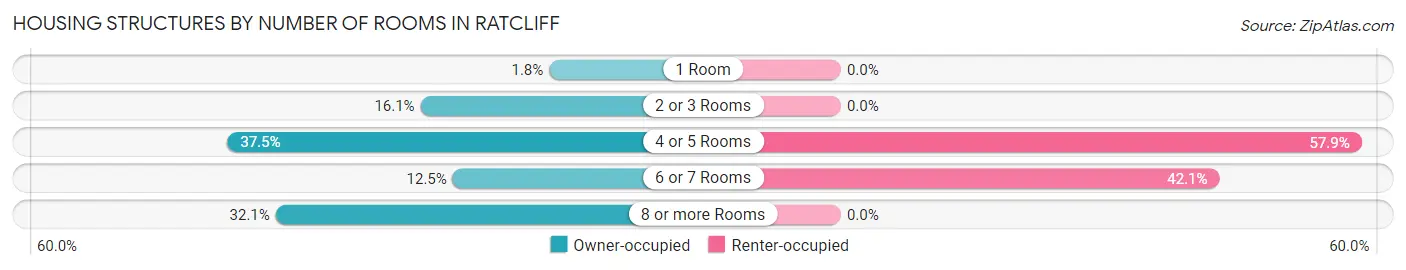
| Number of Rooms | Owner-occupied | Renter-occupied |
| 1 Room | 1 (1.8%) | 0 (0.0%) |
| 2 or 3 Rooms | 9 (16.1%) | 0 (0.0%) |
| 4 or 5 Rooms | 21 (37.5%) | 11 (57.9%) |
| 6 or 7 Rooms | 7 (12.5%) | 8 (42.1%) |
| 8 or more Rooms | 18 (32.1%) | 0 (0.0%) |
| Total | 56 (100.0%) | 19 (100.0%) |
Housing Structure by Heating Type in Ratcliff
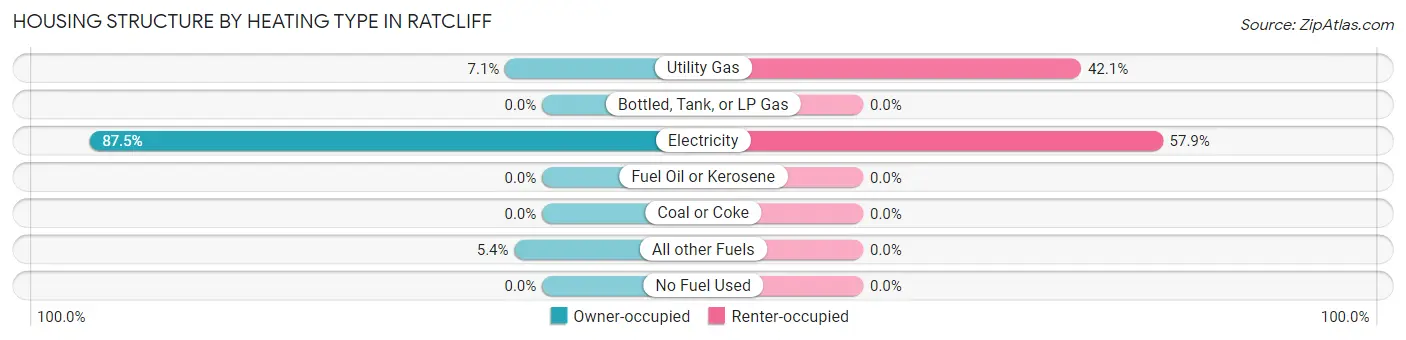
| Heating Type | Owner-occupied | Renter-occupied |
| Utility Gas | 4 (7.1%) | 8 (42.1%) |
| Bottled, Tank, or LP Gas | 0 (0.0%) | 0 (0.0%) |
| Electricity | 49 (87.5%) | 11 (57.9%) |
| Fuel Oil or Kerosene | 0 (0.0%) | 0 (0.0%) |
| Coal or Coke | 0 (0.0%) | 0 (0.0%) |
| All other Fuels | 3 (5.4%) | 0 (0.0%) |
| No Fuel Used | 0 (0.0%) | 0 (0.0%) |
| Total | 56 (100.0%) | 19 (100.0%) |
Household Vehicle Usage in Ratcliff
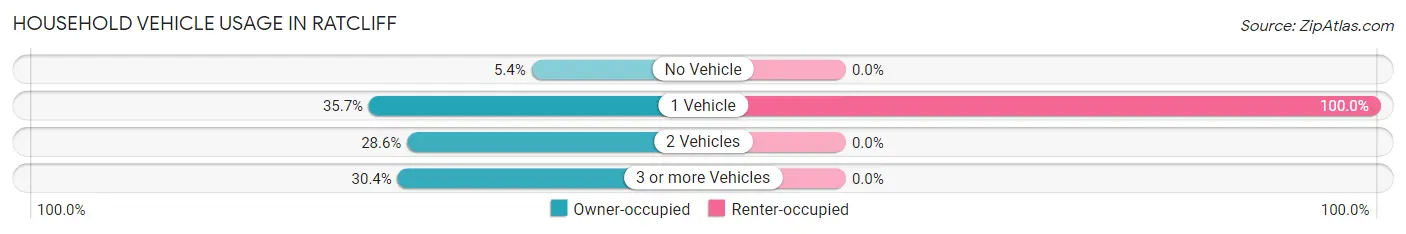
| Vehicles per Household | Owner-occupied | Renter-occupied |
| No Vehicle | 3 (5.4%) | 0 (0.0%) |
| 1 Vehicle | 20 (35.7%) | 19 (100.0%) |
| 2 Vehicles | 16 (28.6%) | 0 (0.0%) |
| 3 or more Vehicles | 17 (30.4%) | 0 (0.0%) |
| Total | 56 (100.0%) | 19 (100.0%) |
Real Estate & Mortgages in Ratcliff
Real Estate and Mortgage Overview in Ratcliff
| Characteristic | Without Mortgage | With Mortgage |
| Housing Units | 34 | 22 |
| Median Property Value | $75,000 | $108,300 |
| Median Household Income | $41,250 | $2 |
| Monthly Housing Costs | $300 | $0 |
| Real Estate Taxes | $460 | $3 |
Property Value by Mortgage Status in Ratcliff
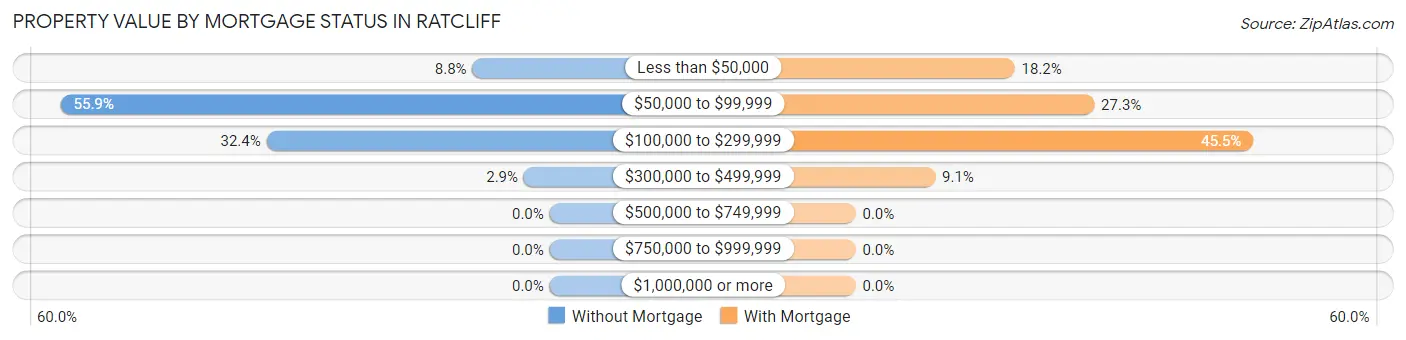
| Property Value | Without Mortgage | With Mortgage |
| Less than $50,000 | 3 (8.8%) | 4 (18.2%) |
| $50,000 to $99,999 | 19 (55.9%) | 6 (27.3%) |
| $100,000 to $299,999 | 11 (32.4%) | 10 (45.5%) |
| $300,000 to $499,999 | 1 (2.9%) | 2 (9.1%) |
| $500,000 to $749,999 | 0 (0.0%) | 0 (0.0%) |
| $750,000 to $999,999 | 0 (0.0%) | 0 (0.0%) |
| $1,000,000 or more | 0 (0.0%) | 0 (0.0%) |
| Total | 34 (100.0%) | 22 (100.0%) |
Household Income by Mortgage Status in Ratcliff
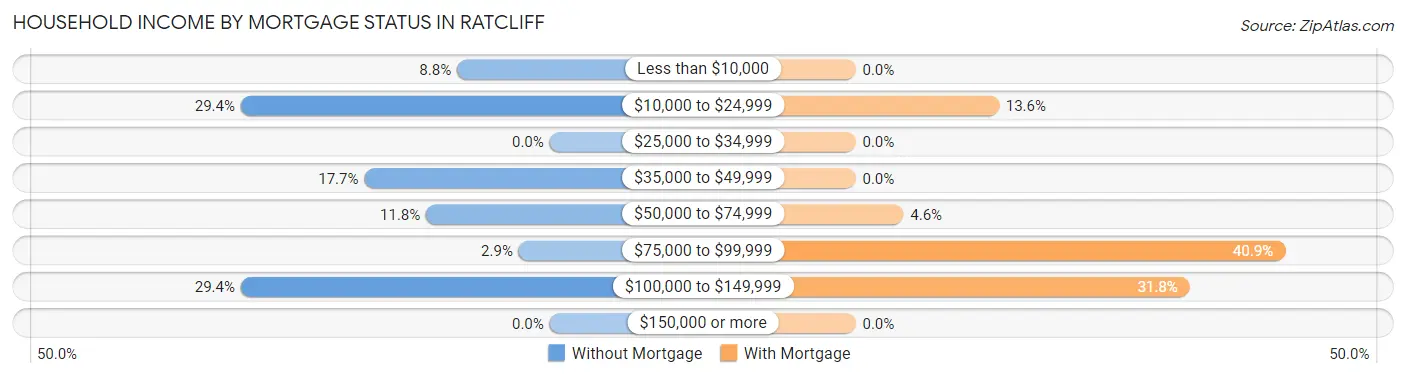
| Household Income | Without Mortgage | With Mortgage |
| Less than $10,000 | 3 (8.8%) | 0 (0.0%) |
| $10,000 to $24,999 | 10 (29.4%) | 3 (13.6%) |
| $25,000 to $34,999 | 0 (0.0%) | 0 (0.0%) |
| $35,000 to $49,999 | 6 (17.6%) | 0 (0.0%) |
| $50,000 to $74,999 | 4 (11.8%) | 1 (4.5%) |
| $75,000 to $99,999 | 1 (2.9%) | 9 (40.9%) |
| $100,000 to $149,999 | 10 (29.4%) | 7 (31.8%) |
| $150,000 or more | 0 (0.0%) | 0 (0.0%) |
| Total | 34 (100.0%) | 22 (100.0%) |
Property Value to Household Income Ratio in Ratcliff
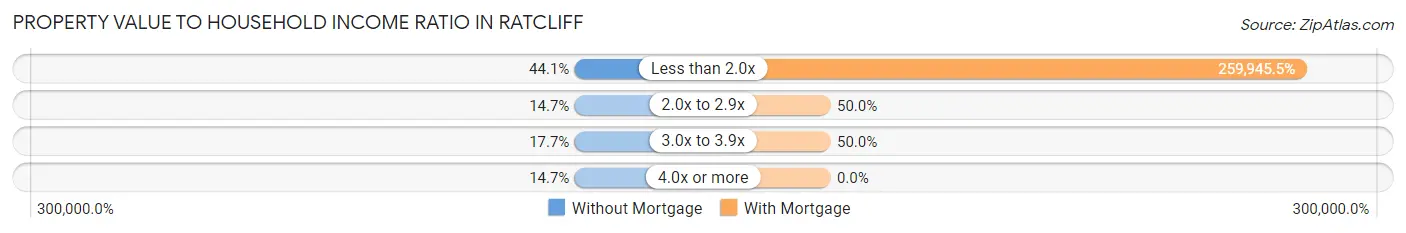
| Value-to-Income Ratio | Without Mortgage | With Mortgage |
| Less than 2.0x | 15 (44.1%) | 57,188 (259,945.4%) |
| 2.0x to 2.9x | 5 (14.7%) | 11 (50.0%) |
| 3.0x to 3.9x | 6 (17.6%) | 11 (50.0%) |
| 4.0x or more | 5 (14.7%) | 0 (0.0%) |
| Total | 34 (100.0%) | 22 (100.0%) |
Real Estate Taxes by Mortgage Status in Ratcliff
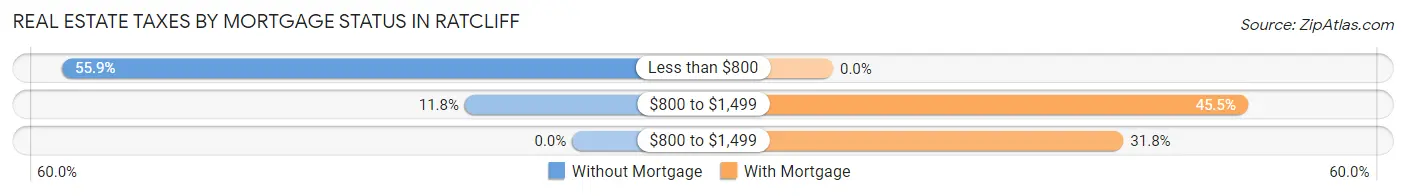
| Property Taxes | Without Mortgage | With Mortgage |
| Less than $800 | 19 (55.9%) | 0 (0.0%) |
| $800 to $1,499 | 4 (11.8%) | 10 (45.5%) |
| $800 to $1,499 | 0 (0.0%) | 7 (31.8%) |
| Total | 34 (100.0%) | 22 (100.0%) |
Health & Disability in Ratcliff
Health Insurance Coverage by Age in Ratcliff
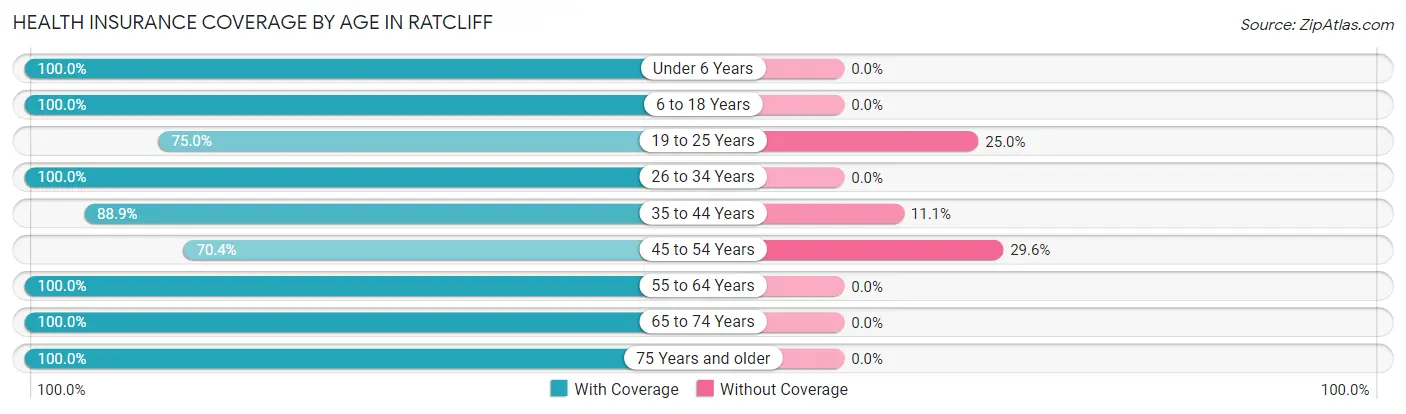
| Age Bracket | With Coverage | Without Coverage |
| Under 6 Years | 17 (100.0%) | 0 (0.0%) |
| 6 to 18 Years | 8 (100.0%) | 0 (0.0%) |
| 19 to 25 Years | 6 (75.0%) | 2 (25.0%) |
| 26 to 34 Years | 22 (100.0%) | 0 (0.0%) |
| 35 to 44 Years | 8 (88.9%) | 1 (11.1%) |
| 45 to 54 Years | 19 (70.4%) | 8 (29.6%) |
| 55 to 64 Years | 13 (100.0%) | 0 (0.0%) |
| 65 to 74 Years | 18 (100.0%) | 0 (0.0%) |
| 75 Years and older | 20 (100.0%) | 0 (0.0%) |
| Total | 131 (92.2%) | 11 (7.7%) |
Health Insurance Coverage by Citizenship Status in Ratcliff
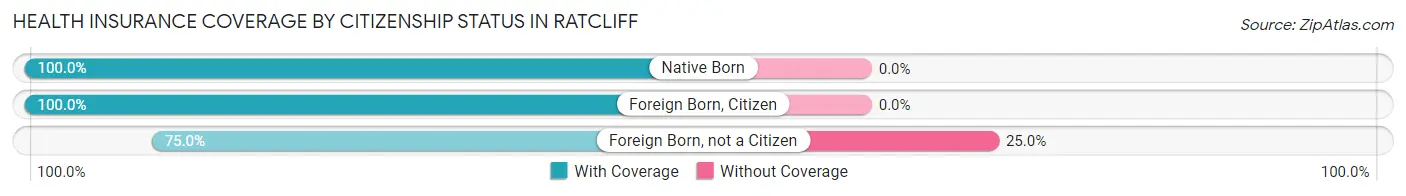
| Citizenship Status | With Coverage | Without Coverage |
| Native Born | 17 (100.0%) | 0 (0.0%) |
| Foreign Born, Citizen | 8 (100.0%) | 0 (0.0%) |
| Foreign Born, not a Citizen | 6 (75.0%) | 2 (25.0%) |
Health Insurance Coverage by Household Income in Ratcliff
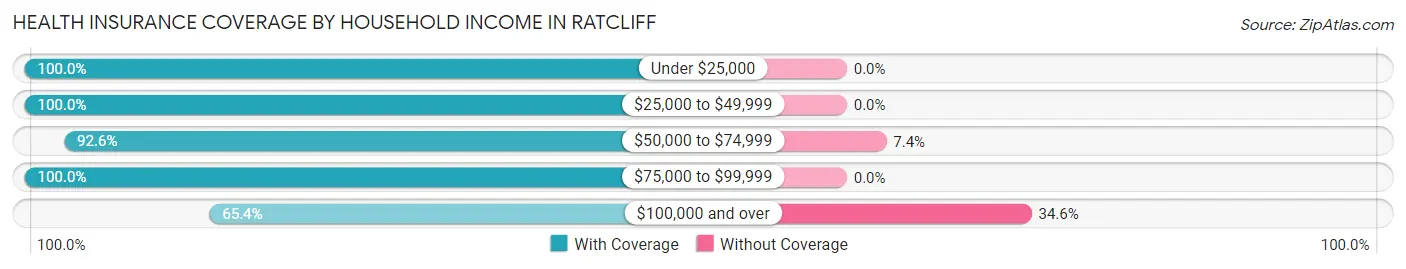
| Household Income | With Coverage | Without Coverage |
| Under $25,000 | 35 (100.0%) | 0 (0.0%) |
| $25,000 to $49,999 | 32 (100.0%) | 0 (0.0%) |
| $50,000 to $74,999 | 25 (92.6%) | 2 (7.4%) |
| $75,000 to $99,999 | 22 (100.0%) | 0 (0.0%) |
| $100,000 and over | 17 (65.4%) | 9 (34.6%) |
Public vs Private Health Insurance Coverage by Age in Ratcliff
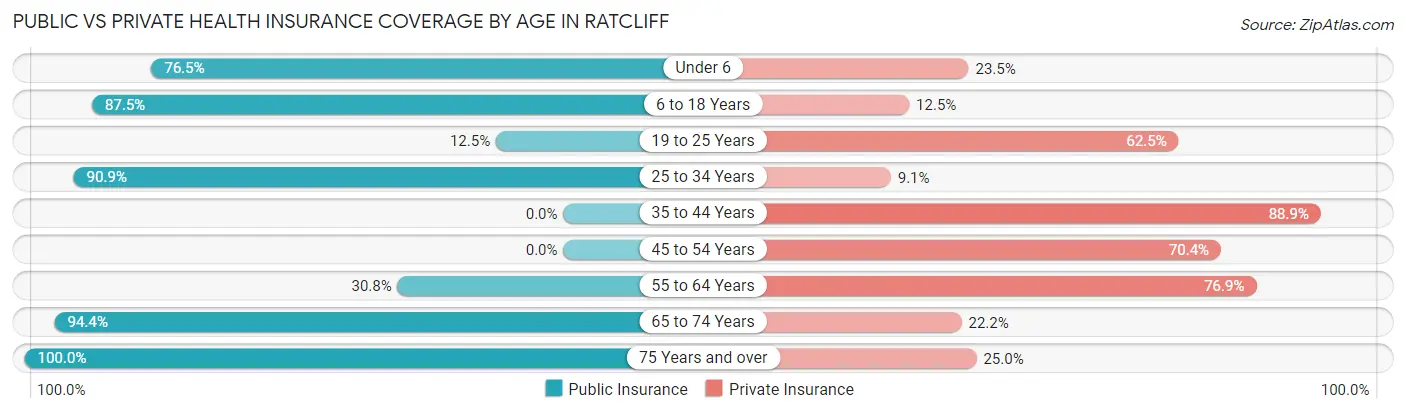
| Age Bracket | Public Insurance | Private Insurance |
| Under 6 | 13 (76.5%) | 4 (23.5%) |
| 6 to 18 Years | 7 (87.5%) | 1 (12.5%) |
| 19 to 25 Years | 1 (12.5%) | 5 (62.5%) |
| 25 to 34 Years | 20 (90.9%) | 2 (9.1%) |
| 35 to 44 Years | 0 (0.0%) | 8 (88.9%) |
| 45 to 54 Years | 0 (0.0%) | 19 (70.4%) |
| 55 to 64 Years | 4 (30.8%) | 10 (76.9%) |
| 65 to 74 Years | 17 (94.4%) | 4 (22.2%) |
| 75 Years and over | 20 (100.0%) | 5 (25.0%) |
| Total | 82 (57.8%) | 58 (40.8%) |
Disability Status by Sex by Age in Ratcliff
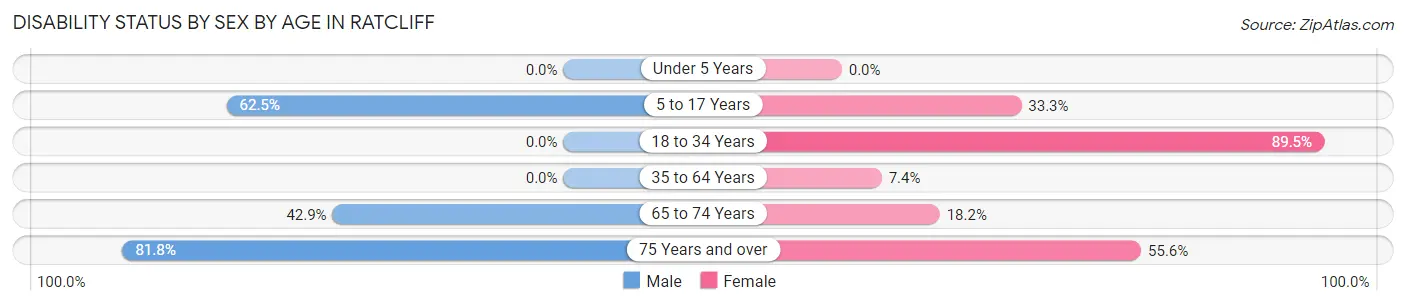
| Age Bracket | Male | Female |
| Under 5 Years | 0 (0.0%) | 0 (0.0%) |
| 5 to 17 Years | 5 (62.5%) | 1 (33.3%) |
| 18 to 34 Years | 0 (0.0%) | 17 (89.5%) |
| 35 to 64 Years | 0 (0.0%) | 2 (7.4%) |
| 65 to 74 Years | 3 (42.9%) | 2 (18.2%) |
| 75 Years and over | 9 (81.8%) | 5 (55.6%) |
Disability Class by Sex by Age in Ratcliff
Disability Class: Hearing Difficulty
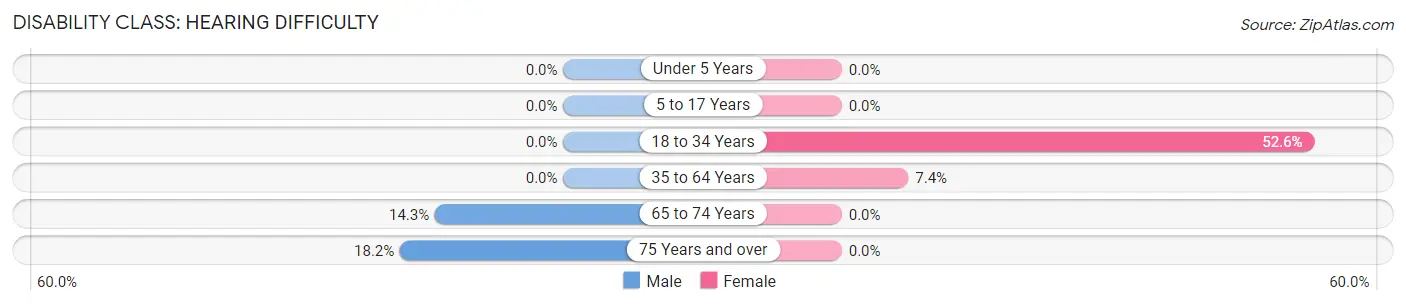
| Age Bracket | Male | Female |
| Under 5 Years | 0 (0.0%) | 0 (0.0%) |
| 5 to 17 Years | 0 (0.0%) | 0 (0.0%) |
| 18 to 34 Years | 0 (0.0%) | 10 (52.6%) |
| 35 to 64 Years | 0 (0.0%) | 2 (7.4%) |
| 65 to 74 Years | 1 (14.3%) | 0 (0.0%) |
| 75 Years and over | 2 (18.2%) | 0 (0.0%) |
Disability Class: Vision Difficulty
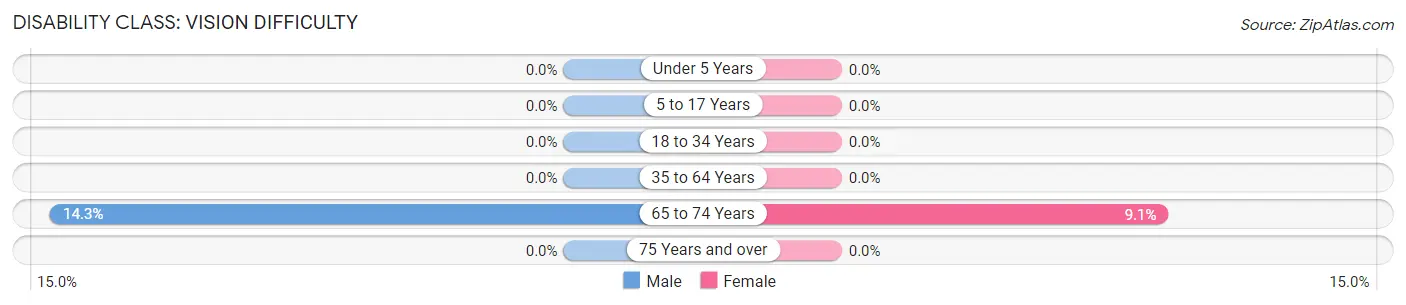
| Age Bracket | Male | Female |
| Under 5 Years | 0 (0.0%) | 0 (0.0%) |
| 5 to 17 Years | 0 (0.0%) | 0 (0.0%) |
| 18 to 34 Years | 0 (0.0%) | 0 (0.0%) |
| 35 to 64 Years | 0 (0.0%) | 0 (0.0%) |
| 65 to 74 Years | 1 (14.3%) | 1 (9.1%) |
| 75 Years and over | 0 (0.0%) | 0 (0.0%) |
Disability Class: Cognitive Difficulty
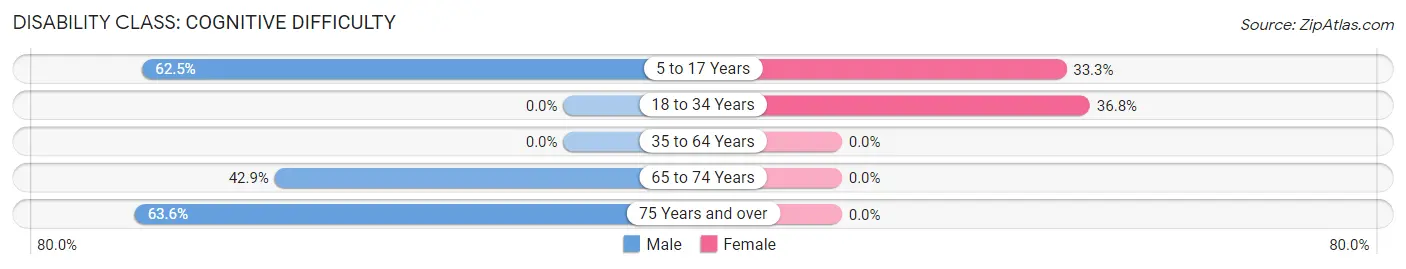
| Age Bracket | Male | Female |
| 5 to 17 Years | 5 (62.5%) | 1 (33.3%) |
| 18 to 34 Years | 0 (0.0%) | 7 (36.8%) |
| 35 to 64 Years | 0 (0.0%) | 0 (0.0%) |
| 65 to 74 Years | 3 (42.9%) | 0 (0.0%) |
| 75 Years and over | 7 (63.6%) | 0 (0.0%) |
Disability Class: Ambulatory Difficulty
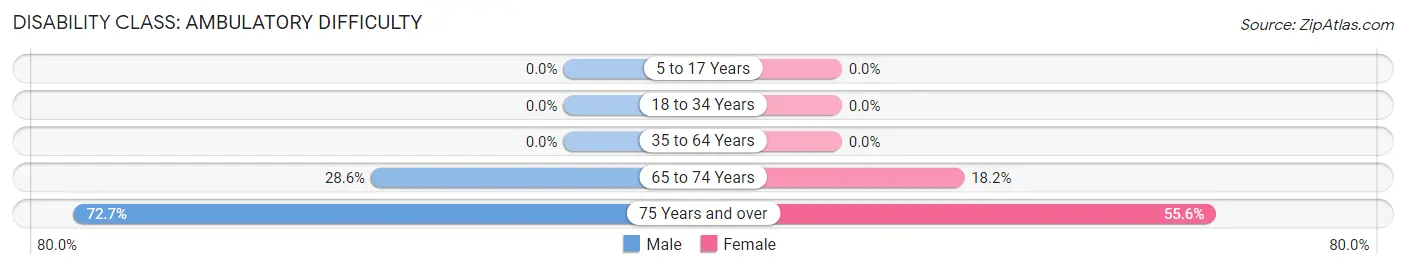
| Age Bracket | Male | Female |
| 5 to 17 Years | 0 (0.0%) | 0 (0.0%) |
| 18 to 34 Years | 0 (0.0%) | 0 (0.0%) |
| 35 to 64 Years | 0 (0.0%) | 0 (0.0%) |
| 65 to 74 Years | 2 (28.6%) | 2 (18.2%) |
| 75 Years and over | 8 (72.7%) | 5 (55.6%) |
Disability Class: Self-Care Difficulty
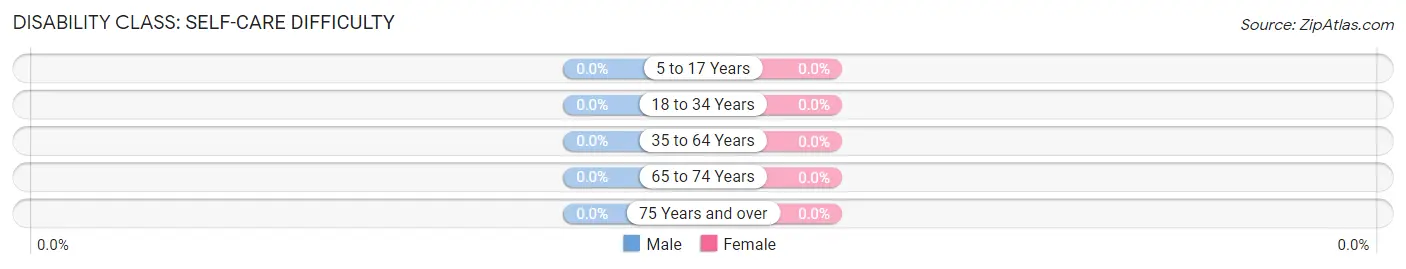
| Age Bracket | Male | Female |
| 5 to 17 Years | 0 (0.0%) | 0 (0.0%) |
| 18 to 34 Years | 0 (0.0%) | 0 (0.0%) |
| 35 to 64 Years | 0 (0.0%) | 0 (0.0%) |
| 65 to 74 Years | 0 (0.0%) | 0 (0.0%) |
| 75 Years and over | 0 (0.0%) | 0 (0.0%) |
Technology Access in Ratcliff
Computing Device Access in Ratcliff
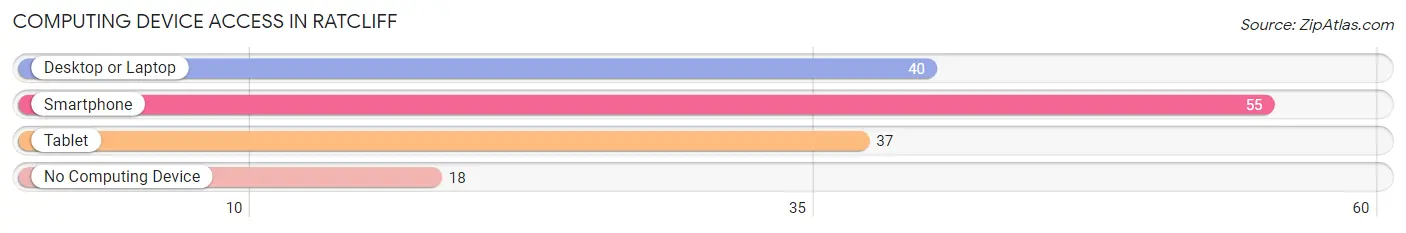
| Device Type | # Households | % Households |
| Desktop or Laptop | 40 | 53.3% |
| Smartphone | 55 | 73.3% |
| Tablet | 37 | 49.3% |
| No Computing Device | 18 | 24.0% |
| Total | 75 | 100.0% |
Internet Access in Ratcliff
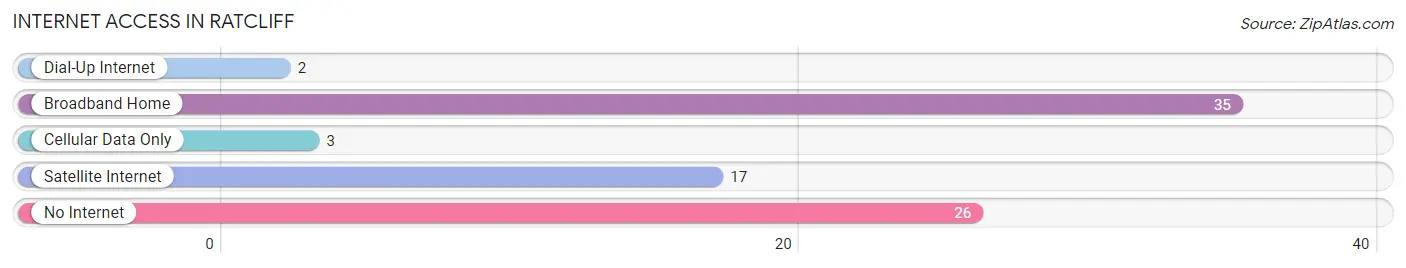
| Internet Type | # Households | % Households |
| Dial-Up Internet | 2 | 2.7% |
| Broadband Home | 35 | 46.7% |
| Cellular Data Only | 3 | 4.0% |
| Satellite Internet | 17 | 22.7% |
| No Internet | 26 | 34.7% |
| Total | 75 | 100.0% |
Ratcliff Summary
The city of Ratcliff, Arkansas is located in the southeastern corner of the state, in the foothills of the Ozark Mountains. It is situated in the Arkansas River Valley, and is the county seat of Clark County. Ratcliff is a small town with a population of just over 1,000 people, and is known for its rural charm and friendly atmosphere.
History
The area that is now Ratcliff was first settled in the early 1800s by settlers from Tennessee and Kentucky. The town was originally known as “Ratliff”, after the Ratliff family who were among the first settlers. The town was officially incorporated in 1883, and the name was changed to Ratcliff.
The town was an important stop on the St. Louis-San Francisco Railway, which ran through the area in the late 19th century. This helped to spur the growth of the town, and it soon became a thriving agricultural center. The town was also home to a number of businesses, including a cotton gin, a sawmill, and a gristmill.
Geography
Ratcliff is located in the Arkansas River Valley, in the foothills of the Ozark Mountains. The town is situated at the intersection of State Highway 7 and State Highway 8. The town is surrounded by rolling hills and forests, and is located about 30 miles south of Little Rock.
The climate in Ratcliff is mild and humid, with hot summers and mild winters. The average annual temperature is around 65 degrees Fahrenheit, and the average annual precipitation is around 45 inches.
Economy
The economy of Ratcliff is largely based on agriculture. The town is home to a number of farms, and the surrounding area is known for its production of cotton, soybeans, and other crops. The town is also home to a number of small businesses, including restaurants, retail stores, and service providers.
Demographics
As of the 2010 census, the population of Ratcliff was 1,072. The racial makeup of the town was 95.3% White, 0.9% African American, 0.3% Native American, 0.2% Asian, and 3.3% from other races. The median household income was $30,938, and the median family income was $37,500.
Ratcliff is a small, rural town with a friendly atmosphere and a strong sense of community. The town is home to a number of churches, and is known for its strong religious values. The town is also home to a number of parks and recreational areas, and is a popular destination for outdoor enthusiasts.
Common Questions
What is Per Capita Income in Ratcliff?
Per Capita income in Ratcliff is $31,620.
What is the Median Family Income in Ratcliff?
Median Family Income in Ratcliff is $55,417.
What is the Median Household income in Ratcliff?
Median Household Income in Ratcliff is $51,250.
What is Inequality or Gini Index in Ratcliff?
Inequality or Gini Index in Ratcliff is 0.46.
What is the Total Population of Ratcliff?
Total Population of Ratcliff is 142.
What is the Total Male Population of Ratcliff?
Total Male Population of Ratcliff is 66.
What is the Total Female Population of Ratcliff?
Total Female Population of Ratcliff is 76.
What is the Ratio of Males per 100 Females in Ratcliff?
There are 86.84 Males per 100 Females in Ratcliff.
What is the Ratio of Females per 100 Males in Ratcliff?
There are 115.15 Females per 100 Males in Ratcliff.
What is the Median Population Age in Ratcliff?
Median Population Age in Ratcliff is 46.8 Years.
What is the Average Family Size in Ratcliff
Average Family Size in Ratcliff is 2.9 People.
What is the Average Household Size in Ratcliff
Average Household Size in Ratcliff is 1.9 People.
How Large is the Labor Force in Ratcliff?
There are 77 People in the Labor Forcein in Ratcliff.
What is the Percentage of People in the Labor Force in Ratcliff?
65.3% of People are in the Labor Force in Ratcliff.
What is the Unemployment Rate in Ratcliff?
Unemployment Rate in Ratcliff is 14.3%.