Sheridan, AR Map & Demographics
Sheridan Map
Sheridan Overview
$27,554
PER CAPITA INCOME
$72,500
AVG FAMILY INCOME
$55,520
AVG HOUSEHOLD INCOME
10.7%
WAGE / INCOME GAP [ % ]
89.3¢/ $1
WAGE / INCOME GAP [ $ ]
0.41
INEQUALITY / GINI INDEX
5,002
TOTAL POPULATION
2,193
MALE POPULATION
2,809
FEMALE POPULATION
78.07
MALES / 100 FEMALES
128.09
FEMALES / 100 MALES
38.4
MEDIAN AGE
3.2
AVG FAMILY SIZE
2.5
AVG HOUSEHOLD SIZE
1,684
LABOR FORCE [ PEOPLE ]
44.0%
PERCENT IN LABOR FORCE
3.9%
UNEMPLOYMENT RATE
Sheridan Zip Codes
Sheridan Area Codes
Income in Sheridan
Income Overview in Sheridan
Per Capita Income in Sheridan is $27,554, while median incomes of families and households are $72,500 and $55,520 respectively.
| Characteristic | Number | Measure |
| Per Capita Income | 5,002 | $27,554 |
| Median Family Income | 1,234 | $72,500 |
| Mean Family Income | 1,234 | $82,775 |
| Median Household Income | 1,965 | $55,520 |
| Mean Household Income | 1,965 | $66,619 |
| Income Deficit | 1,234 | $0 |
| Wage / Income Gap (%) | 5,002 | 10.67% |
| Wage / Income Gap ($) | 5,002 | 89.33¢ per $1 |
| Gini / Inequality Index | 5,002 | 0.41 |
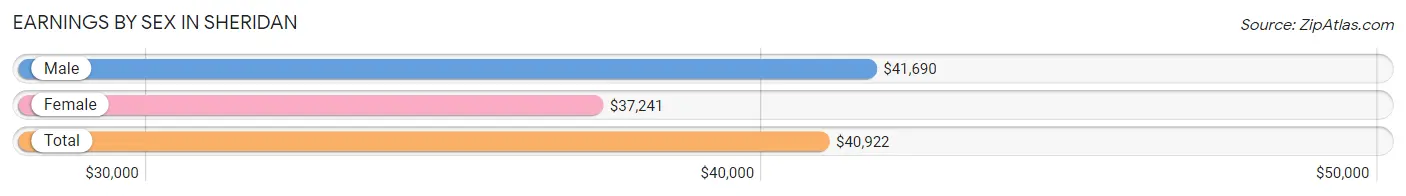
Earnings by Sex in Sheridan
Average Earnings in Sheridan are $40,922, $41,690 for men and $37,241 for women, a difference of 10.7%.
| Sex | Number | Average Earnings |
| Male | 909 (47.6%) | $41,690 |
| Female | 1,001 (52.4%) | $37,241 |
| Total | 1,910 (100.0%) | $40,922 |
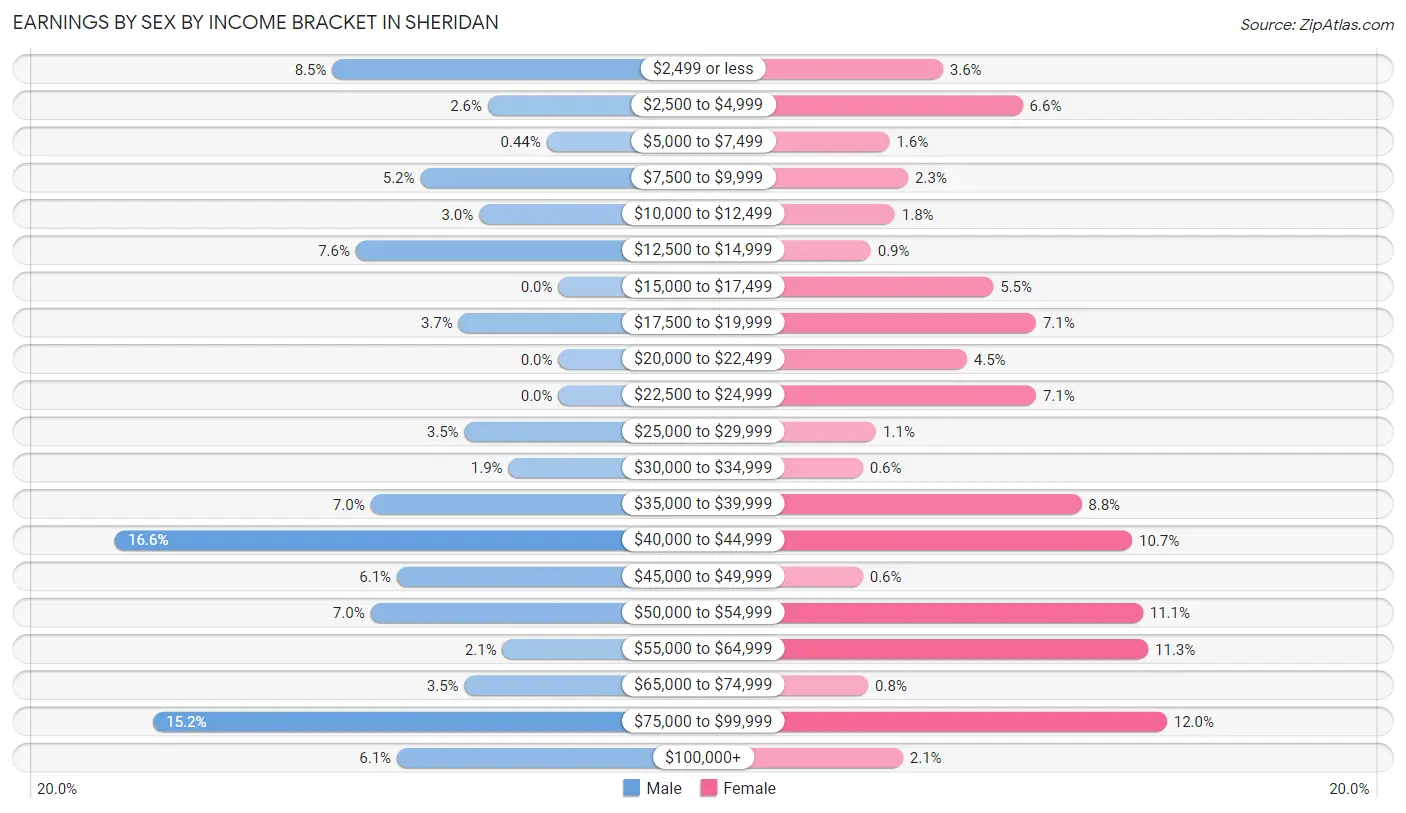
Earnings by Sex by Income Bracket in Sheridan
The most common earnings brackets in Sheridan are $40,000 to $44,999 for men (151 | 16.6%) and $75,000 to $99,999 for women (120 | 12.0%).
| Income | Male | Female |
| $2,499 or less | 77 (8.5%) | 36 (3.6%) |
| $2,500 to $4,999 | 24 (2.6%) | 66 (6.6%) |
| $5,000 to $7,499 | 4 (0.4%) | 16 (1.6%) |
| $7,500 to $9,999 | 47 (5.2%) | 23 (2.3%) |
| $10,000 to $12,499 | 27 (3.0%) | 18 (1.8%) |
| $12,500 to $14,999 | 69 (7.6%) | 9 (0.9%) |
| $15,000 to $17,499 | 0 (0.0%) | 55 (5.5%) |
| $17,500 to $19,999 | 34 (3.7%) | 71 (7.1%) |
| $20,000 to $22,499 | 0 (0.0%) | 45 (4.5%) |
| $22,500 to $24,999 | 0 (0.0%) | 71 (7.1%) |
| $25,000 to $29,999 | 32 (3.5%) | 11 (1.1%) |
| $30,000 to $34,999 | 17 (1.9%) | 6 (0.6%) |
| $35,000 to $39,999 | 64 (7.0%) | 88 (8.8%) |
| $40,000 to $44,999 | 151 (16.6%) | 107 (10.7%) |
| $45,000 to $49,999 | 55 (6.0%) | 6 (0.6%) |
| $50,000 to $54,999 | 64 (7.0%) | 111 (11.1%) |
| $55,000 to $64,999 | 19 (2.1%) | 113 (11.3%) |
| $65,000 to $74,999 | 32 (3.5%) | 8 (0.8%) |
| $75,000 to $99,999 | 138 (15.2%) | 120 (12.0%) |
| $100,000+ | 55 (6.0%) | 21 (2.1%) |
| Total | 909 (100.0%) | 1,001 (100.0%) |
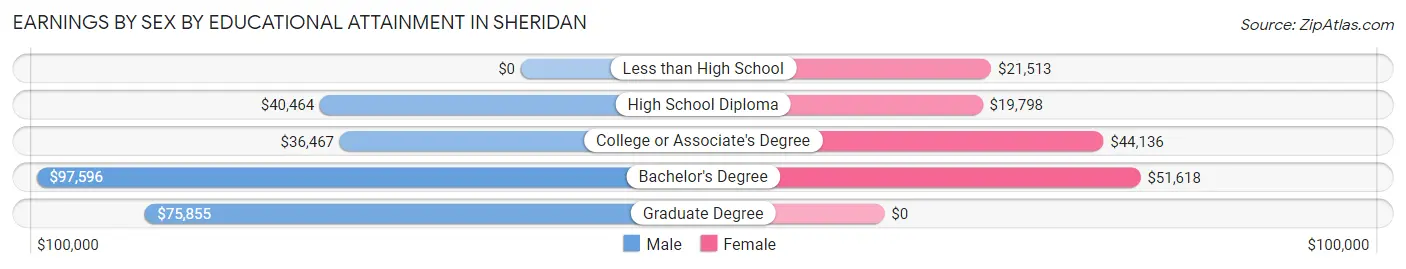
Earnings by Sex by Educational Attainment in Sheridan
Average earnings in Sheridan are $42,560 for men and $43,562 for women, a difference of 2.3%. Men with an educational attainment of bachelor's degree enjoy the highest average annual earnings of $97,596, while those with college or associate's degree education earn the least with $36,467. Women with an educational attainment of bachelor's degree earn the most with the average annual earnings of $51,618, while those with high school diploma education have the smallest earnings of $19,798.
| Educational Attainment | Male Income | Female Income |
| Less than High School | - | - |
| High School Diploma | $40,464 | $19,798 |
| College or Associate's Degree | $36,467 | $44,136 |
| Bachelor's Degree | $97,596 | $51,618 |
| Graduate Degree | $75,855 | $0 |
| Total | $42,560 | $43,562 |
Family Income in Sheridan
Family Income Brackets in Sheridan
According to the Sheridan family income data, there are 304 families falling into the $75,000 to $99,999 income range, which is the most common income bracket and makes up 24.6% of all families. Conversely, the less than $10,000 income bracket is the least frequent group with only 25 families (2.0%) belonging to this category.
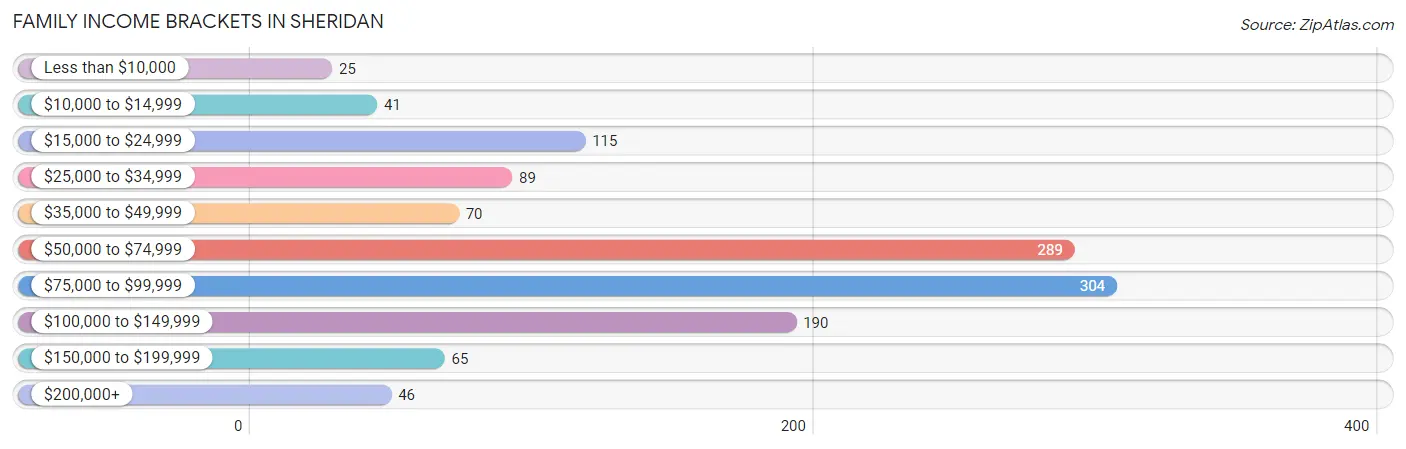
| Income Bracket | # Families | % Families |
| Less than $10,000 | 25 | 2.0% |
| $10,000 to $14,999 | 41 | 3.3% |
| $15,000 to $24,999 | 115 | 9.3% |
| $25,000 to $34,999 | 89 | 7.2% |
| $35,000 to $49,999 | 70 | 5.7% |
| $50,000 to $74,999 | 289 | 23.4% |
| $75,000 to $99,999 | 304 | 24.6% |
| $100,000 to $149,999 | 190 | 15.4% |
| $150,000 to $199,999 | 65 | 5.3% |
| $200,000+ | 46 | 3.7% |
Family Income by Famaliy Size in Sheridan
5-person families (29 | 2.4%) account for the highest median family income in Sheridan with $131,016 per family, while 2-person families (544 | 44.1%) have the highest median income of $37,361 per family member.
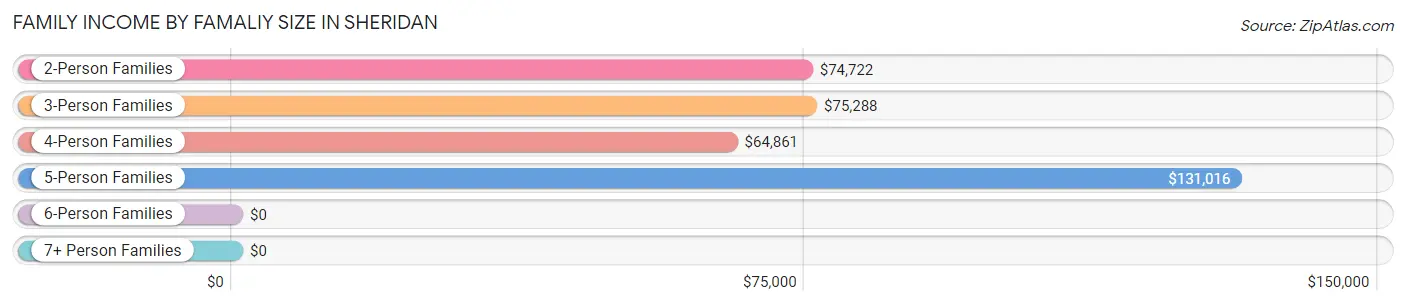
| Income Bracket | # Families | Median Income |
| 2-Person Families | 544 (44.1%) | $74,722 |
| 3-Person Families | 385 (31.2%) | $75,288 |
| 4-Person Families | 276 (22.4%) | $64,861 |
| 5-Person Families | 29 (2.4%) | $131,016 |
| 6-Person Families | 0 (0.0%) | $0 |
| 7+ Person Families | 0 (0.0%) | $0 |
| Total | 1,234 (100.0%) | $72,500 |
Family Income by Number of Earners in Sheridan
The median family income in Sheridan is $72,500, with families comprising 3+ earners (88) having the highest median family income of $129,773, while families with 1 earner (527) have the lowest median family income of $56,693, accounting for 7.1% and 42.7% of families, respectively.
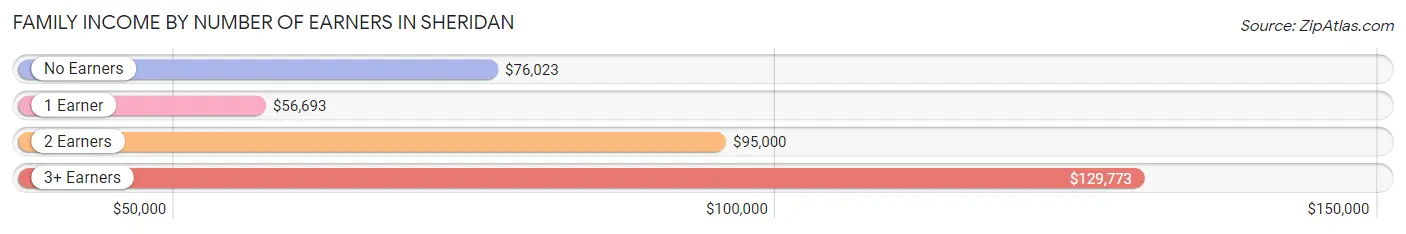
| Number of Earners | # Families | Median Income |
| No Earners | 257 (20.8%) | $76,023 |
| 1 Earner | 527 (42.7%) | $56,693 |
| 2 Earners | 362 (29.3%) | $95,000 |
| 3+ Earners | 88 (7.1%) | $129,773 |
| Total | 1,234 (100.0%) | $72,500 |
Household Income in Sheridan
Household Income Brackets in Sheridan
With 421 households falling in the category, the $75,000 to $99,999 income range is the most frequent in Sheridan, accounting for 21.4% of all households. In contrast, only 24 households (1.2%) fall into the less than $10,000 income bracket, making it the least populous group.
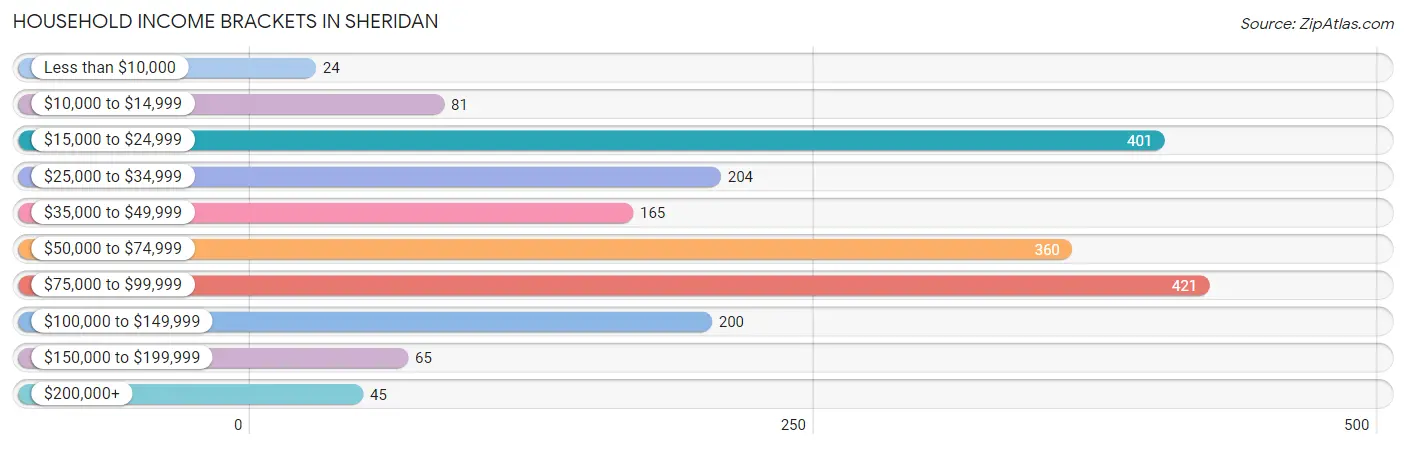
| Income Bracket | # Households | % Households |
| Less than $10,000 | 24 | 1.2% |
| $10,000 to $14,999 | 81 | 4.1% |
| $15,000 to $24,999 | 401 | 20.4% |
| $25,000 to $34,999 | 204 | 10.4% |
| $35,000 to $49,999 | 165 | 8.4% |
| $50,000 to $74,999 | 360 | 18.3% |
| $75,000 to $99,999 | 421 | 21.4% |
| $100,000 to $149,999 | 200 | 10.2% |
| $150,000 to $199,999 | 65 | 3.3% |
| $200,000+ | 45 | 2.3% |
Household Income by Householder Age in Sheridan
The median household income in Sheridan is $55,520, with the highest median household income of $77,670 found in the 25 to 44 years age bracket for the primary householder. A total of 616 households (31.4%) fall into this category. Meanwhile, the 65+ years age bracket for the primary householder has the lowest median household income of $32,938, with 805 households (41.0%) in this group.
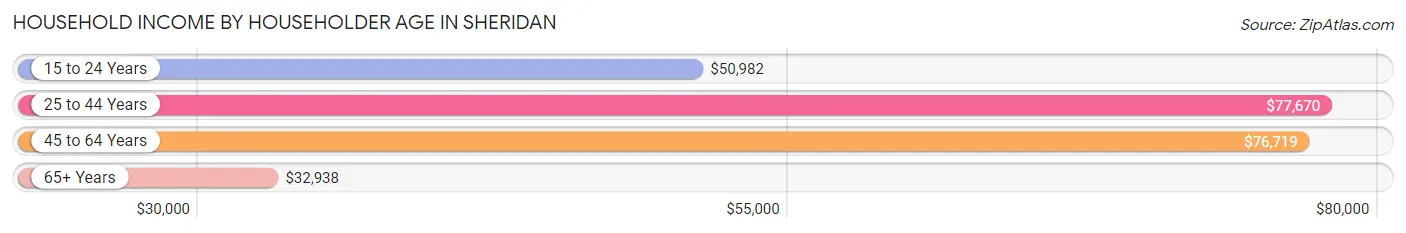
| Income Bracket | # Households | Median Income |
| 15 to 24 Years | 51 (2.6%) | $50,982 |
| 25 to 44 Years | 616 (31.4%) | $77,670 |
| 45 to 64 Years | 493 (25.1%) | $76,719 |
| 65+ Years | 805 (41.0%) | $32,938 |
| Total | 1,965 (100.0%) | $55,520 |
Poverty in Sheridan
Income Below Poverty by Sex and Age in Sheridan
With 18.4% poverty level for males and 15.9% for females among the residents of Sheridan, 6 to 11 year old males and 5 year old females are the most vulnerable to poverty, with 132 males (51.6%) and 50 females (100.0%) in their respective age groups living below the poverty level.
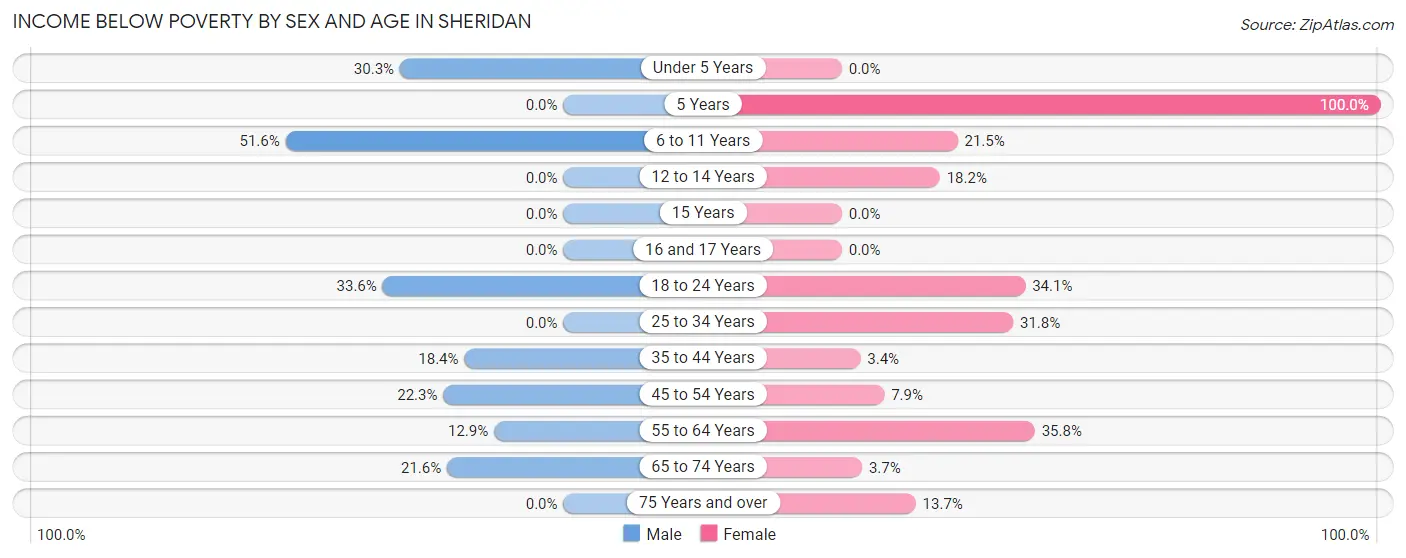
| Age Bracket | Male | Female |
| Under 5 Years | 44 (30.3%) | 0 (0.0%) |
| 5 Years | 0 (0.0%) | 50 (100.0%) |
| 6 to 11 Years | 132 (51.6%) | 49 (21.5%) |
| 12 to 14 Years | 0 (0.0%) | 22 (18.2%) |
| 15 Years | 0 (0.0%) | 0 (0.0%) |
| 16 and 17 Years | 0 (0.0%) | 0 (0.0%) |
| 18 to 24 Years | 51 (33.6%) | 63 (34.1%) |
| 25 to 34 Years | 0 (0.0%) | 75 (31.8%) |
| 35 to 44 Years | 54 (18.4%) | 12 (3.4%) |
| 45 to 54 Years | 45 (22.3%) | 33 (7.9%) |
| 55 to 64 Years | 18 (12.9%) | 82 (35.8%) |
| 65 to 74 Years | 38 (21.6%) | 13 (3.7%) |
| 75 Years and over | 0 (0.0%) | 34 (13.7%) |
| Total | 382 (18.4%) | 433 (15.9%) |
Income Above Poverty by Sex and Age in Sheridan
According to the poverty statistics in Sheridan, males aged 5 years and females aged under 5 years are the age groups that are most secure financially, with 100.0% of males and 100.0% of females in these age groups living above the poverty line.
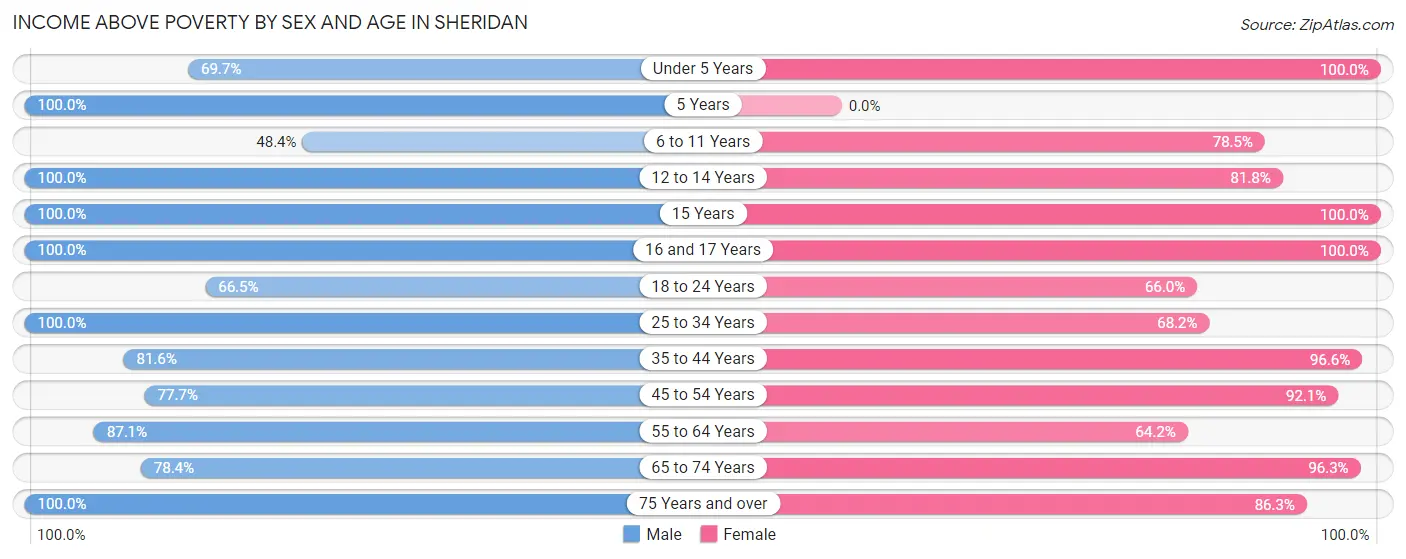
| Age Bracket | Male | Female |
| Under 5 Years | 101 (69.7%) | 198 (100.0%) |
| 5 Years | 3 (100.0%) | 0 (0.0%) |
| 6 to 11 Years | 124 (48.4%) | 179 (78.5%) |
| 12 to 14 Years | 45 (100.0%) | 99 (81.8%) |
| 15 Years | 25 (100.0%) | 64 (100.0%) |
| 16 and 17 Years | 144 (100.0%) | 45 (100.0%) |
| 18 to 24 Years | 101 (66.4%) | 122 (65.9%) |
| 25 to 34 Years | 301 (100.0%) | 161 (68.2%) |
| 35 to 44 Years | 240 (81.6%) | 337 (96.6%) |
| 45 to 54 Years | 157 (77.7%) | 386 (92.1%) |
| 55 to 64 Years | 122 (87.1%) | 147 (64.2%) |
| 65 to 74 Years | 138 (78.4%) | 335 (96.3%) |
| 75 Years and over | 195 (100.0%) | 214 (86.3%) |
| Total | 1,696 (81.6%) | 2,287 (84.1%) |
Income Below Poverty Among Married-Couple Families in Sheridan
The poverty statistics for married-couple families in Sheridan show that 7.3% or 50 of the total 684 families live below the poverty line. Families with 1 or 2 children have the highest poverty rate of 11.3%, comprising of 32 families. On the other hand, families with 3 or 4 children have the lowest poverty rate of 0.0%, which includes 0 families.
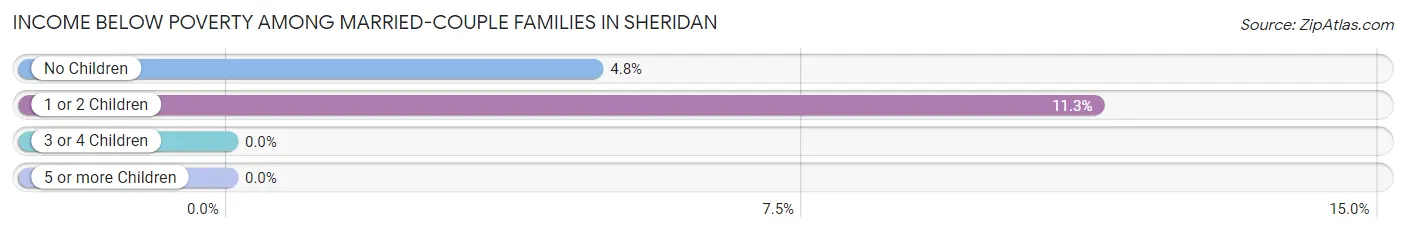
| Children | Above Poverty | Below Poverty |
| No Children | 359 (95.2%) | 18 (4.8%) |
| 1 or 2 Children | 251 (88.7%) | 32 (11.3%) |
| 3 or 4 Children | 24 (100.0%) | 0 (0.0%) |
| 5 or more Children | 0 (0.0%) | 0 (0.0%) |
| Total | 634 (92.7%) | 50 (7.3%) |
Income Below Poverty Among Single-Parent Households in Sheridan
According to the poverty data in Sheridan, 37.6% or 41 single-father households and 22.7% or 100 single-mother households are living below the poverty line. Among single-father households, those with no children have the highest poverty rate, with 27 households (41.5%) experiencing poverty. Likewise, among single-mother households, those with 3 or 4 children have the highest poverty rate, with 42 households (48.8%) falling below the poverty line.
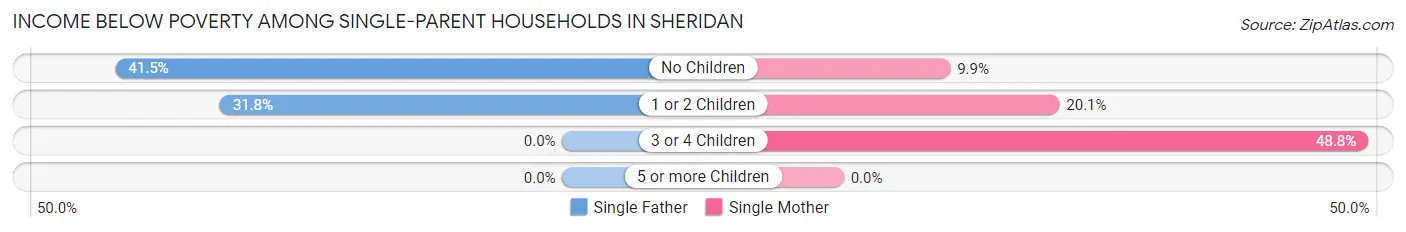
| Children | Single Father | Single Mother |
| No Children | 27 (41.5%) | 13 (9.9%) |
| 1 or 2 Children | 14 (31.8%) | 45 (20.1%) |
| 3 or 4 Children | 0 (0.0%) | 42 (48.8%) |
| 5 or more Children | 0 (0.0%) | 0 (0.0%) |
| Total | 41 (37.6%) | 100 (22.7%) |
Income Below Poverty Among Married-Couple vs Single-Parent Households in Sheridan
The poverty data for Sheridan shows that 50 of the married-couple family households (7.3%) and 141 of the single-parent households (25.6%) are living below the poverty level. Within the married-couple family households, those with 1 or 2 children have the highest poverty rate, with 32 households (11.3%) falling below the poverty line. Among the single-parent households, those with 3 or 4 children have the highest poverty rate, with 42 household (48.8%) living below poverty.
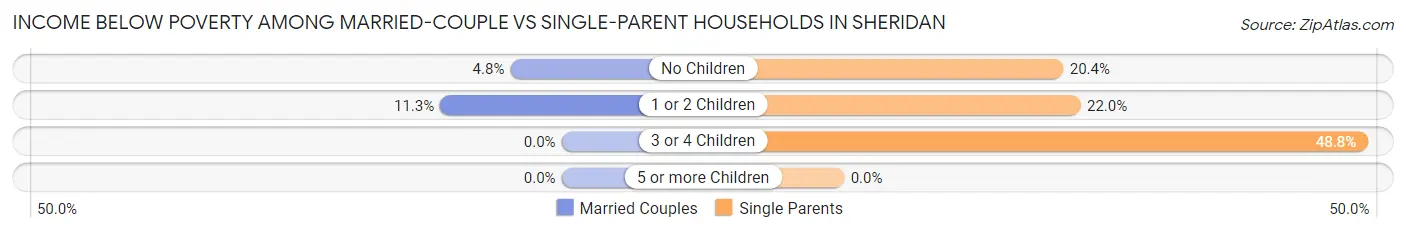
| Children | Married-Couple Families | Single-Parent Households |
| No Children | 18 (4.8%) | 40 (20.4%) |
| 1 or 2 Children | 32 (11.3%) | 59 (22.0%) |
| 3 or 4 Children | 0 (0.0%) | 42 (48.8%) |
| 5 or more Children | 0 (0.0%) | 0 (0.0%) |
| Total | 50 (7.3%) | 141 (25.6%) |
Race in Sheridan
The most populous races in Sheridan are White / Caucasian (4,598 | 91.9%), Black / African American (169 | 3.4%), and Two or more Races (146 | 2.9%).
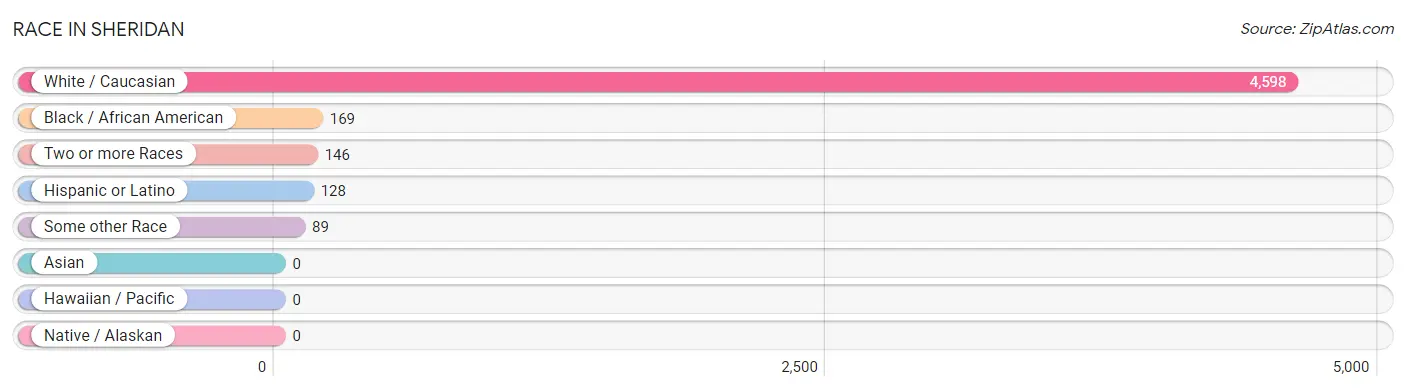
| Race | # Population | % Population |
| Asian | 0 | 0.0% |
| Black / African American | 169 | 3.4% |
| Hawaiian / Pacific | 0 | 0.0% |
| Hispanic or Latino | 128 | 2.6% |
| Native / Alaskan | 0 | 0.0% |
| White / Caucasian | 4,598 | 91.9% |
| Two or more Races | 146 | 2.9% |
| Some other Race | 89 | 1.8% |
| Total | 5,002 | 100.0% |
Ancestry in Sheridan
The most populous ancestries reported in Sheridan are English (882 | 17.6%), American (845 | 16.9%), Irish (544 | 10.9%), German (533 | 10.7%), and French (174 | 3.5%), together accounting for 59.5% of all Sheridan residents.
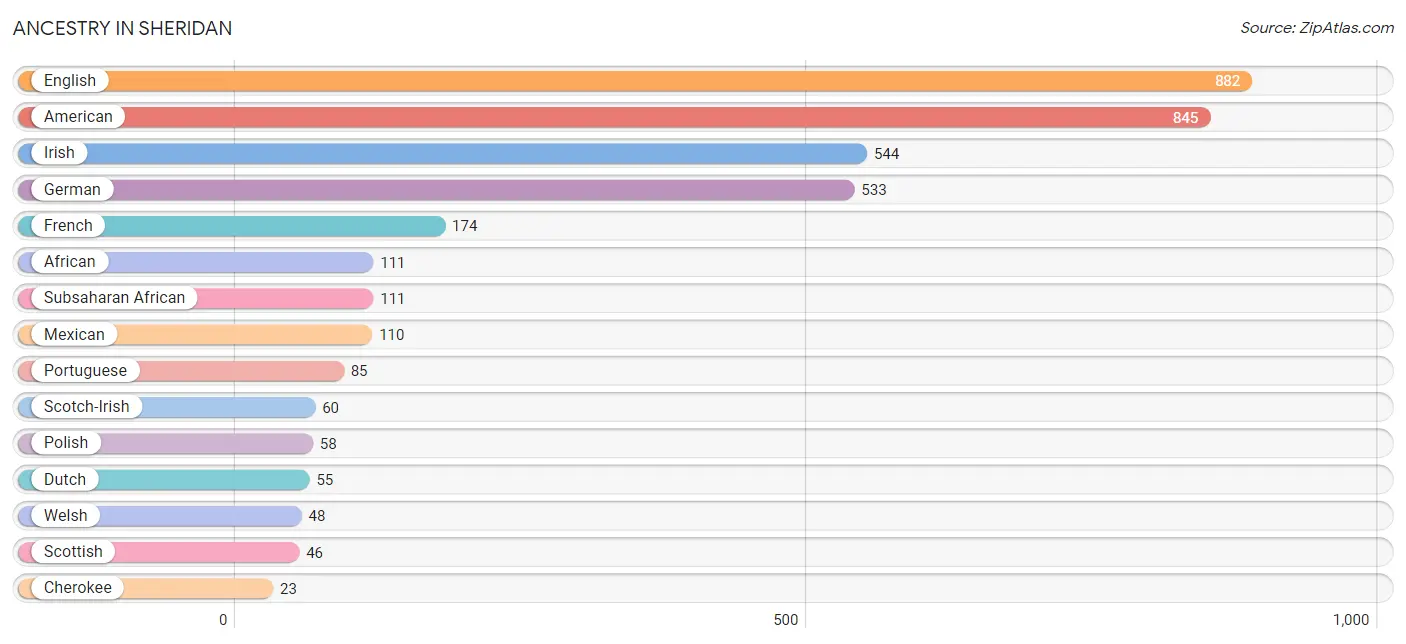
| Ancestry | # Population | % Population |
| African | 111 | 2.2% |
| American | 845 | 16.9% |
| Central American | 18 | 0.4% |
| Cherokee | 23 | 0.5% |
| Czech | 11 | 0.2% |
| Dutch | 55 | 1.1% |
| Eastern European | 11 | 0.2% |
| English | 882 | 17.6% |
| French | 174 | 3.5% |
| French Canadian | 8 | 0.2% |
| German | 533 | 10.7% |
| Guatemalan | 18 | 0.4% |
| Irish | 544 | 10.9% |
| Italian | 18 | 0.4% |
| Korean | 11 | 0.2% |
| Mexican | 110 | 2.2% |
| Polish | 58 | 1.2% |
| Portuguese | 85 | 1.7% |
| Scotch-Irish | 60 | 1.2% |
| Scottish | 46 | 0.9% |
| Subsaharan African | 111 | 2.2% |
| Welsh | 48 | 1.0% | View All 22 Rows |
Immigrants in Sheridan
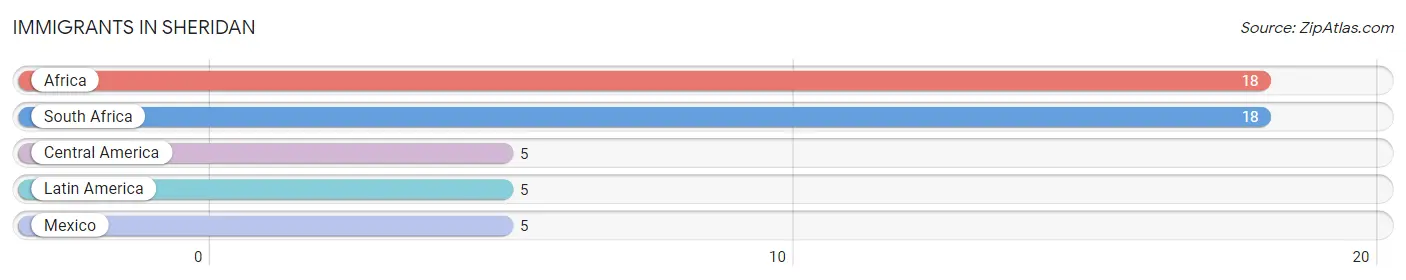
The most numerous immigrant groups reported in Sheridan came from Africa (18 | 0.4%), South Africa (18 | 0.4%), Central America (5 | 0.1%), Latin America (5 | 0.1%), and Mexico (5 | 0.1%), together accounting for 1.0% of all Sheridan residents.
| Immigration Origin | # Population | % Population |
| Africa | 18 | 0.4% |
| Central America | 5 | 0.1% |
| Latin America | 5 | 0.1% |
| Mexico | 5 | 0.1% |
| South Africa | 18 | 0.4% | View All 5 Rows |
Sex and Age in Sheridan
Sex and Age in Sheridan
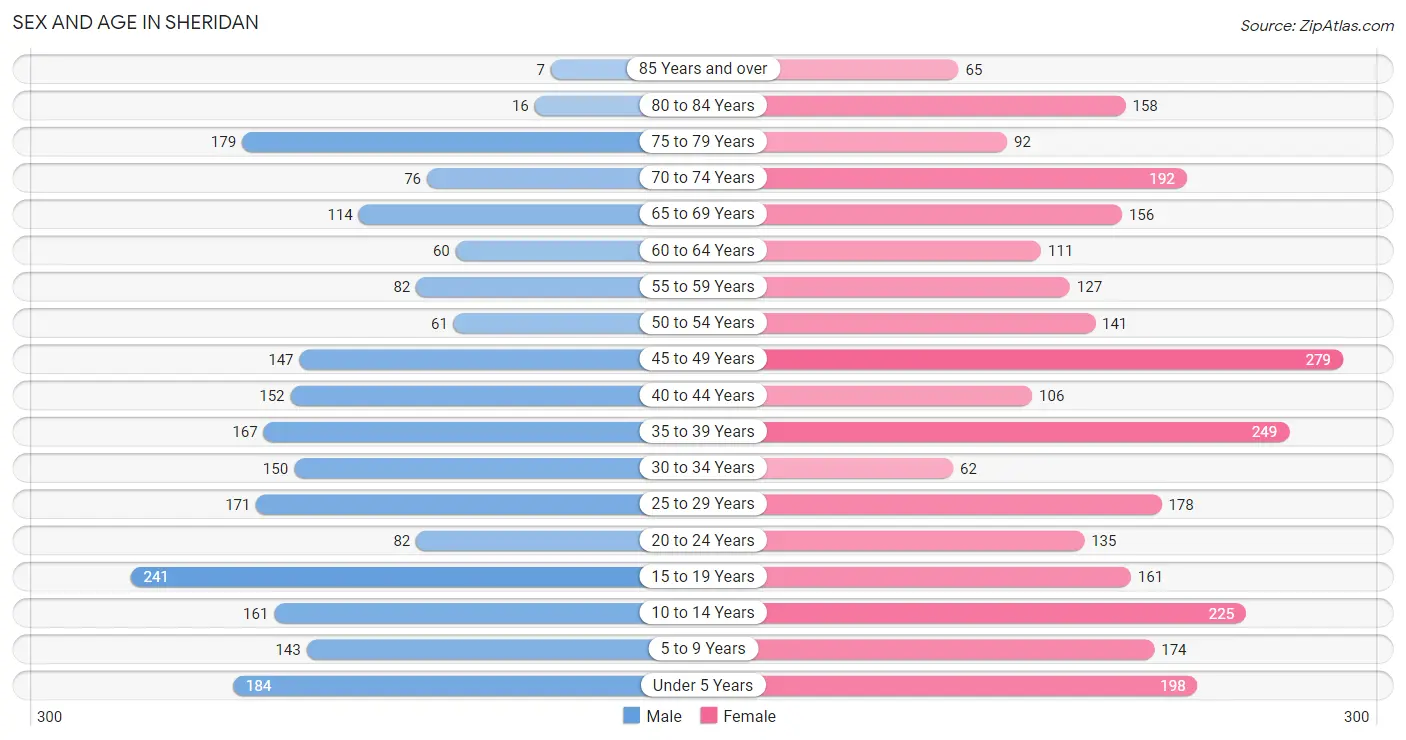
The most populous age groups in Sheridan are 15 to 19 Years (241 | 11.0%) for men and 45 to 49 Years (279 | 9.9%) for women.
| Age Bracket | Male | Female |
| Under 5 Years | 184 (8.4%) | 198 (7.0%) |
| 5 to 9 Years | 143 (6.5%) | 174 (6.2%) |
| 10 to 14 Years | 161 (7.3%) | 225 (8.0%) |
| 15 to 19 Years | 241 (11.0%) | 161 (5.7%) |
| 20 to 24 Years | 82 (3.7%) | 135 (4.8%) |
| 25 to 29 Years | 171 (7.8%) | 178 (6.3%) |
| 30 to 34 Years | 150 (6.8%) | 62 (2.2%) |
| 35 to 39 Years | 167 (7.6%) | 249 (8.9%) |
| 40 to 44 Years | 152 (6.9%) | 106 (3.8%) |
| 45 to 49 Years | 147 (6.7%) | 279 (9.9%) |
| 50 to 54 Years | 61 (2.8%) | 141 (5.0%) |
| 55 to 59 Years | 82 (3.7%) | 127 (4.5%) |
| 60 to 64 Years | 60 (2.7%) | 111 (4.0%) |
| 65 to 69 Years | 114 (5.2%) | 156 (5.6%) |
| 70 to 74 Years | 76 (3.5%) | 192 (6.8%) |
| 75 to 79 Years | 179 (8.2%) | 92 (3.3%) |
| 80 to 84 Years | 16 (0.7%) | 158 (5.6%) |
| 85 Years and over | 7 (0.3%) | 65 (2.3%) |
| Total | 2,193 (100.0%) | 2,809 (100.0%) |
Families and Households in Sheridan
Median Family Size in Sheridan
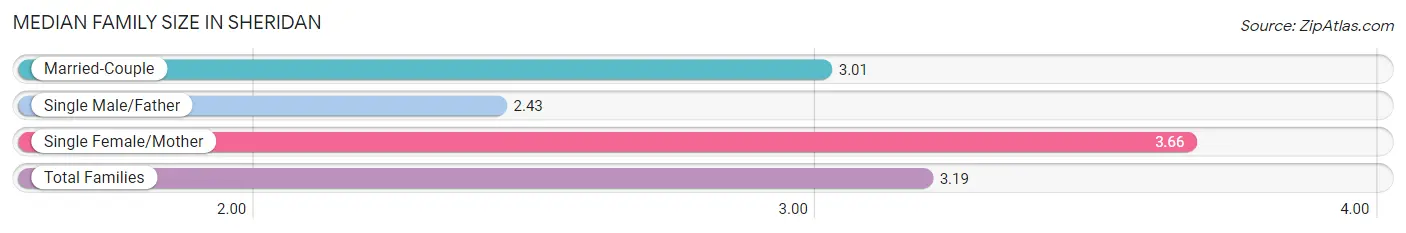
The median family size in Sheridan is 3.19 persons per family, with single female/mother families (441 | 35.7%) accounting for the largest median family size of 3.66 persons per family. On the other hand, single male/father families (109 | 8.8%) represent the smallest median family size with 2.43 persons per family.
| Family Type | # Families | Family Size |
| Married-Couple | 684 (55.4%) | 3.01 |
| Single Male/Father | 109 (8.8%) | 2.43 |
| Single Female/Mother | 441 (35.7%) | 3.66 |
| Total Families | 1,234 (100.0%) | 3.19 |
Median Household Size in Sheridan
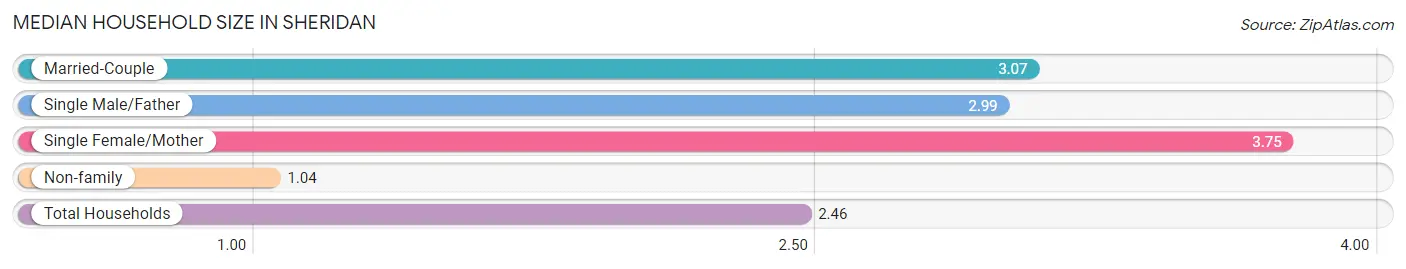
The median household size in Sheridan is 2.46 persons per household, with single female/mother households (441 | 22.4%) accounting for the largest median household size of 3.75 persons per household. non-family households (731 | 37.2%) represent the smallest median household size with 1.04 persons per household.
| Household Type | # Households | Household Size |
| Married-Couple | 684 (34.8%) | 3.07 |
| Single Male/Father | 109 (5.6%) | 2.99 |
| Single Female/Mother | 441 (22.4%) | 3.75 |
| Non-family | 731 (37.2%) | 1.04 |
| Total Households | 1,965 (100.0%) | 2.46 |
Household Size by Marriage Status in Sheridan
Out of a total of 1,965 households in Sheridan, 1,234 (62.8%) are family households, while 731 (37.2%) are nonfamily households. The most numerous type of family households are 2-person households, comprising 476, and the most common type of nonfamily households are 1-person households, comprising 698.
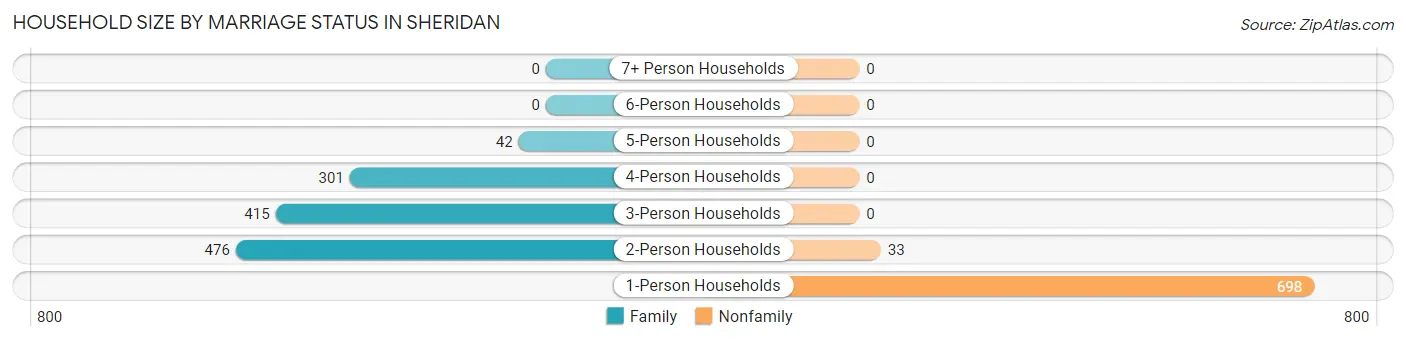
| Household Size | Family Households | Nonfamily Households |
| 1-Person Households | - | 698 (35.5%) |
| 2-Person Households | 476 (24.2%) | 33 (1.7%) |
| 3-Person Households | 415 (21.1%) | 0 (0.0%) |
| 4-Person Households | 301 (15.3%) | 0 (0.0%) |
| 5-Person Households | 42 (2.1%) | 0 (0.0%) |
| 6-Person Households | 0 (0.0%) | 0 (0.0%) |
| 7+ Person Households | 0 (0.0%) | 0 (0.0%) |
| Total | 1,234 (62.8%) | 731 (37.2%) |
Female Fertility in Sheridan
Fertility by Age in Sheridan
Average fertility rate in Sheridan is 32.0 births per 1,000 women. Women in the age bracket of 20 to 34 years have the highest fertility rate with 101.0 births per 1,000 women. Women in the age bracket of 20 to 34 years acount for 100.0% of all women with births.
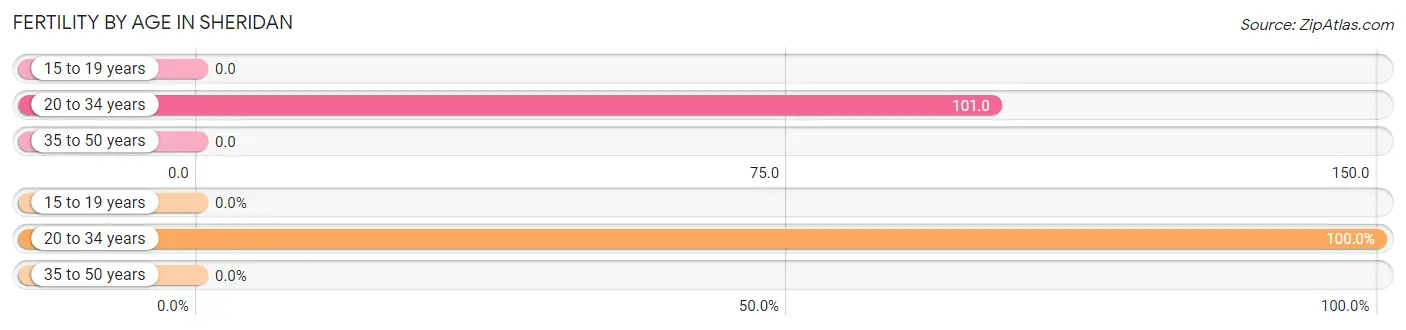
| Age Bracket | Women with Births | Births / 1,000 Women |
| 15 to 19 years | 0 (0.0%) | 0.0 |
| 20 to 34 years | 38 (100.0%) | 101.0 |
| 35 to 50 years | 0 (0.0%) | 0.0 |
| Total | 38 (100.0%) | 32.0 |
Fertility by Age by Marriage Status in Sheridan
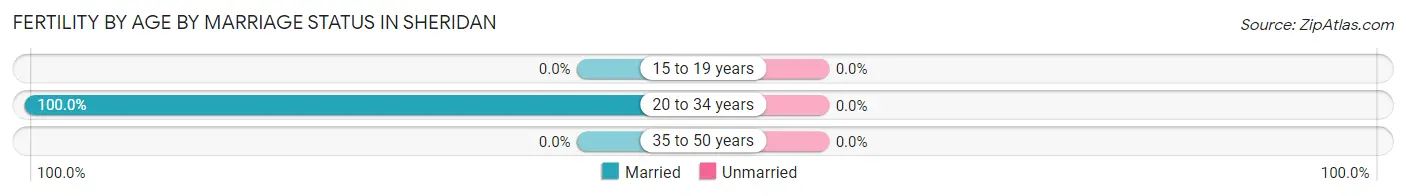
| Age Bracket | Married | Unmarried |
| 15 to 19 years | 0 (0.0%) | 0 (0.0%) |
| 20 to 34 years | 38 (100.0%) | 0 (0.0%) |
| 35 to 50 years | 0 (0.0%) | 0 (0.0%) |
| Total | 38 (100.0%) | 0 (0.0%) |
Fertility by Education in Sheridan
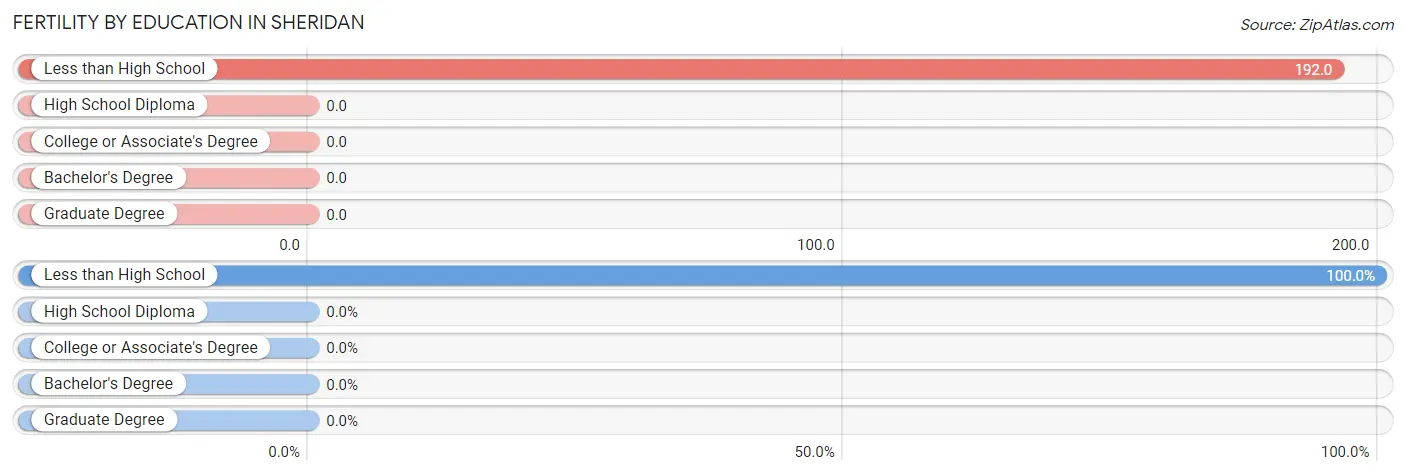
| Educational Attainment | Women with Births | Births / 1,000 Women |
| Less than High School | 38 (100.0%) | 192.0 |
| High School Diploma | 0 (0.0%) | 0.0 |
| College or Associate's Degree | 0 (0.0%) | 0.0 |
| Bachelor's Degree | 0 (0.0%) | 0.0 |
| Graduate Degree | 0 (0.0%) | 0.0 |
| Total | 38 (100.0%) | 32.0 |
Fertility by Education by Marriage Status in Sheridan
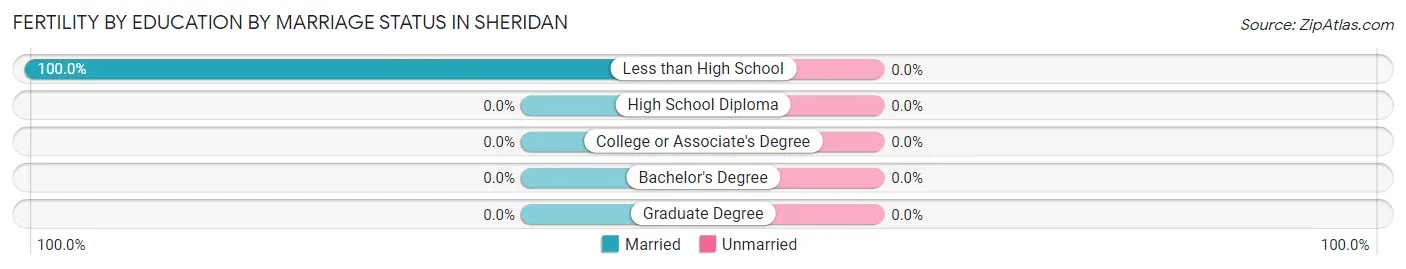
| Educational Attainment | Married | Unmarried |
| Less than High School | 38 (100.0%) | 0 (0.0%) |
| High School Diploma | 0 (0.0%) | 0 (0.0%) |
| College or Associate's Degree | 0 (0.0%) | 0 (0.0%) |
| Bachelor's Degree | 0 (0.0%) | 0 (0.0%) |
| Graduate Degree | 0 (0.0%) | 0 (0.0%) |
| Total | 38 (100.0%) | 0 (0.0%) |
Employment Characteristics in Sheridan
Employment by Class of Employer in Sheridan
Among the 1,604 employed individuals in Sheridan, private company employees (754 | 47.0%), state government employees (362 | 22.6%), and local government employees (261 | 16.3%) make up the most common classes of employment.
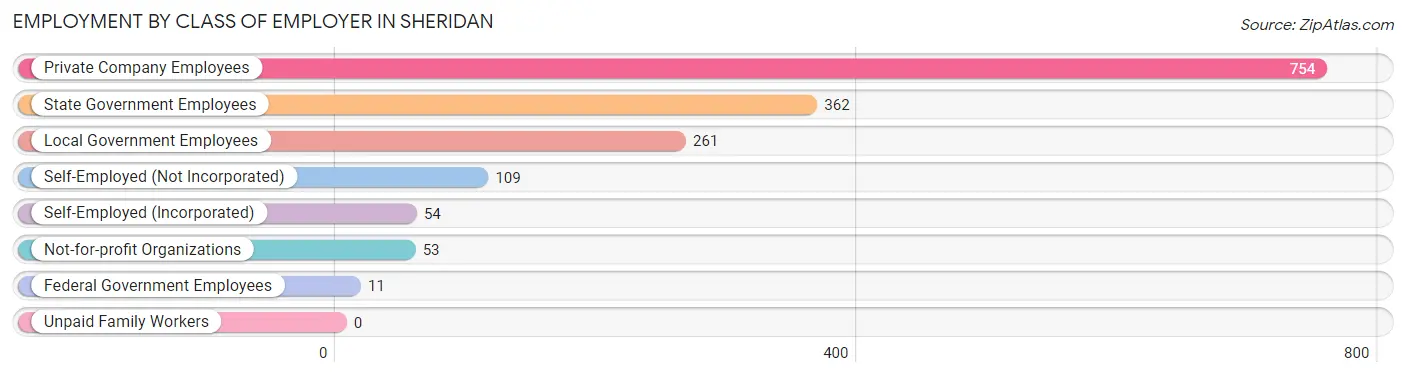
| Employer Class | # Employees | % Employees |
| Private Company Employees | 754 | 47.0% |
| Self-Employed (Incorporated) | 54 | 3.4% |
| Self-Employed (Not Incorporated) | 109 | 6.8% |
| Not-for-profit Organizations | 53 | 3.3% |
| Local Government Employees | 261 | 16.3% |
| State Government Employees | 362 | 22.6% |
| Federal Government Employees | 11 | 0.7% |
| Unpaid Family Workers | 0 | 0.0% |
| Total | 1,604 | 100.0% |
Employment Status by Age in Sheridan
According to the labor force statistics for Sheridan, out of the total population over 16 years of age (3,828), 44.0% or 1,684 individuals are in the labor force, with 3.9% or 66 of them unemployed. The age group with the highest labor force participation rate is 25 to 29 years, with 93.4% or 326 individuals in the labor force. Within the labor force, the 16 to 19 years age range has the highest percentage of unemployed individuals, with 100.0% or 34 of them being unemployed.
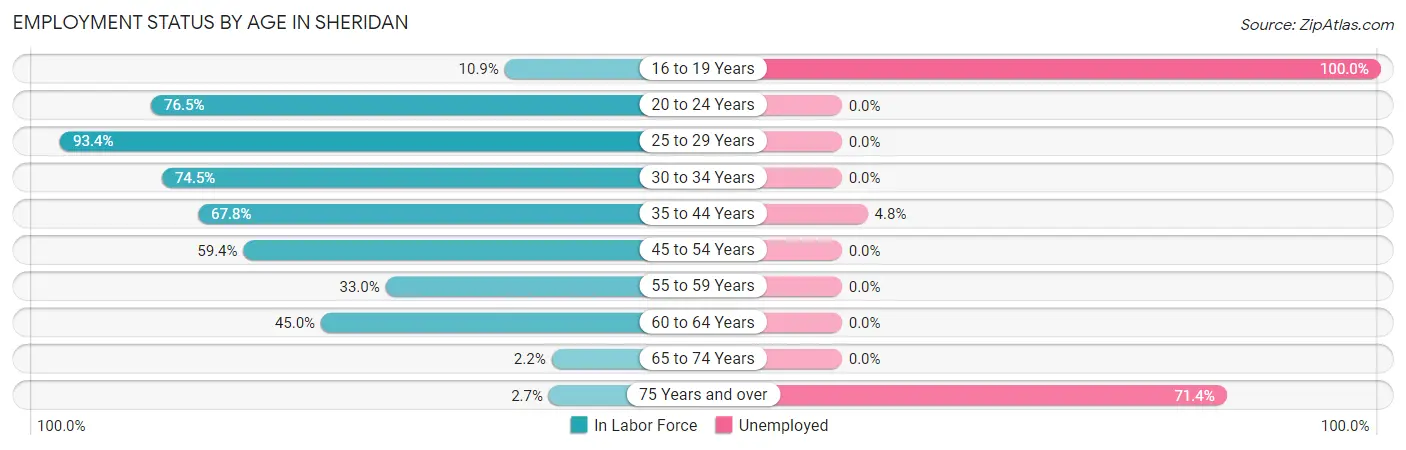
| Age Bracket | In Labor Force | Unemployed |
| 16 to 19 Years | 34 (10.9%) | 34 (100.0%) |
| 20 to 24 Years | 166 (76.5%) | 0 (0.0%) |
| 25 to 29 Years | 326 (93.4%) | 0 (0.0%) |
| 30 to 34 Years | 158 (74.5%) | 0 (0.0%) |
| 35 to 44 Years | 457 (67.8%) | 22 (4.8%) |
| 45 to 54 Years | 373 (59.4%) | 0 (0.0%) |
| 55 to 59 Years | 69 (33.0%) | 0 (0.0%) |
| 60 to 64 Years | 77 (45.0%) | 0 (0.0%) |
| 65 to 74 Years | 12 (2.2%) | 0 (0.0%) |
| 75 Years and over | 14 (2.7%) | 10 (71.4%) |
| Total | 1,684 (44.0%) | 66 (3.9%) |
Employment Status by Educational Attainment in Sheridan
According to labor force statistics for Sheridan, 65.1% of individuals (1,460) out of the total population between 25 and 64 years of age (2,243) are in the labor force, with 1.5% or 22 of them being unemployed. The group with the highest labor force participation rate are those with the educational attainment of bachelor's degree or higher, with 91.0% or 436 individuals in the labor force. Within the labor force, individuals with high school diploma education have the highest percentage of unemployment, with 5.3% or 22 of them being unemployed.
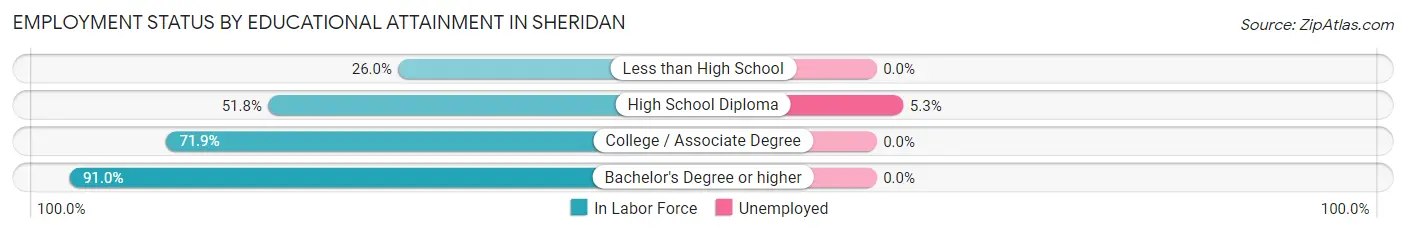
| Educational Attainment | In Labor Force | Unemployed |
| Less than High School | 47 (26.0%) | 0 (0.0%) |
| High School Diploma | 416 (51.8%) | 43 (5.3%) |
| College / Associate Degree | 561 (71.9%) | 0 (0.0%) |
| Bachelor's Degree or higher | 436 (91.0%) | 0 (0.0%) |
| Total | 1,460 (65.1%) | 34 (1.5%) |
Employment Occupations by Sex in Sheridan
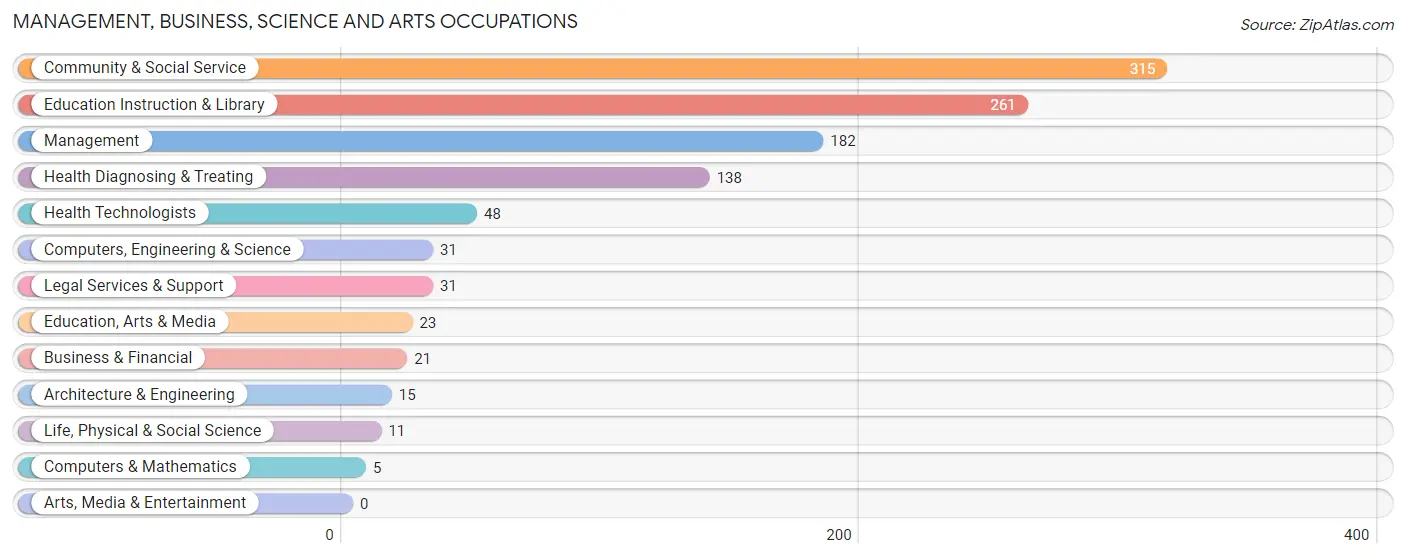
Management, Business, Science and Arts Occupations
The most common Management, Business, Science and Arts occupations in Sheridan are Community & Social Service (315 | 19.4%), Education Instruction & Library (261 | 16.1%), Management (182 | 11.2%), Health Diagnosing & Treating (138 | 8.5%), and Health Technologists (48 | 3.0%).
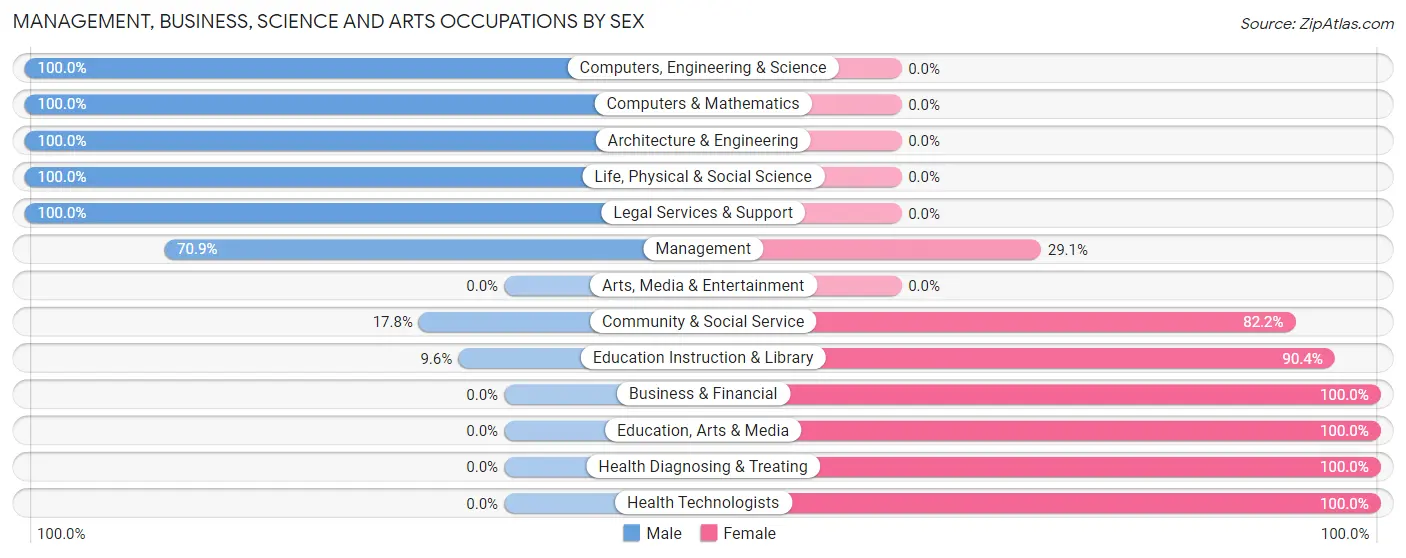
Management, Business, Science and Arts Occupations by Sex
Within the Management, Business, Science and Arts occupations in Sheridan, the most male-oriented occupations are Computers, Engineering & Science (100.0%), Computers & Mathematics (100.0%), and Architecture & Engineering (100.0%), while the most female-oriented occupations are Business & Financial (100.0%), Education, Arts & Media (100.0%), and Health Diagnosing & Treating (100.0%).
| Occupation | Male | Female |
| Management | 129 (70.9%) | 53 (29.1%) |
| Business & Financial | 0 (0.0%) | 21 (100.0%) |
| Computers, Engineering & Science | 31 (100.0%) | 0 (0.0%) |
| Computers & Mathematics | 5 (100.0%) | 0 (0.0%) |
| Architecture & Engineering | 15 (100.0%) | 0 (0.0%) |
| Life, Physical & Social Science | 11 (100.0%) | 0 (0.0%) |
| Community & Social Service | 56 (17.8%) | 259 (82.2%) |
| Education, Arts & Media | 0 (0.0%) | 23 (100.0%) |
| Legal Services & Support | 31 (100.0%) | 0 (0.0%) |
| Education Instruction & Library | 25 (9.6%) | 236 (90.4%) |
| Arts, Media & Entertainment | 0 (0.0%) | 0 (0.0%) |
| Health Diagnosing & Treating | 0 (0.0%) | 138 (100.0%) |
| Health Technologists | 0 (0.0%) | 48 (100.0%) |
| Total (Category) | 216 (31.4%) | 471 (68.6%) |
| Total (Overall) | 770 (47.5%) | 850 (52.5%) |
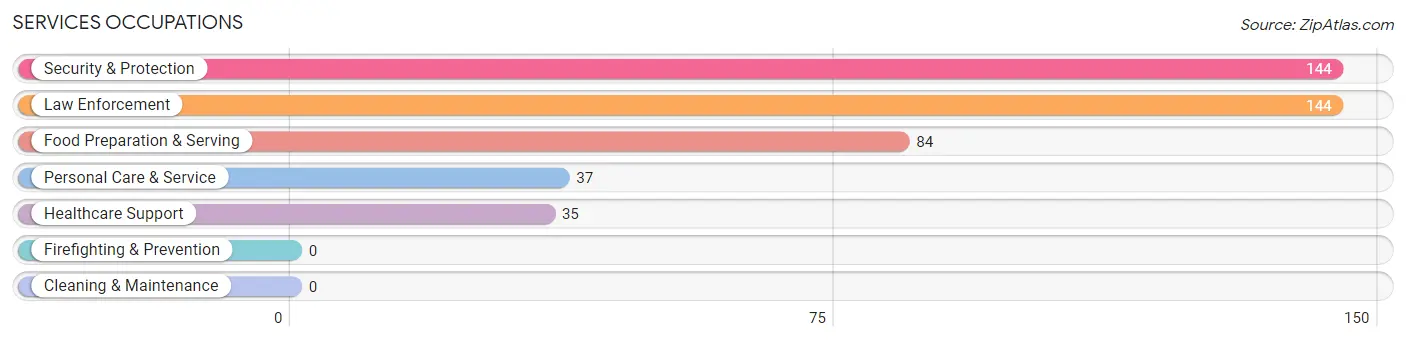
Services Occupations
The most common Services occupations in Sheridan are Security & Protection (144 | 8.9%), Law Enforcement (144 | 8.9%), Food Preparation & Serving (84 | 5.2%), Personal Care & Service (37 | 2.3%), and Healthcare Support (35 | 2.2%).
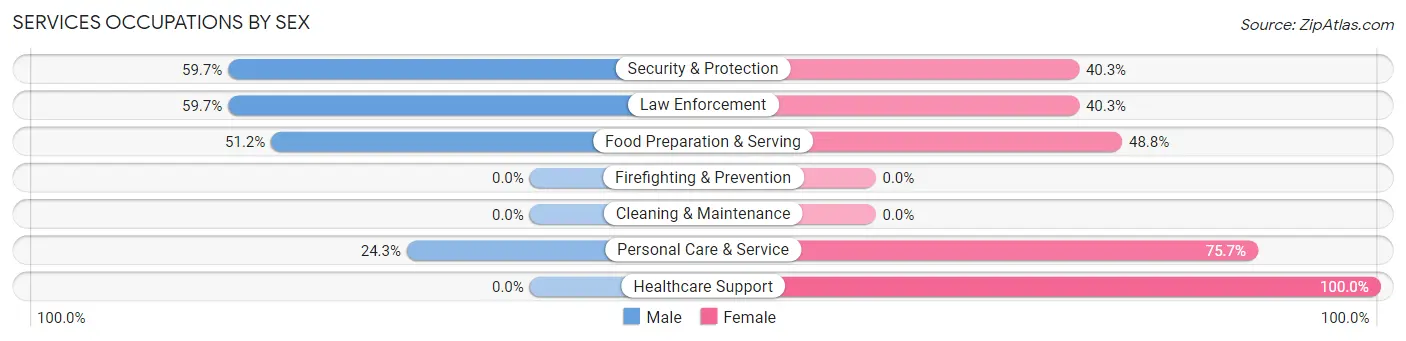
Services Occupations by Sex
Within the Services occupations in Sheridan, the most male-oriented occupations are Security & Protection (59.7%), Law Enforcement (59.7%), and Food Preparation & Serving (51.2%), while the most female-oriented occupations are Healthcare Support (100.0%), Personal Care & Service (75.7%), and Food Preparation & Serving (48.8%).
| Occupation | Male | Female |
| Healthcare Support | 0 (0.0%) | 35 (100.0%) |
| Security & Protection | 86 (59.7%) | 58 (40.3%) |
| Firefighting & Prevention | 0 (0.0%) | 0 (0.0%) |
| Law Enforcement | 86 (59.7%) | 58 (40.3%) |
| Food Preparation & Serving | 43 (51.2%) | 41 (48.8%) |
| Cleaning & Maintenance | 0 (0.0%) | 0 (0.0%) |
| Personal Care & Service | 9 (24.3%) | 28 (75.7%) |
| Total (Category) | 138 (46.0%) | 162 (54.0%) |
| Total (Overall) | 770 (47.5%) | 850 (52.5%) |
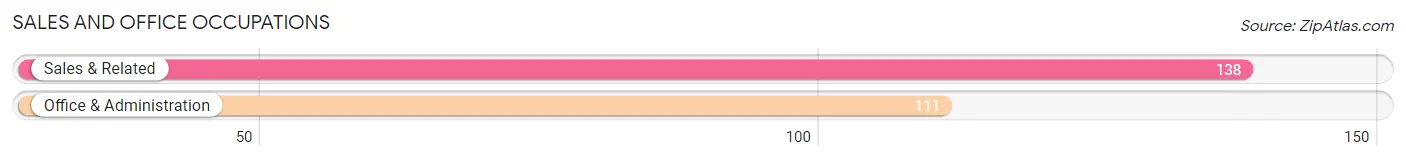
Sales and Office Occupations
The most common Sales and Office occupations in Sheridan are Sales & Related (138 | 8.5%), and Office & Administration (111 | 6.9%).
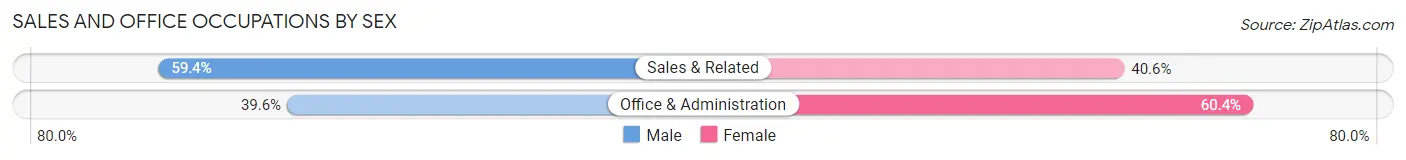
Sales and Office Occupations by Sex
| Occupation | Male | Female |
| Sales & Related | 82 (59.4%) | 56 (40.6%) |
| Office & Administration | 44 (39.6%) | 67 (60.4%) |
| Total (Category) | 126 (50.6%) | 123 (49.4%) |
| Total (Overall) | 770 (47.5%) | 850 (52.5%) |
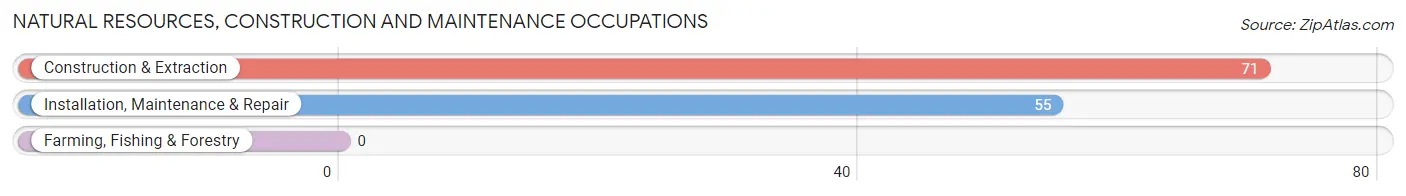
Natural Resources, Construction and Maintenance Occupations
The most common Natural Resources, Construction and Maintenance occupations in Sheridan are Construction & Extraction (71 | 4.4%), and Installation, Maintenance & Repair (55 | 3.4%).
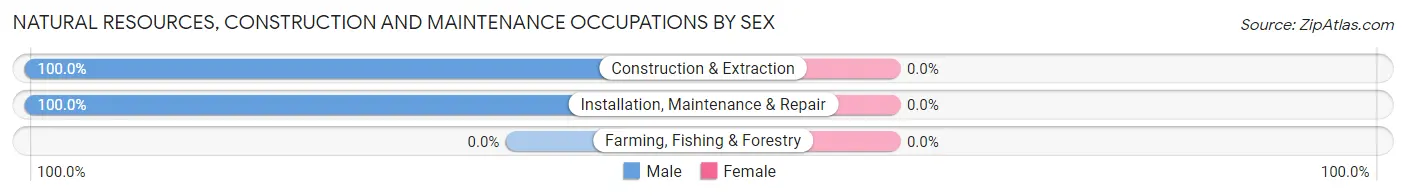
Natural Resources, Construction and Maintenance Occupations by Sex
| Occupation | Male | Female |
| Farming, Fishing & Forestry | 0 (0.0%) | 0 (0.0%) |
| Construction & Extraction | 71 (100.0%) | 0 (0.0%) |
| Installation, Maintenance & Repair | 55 (100.0%) | 0 (0.0%) |
| Total (Category) | 126 (100.0%) | 0 (0.0%) |
| Total (Overall) | 770 (47.5%) | 850 (52.5%) |
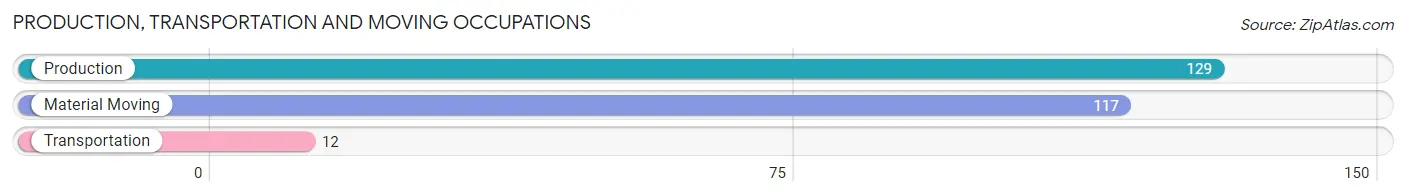
Production, Transportation and Moving Occupations
The most common Production, Transportation and Moving occupations in Sheridan are Production (129 | 8.0%), Material Moving (117 | 7.2%), and Transportation (12 | 0.7%).
Production, Transportation and Moving Occupations by Sex
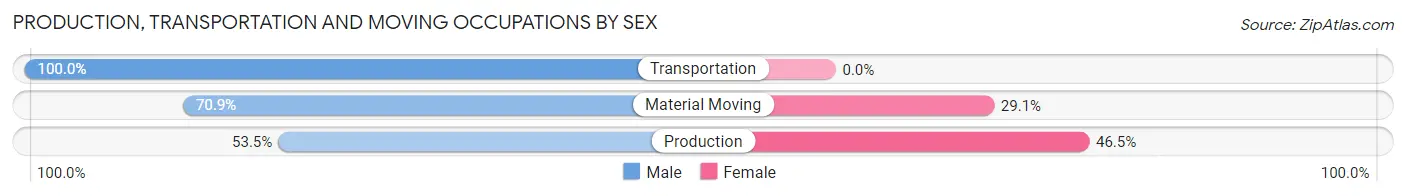
| Occupation | Male | Female |
| Production | 69 (53.5%) | 60 (46.5%) |
| Transportation | 12 (100.0%) | 0 (0.0%) |
| Material Moving | 83 (70.9%) | 34 (29.1%) |
| Total (Category) | 164 (63.6%) | 94 (36.4%) |
| Total (Overall) | 770 (47.5%) | 850 (52.5%) |
Employment Industries by Sex in Sheridan
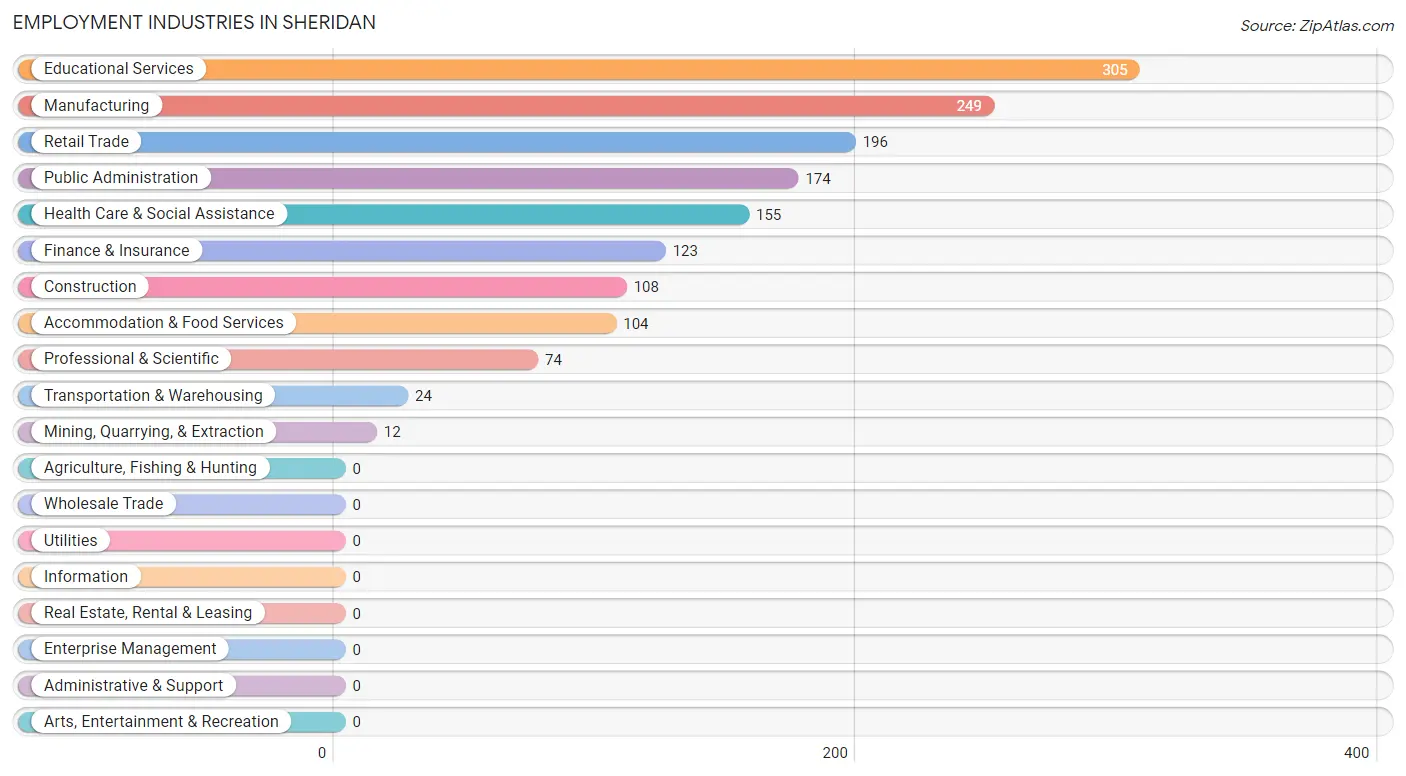
Employment Industries in Sheridan
The major employment industries in Sheridan include Educational Services (305 | 18.8%), Manufacturing (249 | 15.4%), Retail Trade (196 | 12.1%), Public Administration (174 | 10.7%), and Health Care & Social Assistance (155 | 9.6%).
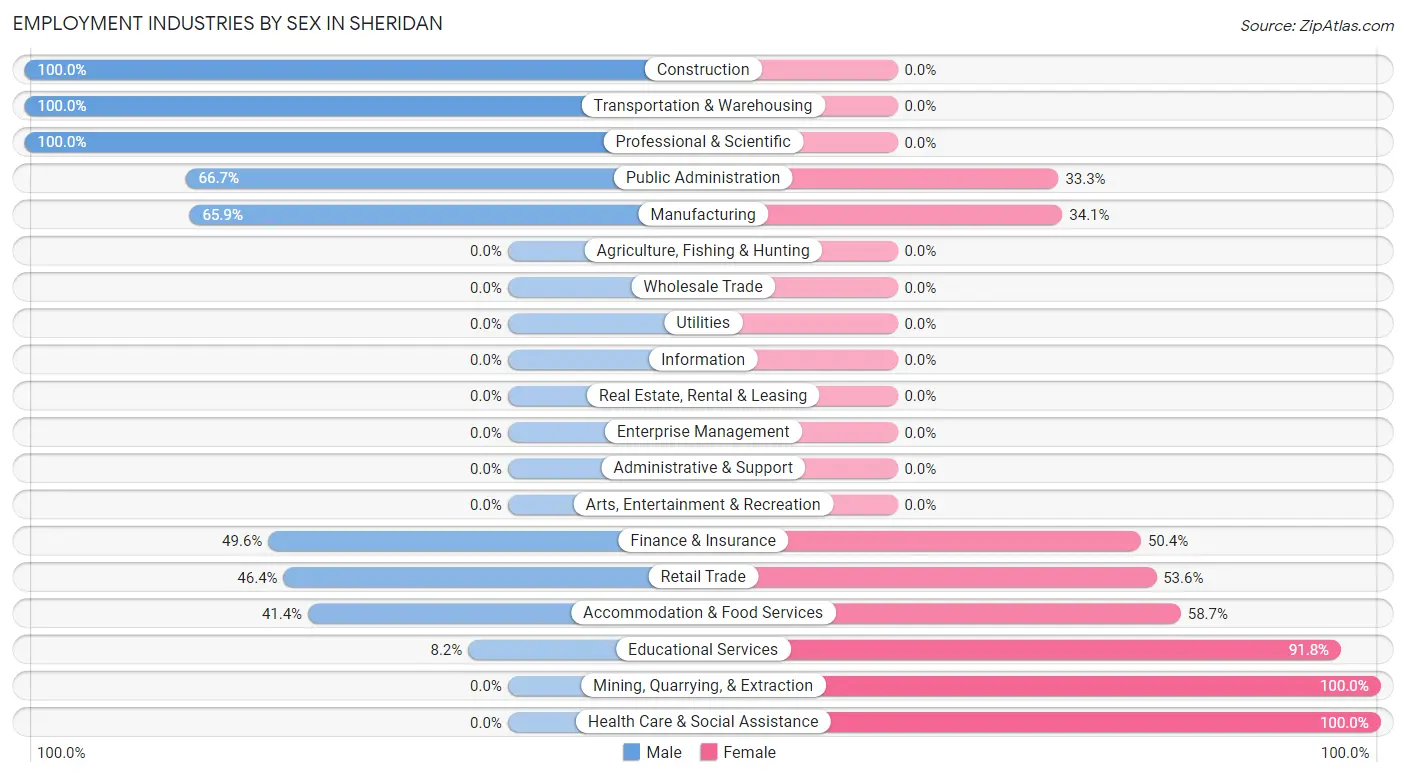
Employment Industries by Sex in Sheridan
The Sheridan industries that see more men than women are Construction (100.0%), Transportation & Warehousing (100.0%), and Professional & Scientific (100.0%), whereas the industries that tend to have a higher number of women are Mining, Quarrying, & Extraction (100.0%), Health Care & Social Assistance (100.0%), and Educational Services (91.8%).
| Industry | Male | Female |
| Agriculture, Fishing & Hunting | 0 (0.0%) | 0 (0.0%) |
| Mining, Quarrying, & Extraction | 0 (0.0%) | 12 (100.0%) |
| Construction | 108 (100.0%) | 0 (0.0%) |
| Manufacturing | 164 (65.9%) | 85 (34.1%) |
| Wholesale Trade | 0 (0.0%) | 0 (0.0%) |
| Retail Trade | 91 (46.4%) | 105 (53.6%) |
| Transportation & Warehousing | 24 (100.0%) | 0 (0.0%) |
| Utilities | 0 (0.0%) | 0 (0.0%) |
| Information | 0 (0.0%) | 0 (0.0%) |
| Finance & Insurance | 61 (49.6%) | 62 (50.4%) |
| Real Estate, Rental & Leasing | 0 (0.0%) | 0 (0.0%) |
| Professional & Scientific | 74 (100.0%) | 0 (0.0%) |
| Enterprise Management | 0 (0.0%) | 0 (0.0%) |
| Administrative & Support | 0 (0.0%) | 0 (0.0%) |
| Educational Services | 25 (8.2%) | 280 (91.8%) |
| Health Care & Social Assistance | 0 (0.0%) | 155 (100.0%) |
| Arts, Entertainment & Recreation | 0 (0.0%) | 0 (0.0%) |
| Accommodation & Food Services | 43 (41.3%) | 61 (58.7%) |
| Public Administration | 116 (66.7%) | 58 (33.3%) |
| Total | 770 (47.5%) | 850 (52.5%) |
Education in Sheridan
School Enrollment in Sheridan
The most common levels of schooling among the 1,254 students in Sheridan are middle school (333 | 26.6%), high school (303 | 24.2%), and elementary school (297 | 23.7%).
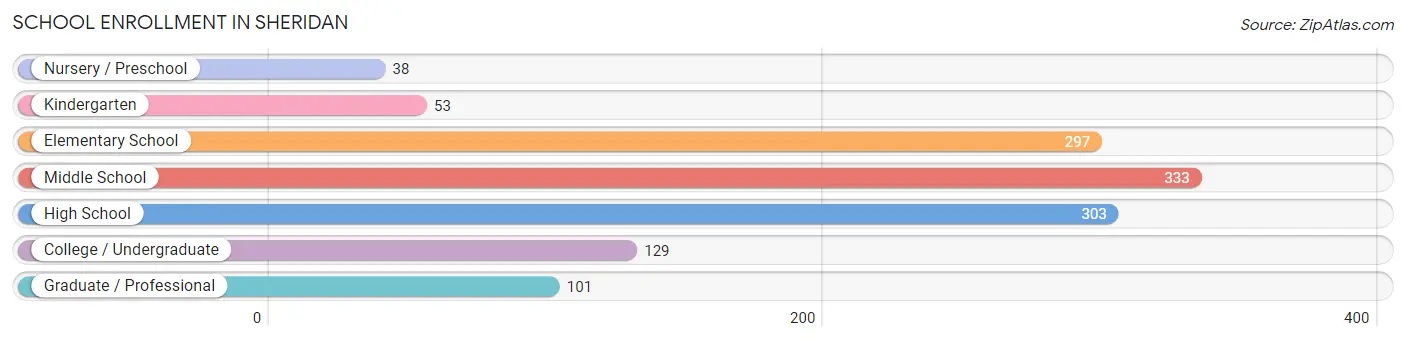
| School Level | # Students | % Students |
| Nursery / Preschool | 38 | 3.0% |
| Kindergarten | 53 | 4.2% |
| Elementary School | 297 | 23.7% |
| Middle School | 333 | 26.6% |
| High School | 303 | 24.2% |
| College / Undergraduate | 129 | 10.3% |
| Graduate / Professional | 101 | 8.1% |
| Total | 1,254 | 100.0% |
School Enrollment by Age by Funding Source in Sheridan
Out of a total of 1,254 students who are enrolled in schools in Sheridan, 92 (7.3%) attend a private institution, while the remaining 1,162 (92.7%) are enrolled in public schools. The age group of 18 to 19 year olds has the highest likelihood of being enrolled in private schools, with 37 (34.9% in the age bracket) enrolled. Conversely, the age group of 3 to 4 year olds has the lowest likelihood of being enrolled in a private school, with 38 (100.0% in the age bracket) attending a public institution.
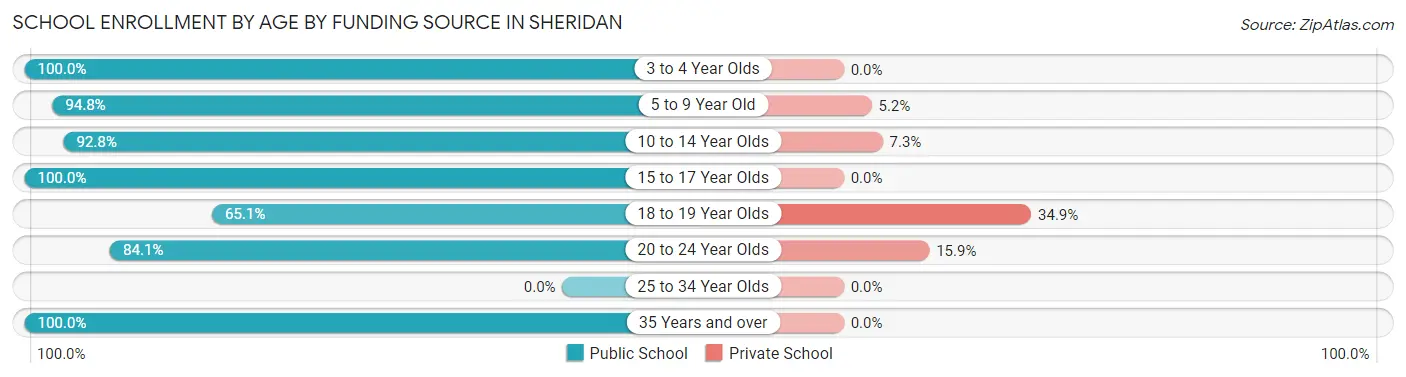
| Age Bracket | Public School | Private School |
| 3 to 4 Year Olds | 38 (100.0%) | 0 (0.0%) |
| 5 to 9 Year Old | 292 (94.8%) | 16 (5.2%) |
| 10 to 14 Year Olds | 358 (92.7%) | 28 (7.2%) |
| 15 to 17 Year Olds | 223 (100.0%) | 0 (0.0%) |
| 18 to 19 Year Olds | 69 (65.1%) | 37 (34.9%) |
| 20 to 24 Year Olds | 58 (84.1%) | 11 (15.9%) |
| 25 to 34 Year Olds | 0 (0.0%) | 0 (0.0%) |
| 35 Years and over | 124 (100.0%) | 0 (0.0%) |
| Total | 1,162 (92.7%) | 92 (7.3%) |
Educational Attainment by Field of Study in Sheridan
Education (204 | 26.2%), business (122 | 15.7%), arts & humanities (90 | 11.6%), physical & health sciences (70 | 9.0%), and liberal arts & history (70 | 9.0%) are the most common fields of study among 778 individuals in Sheridan who have obtained a bachelor's degree or higher.
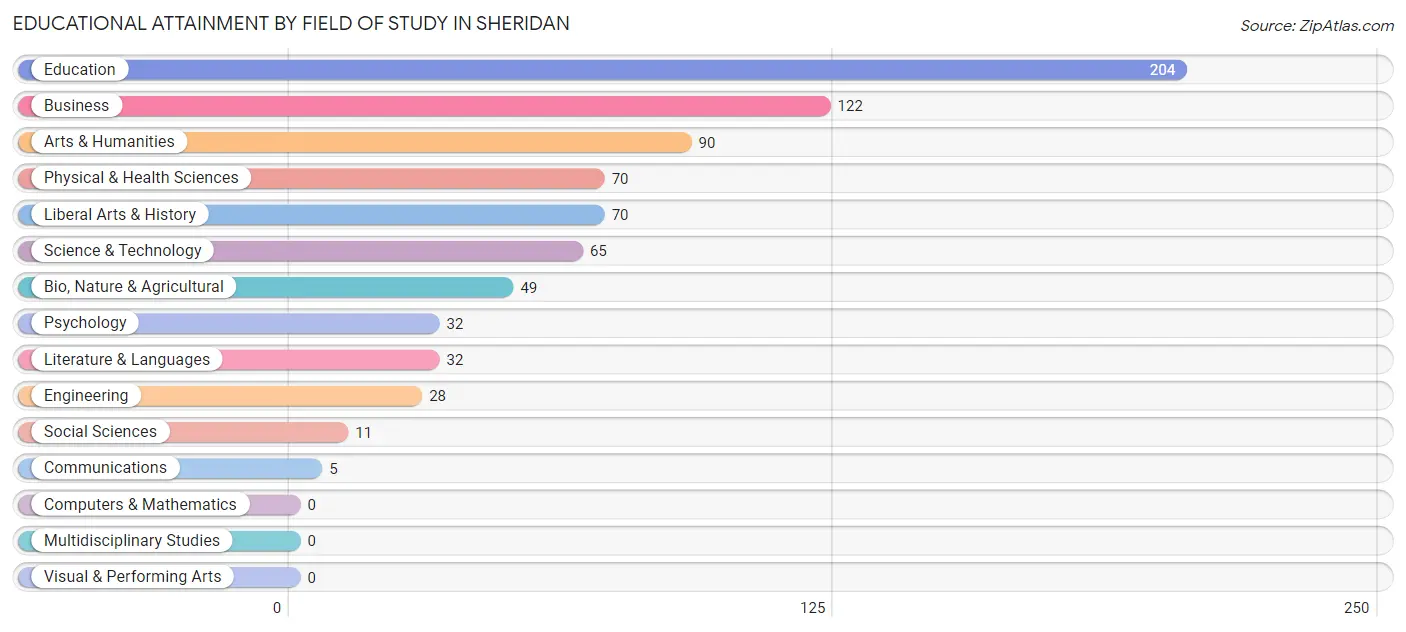
| Field of Study | # Graduates | % Graduates |
| Computers & Mathematics | 0 | 0.0% |
| Bio, Nature & Agricultural | 49 | 6.3% |
| Physical & Health Sciences | 70 | 9.0% |
| Psychology | 32 | 4.1% |
| Social Sciences | 11 | 1.4% |
| Engineering | 28 | 3.6% |
| Multidisciplinary Studies | 0 | 0.0% |
| Science & Technology | 65 | 8.4% |
| Business | 122 | 15.7% |
| Education | 204 | 26.2% |
| Literature & Languages | 32 | 4.1% |
| Liberal Arts & History | 70 | 9.0% |
| Visual & Performing Arts | 0 | 0.0% |
| Communications | 5 | 0.6% |
| Arts & Humanities | 90 | 11.6% |
| Total | 778 | 100.0% |
Transportation & Commute in Sheridan
Vehicle Availability by Sex in Sheridan
The most prevalent vehicle ownership categories in Sheridan are males with 2 vehicles (362, accounting for 47.0%) and females with 2 vehicles (436, making up 43.4%).
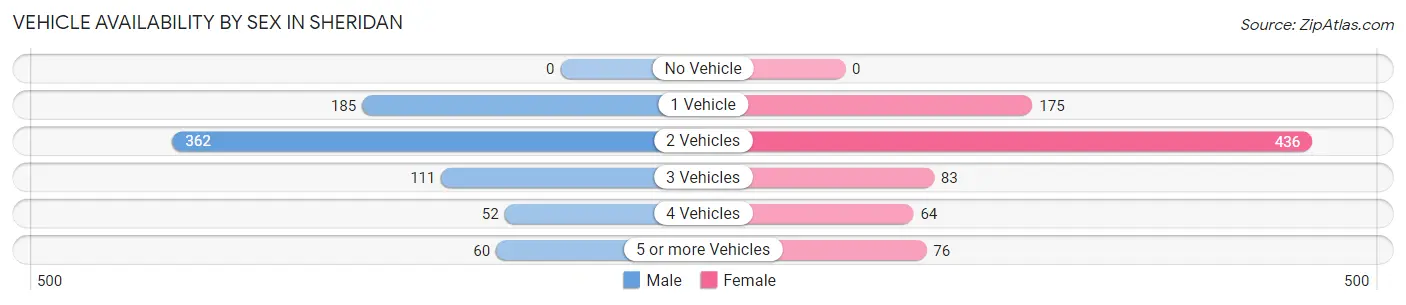
| Vehicles Available | Male | Female |
| No Vehicle | 0 (0.0%) | 0 (0.0%) |
| 1 Vehicle | 185 (24.0%) | 175 (21.0%) |
| 2 Vehicles | 362 (47.0%) | 436 (52.3%) |
| 3 Vehicles | 111 (14.4%) | 83 (10.0%) |
| 4 Vehicles | 52 (6.8%) | 64 (7.7%) |
| 5 or more Vehicles | 60 (7.8%) | 76 (9.1%) |
| Total | 770 (100.0%) | 834 (100.0%) |
Commute Time in Sheridan
The most frequently occuring commute durations in Sheridan are 5 to 9 minutes (485 commuters, 34.4%), 45 to 59 minutes (223 commuters, 15.8%), and 10 to 14 minutes (160 commuters, 11.3%).
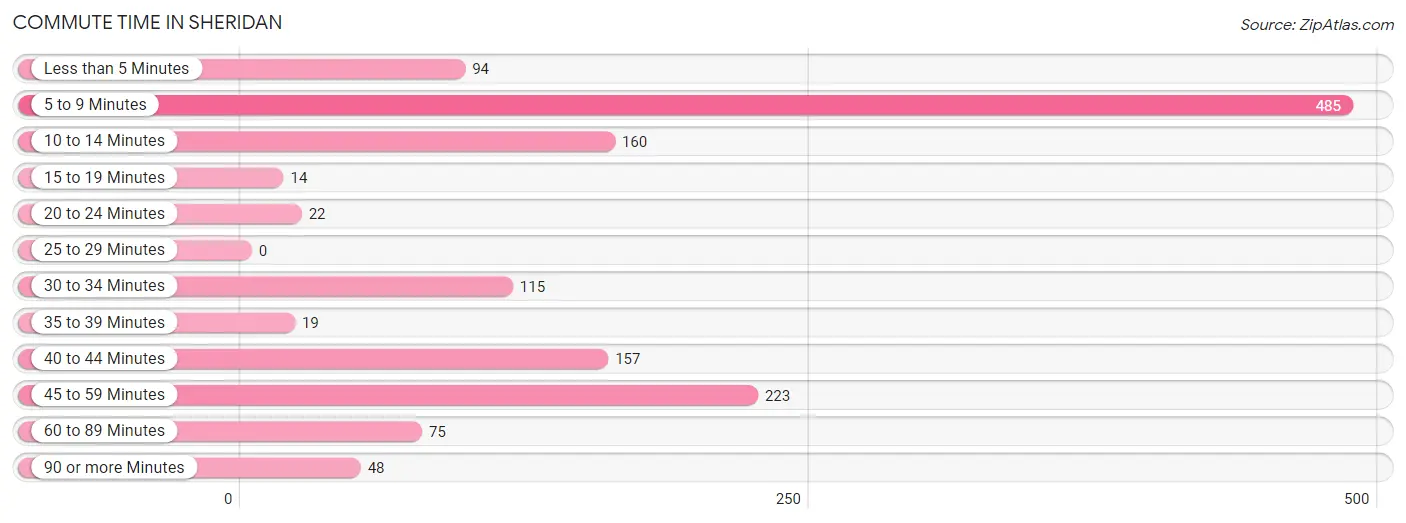
| Commute Time | # Commuters | % Commuters |
| Less than 5 Minutes | 94 | 6.7% |
| 5 to 9 Minutes | 485 | 34.4% |
| 10 to 14 Minutes | 160 | 11.3% |
| 15 to 19 Minutes | 14 | 1.0% |
| 20 to 24 Minutes | 22 | 1.6% |
| 25 to 29 Minutes | 0 | 0.0% |
| 30 to 34 Minutes | 115 | 8.1% |
| 35 to 39 Minutes | 19 | 1.3% |
| 40 to 44 Minutes | 157 | 11.1% |
| 45 to 59 Minutes | 223 | 15.8% |
| 60 to 89 Minutes | 75 | 5.3% |
| 90 or more Minutes | 48 | 3.4% |
Commute Time by Sex in Sheridan
The most common commute times in Sheridan are 5 to 9 minutes (154 commuters, 23.1%) for males and 5 to 9 minutes (331 commuters, 44.4%) for females.
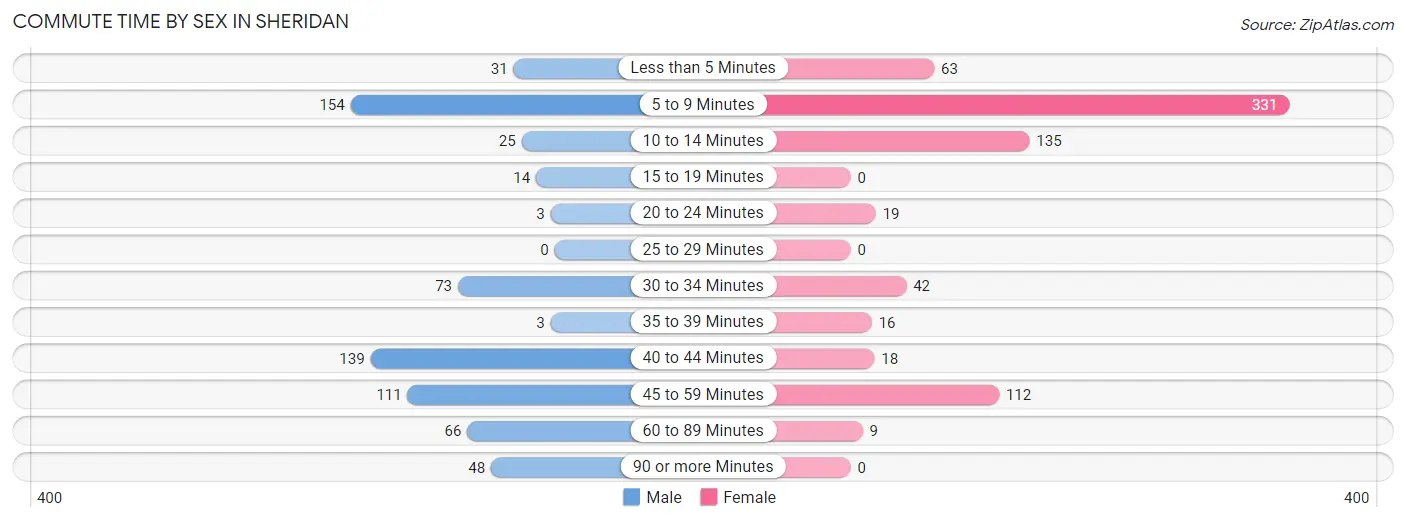
| Commute Time | Male | Female |
| Less than 5 Minutes | 31 (4.6%) | 63 (8.5%) |
| 5 to 9 Minutes | 154 (23.1%) | 331 (44.4%) |
| 10 to 14 Minutes | 25 (3.7%) | 135 (18.1%) |
| 15 to 19 Minutes | 14 (2.1%) | 0 (0.0%) |
| 20 to 24 Minutes | 3 (0.4%) | 19 (2.5%) |
| 25 to 29 Minutes | 0 (0.0%) | 0 (0.0%) |
| 30 to 34 Minutes | 73 (10.9%) | 42 (5.6%) |
| 35 to 39 Minutes | 3 (0.4%) | 16 (2.1%) |
| 40 to 44 Minutes | 139 (20.8%) | 18 (2.4%) |
| 45 to 59 Minutes | 111 (16.6%) | 112 (15.0%) |
| 60 to 89 Minutes | 66 (9.9%) | 9 (1.2%) |
| 90 or more Minutes | 48 (7.2%) | 0 (0.0%) |
Time of Departure to Work by Sex in Sheridan
The most frequent times of departure to work in Sheridan are 5:30 AM to 5:59 AM (154, 23.1%) for males and 7:30 AM to 7:59 AM (178, 23.9%) for females.
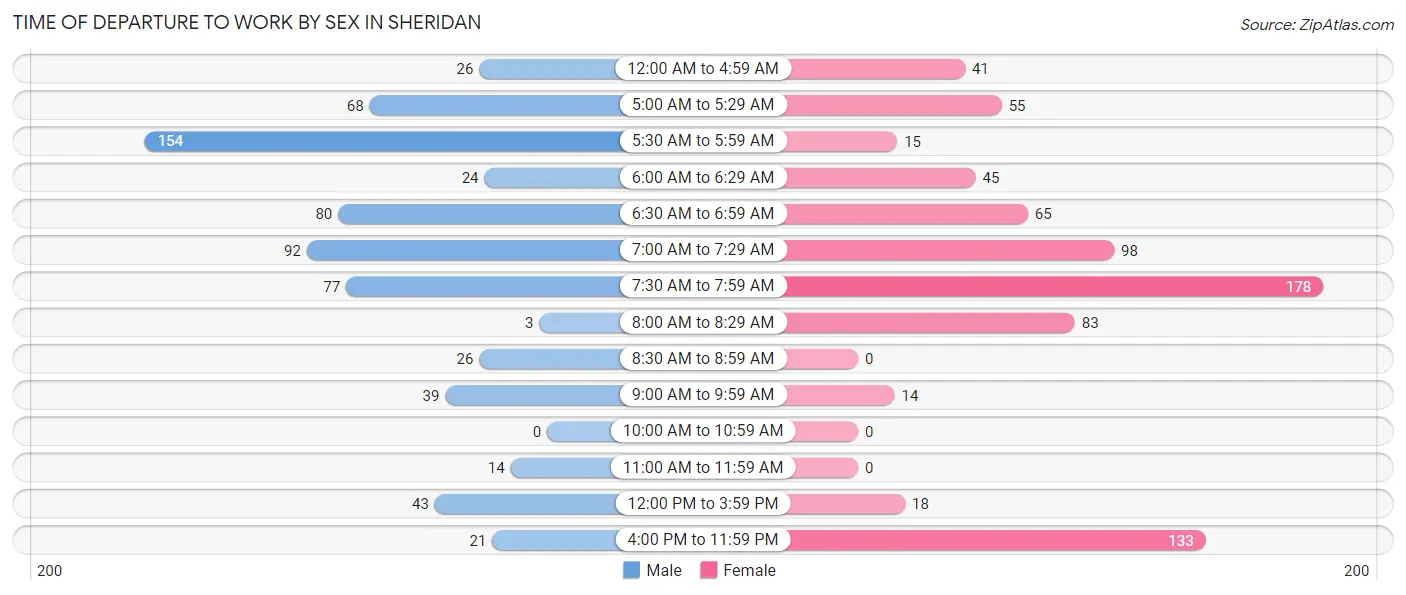
| Time of Departure | Male | Female |
| 12:00 AM to 4:59 AM | 26 (3.9%) | 41 (5.5%) |
| 5:00 AM to 5:29 AM | 68 (10.2%) | 55 (7.4%) |
| 5:30 AM to 5:59 AM | 154 (23.1%) | 15 (2.0%) |
| 6:00 AM to 6:29 AM | 24 (3.6%) | 45 (6.0%) |
| 6:30 AM to 6:59 AM | 80 (12.0%) | 65 (8.7%) |
| 7:00 AM to 7:29 AM | 92 (13.8%) | 98 (13.2%) |
| 7:30 AM to 7:59 AM | 77 (11.5%) | 178 (23.9%) |
| 8:00 AM to 8:29 AM | 3 (0.4%) | 83 (11.1%) |
| 8:30 AM to 8:59 AM | 26 (3.9%) | 0 (0.0%) |
| 9:00 AM to 9:59 AM | 39 (5.9%) | 14 (1.9%) |
| 10:00 AM to 10:59 AM | 0 (0.0%) | 0 (0.0%) |
| 11:00 AM to 11:59 AM | 14 (2.1%) | 0 (0.0%) |
| 12:00 PM to 3:59 PM | 43 (6.5%) | 18 (2.4%) |
| 4:00 PM to 11:59 PM | 21 (3.2%) | 133 (17.8%) |
| Total | 667 (100.0%) | 745 (100.0%) |
Housing Occupancy in Sheridan
Occupancy by Ownership in Sheridan
Of the total 1,965 dwellings in Sheridan, owner-occupied units account for 1,216 (61.9%), while renter-occupied units make up 749 (38.1%).
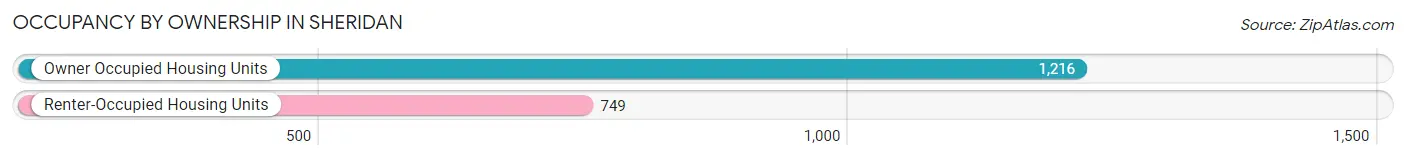
| Occupancy | # Housing Units | % Housing Units |
| Owner Occupied Housing Units | 1,216 | 61.9% |
| Renter-Occupied Housing Units | 749 | 38.1% |
| Total Occupied Housing Units | 1,965 | 100.0% |
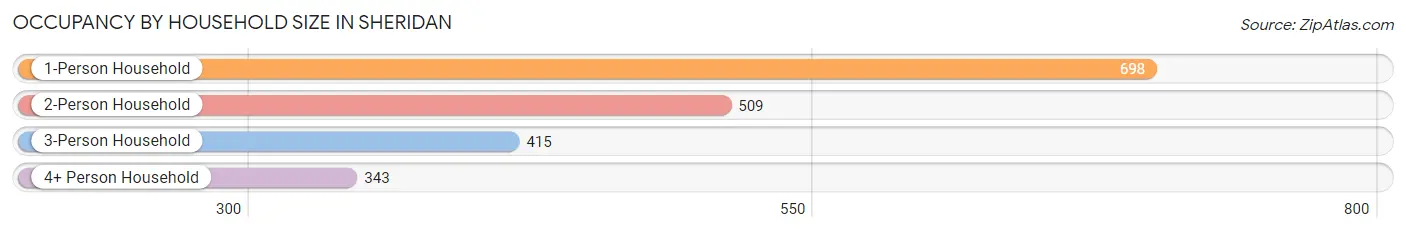
Occupancy by Household Size in Sheridan
| Household Size | # Housing Units | % Housing Units |
| 1-Person Household | 698 | 35.5% |
| 2-Person Household | 509 | 25.9% |
| 3-Person Household | 415 | 21.1% |
| 4+ Person Household | 343 | 17.5% |
| Total Housing Units | 1,965 | 100.0% |
Occupancy by Ownership by Household Size in Sheridan
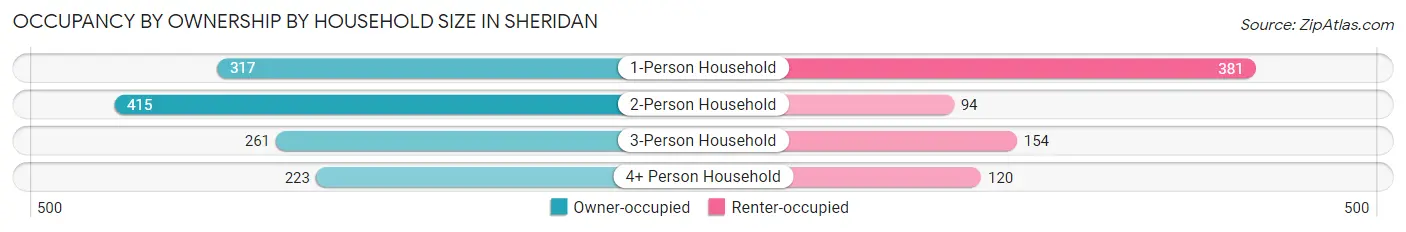
| Household Size | Owner-occupied | Renter-occupied |
| 1-Person Household | 317 (45.4%) | 381 (54.6%) |
| 2-Person Household | 415 (81.5%) | 94 (18.5%) |
| 3-Person Household | 261 (62.9%) | 154 (37.1%) |
| 4+ Person Household | 223 (65.0%) | 120 (35.0%) |
| Total Housing Units | 1,216 (61.9%) | 749 (38.1%) |
Occupancy by Educational Attainment in Sheridan
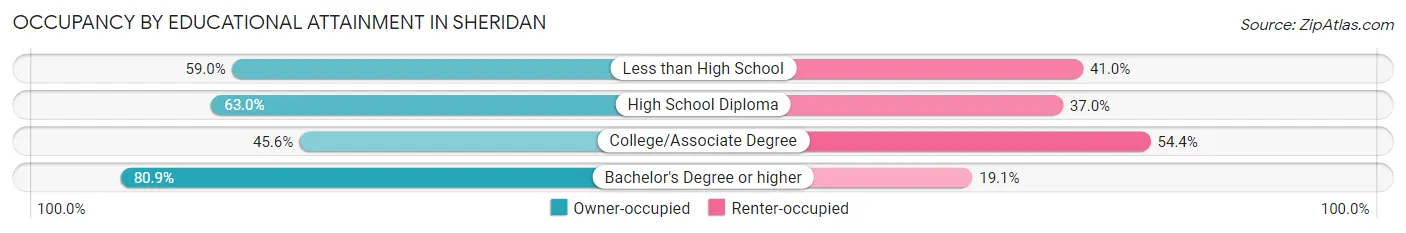
| Household Size | Owner-occupied | Renter-occupied |
| Less than High School | 46 (59.0%) | 32 (41.0%) |
| High School Diploma | 410 (63.0%) | 241 (37.0%) |
| College/Associate Degree | 310 (45.6%) | 370 (54.4%) |
| Bachelor's Degree or higher | 450 (80.9%) | 106 (19.1%) |
Occupancy by Age of Householder in Sheridan
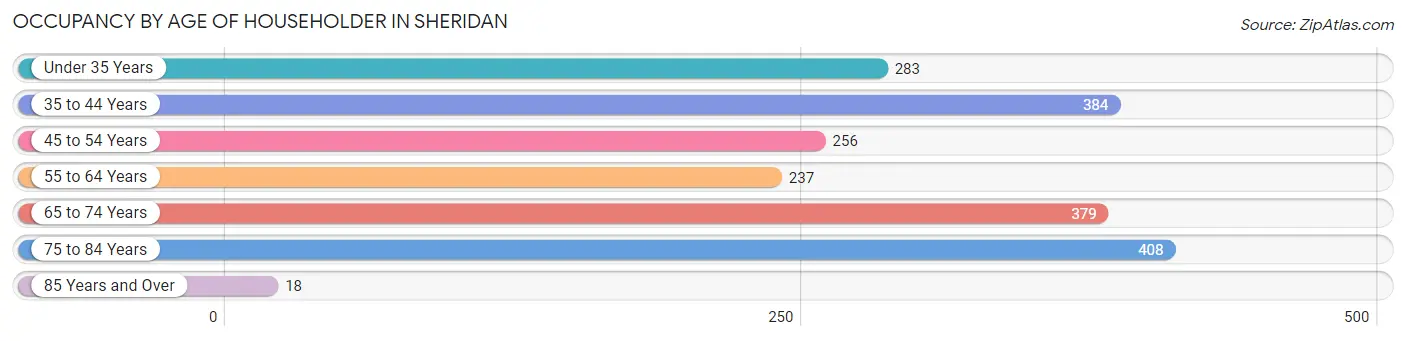
| Age Bracket | # Households | % Households |
| Under 35 Years | 283 | 14.4% |
| 35 to 44 Years | 384 | 19.5% |
| 45 to 54 Years | 256 | 13.0% |
| 55 to 64 Years | 237 | 12.1% |
| 65 to 74 Years | 379 | 19.3% |
| 75 to 84 Years | 408 | 20.8% |
| 85 Years and Over | 18 | 0.9% |
| Total | 1,965 | 100.0% |
Housing Finances in Sheridan
Median Income by Occupancy in Sheridan
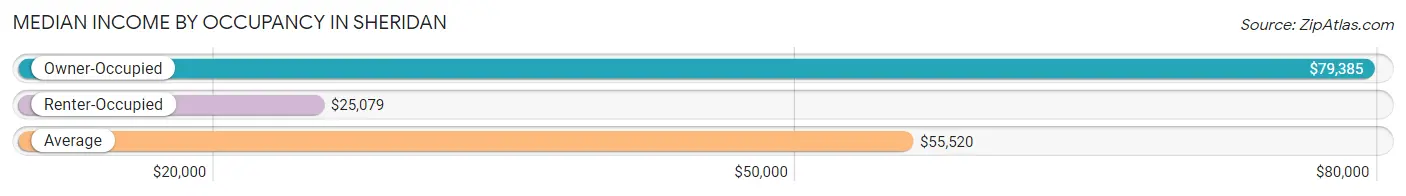
| Occupancy Type | # Households | Median Income |
| Owner-Occupied | 1,216 (61.9%) | $79,385 |
| Renter-Occupied | 749 (38.1%) | $25,079 |
| Average | 1,965 (100.0%) | $55,520 |
Occupancy by Householder Income Bracket in Sheridan
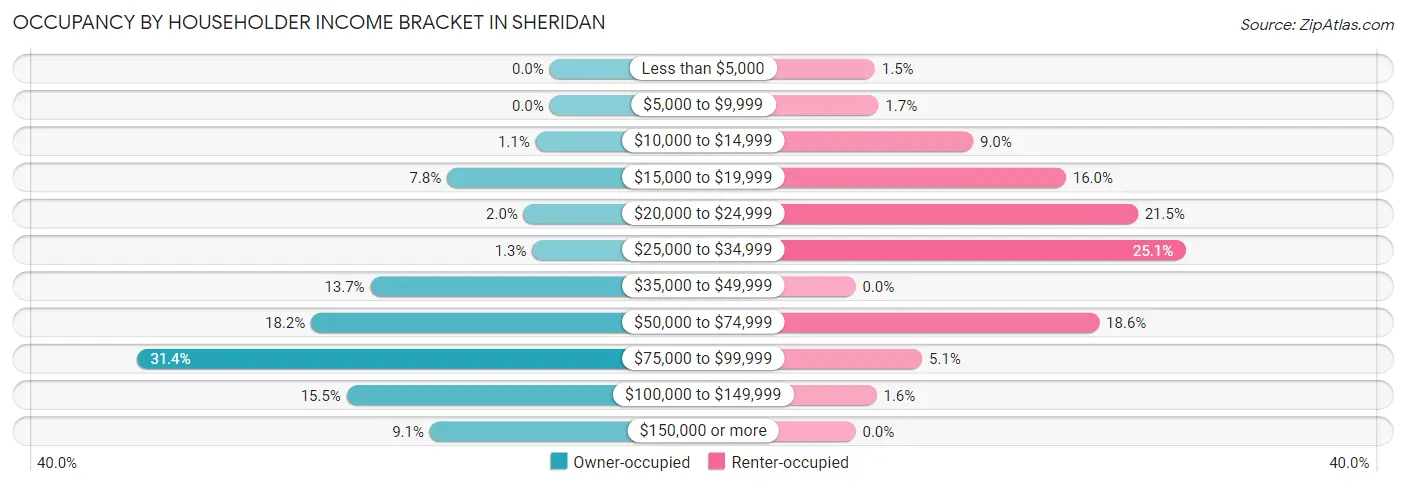
| Income Bracket | Owner-occupied | Renter-occupied |
| Less than $5,000 | 0 (0.0%) | 11 (1.5%) |
| $5,000 to $9,999 | 0 (0.0%) | 13 (1.7%) |
| $10,000 to $14,999 | 13 (1.1%) | 67 (8.9%) |
| $15,000 to $19,999 | 95 (7.8%) | 120 (16.0%) |
| $20,000 to $24,999 | 24 (2.0%) | 161 (21.5%) |
| $25,000 to $34,999 | 16 (1.3%) | 188 (25.1%) |
| $35,000 to $49,999 | 166 (13.7%) | 0 (0.0%) |
| $50,000 to $74,999 | 221 (18.2%) | 139 (18.6%) |
| $75,000 to $99,999 | 382 (31.4%) | 38 (5.1%) |
| $100,000 to $149,999 | 188 (15.5%) | 12 (1.6%) |
| $150,000 or more | 111 (9.1%) | 0 (0.0%) |
| Total | 1,216 (100.0%) | 749 (100.0%) |
Monthly Housing Cost Tiers in Sheridan
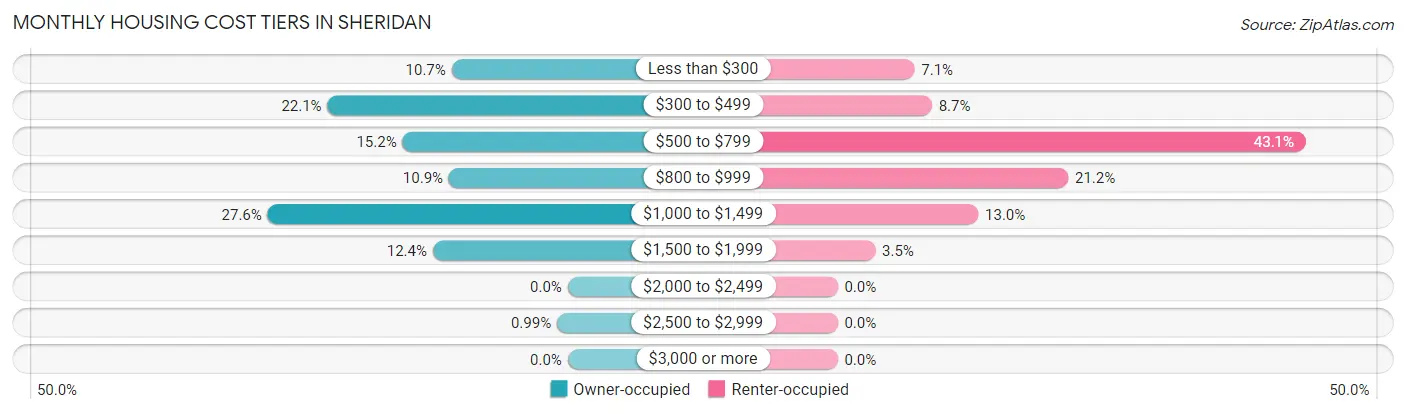
| Monthly Cost | Owner-occupied | Renter-occupied |
| Less than $300 | 130 (10.7%) | 53 (7.1%) |
| $300 to $499 | 269 (22.1%) | 65 (8.7%) |
| $500 to $799 | 185 (15.2%) | 323 (43.1%) |
| $800 to $999 | 133 (10.9%) | 159 (21.2%) |
| $1,000 to $1,499 | 336 (27.6%) | 97 (13.0%) |
| $1,500 to $1,999 | 151 (12.4%) | 26 (3.5%) |
| $2,000 to $2,499 | 0 (0.0%) | 0 (0.0%) |
| $2,500 to $2,999 | 12 (1.0%) | 0 (0.0%) |
| $3,000 or more | 0 (0.0%) | 0 (0.0%) |
| Total | 1,216 (100.0%) | 749 (100.0%) |
Physical Housing Characteristics in Sheridan
Housing Structures in Sheridan
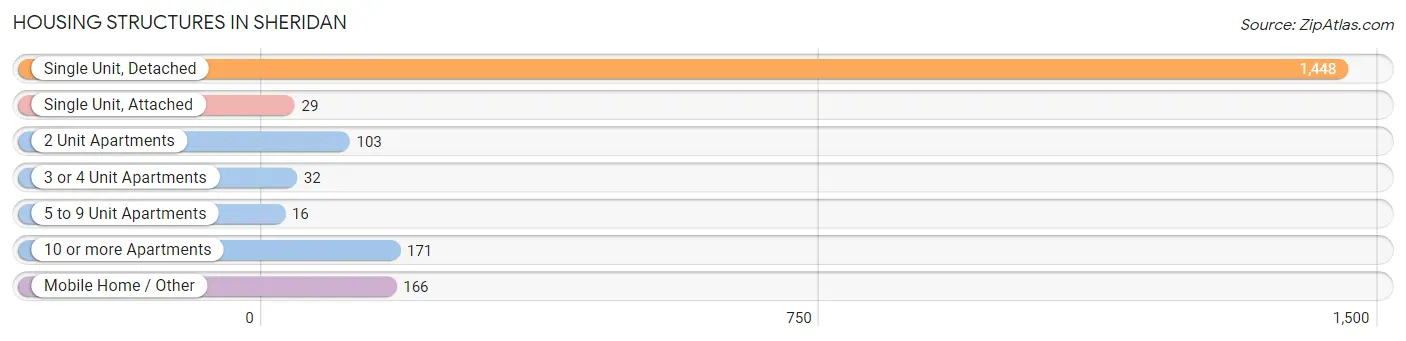
| Structure Type | # Housing Units | % Housing Units |
| Single Unit, Detached | 1,448 | 73.7% |
| Single Unit, Attached | 29 | 1.5% |
| 2 Unit Apartments | 103 | 5.2% |
| 3 or 4 Unit Apartments | 32 | 1.6% |
| 5 to 9 Unit Apartments | 16 | 0.8% |
| 10 or more Apartments | 171 | 8.7% |
| Mobile Home / Other | 166 | 8.5% |
| Total | 1,965 | 100.0% |
Housing Structures by Occupancy in Sheridan
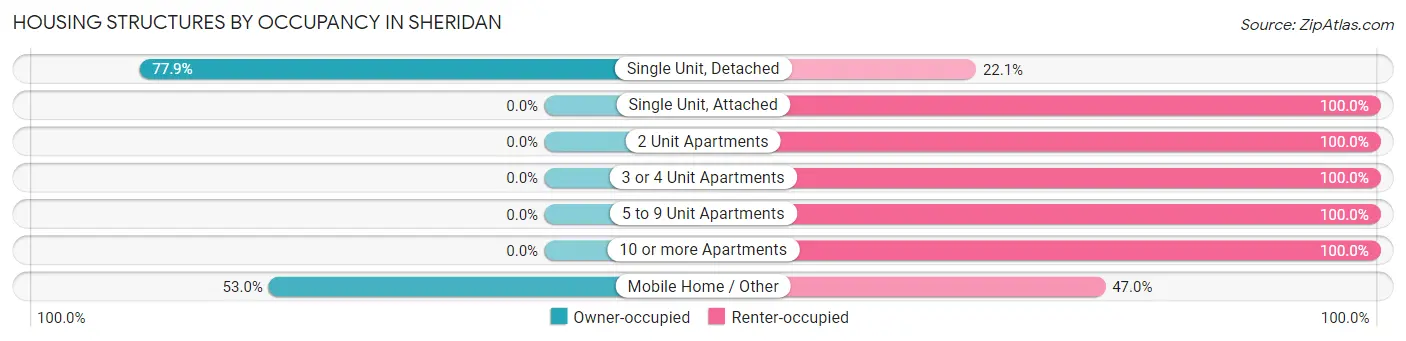
| Structure Type | Owner-occupied | Renter-occupied |
| Single Unit, Detached | 1,128 (77.9%) | 320 (22.1%) |
| Single Unit, Attached | 0 (0.0%) | 29 (100.0%) |
| 2 Unit Apartments | 0 (0.0%) | 103 (100.0%) |
| 3 or 4 Unit Apartments | 0 (0.0%) | 32 (100.0%) |
| 5 to 9 Unit Apartments | 0 (0.0%) | 16 (100.0%) |
| 10 or more Apartments | 0 (0.0%) | 171 (100.0%) |
| Mobile Home / Other | 88 (53.0%) | 78 (47.0%) |
| Total | 1,216 (61.9%) | 749 (38.1%) |
Housing Structures by Number of Rooms in Sheridan
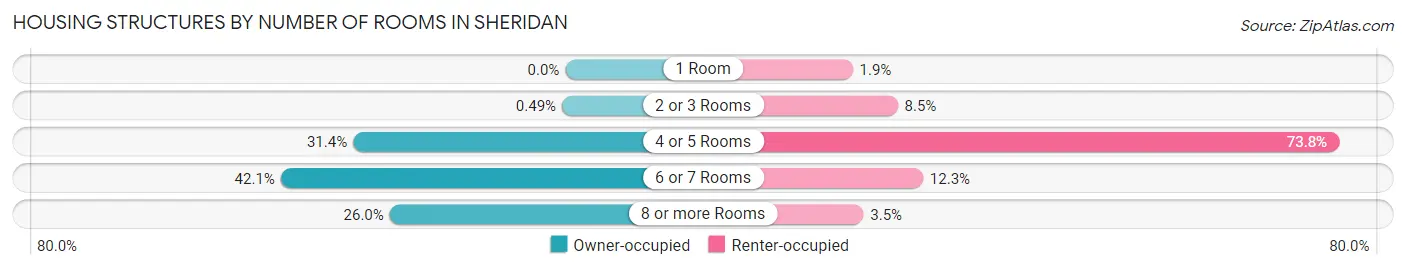
| Number of Rooms | Owner-occupied | Renter-occupied |
| 1 Room | 0 (0.0%) | 14 (1.9%) |
| 2 or 3 Rooms | 6 (0.5%) | 64 (8.5%) |
| 4 or 5 Rooms | 382 (31.4%) | 553 (73.8%) |
| 6 or 7 Rooms | 512 (42.1%) | 92 (12.3%) |
| 8 or more Rooms | 316 (26.0%) | 26 (3.5%) |
| Total | 1,216 (100.0%) | 749 (100.0%) |
Housing Structure by Heating Type in Sheridan
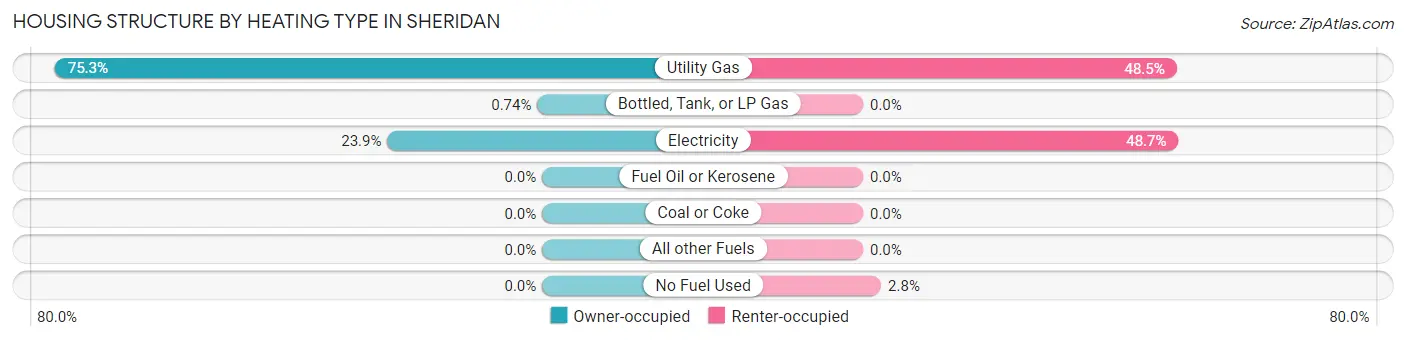
| Heating Type | Owner-occupied | Renter-occupied |
| Utility Gas | 916 (75.3%) | 363 (48.5%) |
| Bottled, Tank, or LP Gas | 9 (0.7%) | 0 (0.0%) |
| Electricity | 291 (23.9%) | 365 (48.7%) |
| Fuel Oil or Kerosene | 0 (0.0%) | 0 (0.0%) |
| Coal or Coke | 0 (0.0%) | 0 (0.0%) |
| All other Fuels | 0 (0.0%) | 0 (0.0%) |
| No Fuel Used | 0 (0.0%) | 21 (2.8%) |
| Total | 1,216 (100.0%) | 749 (100.0%) |
Household Vehicle Usage in Sheridan
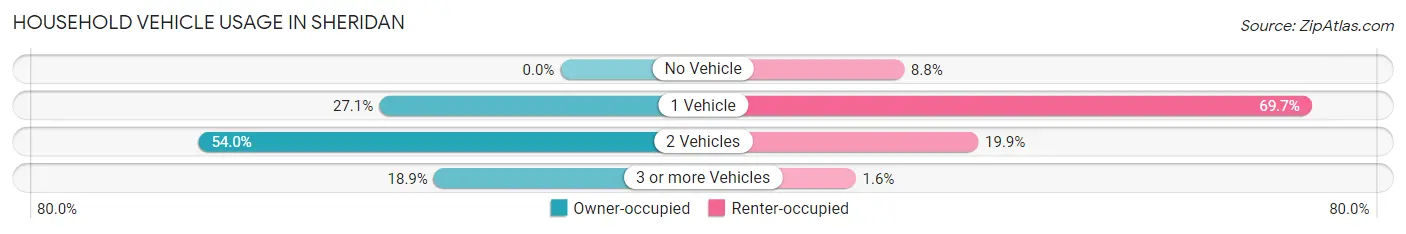
| Vehicles per Household | Owner-occupied | Renter-occupied |
| No Vehicle | 0 (0.0%) | 66 (8.8%) |
| 1 Vehicle | 329 (27.1%) | 522 (69.7%) |
| 2 Vehicles | 657 (54.0%) | 149 (19.9%) |
| 3 or more Vehicles | 230 (18.9%) | 12 (1.6%) |
| Total | 1,216 (100.0%) | 749 (100.0%) |
Real Estate & Mortgages in Sheridan
Real Estate and Mortgage Overview in Sheridan
| Characteristic | Without Mortgage | With Mortgage |
| Housing Units | 571 | 645 |
| Median Property Value | $184,200 | $170,100 |
| Median Household Income | $59,213 | $52 |
| Monthly Housing Costs | $412 | $0 |
| Real Estate Taxes | $632 | $48 |
Property Value by Mortgage Status in Sheridan
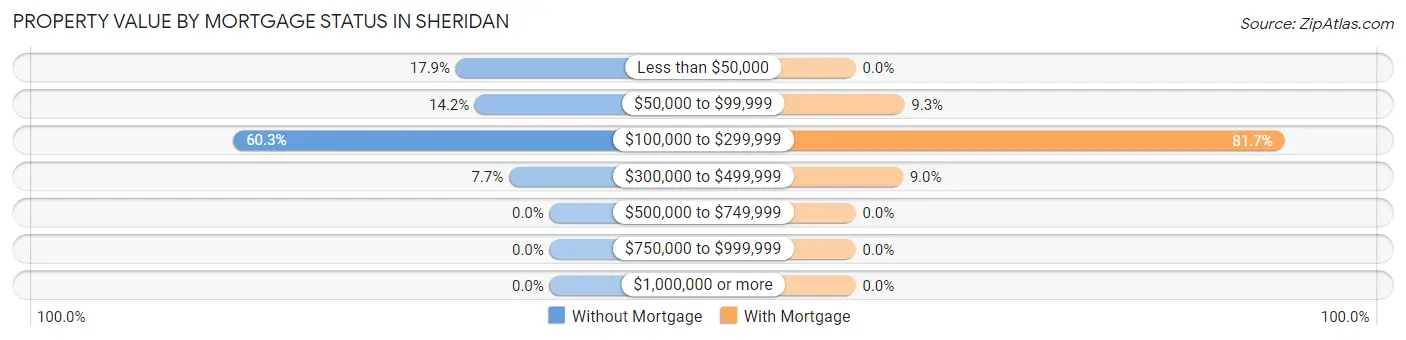
| Property Value | Without Mortgage | With Mortgage |
| Less than $50,000 | 102 (17.9%) | 0 (0.0%) |
| $50,000 to $99,999 | 81 (14.2%) | 60 (9.3%) |
| $100,000 to $299,999 | 344 (60.3%) | 527 (81.7%) |
| $300,000 to $499,999 | 44 (7.7%) | 58 (9.0%) |
| $500,000 to $749,999 | 0 (0.0%) | 0 (0.0%) |
| $750,000 to $999,999 | 0 (0.0%) | 0 (0.0%) |
| $1,000,000 or more | 0 (0.0%) | 0 (0.0%) |
| Total | 571 (100.0%) | 645 (100.0%) |
Household Income by Mortgage Status in Sheridan
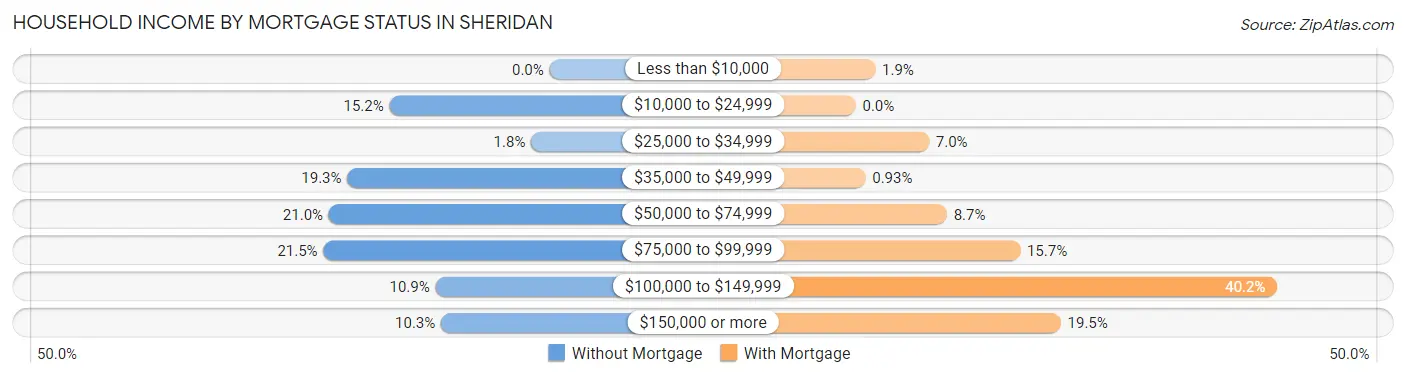
| Household Income | Without Mortgage | With Mortgage |
| Less than $10,000 | 0 (0.0%) | 12 (1.9%) |
| $10,000 to $24,999 | 87 (15.2%) | 0 (0.0%) |
| $25,000 to $34,999 | 10 (1.8%) | 45 (7.0%) |
| $35,000 to $49,999 | 110 (19.3%) | 6 (0.9%) |
| $50,000 to $74,999 | 120 (21.0%) | 56 (8.7%) |
| $75,000 to $99,999 | 123 (21.5%) | 101 (15.7%) |
| $100,000 to $149,999 | 62 (10.9%) | 259 (40.2%) |
| $150,000 or more | 59 (10.3%) | 126 (19.5%) |
| Total | 571 (100.0%) | 645 (100.0%) |
Property Value to Household Income Ratio in Sheridan
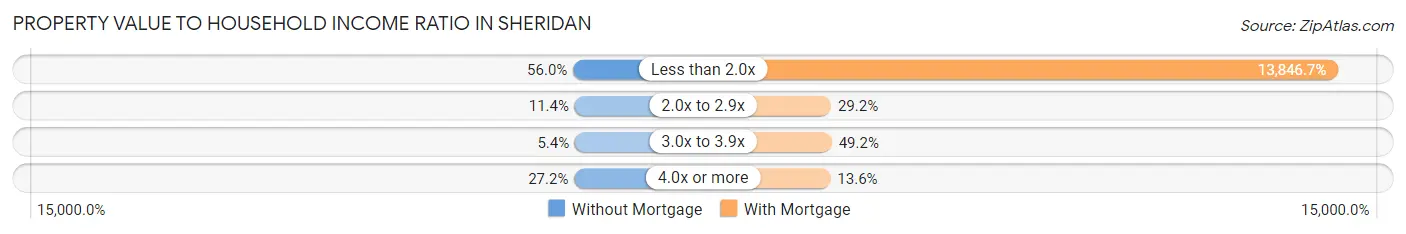
| Value-to-Income Ratio | Without Mortgage | With Mortgage |
| Less than 2.0x | 320 (56.0%) | 89,311 (13,846.7%) |
| 2.0x to 2.9x | 65 (11.4%) | 188 (29.1%) |
| 3.0x to 3.9x | 31 (5.4%) | 317 (49.1%) |
| 4.0x or more | 155 (27.2%) | 88 (13.6%) |
| Total | 571 (100.0%) | 645 (100.0%) |
Real Estate Taxes by Mortgage Status in Sheridan
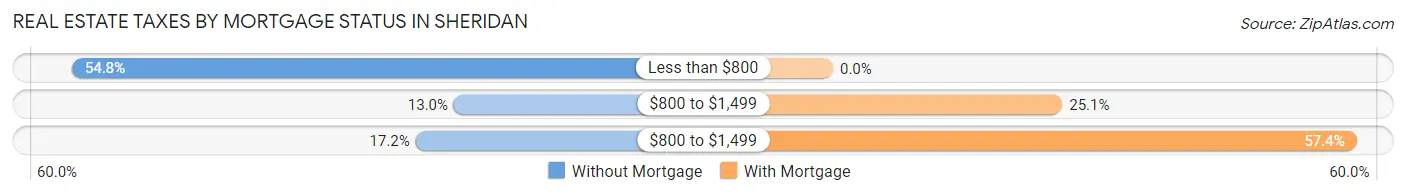
| Property Taxes | Without Mortgage | With Mortgage |
| Less than $800 | 313 (54.8%) | 0 (0.0%) |
| $800 to $1,499 | 74 (13.0%) | 162 (25.1%) |
| $800 to $1,499 | 98 (17.2%) | 370 (57.4%) |
| Total | 571 (100.0%) | 645 (100.0%) |
Health & Disability in Sheridan
Health Insurance Coverage by Age in Sheridan
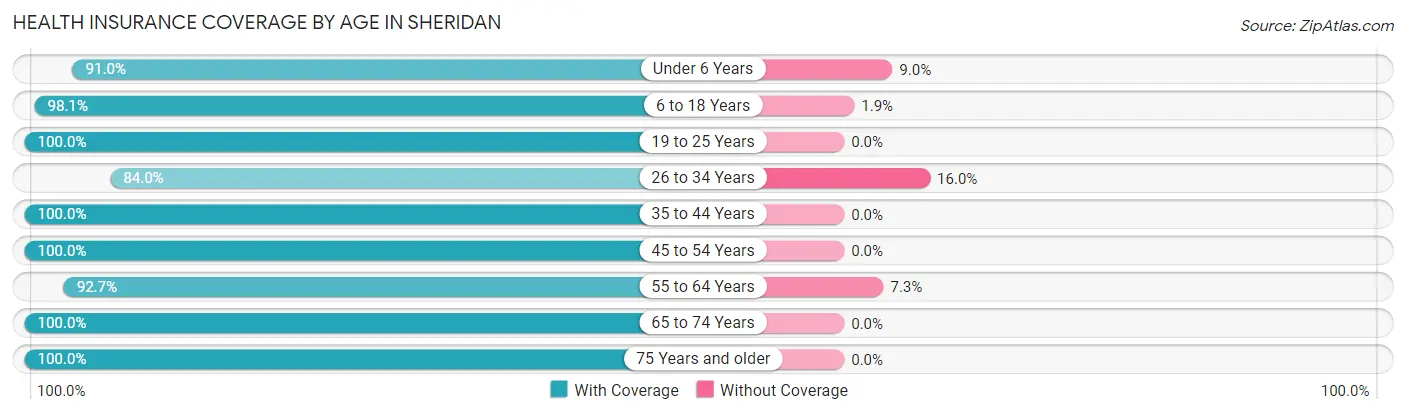
| Age Bracket | With Coverage | Without Coverage |
| Under 6 Years | 396 (91.0%) | 39 (9.0%) |
| 6 to 18 Years | 996 (98.1%) | 19 (1.9%) |
| 19 to 25 Years | 250 (100.0%) | 0 (0.0%) |
| 26 to 34 Years | 451 (84.0%) | 86 (16.0%) |
| 35 to 44 Years | 643 (100.0%) | 0 (0.0%) |
| 45 to 54 Years | 621 (100.0%) | 0 (0.0%) |
| 55 to 64 Years | 342 (92.7%) | 27 (7.3%) |
| 65 to 74 Years | 524 (100.0%) | 0 (0.0%) |
| 75 Years and older | 443 (100.0%) | 0 (0.0%) |
| Total | 4,666 (96.5%) | 171 (3.5%) |
Health Insurance Coverage by Citizenship Status in Sheridan
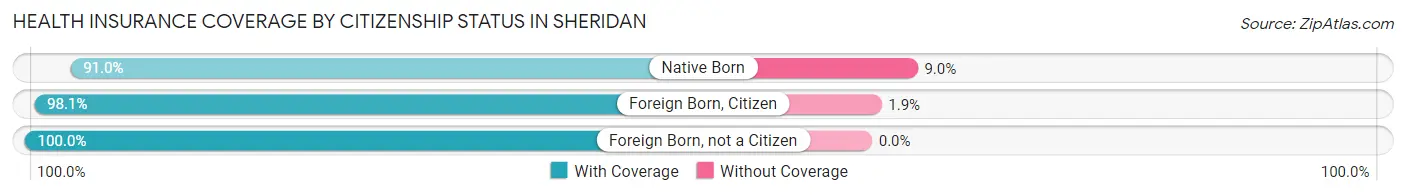
| Citizenship Status | With Coverage | Without Coverage |
| Native Born | 396 (91.0%) | 39 (9.0%) |
| Foreign Born, Citizen | 996 (98.1%) | 19 (1.9%) |
| Foreign Born, not a Citizen | 250 (100.0%) | 0 (0.0%) |
Health Insurance Coverage by Household Income in Sheridan
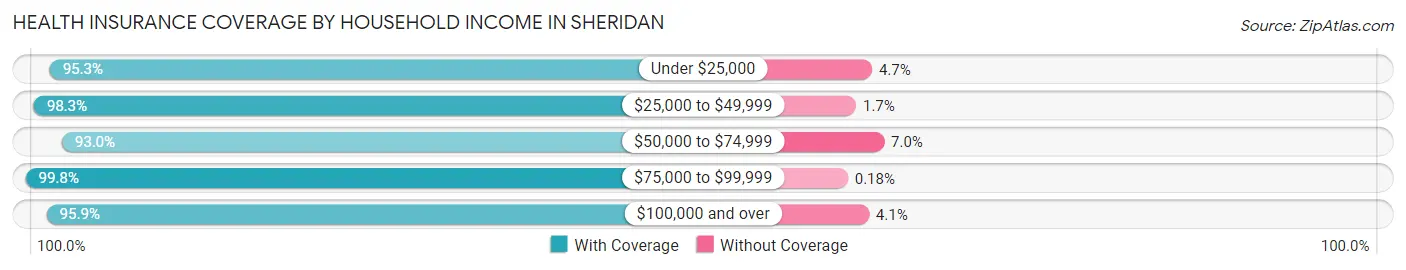
| Household Income | With Coverage | Without Coverage |
| Under $25,000 | 849 (95.3%) | 42 (4.7%) |
| $25,000 to $49,999 | 793 (98.3%) | 14 (1.7%) |
| $50,000 to $74,999 | 985 (93.0%) | 74 (7.0%) |
| $75,000 to $99,999 | 1,135 (99.8%) | 2 (0.2%) |
| $100,000 and over | 904 (95.9%) | 39 (4.1%) |
Public vs Private Health Insurance Coverage by Age in Sheridan
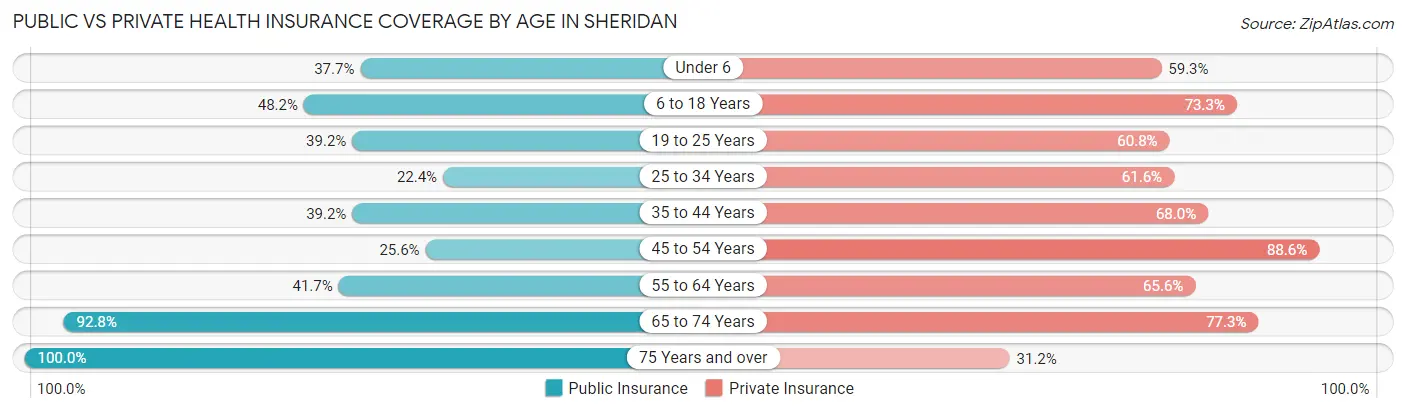
| Age Bracket | Public Insurance | Private Insurance |
| Under 6 | 164 (37.7%) | 258 (59.3%) |
| 6 to 18 Years | 489 (48.2%) | 744 (73.3%) |
| 19 to 25 Years | 98 (39.2%) | 152 (60.8%) |
| 25 to 34 Years | 120 (22.4%) | 331 (61.6%) |
| 35 to 44 Years | 252 (39.2%) | 437 (68.0%) |
| 45 to 54 Years | 159 (25.6%) | 550 (88.6%) |
| 55 to 64 Years | 154 (41.7%) | 242 (65.6%) |
| 65 to 74 Years | 486 (92.7%) | 405 (77.3%) |
| 75 Years and over | 443 (100.0%) | 138 (31.1%) |
| Total | 2,365 (48.9%) | 3,257 (67.3%) |
Disability Status by Sex by Age in Sheridan
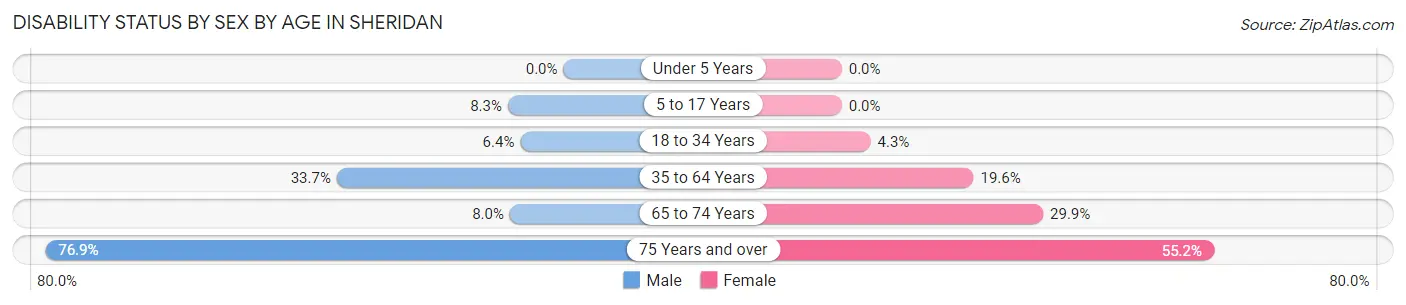
| Age Bracket | Male | Female |
| Under 5 Years | 0 (0.0%) | 0 (0.0%) |
| 5 to 17 Years | 39 (8.3%) | 0 (0.0%) |
| 18 to 34 Years | 29 (6.4%) | 18 (4.3%) |
| 35 to 64 Years | 214 (33.7%) | 195 (19.6%) |
| 65 to 74 Years | 14 (8.0%) | 104 (29.9%) |
| 75 Years and over | 150 (76.9%) | 137 (55.2%) |
Disability Class by Sex by Age in Sheridan
Disability Class: Hearing Difficulty
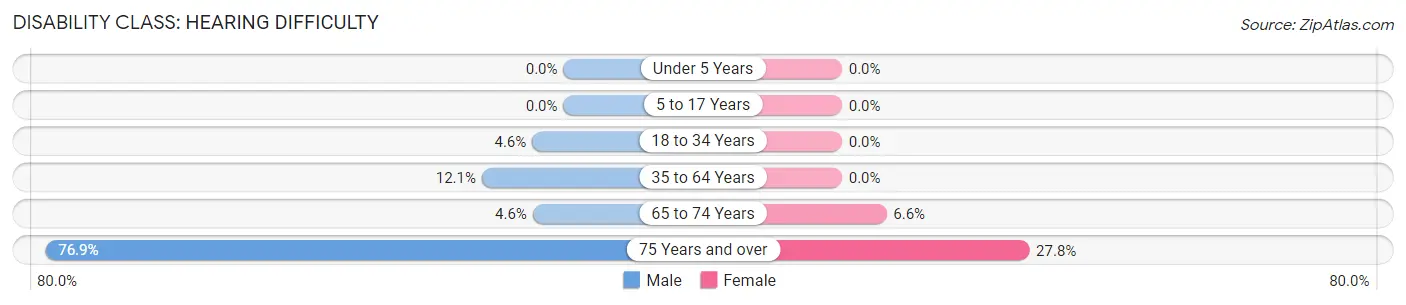
| Age Bracket | Male | Female |
| Under 5 Years | 0 (0.0%) | 0 (0.0%) |
| 5 to 17 Years | 0 (0.0%) | 0 (0.0%) |
| 18 to 34 Years | 21 (4.6%) | 0 (0.0%) |
| 35 to 64 Years | 77 (12.1%) | 0 (0.0%) |
| 65 to 74 Years | 8 (4.5%) | 23 (6.6%) |
| 75 Years and over | 150 (76.9%) | 69 (27.8%) |
Disability Class: Vision Difficulty
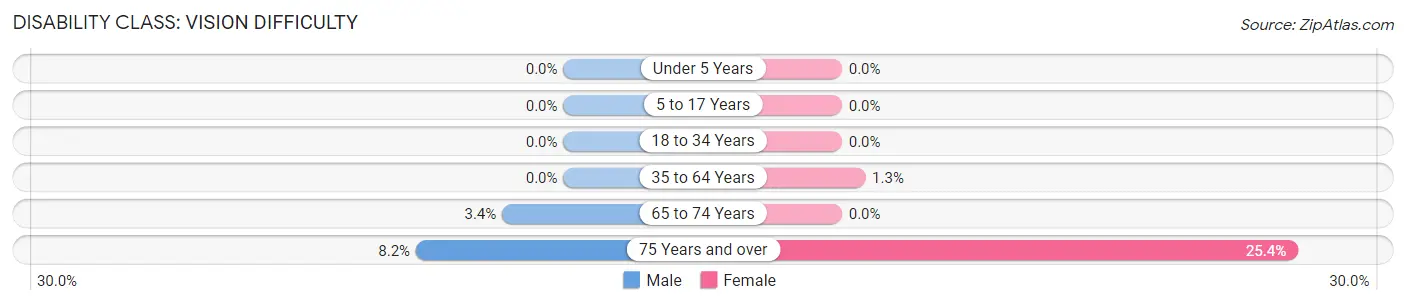
| Age Bracket | Male | Female |
| Under 5 Years | 0 (0.0%) | 0 (0.0%) |
| 5 to 17 Years | 0 (0.0%) | 0 (0.0%) |
| 18 to 34 Years | 0 (0.0%) | 0 (0.0%) |
| 35 to 64 Years | 0 (0.0%) | 13 (1.3%) |
| 65 to 74 Years | 6 (3.4%) | 0 (0.0%) |
| 75 Years and over | 16 (8.2%) | 63 (25.4%) |
Disability Class: Cognitive Difficulty
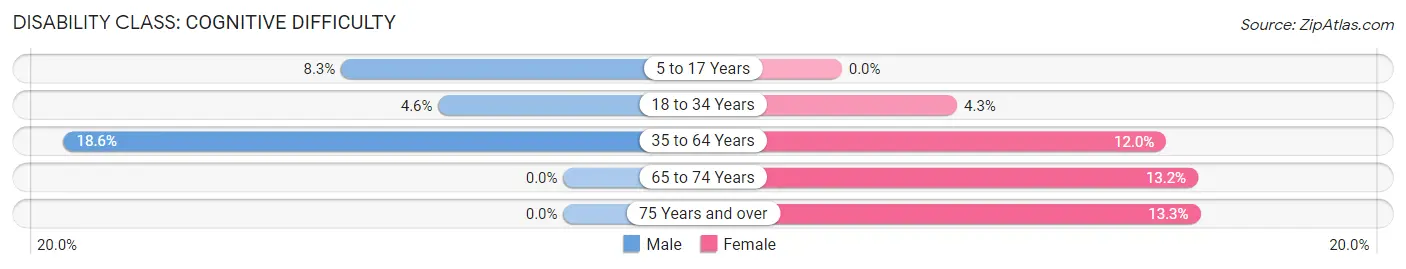
| Age Bracket | Male | Female |
| 5 to 17 Years | 39 (8.3%) | 0 (0.0%) |
| 18 to 34 Years | 21 (4.6%) | 18 (4.3%) |
| 35 to 64 Years | 118 (18.5%) | 120 (12.0%) |
| 65 to 74 Years | 0 (0.0%) | 46 (13.2%) |
| 75 Years and over | 0 (0.0%) | 33 (13.3%) |
Disability Class: Ambulatory Difficulty
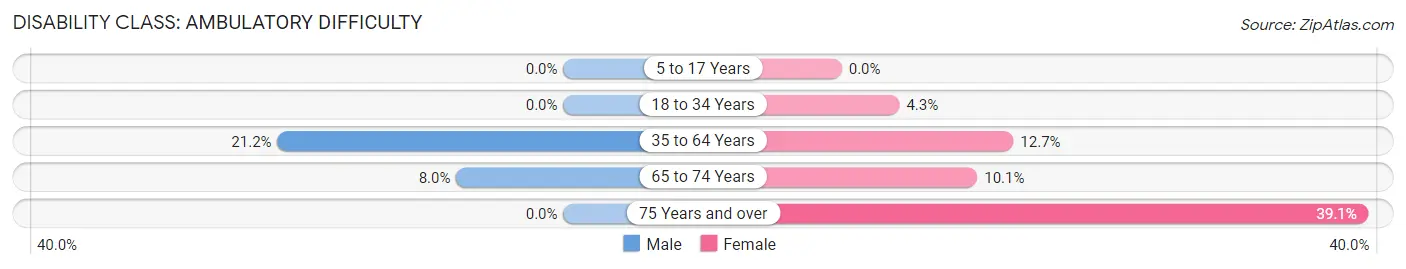
| Age Bracket | Male | Female |
| 5 to 17 Years | 0 (0.0%) | 0 (0.0%) |
| 18 to 34 Years | 0 (0.0%) | 18 (4.3%) |
| 35 to 64 Years | 135 (21.2%) | 127 (12.7%) |
| 65 to 74 Years | 14 (8.0%) | 35 (10.1%) |
| 75 Years and over | 0 (0.0%) | 97 (39.1%) |
Disability Class: Self-Care Difficulty
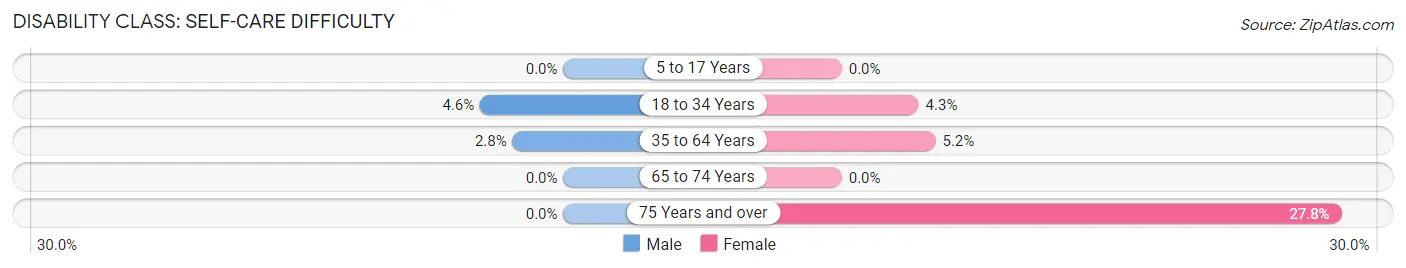
| Age Bracket | Male | Female |
| 5 to 17 Years | 0 (0.0%) | 0 (0.0%) |
| 18 to 34 Years | 21 (4.6%) | 18 (4.3%) |
| 35 to 64 Years | 18 (2.8%) | 52 (5.2%) |
| 65 to 74 Years | 0 (0.0%) | 0 (0.0%) |
| 75 Years and over | 0 (0.0%) | 69 (27.8%) |
Technology Access in Sheridan
Computing Device Access in Sheridan
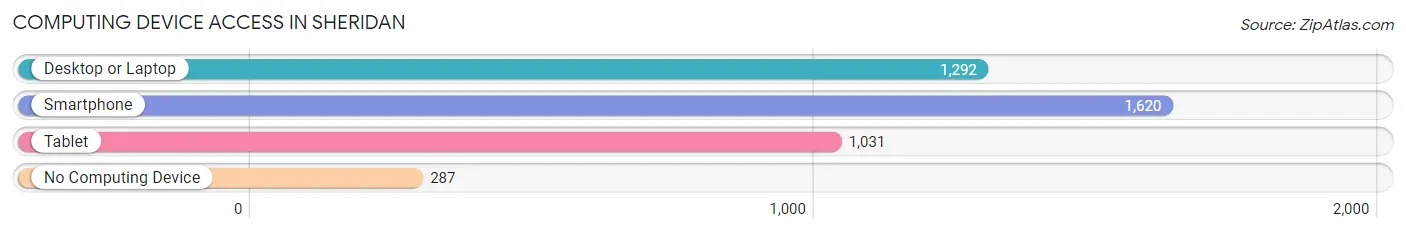
| Device Type | # Households | % Households |
| Desktop or Laptop | 1,292 | 65.7% |
| Smartphone | 1,620 | 82.4% |
| Tablet | 1,031 | 52.5% |
| No Computing Device | 287 | 14.6% |
| Total | 1,965 | 100.0% |
Internet Access in Sheridan
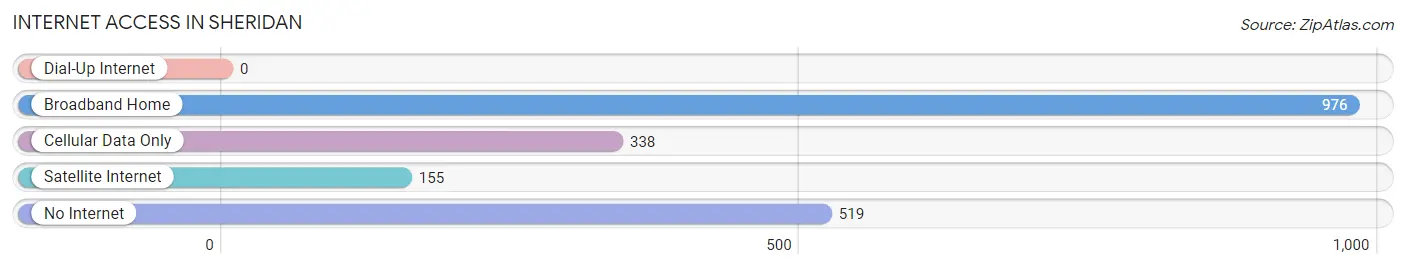
| Internet Type | # Households | % Households |
| Dial-Up Internet | 0 | 0.0% |
| Broadband Home | 976 | 49.7% |
| Cellular Data Only | 338 | 17.2% |
| Satellite Internet | 155 | 7.9% |
| No Internet | 519 | 26.4% |
| Total | 1,965 | 100.0% |
Sheridan Summary
Sheridan, Arkansas is a small city located in Grant County in the south-central part of the state. It is situated on the banks of the Saline River, about 30 miles south of Little Rock. The city has a population of approximately 4,000 people and is the county seat of Grant County.
Sheridan was founded in 1873 and was named after General Philip Sheridan, a Union Army officer during the Civil War. The city was incorporated in 1875 and has since grown to become a thriving community.
Geography
Sheridan is located in the Ouachita Mountains region of Arkansas. The city is situated on the banks of the Saline River, which flows through the city and provides a source of recreation for the residents. The city is surrounded by rolling hills and forests, providing a beautiful backdrop for the city. The climate in Sheridan is mild, with temperatures ranging from the mid-50s in the winter to the mid-80s in the summer.
Economy
Sheridan’s economy is largely based on agriculture and manufacturing. The city is home to several large poultry processing plants, as well as a number of smaller businesses. The city also has a thriving tourism industry, with many visitors coming to the area to enjoy the natural beauty of the Ouachita Mountains.
Demographics
As of the 2010 census, the population of Sheridan was 4,082. The racial makeup of the city was 79.3% White, 17.2% African American, 0.4% Native American, 0.7% Asian, 0.1% Pacific Islander, and 2.3% from other races. The median household income in Sheridan was $33,958, and the median family income was $41,919.
Conclusion
Sheridan, Arkansas is a small city located in Grant County in the south-central part of the state. It is situated on the banks of the Saline River and has a population of approximately 4,000 people. The city’s economy is largely based on agriculture and manufacturing, and it is also a popular tourist destination. The racial makeup of the city is 79.3% White, 17.2% African American, 0.4% Native American, 0.7% Asian, 0.1% Pacific Islander, and 2.3% from other races. The median household income in Sheridan was $33,958, and the median family income was $41,919.
Common Questions
What is Per Capita Income in Sheridan?
Per Capita income in Sheridan is $27,554.
What is the Median Family Income in Sheridan?
Median Family Income in Sheridan is $72,500.
What is the Median Household income in Sheridan?
Median Household Income in Sheridan is $55,520.
What is Income or Wage Gap in Sheridan?
Income or Wage Gap in Sheridan is 10.7%.
Women in Sheridan earn 89.3 cents for every dollar earned by a man.
What is Inequality or Gini Index in Sheridan?
Inequality or Gini Index in Sheridan is 0.41.
What is the Total Population of Sheridan?
Total Population of Sheridan is 5,002.
What is the Total Male Population of Sheridan?
Total Male Population of Sheridan is 2,193.
What is the Total Female Population of Sheridan?
Total Female Population of Sheridan is 2,809.
What is the Ratio of Males per 100 Females in Sheridan?
There are 78.07 Males per 100 Females in Sheridan.
What is the Ratio of Females per 100 Males in Sheridan?
There are 128.09 Females per 100 Males in Sheridan.
What is the Median Population Age in Sheridan?
Median Population Age in Sheridan is 38.4 Years.
What is the Average Family Size in Sheridan
Average Family Size in Sheridan is 3.2 People.
What is the Average Household Size in Sheridan
Average Household Size in Sheridan is 2.5 People.
How Large is the Labor Force in Sheridan?
There are 1,684 People in the Labor Forcein in Sheridan.
What is the Percentage of People in the Labor Force in Sheridan?
44.0% of People are in the Labor Force in Sheridan.
What is the Unemployment Rate in Sheridan?
Unemployment Rate in Sheridan is 3.9%.