Murfreesboro, AR
Murfreesboro Map
Murfreesboro Overview
1,703
TOTAL POPULATION
846
MALE POPULATION
857
FEMALE POPULATION
98.72
MALES / 100 FEMALES
101.30
FEMALES / 100 MALES
44.0
MEDIAN AGE
3.0
AVG FAMILY SIZE
2.3
AVG HOUSEHOLD SIZE
$22,241
PER CAPITA INCOME
$58,810
AVG FAMILY INCOME
$37,206
AVG HOUSEHOLD INCOME
46.6%
WAGE / INCOME GAP [ % ]
53.4¢/ $1
WAGE / INCOME GAP [ $ ]
$9,763
FAMILY INCOME DEFICIT
0.45
INEQUALITY / GINI INDEX
747
LABOR FORCE [ PEOPLE ]
54.5%
PERCENT IN LABOR FORCE
7.1%
UNEMPLOYMENT RATE
Murfreesboro Zip Codes
Murfreesboro Area Codes
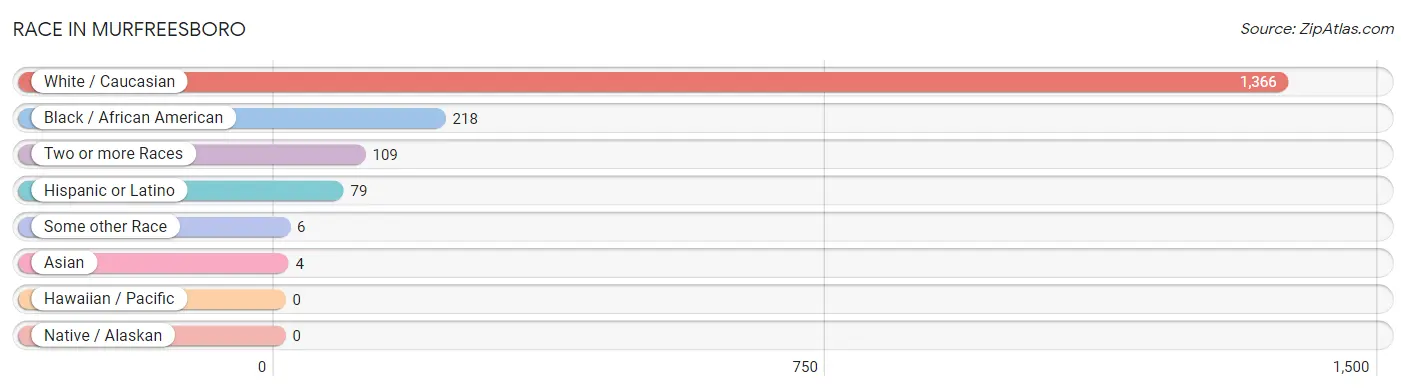
Race in Murfreesboro
The most populous races in Murfreesboro are White / Caucasian (1,366 | 80.2%), Black / African American (218 | 12.8%), and Two or more Races (109 | 6.4%).
| Race | # Population | % Population |
| Asian | 4 | 0.2% |
| Black / African American | 218 | 12.8% |
| Hawaiian / Pacific | 0 | 0.0% |
| Hispanic or Latino | 79 | 4.6% |
| Native / Alaskan | 0 | 0.0% |
| White / Caucasian | 1,366 | 80.2% |
| Two or more Races | 109 | 6.4% |
| Some other Race | 6 | 0.4% |
| Total | 1,703 | 100.0% |
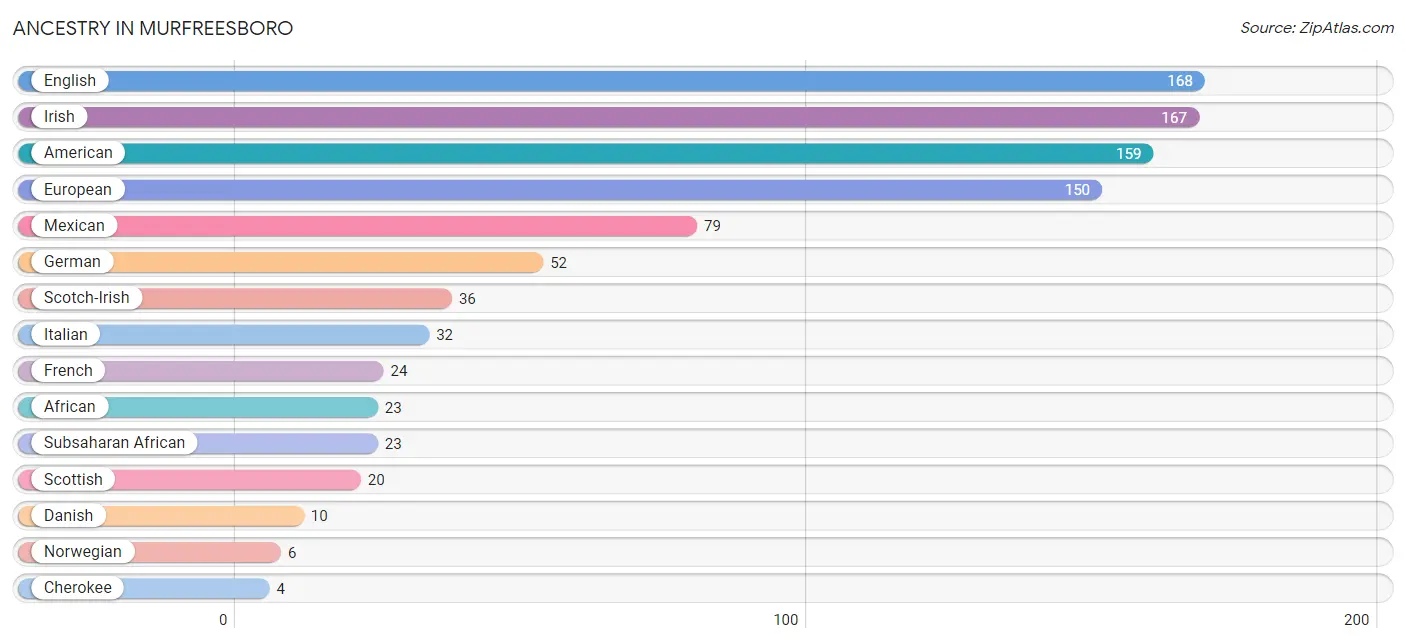
Ancestry in Murfreesboro
The most populous ancestries reported in Murfreesboro are English (168 | 9.9%), Irish (167 | 9.8%), American (159 | 9.3%), European (150 | 8.8%), and Mexican (79 | 4.6%), together accounting for 42.5% of all Murfreesboro residents.
| Ancestry | # Population | % Population |
| African | 23 | 1.3% |
| American | 159 | 9.3% |
| Blackfeet | 2 | 0.1% |
| Cherokee | 4 | 0.2% |
| Danish | 10 | 0.6% |
| English | 168 | 9.9% |
| European | 150 | 8.8% |
| French | 24 | 1.4% |
| French Canadian | 2 | 0.1% |
| German | 52 | 3.0% |
| Irish | 167 | 9.8% |
| Italian | 32 | 1.9% |
| Korean | 4 | 0.2% |
| Mexican | 79 | 4.6% |
| Norwegian | 6 | 0.4% |
| Scotch-Irish | 36 | 2.1% |
| Scottish | 20 | 1.2% |
| Subsaharan African | 23 | 1.3% |
| Swiss | 1 | 0.1% |
| Welsh | 3 | 0.2% | View All 20 Rows |
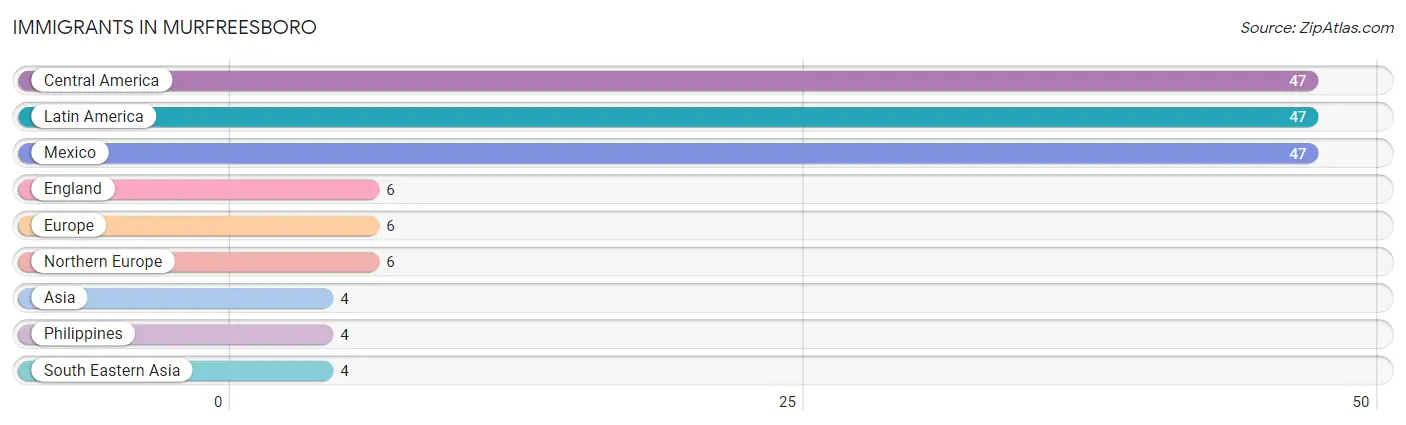
Immigrants in Murfreesboro
The most numerous immigrant groups reported in Murfreesboro came from Central America (47 | 2.8%), Latin America (47 | 2.8%), Mexico (47 | 2.8%), England (6 | 0.4%), and Europe (6 | 0.4%), together accounting for 9.0% of all Murfreesboro residents.
| Immigration Origin | # Population | % Population |
| Asia | 4 | 0.2% |
| Central America | 47 | 2.8% |
| England | 6 | 0.4% |
| Europe | 6 | 0.4% |
| Latin America | 47 | 2.8% |
| Mexico | 47 | 2.8% |
| Northern Europe | 6 | 0.4% |
| Philippines | 4 | 0.2% |
| South Eastern Asia | 4 | 0.2% | View All 9 Rows |
Sex and Age in Murfreesboro
Sex and Age in Murfreesboro
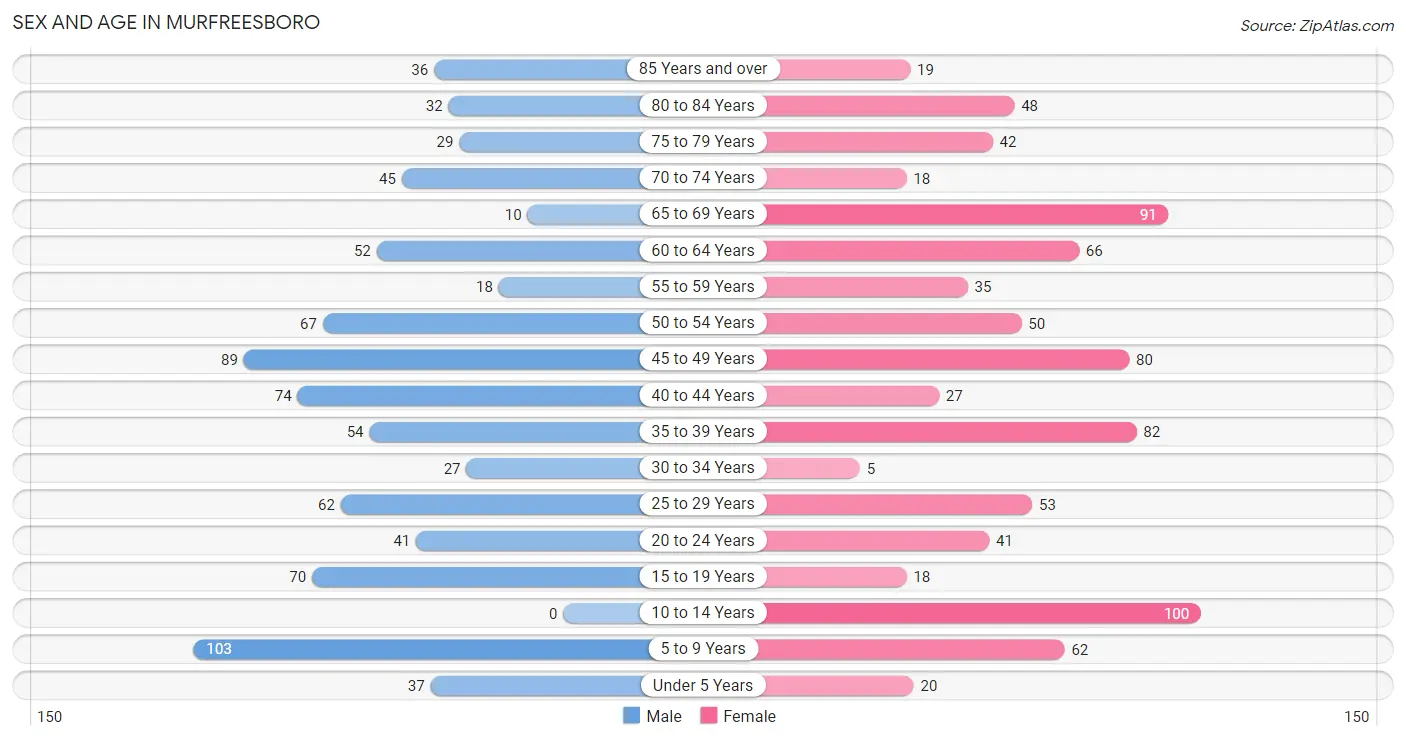
The most populous age groups in Murfreesboro are 5 to 9 Years (103 | 12.2%) for men and 10 to 14 Years (100 | 11.7%) for women.
| Age Bracket | Male | Female |
| Under 5 Years | 37 (4.4%) | 20 (2.3%) |
| 5 to 9 Years | 103 (12.2%) | 62 (7.2%) |
| 10 to 14 Years | 0 (0.0%) | 100 (11.7%) |
| 15 to 19 Years | 70 (8.3%) | 18 (2.1%) |
| 20 to 24 Years | 41 (4.9%) | 41 (4.8%) |
| 25 to 29 Years | 62 (7.3%) | 53 (6.2%) |
| 30 to 34 Years | 27 (3.2%) | 5 (0.6%) |
| 35 to 39 Years | 54 (6.4%) | 82 (9.6%) |
| 40 to 44 Years | 74 (8.7%) | 27 (3.2%) |
| 45 to 49 Years | 89 (10.5%) | 80 (9.3%) |
| 50 to 54 Years | 67 (7.9%) | 50 (5.8%) |
| 55 to 59 Years | 18 (2.1%) | 35 (4.1%) |
| 60 to 64 Years | 52 (6.1%) | 66 (7.7%) |
| 65 to 69 Years | 10 (1.2%) | 91 (10.6%) |
| 70 to 74 Years | 45 (5.3%) | 18 (2.1%) |
| 75 to 79 Years | 29 (3.4%) | 42 (4.9%) |
| 80 to 84 Years | 32 (3.8%) | 48 (5.6%) |
| 85 Years and over | 36 (4.3%) | 19 (2.2%) |
| Total | 846 (100.0%) | 857 (100.0%) |
Families and Households in Murfreesboro
Median Family Size in Murfreesboro
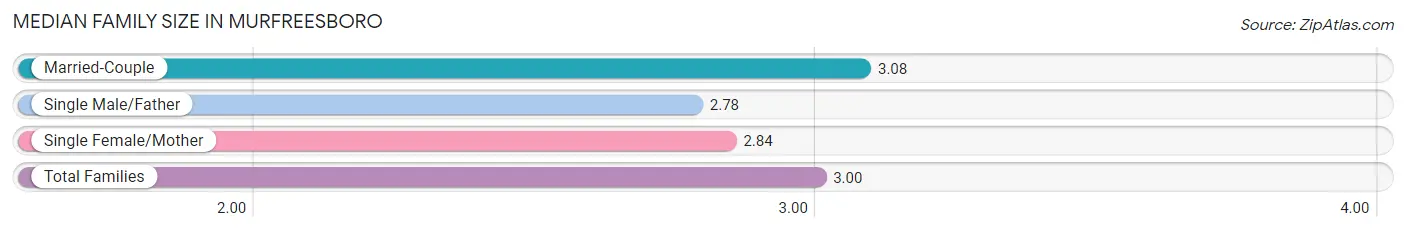
The median family size in Murfreesboro is 3.00 persons per family, with married-couple families (301 | 71.3%) accounting for the largest median family size of 3.08 persons per family. On the other hand, single male/father families (58 | 13.7%) represent the smallest median family size with 2.78 persons per family.
| Family Type | # Families | Family Size |
| Married-Couple | 301 (71.3%) | 3.08 |
| Single Male/Father | 58 (13.7%) | 2.78 |
| Single Female/Mother | 63 (14.9%) | 2.84 |
| Total Families | 422 (100.0%) | 3.00 |
Median Household Size in Murfreesboro
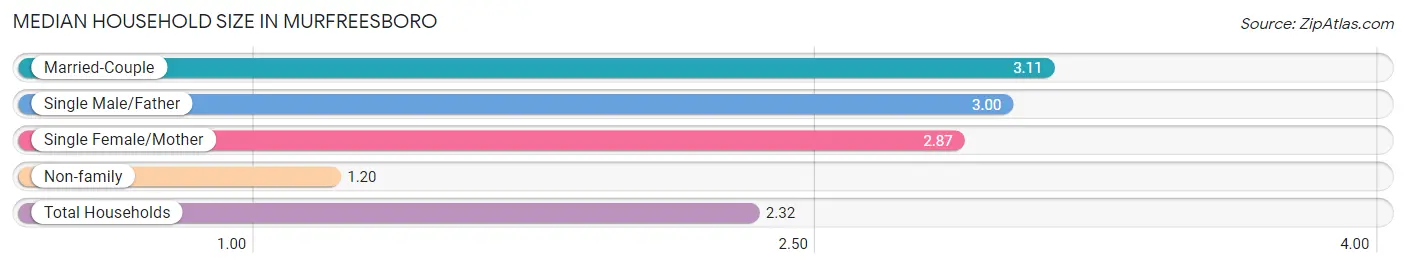
The median household size in Murfreesboro is 2.32 persons per household, with married-couple households (301 | 43.1%) accounting for the largest median household size of 3.11 persons per household. non-family households (276 | 39.5%) represent the smallest median household size with 1.20 persons per household.
| Household Type | # Households | Household Size |
| Married-Couple | 301 (43.1%) | 3.11 |
| Single Male/Father | 58 (8.3%) | 3.00 |
| Single Female/Mother | 63 (9.0%) | 2.87 |
| Non-family | 276 (39.5%) | 1.20 |
| Total Households | 698 (100.0%) | 2.32 |
Household Size by Marriage Status in Murfreesboro
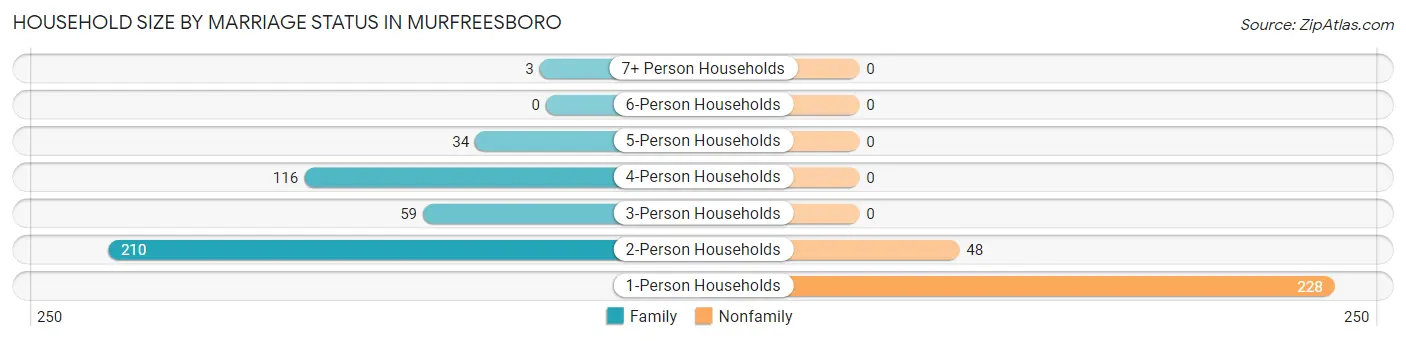
Out of a total of 698 households in Murfreesboro, 422 (60.5%) are family households, while 276 (39.5%) are nonfamily households. The most numerous type of family households are 2-person households, comprising 210, and the most common type of nonfamily households are 1-person households, comprising 228.
| Household Size | Family Households | Nonfamily Households |
| 1-Person Households | - | 228 (32.7%) |
| 2-Person Households | 210 (30.1%) | 48 (6.9%) |
| 3-Person Households | 59 (8.5%) | 0 (0.0%) |
| 4-Person Households | 116 (16.6%) | 0 (0.0%) |
| 5-Person Households | 34 (4.9%) | 0 (0.0%) |
| 6-Person Households | 0 (0.0%) | 0 (0.0%) |
| 7+ Person Households | 3 (0.4%) | 0 (0.0%) |
| Total | 422 (60.5%) | 276 (39.5%) |
Female Fertility in Murfreesboro
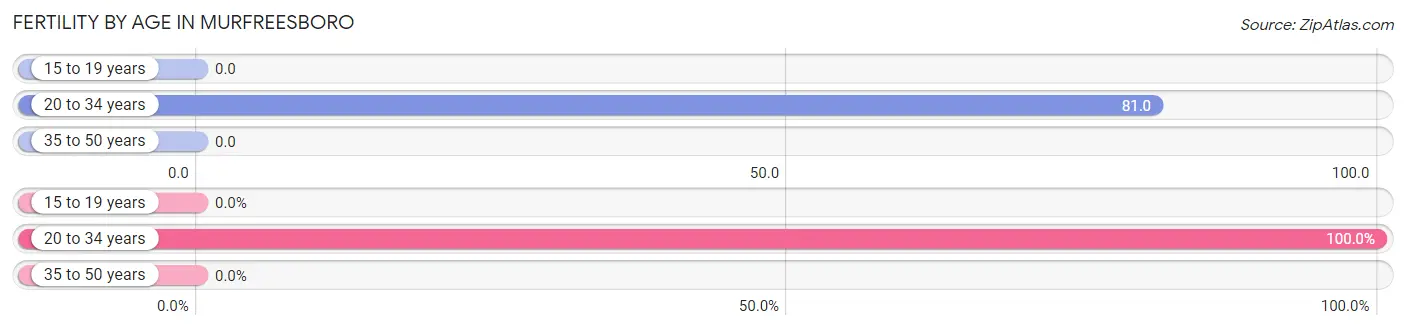
Fertility by Age in Murfreesboro
Average fertility rate in Murfreesboro is 25.0 births per 1,000 women. Women in the age bracket of 20 to 34 years have the highest fertility rate with 81.0 births per 1,000 women. Women in the age bracket of 20 to 34 years acount for 100.0% of all women with births.
| Age Bracket | Women with Births | Births / 1,000 Women |
| 15 to 19 years | 0 (0.0%) | 0.0 |
| 20 to 34 years | 8 (100.0%) | 81.0 |
| 35 to 50 years | 0 (0.0%) | 0.0 |
| Total | 8 (100.0%) | 25.0 |
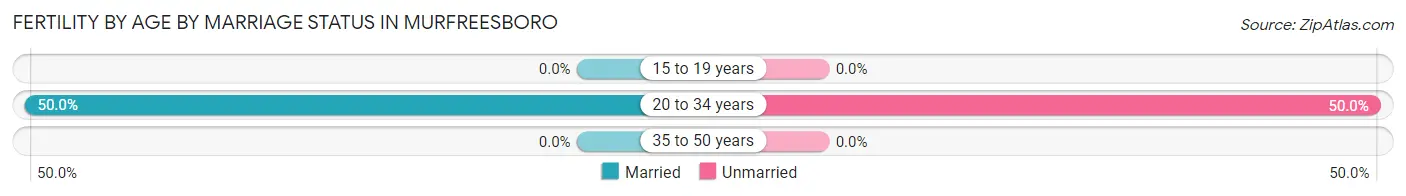
Fertility by Age by Marriage Status in Murfreesboro
50.0% of women with births (8) in Murfreesboro are married. The highest percentage of unmarried women with births falls into 20 to 34 years age bracket with 50.0% of them unmarried at the time of birth, while the lowest percentage of unmarried women with births belong to 20 to 34 years age bracket with 50.0% of them unmarried.
| Age Bracket | Married | Unmarried |
| 15 to 19 years | 0 (0.0%) | 0 (0.0%) |
| 20 to 34 years | 4 (50.0%) | 4 (50.0%) |
| 35 to 50 years | 0 (0.0%) | 0 (0.0%) |
| Total | 4 (50.0%) | 4 (50.0%) |
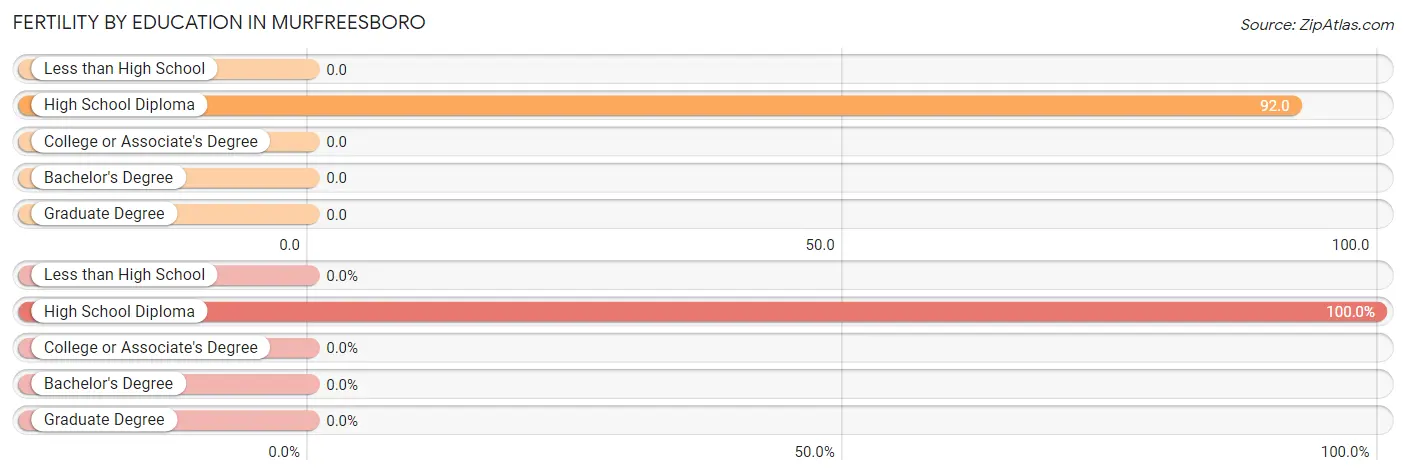
Fertility by Education in Murfreesboro
| Educational Attainment | Women with Births | Births / 1,000 Women |
| Less than High School | 0 (0.0%) | 0.0 |
| High School Diploma | 8 (100.0%) | 92.0 |
| College or Associate's Degree | 0 (0.0%) | 0.0 |
| Bachelor's Degree | 0 (0.0%) | 0.0 |
| Graduate Degree | 0 (0.0%) | 0.0 |
| Total | 8 (100.0%) | 25.0 |
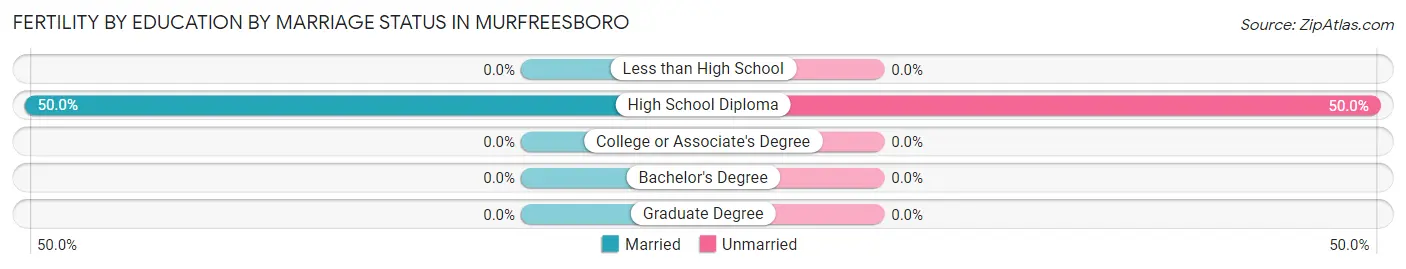
Fertility by Education by Marriage Status in Murfreesboro
50.0% of women with births in Murfreesboro are unmarried. Women with the educational attainment of high school diploma are most likely to be married with 50.0% of them married at childbirth, while women with the educational attainment of high school diploma are least likely to be married with 50.0% of them unmarried at childbirth.
| Educational Attainment | Married | Unmarried |
| Less than High School | 0 (0.0%) | 0 (0.0%) |
| High School Diploma | 4 (50.0%) | 4 (50.0%) |
| College or Associate's Degree | 0 (0.0%) | 0 (0.0%) |
| Bachelor's Degree | 0 (0.0%) | 0 (0.0%) |
| Graduate Degree | 0 (0.0%) | 0 (0.0%) |
| Total | 4 (50.0%) | 4 (50.0%) |
Income in Murfreesboro
Income Overview in Murfreesboro
Per Capita Income in Murfreesboro is $22,241, while median incomes of families and households are $58,810 and $37,206 respectively.
| Characteristic | Number | Measure |
| Per Capita Income | 1,703 | $22,241 |
| Median Family Income | 422 | $58,810 |
| Mean Family Income | 422 | $61,724 |
| Median Household Income | 698 | $37,206 |
| Mean Household Income | 698 | $49,565 |
| Income Deficit | 422 | $9,763 |
| Wage / Income Gap (%) | 1,703 | 46.59% |
| Wage / Income Gap ($) | 1,703 | 53.41¢ per $1 |
| Gini / Inequality Index | 1,703 | 0.45 |
Earnings by Sex in Murfreesboro
Average Earnings in Murfreesboro are $28,421, $41,419 for men and $22,121 for women, a difference of 46.6%.
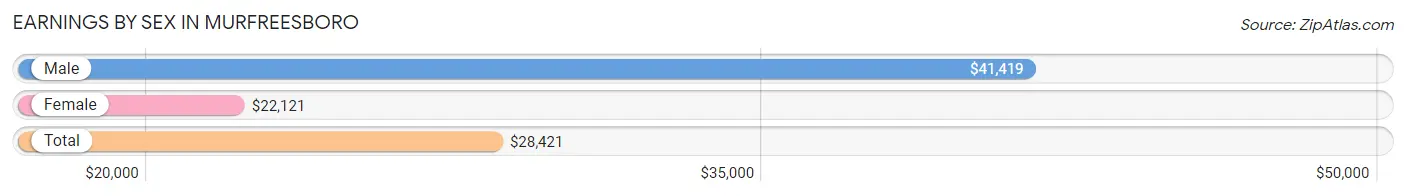
| Sex | Number | Average Earnings |
| Male | 356 (47.7%) | $41,419 |
| Female | 390 (52.3%) | $22,121 |
| Total | 746 (100.0%) | $28,421 |
Earnings by Sex by Income Bracket in Murfreesboro
The most common earnings brackets in Murfreesboro are $40,000 to $44,999 for men (53 | 14.9%) and $55,000 to $64,999 for women (53 | 13.6%).
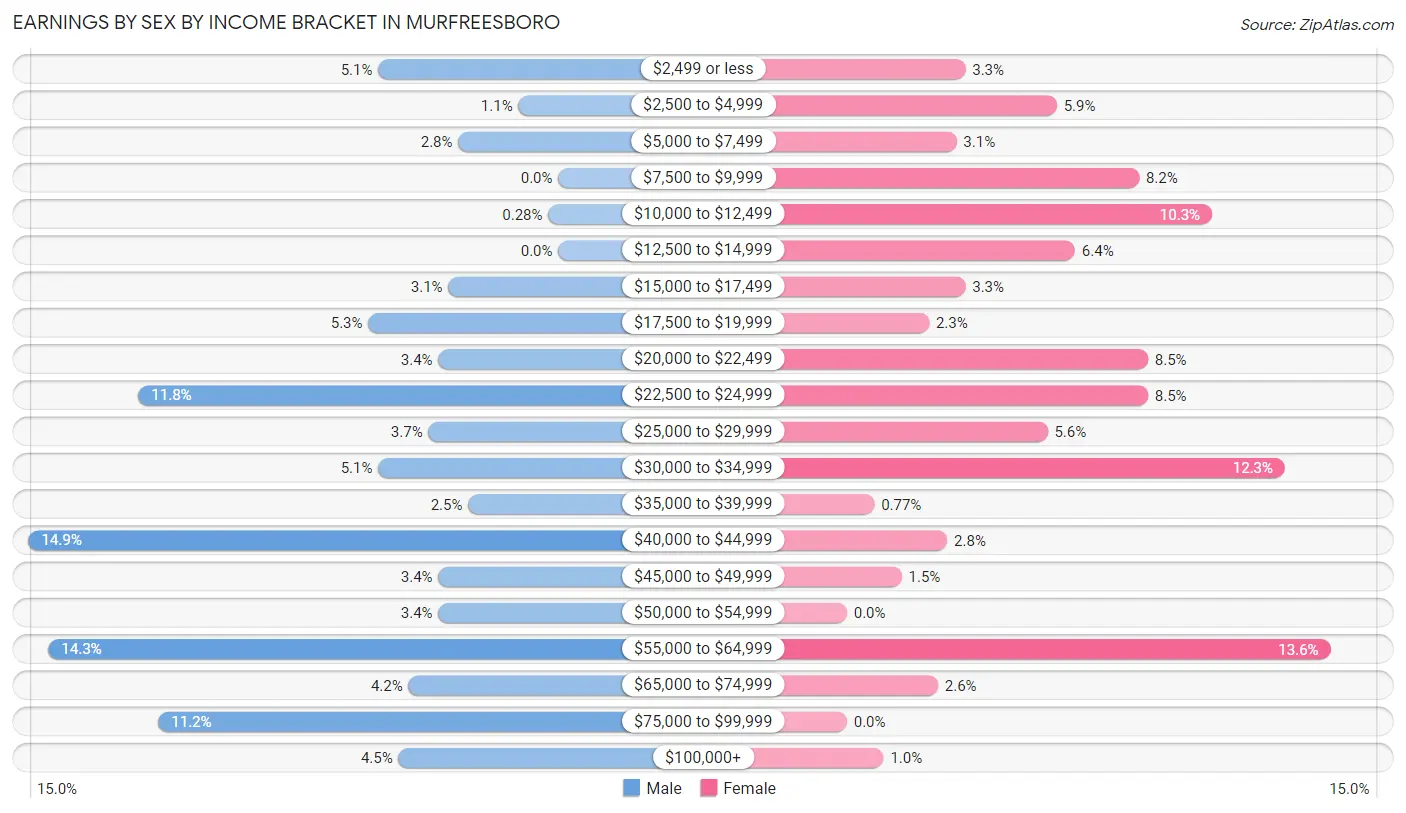
| Income | Male | Female |
| $2,499 or less | 18 (5.1%) | 13 (3.3%) |
| $2,500 to $4,999 | 4 (1.1%) | 23 (5.9%) |
| $5,000 to $7,499 | 10 (2.8%) | 12 (3.1%) |
| $7,500 to $9,999 | 0 (0.0%) | 32 (8.2%) |
| $10,000 to $12,499 | 1 (0.3%) | 40 (10.3%) |
| $12,500 to $14,999 | 0 (0.0%) | 25 (6.4%) |
| $15,000 to $17,499 | 11 (3.1%) | 13 (3.3%) |
| $17,500 to $19,999 | 19 (5.3%) | 9 (2.3%) |
| $20,000 to $22,499 | 12 (3.4%) | 33 (8.5%) |
| $22,500 to $24,999 | 42 (11.8%) | 33 (8.5%) |
| $25,000 to $29,999 | 13 (3.6%) | 22 (5.6%) |
| $30,000 to $34,999 | 18 (5.1%) | 48 (12.3%) |
| $35,000 to $39,999 | 9 (2.5%) | 3 (0.8%) |
| $40,000 to $44,999 | 53 (14.9%) | 11 (2.8%) |
| $45,000 to $49,999 | 12 (3.4%) | 6 (1.5%) |
| $50,000 to $54,999 | 12 (3.4%) | 0 (0.0%) |
| $55,000 to $64,999 | 51 (14.3%) | 53 (13.6%) |
| $65,000 to $74,999 | 15 (4.2%) | 10 (2.6%) |
| $75,000 to $99,999 | 40 (11.2%) | 0 (0.0%) |
| $100,000+ | 16 (4.5%) | 4 (1.0%) |
| Total | 356 (100.0%) | 390 (100.0%) |
Earnings by Sex by Educational Attainment in Murfreesboro
Average earnings in Murfreesboro are $43,984 for men and $23,500 for women, a difference of 46.6%. Men with an educational attainment of college or associate's degree enjoy the highest average annual earnings of $51,667, while those with less than high school education earn the least with $31,750. Women with an educational attainment of high school diploma earn the most with the average annual earnings of $26,875, while those with bachelor's degree education have the smallest earnings of $11,838.
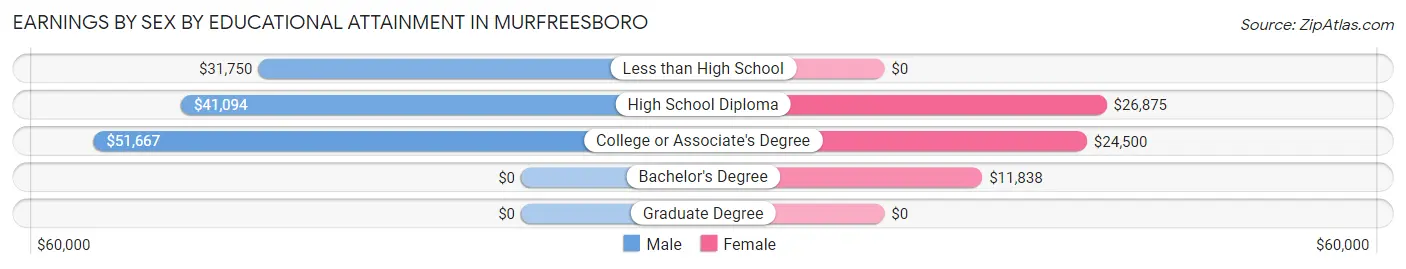
| Educational Attainment | Male Income | Female Income |
| Less than High School | $31,750 | $0 |
| High School Diploma | $41,094 | $26,875 |
| College or Associate's Degree | $51,667 | $24,500 |
| Bachelor's Degree | - | - |
| Graduate Degree | - | - |
| Total | $43,984 | $23,500 |
Family Income in Murfreesboro
Family Income Brackets in Murfreesboro
According to the Murfreesboro family income data, there are 88 families falling into the $75,000 to $99,999 income range, which is the most common income bracket and makes up 20.8% of all families.
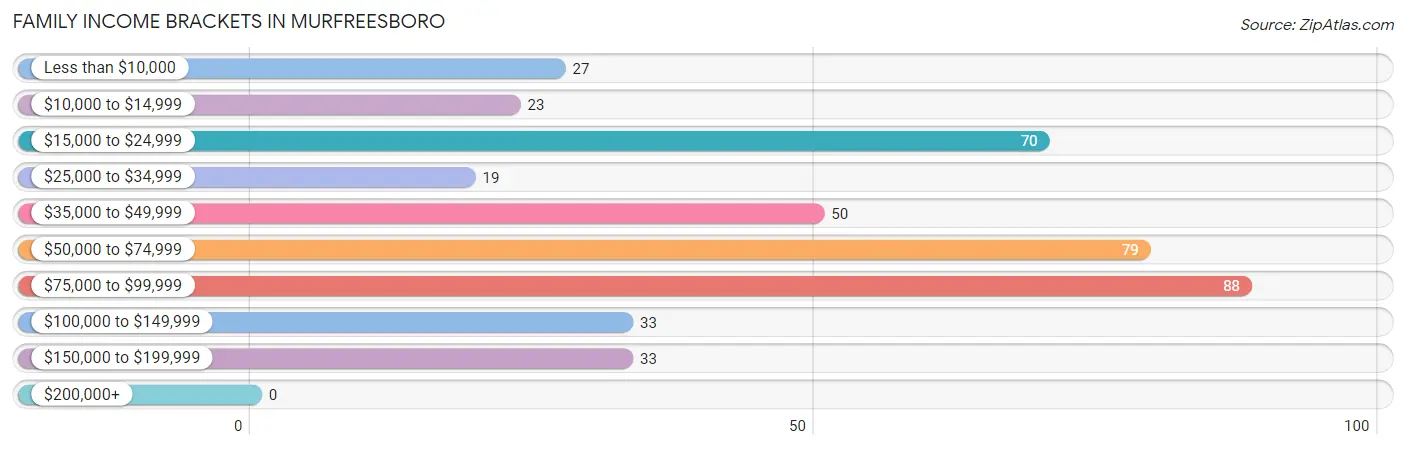
| Income Bracket | # Families | % Families |
| Less than $10,000 | 27 | 6.4% |
| $10,000 to $14,999 | 23 | 5.5% |
| $15,000 to $24,999 | 70 | 16.6% |
| $25,000 to $34,999 | 19 | 4.5% |
| $35,000 to $49,999 | 50 | 11.8% |
| $50,000 to $74,999 | 79 | 18.7% |
| $75,000 to $99,999 | 88 | 20.9% |
| $100,000 to $149,999 | 33 | 7.8% |
| $150,000 to $199,999 | 33 | 7.8% |
| $200,000+ | 0 | 0.0% |
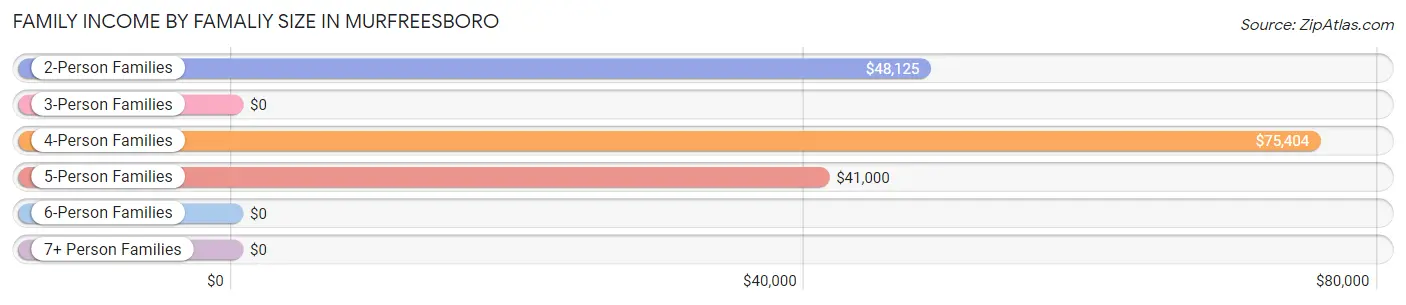
Family Income by Famaliy Size in Murfreesboro
4-person families (111 | 26.3%) account for the highest median family income in Murfreesboro with $75,404 per family, while 2-person families (221 | 52.4%) have the highest median income of $24,062 per family member.
| Income Bracket | # Families | Median Income |
| 2-Person Families | 221 (52.4%) | $48,125 |
| 3-Person Families | 57 (13.5%) | $0 |
| 4-Person Families | 111 (26.3%) | $75,404 |
| 5-Person Families | 30 (7.1%) | $41,000 |
| 6-Person Families | 0 (0.0%) | $0 |
| 7+ Person Families | 3 (0.7%) | $0 |
| Total | 422 (100.0%) | $58,810 |
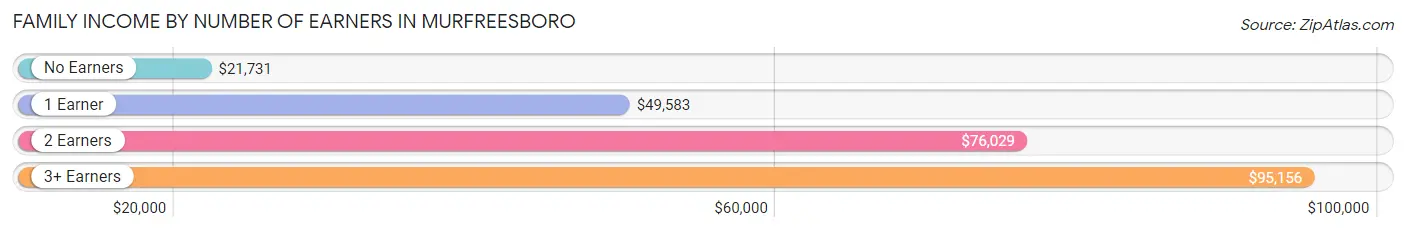
Family Income by Number of Earners in Murfreesboro
The median family income in Murfreesboro is $58,810, with families comprising 3+ earners (19) having the highest median family income of $95,156, while families with no earners (68) have the lowest median family income of $21,731, accounting for 4.5% and 16.1% of families, respectively.
| Number of Earners | # Families | Median Income |
| No Earners | 68 (16.1%) | $21,731 |
| 1 Earner | 195 (46.2%) | $49,583 |
| 2 Earners | 140 (33.2%) | $76,029 |
| 3+ Earners | 19 (4.5%) | $95,156 |
| Total | 422 (100.0%) | $58,810 |
Household Income in Murfreesboro
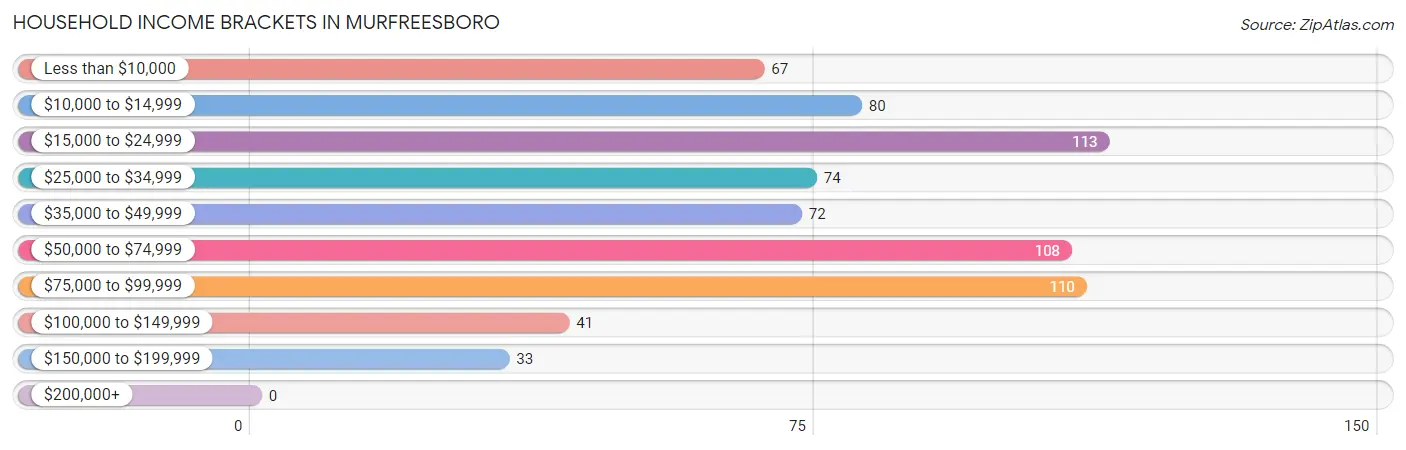
Household Income Brackets in Murfreesboro
With 113 households falling in the category, the $15,000 to $24,999 income range is the most frequent in Murfreesboro, accounting for 16.2% of all households.
| Income Bracket | # Households | % Households |
| Less than $10,000 | 67 | 9.6% |
| $10,000 to $14,999 | 80 | 11.5% |
| $15,000 to $24,999 | 113 | 16.2% |
| $25,000 to $34,999 | 74 | 10.6% |
| $35,000 to $49,999 | 72 | 10.3% |
| $50,000 to $74,999 | 108 | 15.5% |
| $75,000 to $99,999 | 110 | 15.8% |
| $100,000 to $149,999 | 41 | 5.9% |
| $150,000 to $199,999 | 33 | 4.7% |
| $200,000+ | 0 | 0.0% |
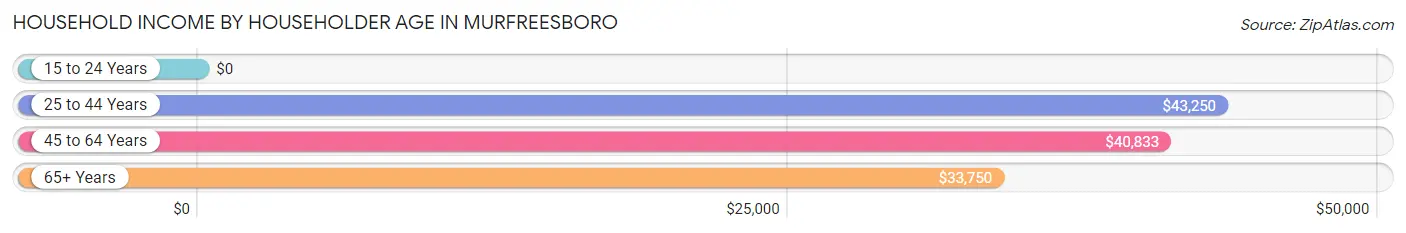
Household Income by Householder Age in Murfreesboro
The median household income in Murfreesboro is $37,206, with the highest median household income of $43,250 found in the 25 to 44 years age bracket for the primary householder. A total of 181 households (25.9%) fall into this category. Meanwhile, the 15 to 24 years age bracket for the primary householder has the lowest median household income of $0, with 19 households (2.7%) in this group.
| Income Bracket | # Households | Median Income |
| 15 to 24 Years | 19 (2.7%) | $0 |
| 25 to 44 Years | 181 (25.9%) | $43,250 |
| 45 to 64 Years | 280 (40.1%) | $40,833 |
| 65+ Years | 218 (31.2%) | $33,750 |
| Total | 698 (100.0%) | $37,206 |
Poverty in Murfreesboro
Income Below Poverty by Sex and Age in Murfreesboro
With 24.6% poverty level for males and 32.9% for females among the residents of Murfreesboro, 35 to 44 year old males and 12 to 14 year old females are the most vulnerable to poverty, with 66 males (55.9%) and 65 females (90.3%) in their respective age groups living below the poverty level.
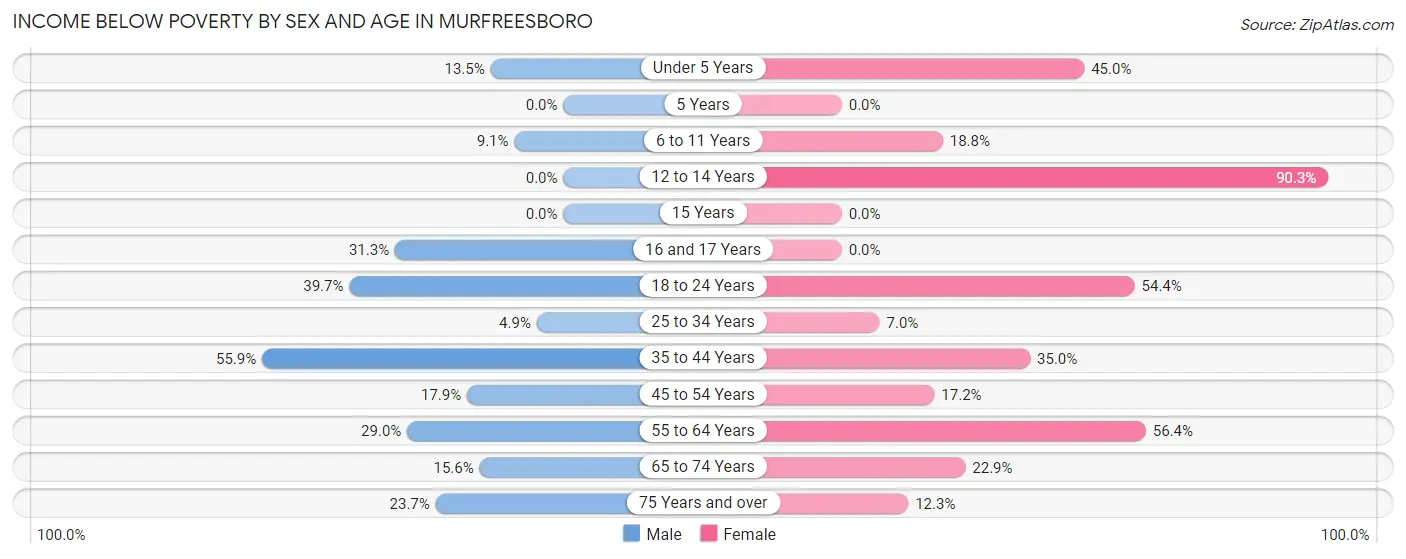
| Age Bracket | Male | Female |
| Under 5 Years | 5 (13.5%) | 9 (45.0%) |
| 5 Years | 0 (0.0%) | 0 (0.0%) |
| 6 to 11 Years | 8 (9.1%) | 15 (18.8%) |
| 12 to 14 Years | 0 (0.0%) | 65 (90.3%) |
| 15 Years | 0 (0.0%) | 0 (0.0%) |
| 16 and 17 Years | 10 (31.2%) | 0 (0.0%) |
| 18 to 24 Years | 29 (39.7%) | 25 (54.3%) |
| 25 to 34 Years | 4 (4.9%) | 4 (7.0%) |
| 35 to 44 Years | 66 (55.9%) | 36 (34.9%) |
| 45 to 54 Years | 27 (17.9%) | 22 (17.2%) |
| 55 to 64 Years | 20 (29.0%) | 57 (56.4%) |
| 65 to 74 Years | 7 (15.6%) | 25 (22.9%) |
| 75 Years and over | 23 (23.7%) | 9 (12.3%) |
| Total | 199 (24.6%) | 267 (32.9%) |
Income Above Poverty by Sex and Age in Murfreesboro
According to the poverty statistics in Murfreesboro, males aged 5 years and females aged 5 years are the age groups that are most secure financially, with 100.0% of males and 100.0% of females in these age groups living above the poverty line.
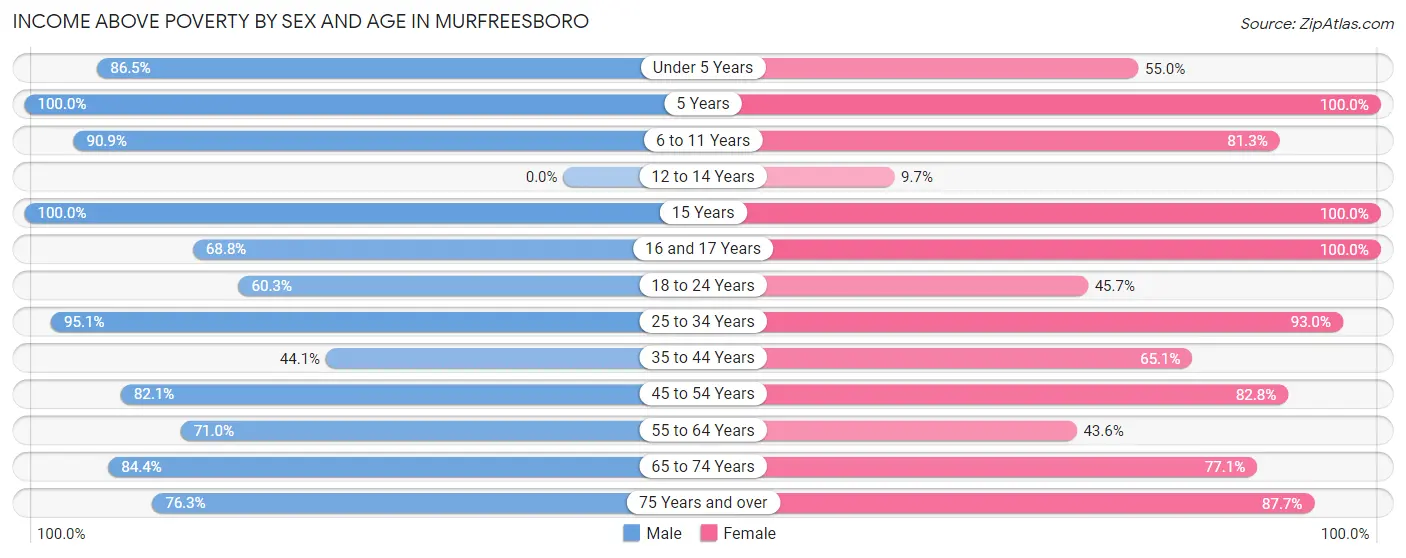
| Age Bracket | Male | Female |
| Under 5 Years | 32 (86.5%) | 11 (55.0%) |
| 5 Years | 15 (100.0%) | 10 (100.0%) |
| 6 to 11 Years | 80 (90.9%) | 65 (81.2%) |
| 12 to 14 Years | 0 (0.0%) | 7 (9.7%) |
| 15 Years | 4 (100.0%) | 6 (100.0%) |
| 16 and 17 Years | 22 (68.8%) | 7 (100.0%) |
| 18 to 24 Years | 44 (60.3%) | 21 (45.7%) |
| 25 to 34 Years | 77 (95.1%) | 53 (93.0%) |
| 35 to 44 Years | 52 (44.1%) | 67 (65.0%) |
| 45 to 54 Years | 124 (82.1%) | 106 (82.8%) |
| 55 to 64 Years | 49 (71.0%) | 44 (43.6%) |
| 65 to 74 Years | 38 (84.4%) | 84 (77.1%) |
| 75 Years and over | 74 (76.3%) | 64 (87.7%) |
| Total | 611 (75.4%) | 545 (67.1%) |
Income Below Poverty Among Married-Couple Families in Murfreesboro
The poverty statistics for married-couple families in Murfreesboro show that 16.0% or 48 of the total 301 families live below the poverty line. Families with 3 or 4 children have the highest poverty rate of 39.4%, comprising of 13 families. On the other hand, families with no children have the lowest poverty rate of 7.3%, which includes 11 families.
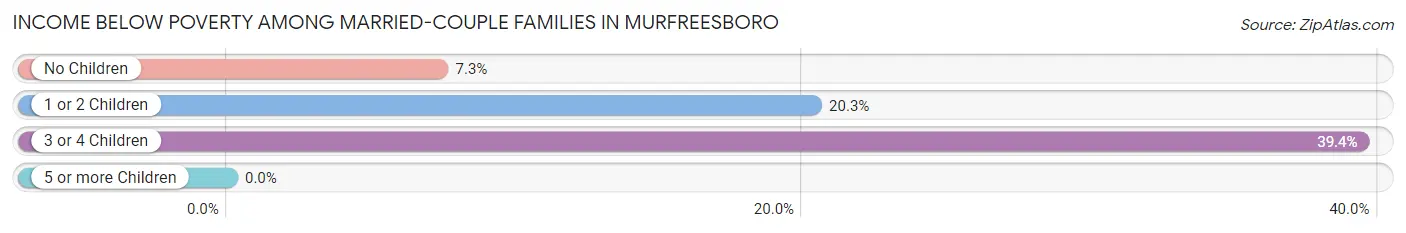
| Children | Above Poverty | Below Poverty |
| No Children | 139 (92.7%) | 11 (7.3%) |
| 1 or 2 Children | 94 (79.7%) | 24 (20.3%) |
| 3 or 4 Children | 20 (60.6%) | 13 (39.4%) |
| 5 or more Children | 0 (0.0%) | 0 (0.0%) |
| Total | 253 (84.1%) | 48 (16.0%) |
Income Below Poverty Among Single-Parent Households in Murfreesboro
According to the poverty data in Murfreesboro, 37.9% or 22 single-father households and 44.4% or 28 single-mother households are living below the poverty line. Among single-father households, those with 1 or 2 children have the highest poverty rate, with 22 households (78.6%) experiencing poverty. Likewise, among single-mother households, those with no children have the highest poverty rate, with 11 households (47.8%) falling below the poverty line.
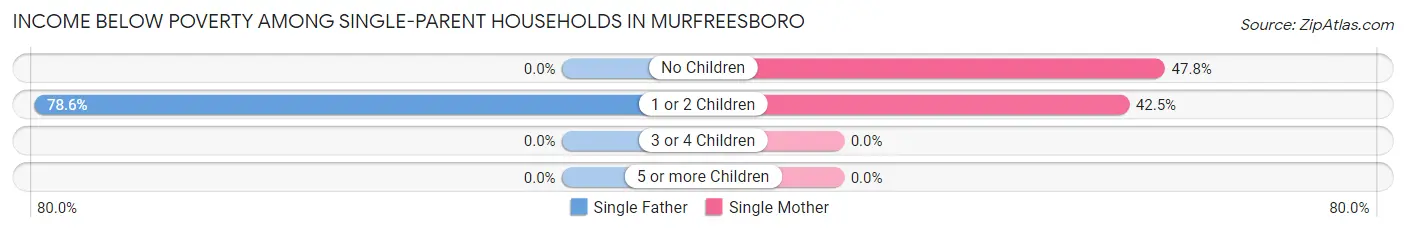
| Children | Single Father | Single Mother |
| No Children | 0 (0.0%) | 11 (47.8%) |
| 1 or 2 Children | 22 (78.6%) | 17 (42.5%) |
| 3 or 4 Children | 0 (0.0%) | 0 (0.0%) |
| 5 or more Children | 0 (0.0%) | 0 (0.0%) |
| Total | 22 (37.9%) | 28 (44.4%) |
Income Below Poverty Among Married-Couple vs Single-Parent Households in Murfreesboro
The poverty data for Murfreesboro shows that 48 of the married-couple family households (16.0%) and 50 of the single-parent households (41.3%) are living below the poverty level. Within the married-couple family households, those with 3 or 4 children have the highest poverty rate, with 13 households (39.4%) falling below the poverty line. Among the single-parent households, those with 1 or 2 children have the highest poverty rate, with 39 household (57.4%) living below poverty.
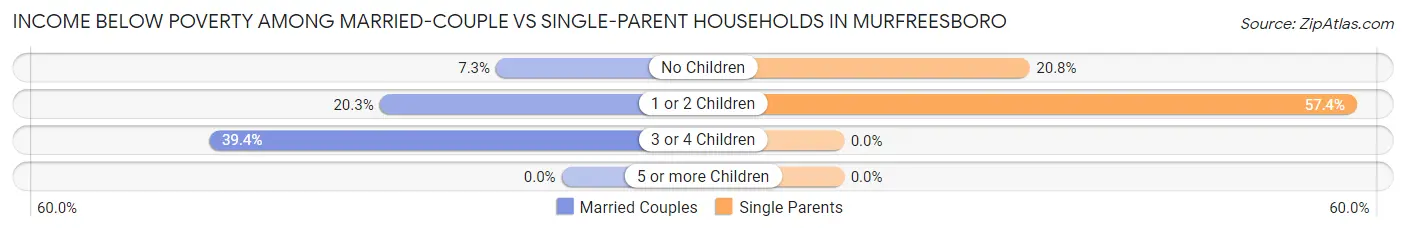
| Children | Married-Couple Families | Single-Parent Households |
| No Children | 11 (7.3%) | 11 (20.7%) |
| 1 or 2 Children | 24 (20.3%) | 39 (57.4%) |
| 3 or 4 Children | 13 (39.4%) | 0 (0.0%) |
| 5 or more Children | 0 (0.0%) | 0 (0.0%) |
| Total | 48 (16.0%) | 50 (41.3%) |
Employment Characteristics in Murfreesboro
Employment by Class of Employer in Murfreesboro
Among the 694 employed individuals in Murfreesboro, private company employees (473 | 68.2%), state government employees (100 | 14.4%), and not-for-profit organizations (39 | 5.6%) make up the most common classes of employment.
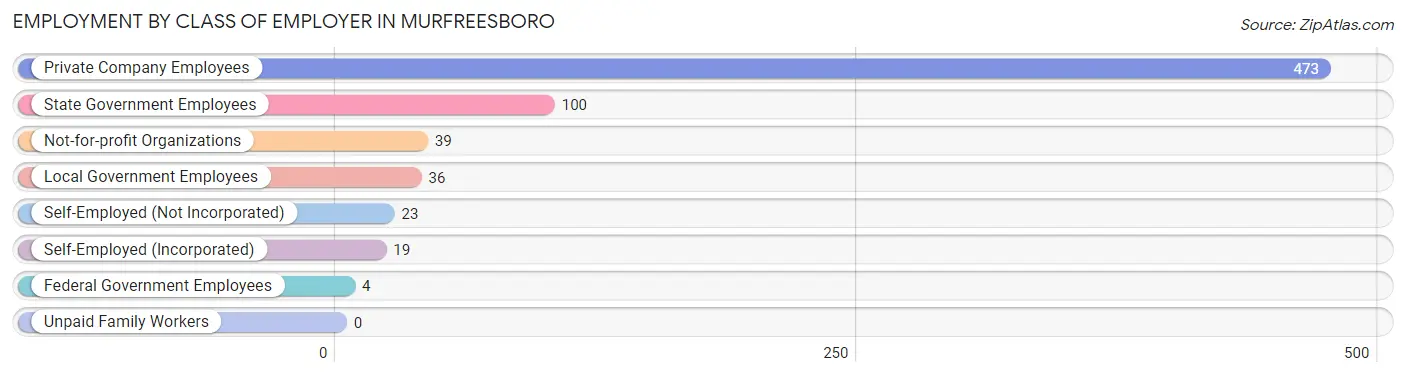
| Employer Class | # Employees | % Employees |
| Private Company Employees | 473 | 68.2% |
| Self-Employed (Incorporated) | 19 | 2.7% |
| Self-Employed (Not Incorporated) | 23 | 3.3% |
| Not-for-profit Organizations | 39 | 5.6% |
| Local Government Employees | 36 | 5.2% |
| State Government Employees | 100 | 14.4% |
| Federal Government Employees | 4 | 0.6% |
| Unpaid Family Workers | 0 | 0.0% |
| Total | 694 | 100.0% |
Employment Status by Age in Murfreesboro
According to the labor force statistics for Murfreesboro, out of the total population over 16 years of age (1,371), 54.5% or 747 individuals are in the labor force, with 7.1% or 53 of them unemployed. The age group with the highest labor force participation rate is 25 to 29 years, with 88.7% or 102 individuals in the labor force. Within the labor force, the 16 to 19 years age range has the highest percentage of unemployed individuals, with 73.3% or 33 of them being unemployed.
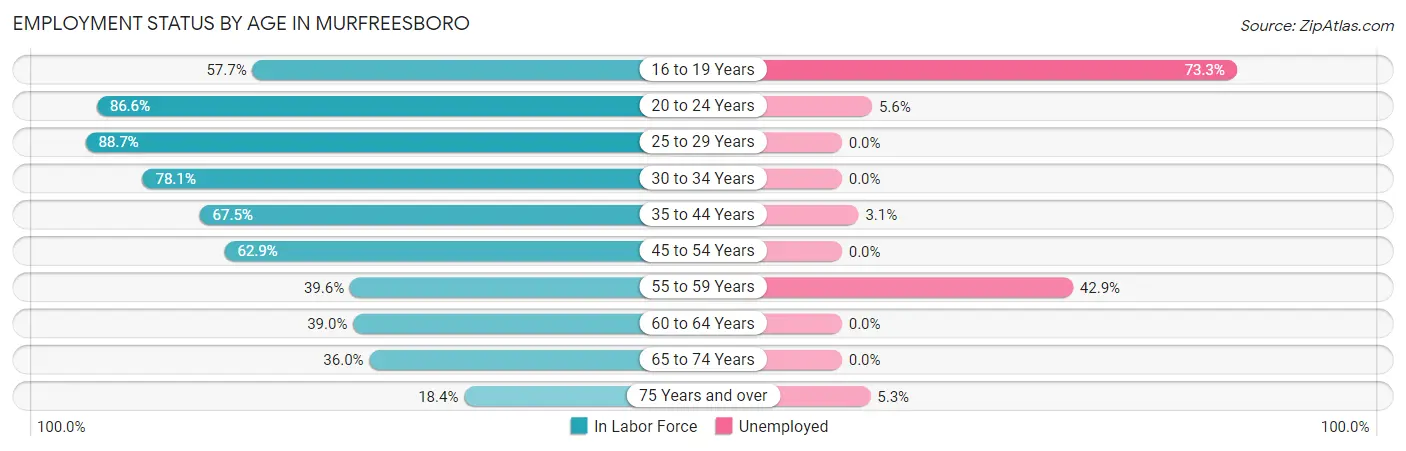
| Age Bracket | In Labor Force | Unemployed |
| 16 to 19 Years | 45 (57.7%) | 33 (73.3%) |
| 20 to 24 Years | 71 (86.6%) | 4 (5.6%) |
| 25 to 29 Years | 102 (88.7%) | 0 (0.0%) |
| 30 to 34 Years | 25 (78.1%) | 0 (0.0%) |
| 35 to 44 Years | 160 (67.5%) | 5 (3.1%) |
| 45 to 54 Years | 180 (62.9%) | 0 (0.0%) |
| 55 to 59 Years | 21 (39.6%) | 9 (42.9%) |
| 60 to 64 Years | 46 (39.0%) | 0 (0.0%) |
| 65 to 74 Years | 59 (36.0%) | 0 (0.0%) |
| 75 Years and over | 38 (18.4%) | 2 (5.3%) |
| Total | 747 (54.5%) | 53 (7.1%) |
Employment Status by Educational Attainment in Murfreesboro
According to labor force statistics for Murfreesboro, 63.5% of individuals (534) out of the total population between 25 and 64 years of age (841) are in the labor force, with 2.6% or 14 of them being unemployed. The group with the highest labor force participation rate are those with the educational attainment of bachelor's degree or higher, with 86.9% or 133 individuals in the labor force. Within the labor force, individuals with less than high school education have the highest percentage of unemployment, with 12.2% or 5 of them being unemployed.
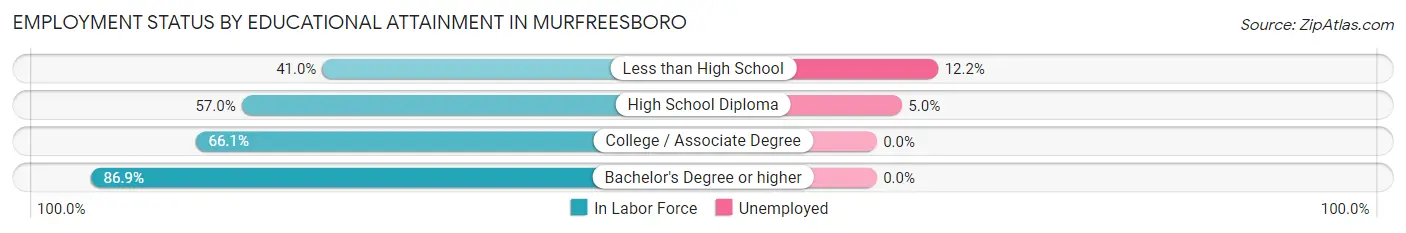
| Educational Attainment | In Labor Force | Unemployed |
| Less than High School | 41 (41.0%) | 12 (12.2%) |
| High School Diploma | 179 (57.0%) | 16 (5.0%) |
| College / Associate Degree | 181 (66.1%) | 0 (0.0%) |
| Bachelor's Degree or higher | 133 (86.9%) | 0 (0.0%) |
| Total | 534 (63.5%) | 22 (2.6%) |
Employment Occupations by Sex in Murfreesboro
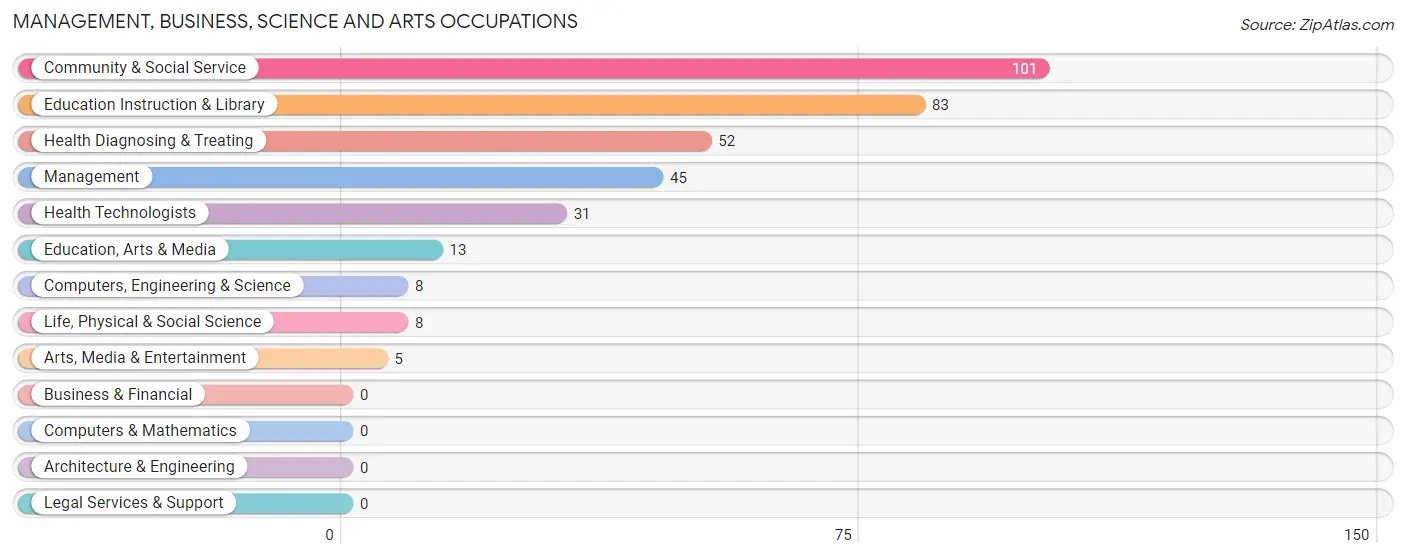
Management, Business, Science and Arts Occupations
The most common Management, Business, Science and Arts occupations in Murfreesboro are Community & Social Service (101 | 14.5%), Education Instruction & Library (83 | 12.0%), Health Diagnosing & Treating (52 | 7.5%), Management (45 | 6.5%), and Health Technologists (31 | 4.5%).
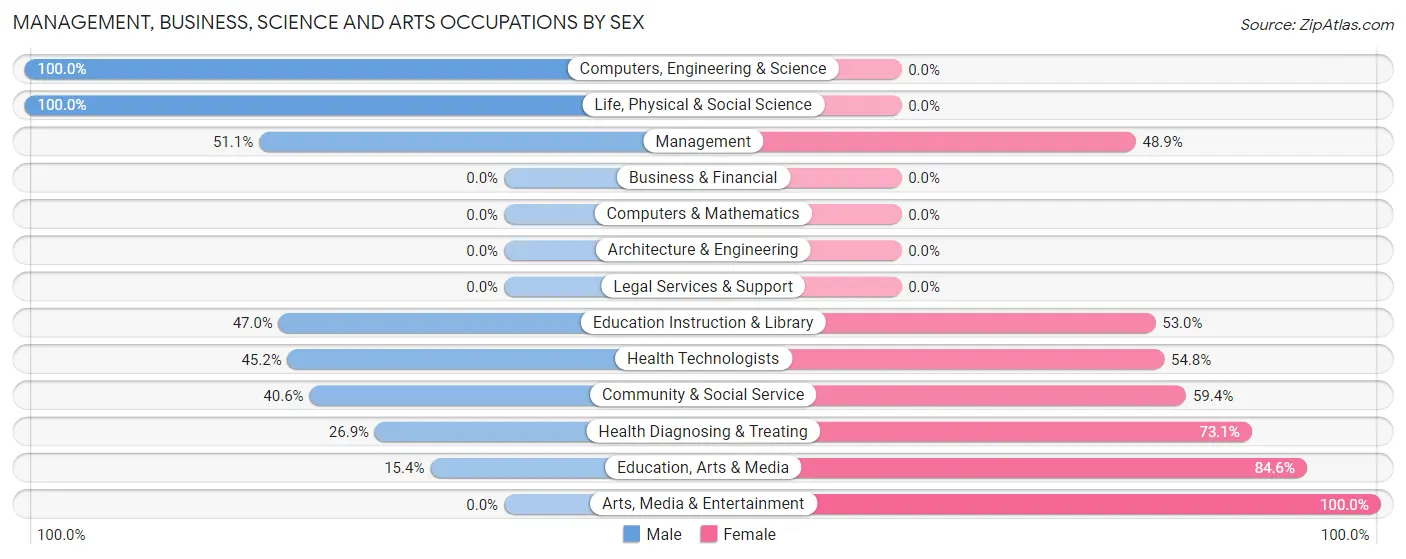
Management, Business, Science and Arts Occupations by Sex
Within the Management, Business, Science and Arts occupations in Murfreesboro, the most male-oriented occupations are Computers, Engineering & Science (100.0%), Life, Physical & Social Science (100.0%), and Management (51.1%), while the most female-oriented occupations are Arts, Media & Entertainment (100.0%), Education, Arts & Media (84.6%), and Health Diagnosing & Treating (73.1%).
| Occupation | Male | Female |
| Management | 23 (51.1%) | 22 (48.9%) |
| Business & Financial | 0 (0.0%) | 0 (0.0%) |
| Computers, Engineering & Science | 8 (100.0%) | 0 (0.0%) |
| Computers & Mathematics | 0 (0.0%) | 0 (0.0%) |
| Architecture & Engineering | 0 (0.0%) | 0 (0.0%) |
| Life, Physical & Social Science | 8 (100.0%) | 0 (0.0%) |
| Community & Social Service | 41 (40.6%) | 60 (59.4%) |
| Education, Arts & Media | 2 (15.4%) | 11 (84.6%) |
| Legal Services & Support | 0 (0.0%) | 0 (0.0%) |
| Education Instruction & Library | 39 (47.0%) | 44 (53.0%) |
| Arts, Media & Entertainment | 0 (0.0%) | 5 (100.0%) |
| Health Diagnosing & Treating | 14 (26.9%) | 38 (73.1%) |
| Health Technologists | 14 (45.2%) | 17 (54.8%) |
| Total (Category) | 86 (41.7%) | 120 (58.3%) |
| Total (Overall) | 322 (46.4%) | 372 (53.6%) |
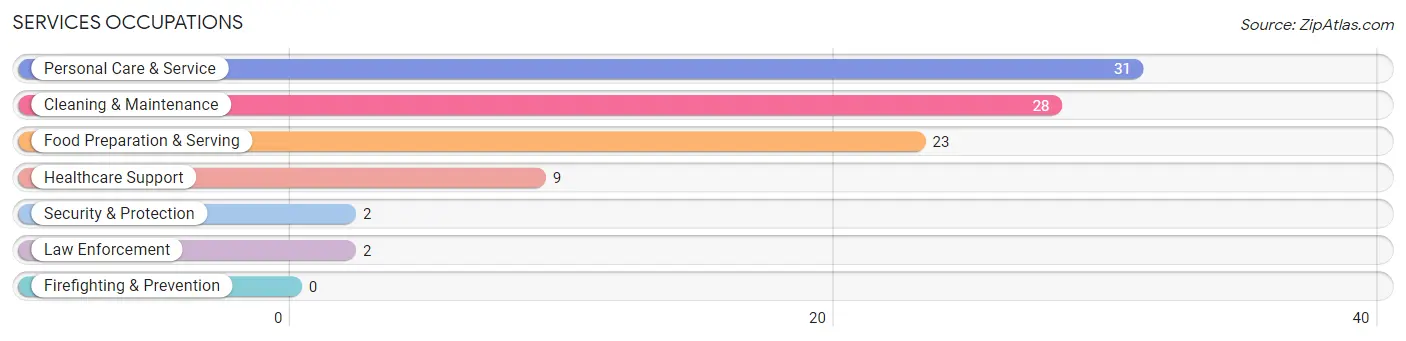
Services Occupations
The most common Services occupations in Murfreesboro are Personal Care & Service (31 | 4.5%), Cleaning & Maintenance (28 | 4.0%), Food Preparation & Serving (23 | 3.3%), Healthcare Support (9 | 1.3%), and Security & Protection (2 | 0.3%).
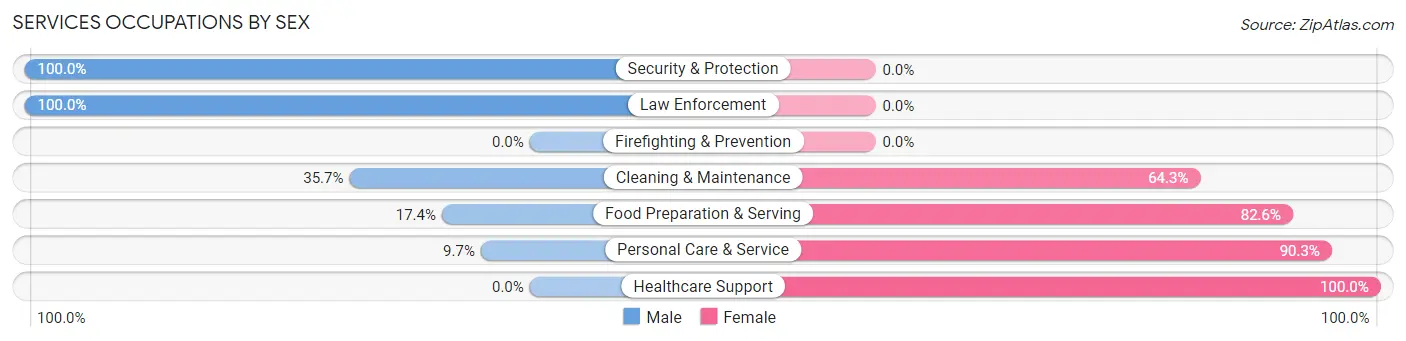
Services Occupations by Sex
Within the Services occupations in Murfreesboro, the most male-oriented occupations are Security & Protection (100.0%), Law Enforcement (100.0%), and Cleaning & Maintenance (35.7%), while the most female-oriented occupations are Healthcare Support (100.0%), Personal Care & Service (90.3%), and Food Preparation & Serving (82.6%).
| Occupation | Male | Female |
| Healthcare Support | 0 (0.0%) | 9 (100.0%) |
| Security & Protection | 2 (100.0%) | 0 (0.0%) |
| Firefighting & Prevention | 0 (0.0%) | 0 (0.0%) |
| Law Enforcement | 2 (100.0%) | 0 (0.0%) |
| Food Preparation & Serving | 4 (17.4%) | 19 (82.6%) |
| Cleaning & Maintenance | 10 (35.7%) | 18 (64.3%) |
| Personal Care & Service | 3 (9.7%) | 28 (90.3%) |
| Total (Category) | 19 (20.4%) | 74 (79.6%) |
| Total (Overall) | 322 (46.4%) | 372 (53.6%) |
Sales and Office Occupations
The most common Sales and Office occupations in Murfreesboro are Office & Administration (130 | 18.7%), and Sales & Related (109 | 15.7%).

Sales and Office Occupations by Sex

| Occupation | Male | Female |
| Sales & Related | 52 (47.7%) | 57 (52.3%) |
| Office & Administration | 21 (16.2%) | 109 (83.9%) |
| Total (Category) | 73 (30.5%) | 166 (69.5%) |
| Total (Overall) | 322 (46.4%) | 372 (53.6%) |
Natural Resources, Construction and Maintenance Occupations
The most common Natural Resources, Construction and Maintenance occupations in Murfreesboro are Construction & Extraction (33 | 4.8%), Farming, Fishing & Forestry (8 | 1.1%), and Installation, Maintenance & Repair (3 | 0.4%).
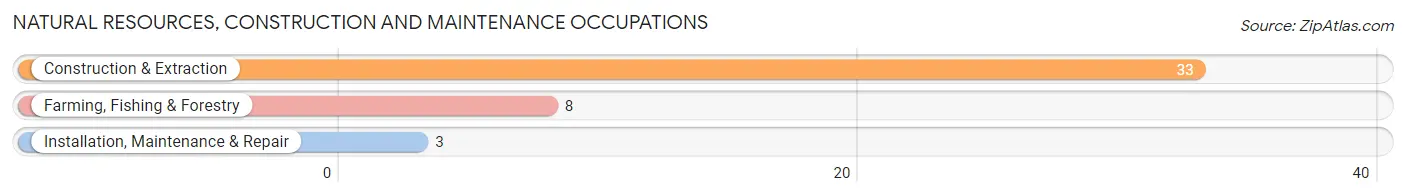
Natural Resources, Construction and Maintenance Occupations by Sex

| Occupation | Male | Female |
| Farming, Fishing & Forestry | 8 (100.0%) | 0 (0.0%) |
| Construction & Extraction | 33 (100.0%) | 0 (0.0%) |
| Installation, Maintenance & Repair | 3 (100.0%) | 0 (0.0%) |
| Total (Category) | 44 (100.0%) | 0 (0.0%) |
| Total (Overall) | 322 (46.4%) | 372 (53.6%) |
Production, Transportation and Moving Occupations
The most common Production, Transportation and Moving occupations in Murfreesboro are Production (55 | 7.9%), Transportation (34 | 4.9%), and Material Moving (23 | 3.3%).
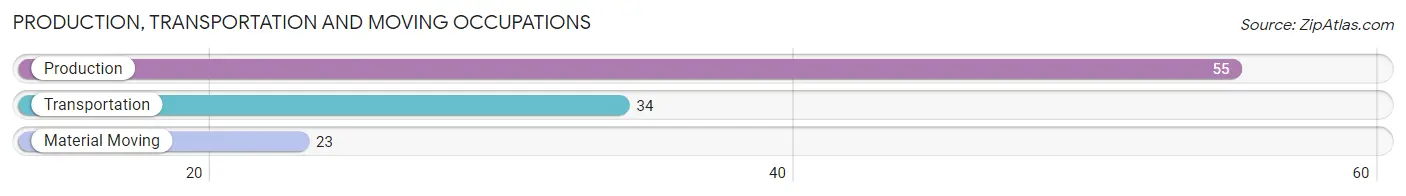
Production, Transportation and Moving Occupations by Sex
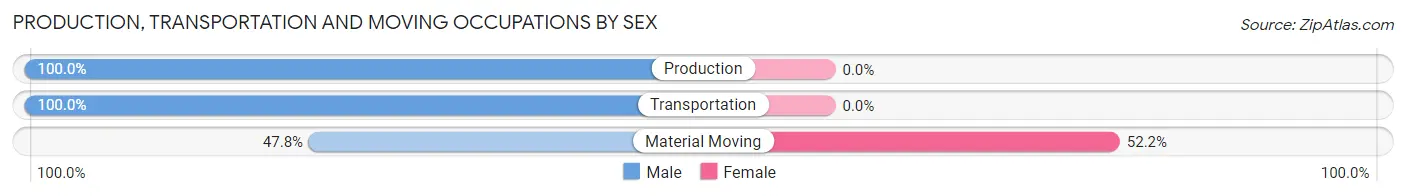
| Occupation | Male | Female |
| Production | 55 (100.0%) | 0 (0.0%) |
| Transportation | 34 (100.0%) | 0 (0.0%) |
| Material Moving | 11 (47.8%) | 12 (52.2%) |
| Total (Category) | 100 (89.3%) | 12 (10.7%) |
| Total (Overall) | 322 (46.4%) | 372 (53.6%) |
Employment Industries by Sex in Murfreesboro
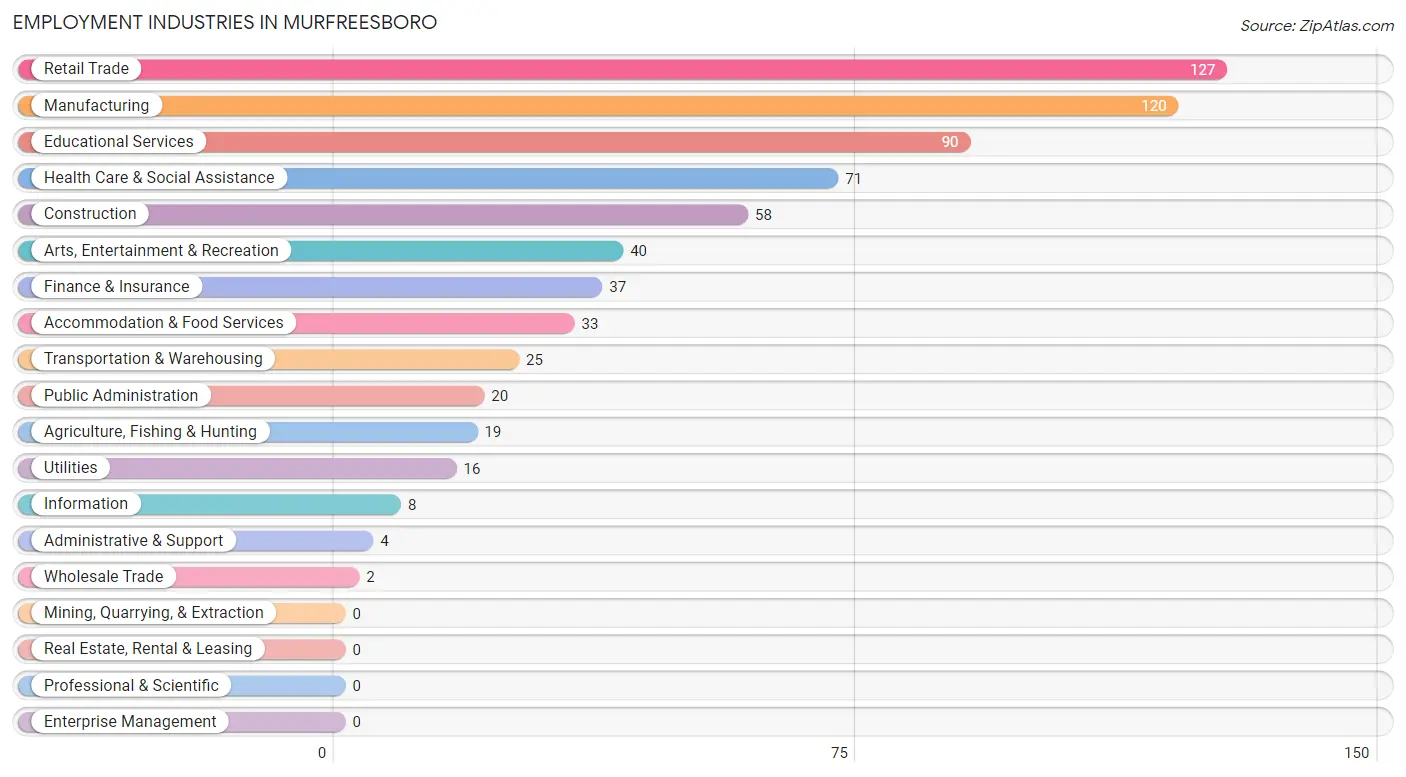
Employment Industries in Murfreesboro
The major employment industries in Murfreesboro include Retail Trade (127 | 18.3%), Manufacturing (120 | 17.3%), Educational Services (90 | 13.0%), Health Care & Social Assistance (71 | 10.2%), and Construction (58 | 8.4%).
Employment Industries by Sex in Murfreesboro
The Murfreesboro industries that see more men than women are Agriculture, Fishing & Hunting (100.0%), Wholesale Trade (100.0%), and Transportation & Warehousing (100.0%), whereas the industries that tend to have a higher number of women are Information (100.0%), Administrative & Support (100.0%), and Public Administration (90.0%).
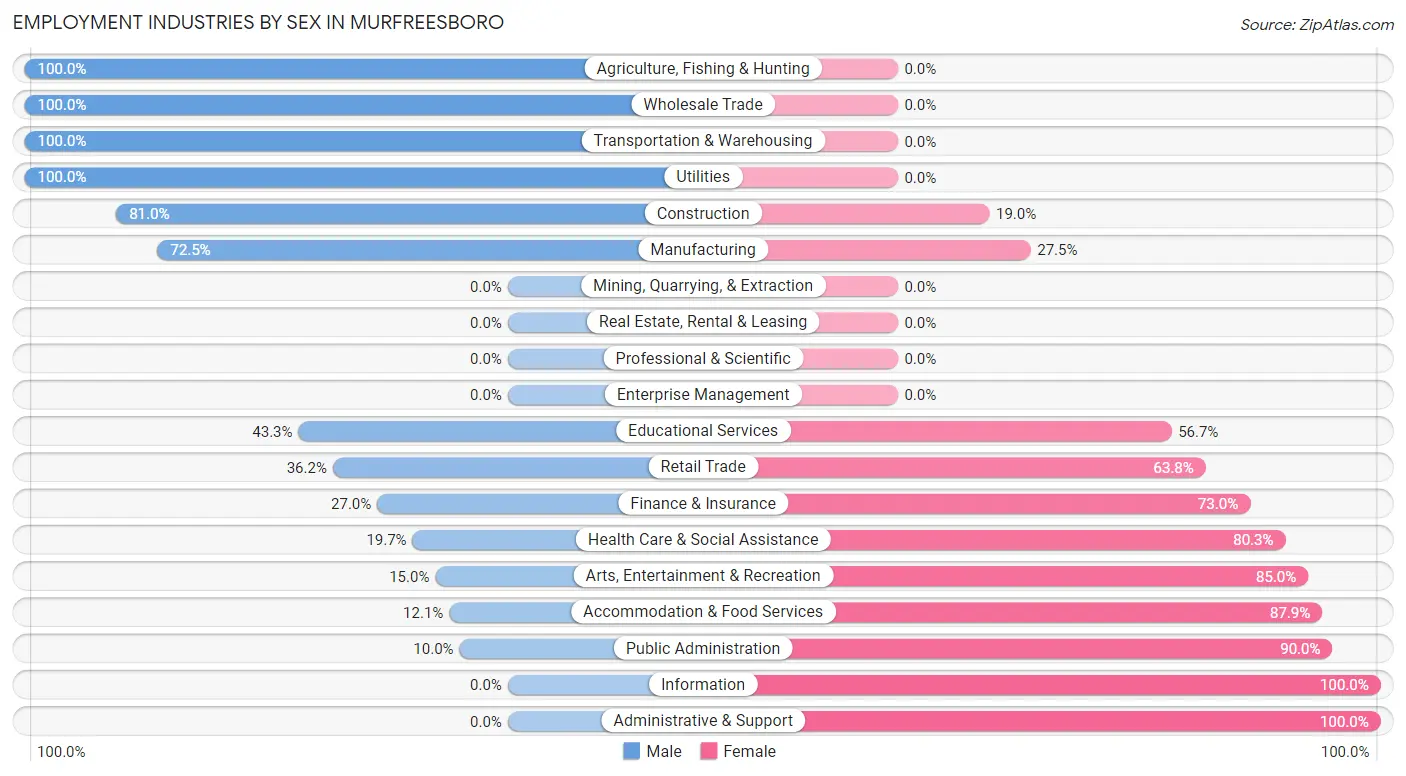
| Industry | Male | Female |
| Agriculture, Fishing & Hunting | 19 (100.0%) | 0 (0.0%) |
| Mining, Quarrying, & Extraction | 0 (0.0%) | 0 (0.0%) |
| Construction | 47 (81.0%) | 11 (19.0%) |
| Manufacturing | 87 (72.5%) | 33 (27.5%) |
| Wholesale Trade | 2 (100.0%) | 0 (0.0%) |
| Retail Trade | 46 (36.2%) | 81 (63.8%) |
| Transportation & Warehousing | 25 (100.0%) | 0 (0.0%) |
| Utilities | 16 (100.0%) | 0 (0.0%) |
| Information | 0 (0.0%) | 8 (100.0%) |
| Finance & Insurance | 10 (27.0%) | 27 (73.0%) |
| Real Estate, Rental & Leasing | 0 (0.0%) | 0 (0.0%) |
| Professional & Scientific | 0 (0.0%) | 0 (0.0%) |
| Enterprise Management | 0 (0.0%) | 0 (0.0%) |
| Administrative & Support | 0 (0.0%) | 4 (100.0%) |
| Educational Services | 39 (43.3%) | 51 (56.7%) |
| Health Care & Social Assistance | 14 (19.7%) | 57 (80.3%) |
| Arts, Entertainment & Recreation | 6 (15.0%) | 34 (85.0%) |
| Accommodation & Food Services | 4 (12.1%) | 29 (87.9%) |
| Public Administration | 2 (10.0%) | 18 (90.0%) |
| Total | 322 (46.4%) | 372 (53.6%) |
Education in Murfreesboro
School Enrollment in Murfreesboro
The most common levels of schooling among the 370 students in Murfreesboro are elementary school (116 | 31.4%), middle school (90 | 24.3%), and college / undergraduate (57 | 15.4%).
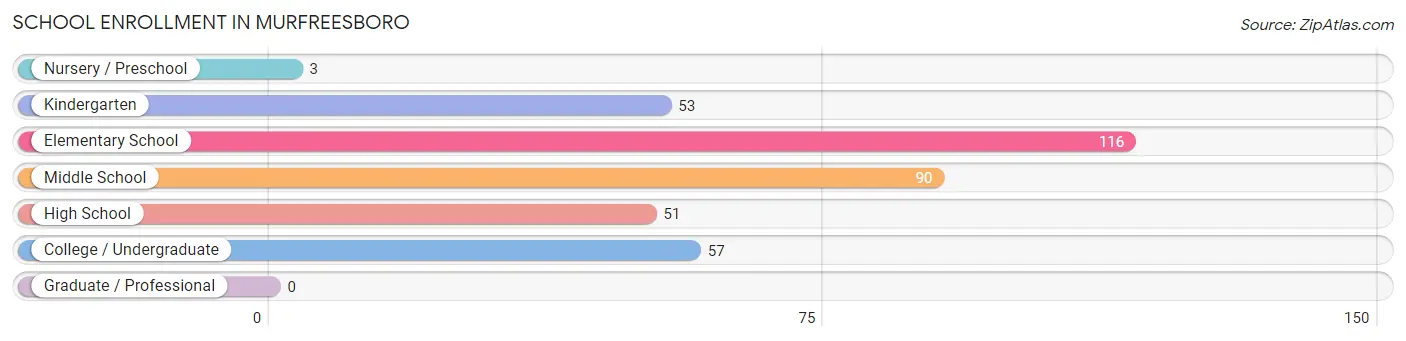
| School Level | # Students | % Students |
| Nursery / Preschool | 3 | 0.8% |
| Kindergarten | 53 | 14.3% |
| Elementary School | 116 | 31.4% |
| Middle School | 90 | 24.3% |
| High School | 51 | 13.8% |
| College / Undergraduate | 57 | 15.4% |
| Graduate / Professional | 0 | 0.0% |
| Total | 370 | 100.0% |
School Enrollment by Age by Funding Source in Murfreesboro
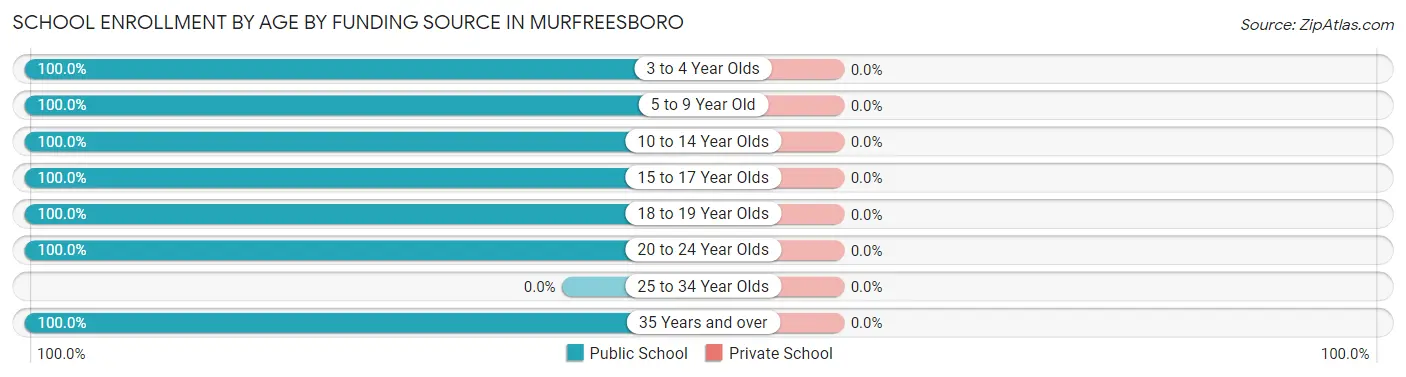
| Age Bracket | Public School | Private School |
| 3 to 4 Year Olds | 3 (100.0%) | 0 (0.0%) |
| 5 to 9 Year Old | 165 (100.0%) | 0 (0.0%) |
| 10 to 14 Year Olds | 100 (100.0%) | 0 (0.0%) |
| 15 to 17 Year Olds | 49 (100.0%) | 0 (0.0%) |
| 18 to 19 Year Olds | 24 (100.0%) | 0 (0.0%) |
| 20 to 24 Year Olds | 10 (100.0%) | 0 (0.0%) |
| 25 to 34 Year Olds | 0 (0.0%) | 0 (0.0%) |
| 35 Years and over | 19 (100.0%) | 0 (0.0%) |
| Total | 370 (100.0%) | 0 (0.0%) |
Educational Attainment by Field of Study in Murfreesboro
Education (65 | 28.0%), liberal arts & history (39 | 16.8%), business (34 | 14.7%), physical & health sciences (28 | 12.1%), and science & technology (21 | 9.0%) are the most common fields of study among 232 individuals in Murfreesboro who have obtained a bachelor's degree or higher.
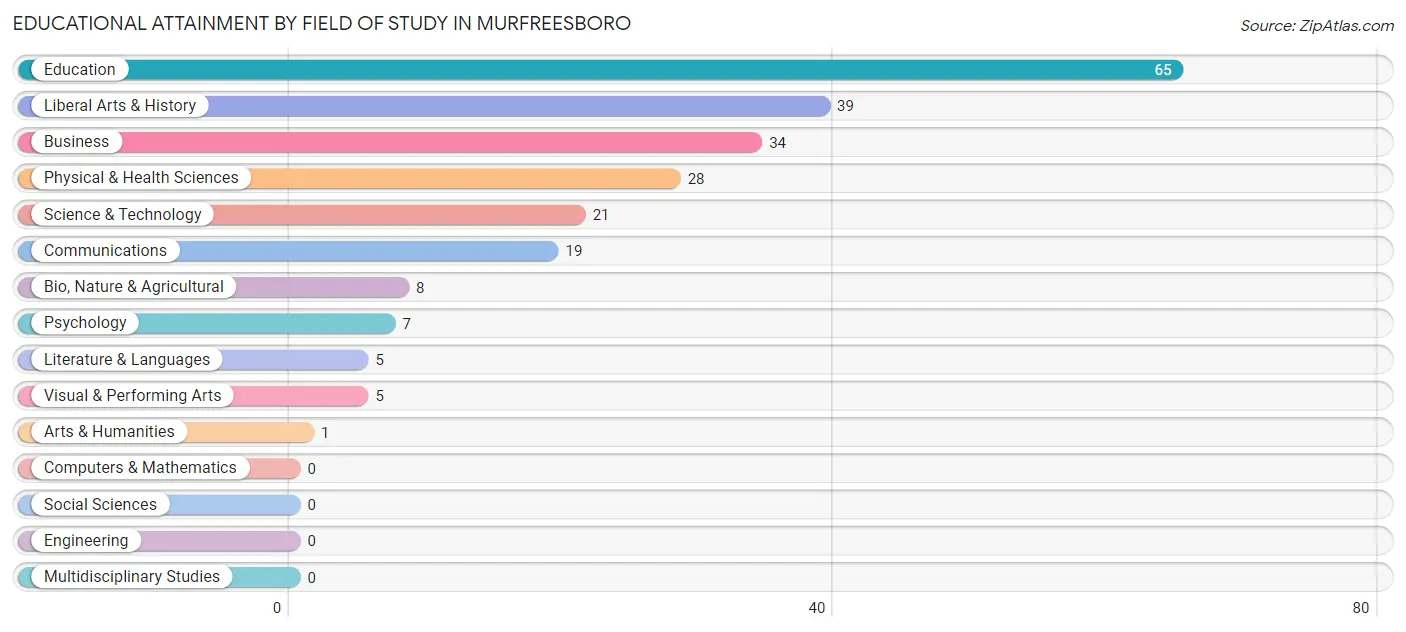
| Field of Study | # Graduates | % Graduates |
| Computers & Mathematics | 0 | 0.0% |
| Bio, Nature & Agricultural | 8 | 3.5% |
| Physical & Health Sciences | 28 | 12.1% |
| Psychology | 7 | 3.0% |
| Social Sciences | 0 | 0.0% |
| Engineering | 0 | 0.0% |
| Multidisciplinary Studies | 0 | 0.0% |
| Science & Technology | 21 | 9.0% |
| Business | 34 | 14.7% |
| Education | 65 | 28.0% |
| Literature & Languages | 5 | 2.2% |
| Liberal Arts & History | 39 | 16.8% |
| Visual & Performing Arts | 5 | 2.2% |
| Communications | 19 | 8.2% |
| Arts & Humanities | 1 | 0.4% |
| Total | 232 | 100.0% |
Transportation & Commute in Murfreesboro
Vehicle Availability by Sex in Murfreesboro
The most prevalent vehicle ownership categories in Murfreesboro are males with 2 vehicles (175, accounting for 54.3%) and females with 2 vehicles (188, making up 47.0%).
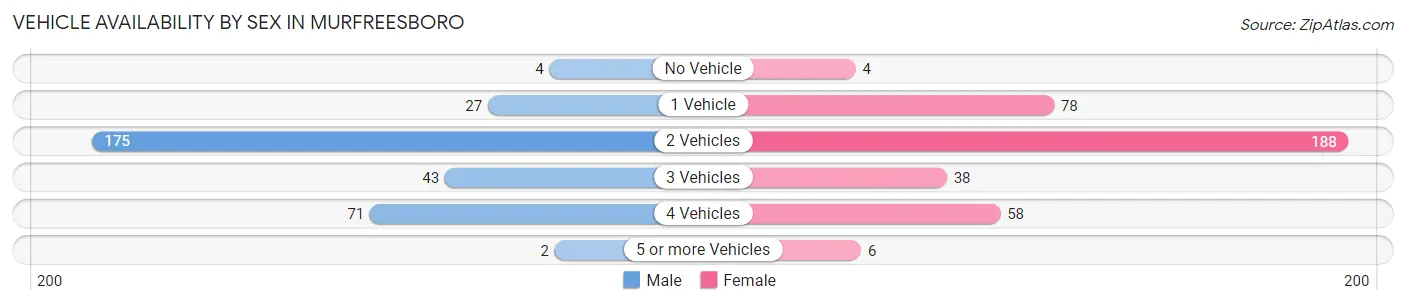
| Vehicles Available | Male | Female |
| No Vehicle | 4 (1.2%) | 4 (1.1%) |
| 1 Vehicle | 27 (8.4%) | 78 (21.0%) |
| 2 Vehicles | 175 (54.3%) | 188 (50.5%) |
| 3 Vehicles | 43 (13.4%) | 38 (10.2%) |
| 4 Vehicles | 71 (22.1%) | 58 (15.6%) |
| 5 or more Vehicles | 2 (0.6%) | 6 (1.6%) |
| Total | 322 (100.0%) | 372 (100.0%) |
Commute Time in Murfreesboro
The most frequently occuring commute durations in Murfreesboro are 5 to 9 minutes (208 commuters, 30.2%), 20 to 24 minutes (139 commuters, 20.2%), and less than 5 minutes (65 commuters, 9.5%).
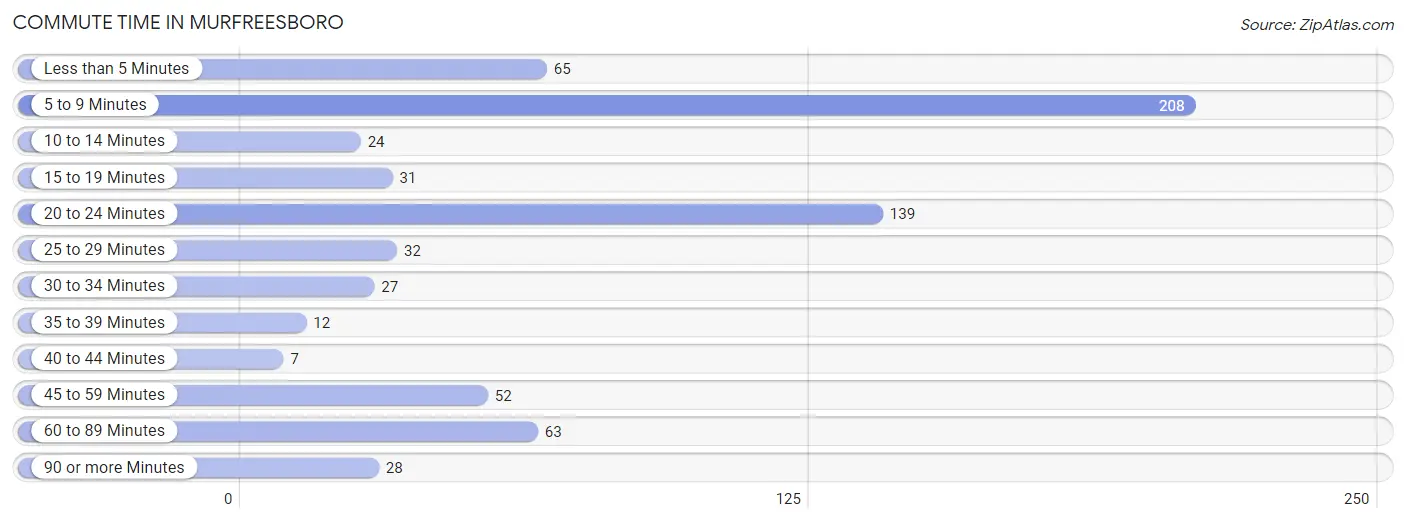
| Commute Time | # Commuters | % Commuters |
| Less than 5 Minutes | 65 | 9.5% |
| 5 to 9 Minutes | 208 | 30.2% |
| 10 to 14 Minutes | 24 | 3.5% |
| 15 to 19 Minutes | 31 | 4.5% |
| 20 to 24 Minutes | 139 | 20.2% |
| 25 to 29 Minutes | 32 | 4.6% |
| 30 to 34 Minutes | 27 | 3.9% |
| 35 to 39 Minutes | 12 | 1.7% |
| 40 to 44 Minutes | 7 | 1.0% |
| 45 to 59 Minutes | 52 | 7.6% |
| 60 to 89 Minutes | 63 | 9.2% |
| 90 or more Minutes | 28 | 4.1% |
Commute Time by Sex in Murfreesboro
The most common commute times in Murfreesboro are 5 to 9 minutes (57 commuters, 17.9%) for males and 5 to 9 minutes (151 commuters, 40.9%) for females.
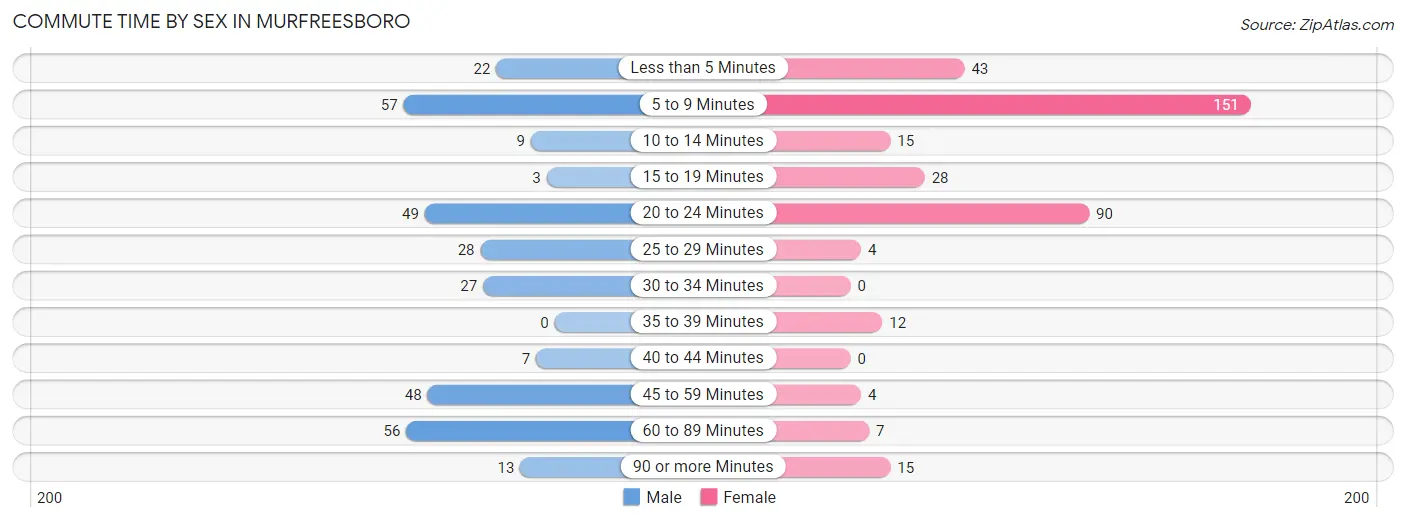
| Commute Time | Male | Female |
| Less than 5 Minutes | 22 (6.9%) | 43 (11.7%) |
| 5 to 9 Minutes | 57 (17.9%) | 151 (40.9%) |
| 10 to 14 Minutes | 9 (2.8%) | 15 (4.1%) |
| 15 to 19 Minutes | 3 (0.9%) | 28 (7.6%) |
| 20 to 24 Minutes | 49 (15.4%) | 90 (24.4%) |
| 25 to 29 Minutes | 28 (8.8%) | 4 (1.1%) |
| 30 to 34 Minutes | 27 (8.5%) | 0 (0.0%) |
| 35 to 39 Minutes | 0 (0.0%) | 12 (3.3%) |
| 40 to 44 Minutes | 7 (2.2%) | 0 (0.0%) |
| 45 to 59 Minutes | 48 (15.0%) | 4 (1.1%) |
| 60 to 89 Minutes | 56 (17.5%) | 7 (1.9%) |
| 90 or more Minutes | 13 (4.1%) | 15 (4.1%) |
Time of Departure to Work by Sex in Murfreesboro
The most frequent times of departure to work in Murfreesboro are 6:30 AM to 6:59 AM (78, 24.4%) for males and 7:30 AM to 7:59 AM (124, 33.6%) for females.
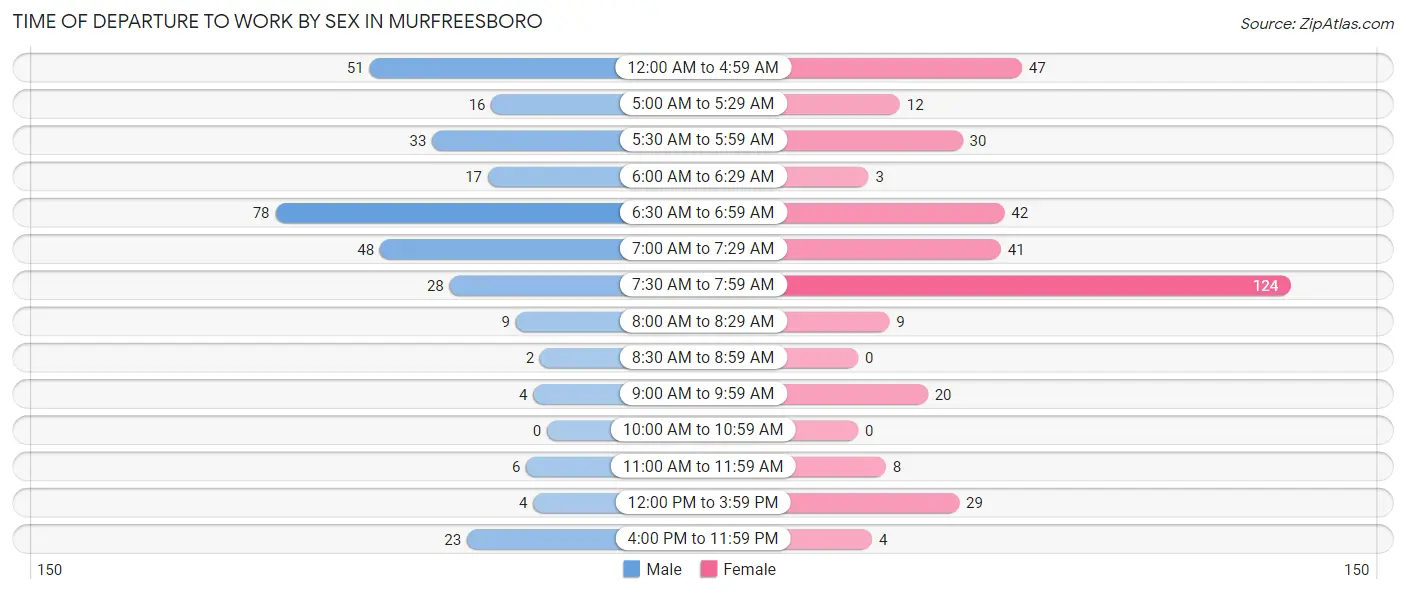
| Time of Departure | Male | Female |
| 12:00 AM to 4:59 AM | 51 (16.0%) | 47 (12.7%) |
| 5:00 AM to 5:29 AM | 16 (5.0%) | 12 (3.3%) |
| 5:30 AM to 5:59 AM | 33 (10.3%) | 30 (8.1%) |
| 6:00 AM to 6:29 AM | 17 (5.3%) | 3 (0.8%) |
| 6:30 AM to 6:59 AM | 78 (24.4%) | 42 (11.4%) |
| 7:00 AM to 7:29 AM | 48 (15.0%) | 41 (11.1%) |
| 7:30 AM to 7:59 AM | 28 (8.8%) | 124 (33.6%) |
| 8:00 AM to 8:29 AM | 9 (2.8%) | 9 (2.4%) |
| 8:30 AM to 8:59 AM | 2 (0.6%) | 0 (0.0%) |
| 9:00 AM to 9:59 AM | 4 (1.3%) | 20 (5.4%) |
| 10:00 AM to 10:59 AM | 0 (0.0%) | 0 (0.0%) |
| 11:00 AM to 11:59 AM | 6 (1.9%) | 8 (2.2%) |
| 12:00 PM to 3:59 PM | 4 (1.3%) | 29 (7.9%) |
| 4:00 PM to 11:59 PM | 23 (7.2%) | 4 (1.1%) |
| Total | 319 (100.0%) | 369 (100.0%) |
Housing Occupancy in Murfreesboro
Occupancy by Ownership in Murfreesboro
Of the total 698 dwellings in Murfreesboro, owner-occupied units account for 469 (67.2%), while renter-occupied units make up 229 (32.8%).
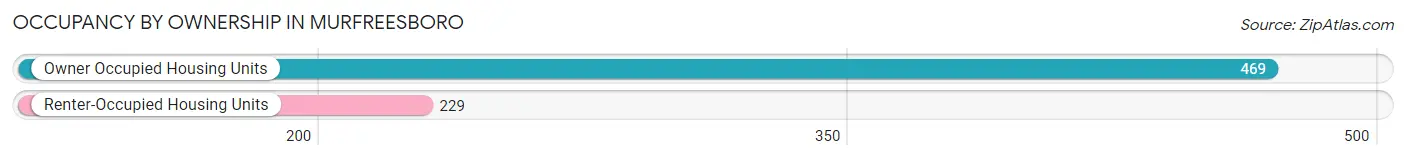
| Occupancy | # Housing Units | % Housing Units |
| Owner Occupied Housing Units | 469 | 67.2% |
| Renter-Occupied Housing Units | 229 | 32.8% |
| Total Occupied Housing Units | 698 | 100.0% |
Occupancy by Household Size in Murfreesboro
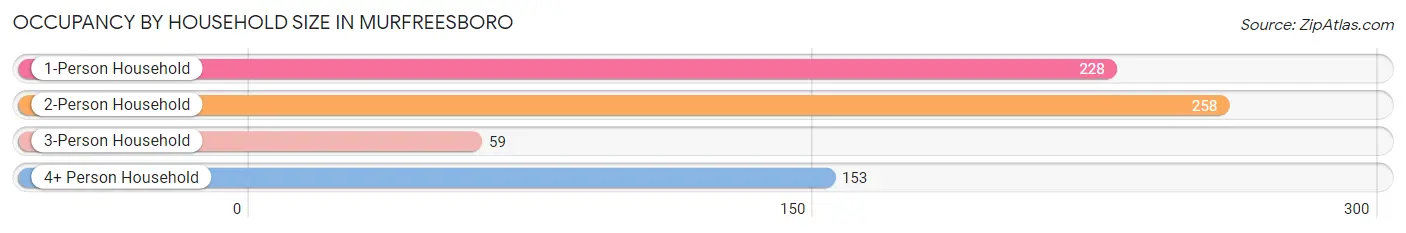
| Household Size | # Housing Units | % Housing Units |
| 1-Person Household | 228 | 32.7% |
| 2-Person Household | 258 | 37.0% |
| 3-Person Household | 59 | 8.5% |
| 4+ Person Household | 153 | 21.9% |
| Total Housing Units | 698 | 100.0% |
Occupancy by Ownership by Household Size in Murfreesboro
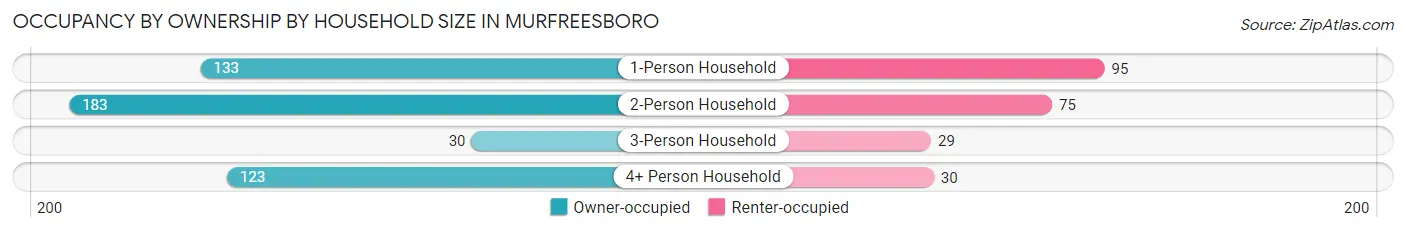
| Household Size | Owner-occupied | Renter-occupied |
| 1-Person Household | 133 (58.3%) | 95 (41.7%) |
| 2-Person Household | 183 (70.9%) | 75 (29.1%) |
| 3-Person Household | 30 (50.8%) | 29 (49.1%) |
| 4+ Person Household | 123 (80.4%) | 30 (19.6%) |
| Total Housing Units | 469 (67.2%) | 229 (32.8%) |
Occupancy by Educational Attainment in Murfreesboro
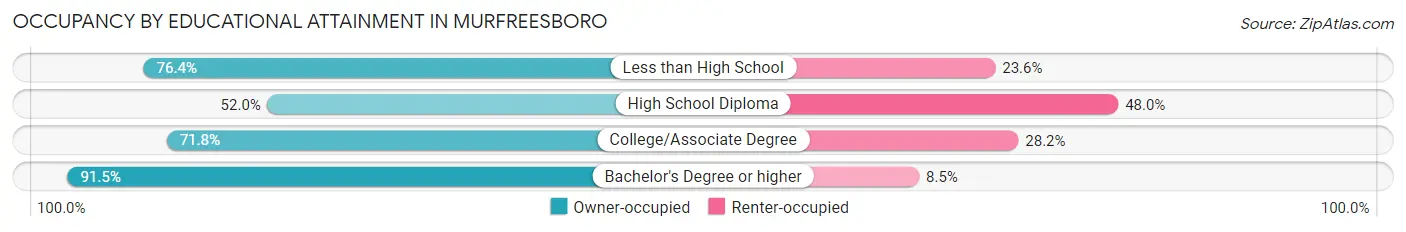
| Household Size | Owner-occupied | Renter-occupied |
| Less than High School | 55 (76.4%) | 17 (23.6%) |
| High School Diploma | 142 (52.0%) | 131 (48.0%) |
| College/Associate Degree | 186 (71.8%) | 73 (28.2%) |
| Bachelor's Degree or higher | 86 (91.5%) | 8 (8.5%) |
Occupancy by Age of Householder in Murfreesboro
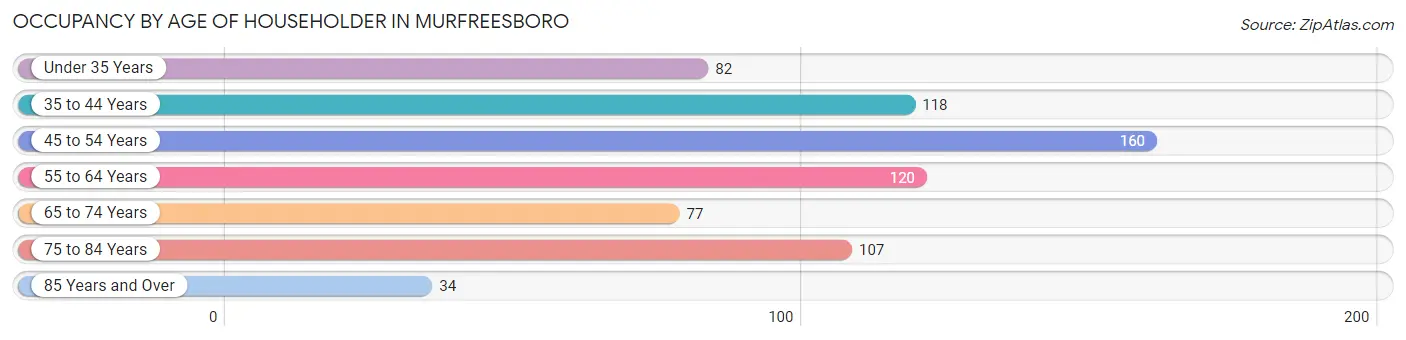
| Age Bracket | # Households | % Households |
| Under 35 Years | 82 | 11.7% |
| 35 to 44 Years | 118 | 16.9% |
| 45 to 54 Years | 160 | 22.9% |
| 55 to 64 Years | 120 | 17.2% |
| 65 to 74 Years | 77 | 11.0% |
| 75 to 84 Years | 107 | 15.3% |
| 85 Years and Over | 34 | 4.9% |
| Total | 698 | 100.0% |
Housing Finances in Murfreesboro
Median Income by Occupancy in Murfreesboro
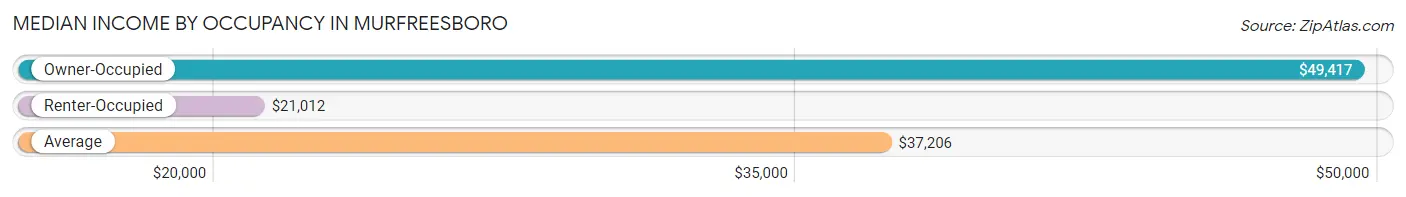
| Occupancy Type | # Households | Median Income |
| Owner-Occupied | 469 (67.2%) | $49,417 |
| Renter-Occupied | 229 (32.8%) | $21,012 |
| Average | 698 (100.0%) | $37,206 |
Occupancy by Householder Income Bracket in Murfreesboro
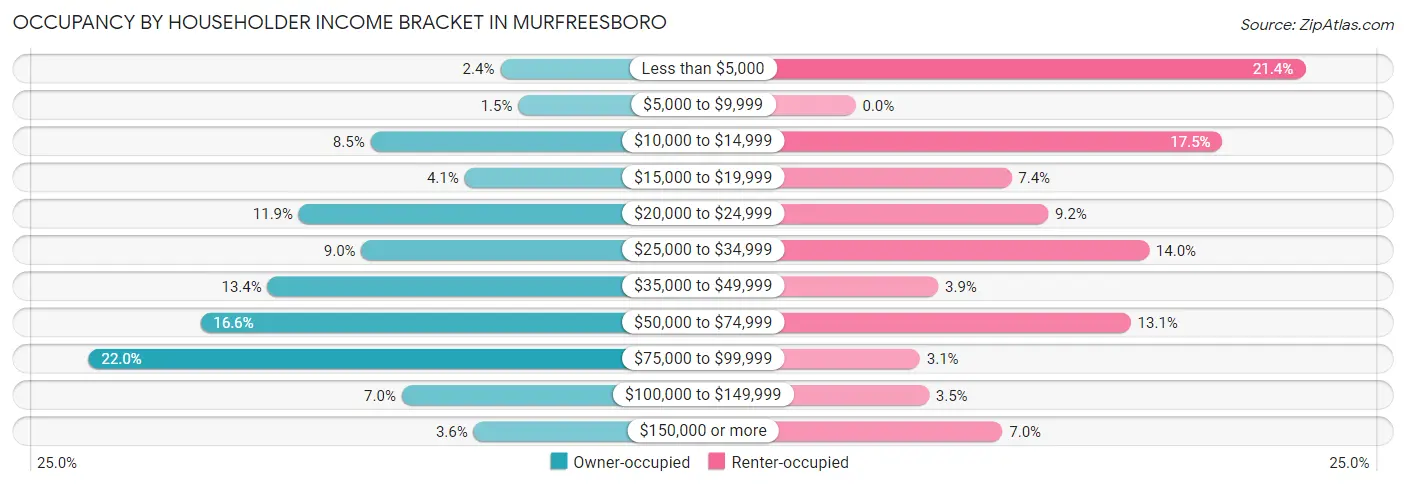
| Income Bracket | Owner-occupied | Renter-occupied |
| Less than $5,000 | 11 (2.4%) | 49 (21.4%) |
| $5,000 to $9,999 | 7 (1.5%) | 0 (0.0%) |
| $10,000 to $14,999 | 40 (8.5%) | 40 (17.5%) |
| $15,000 to $19,999 | 19 (4.1%) | 17 (7.4%) |
| $20,000 to $24,999 | 56 (11.9%) | 21 (9.2%) |
| $25,000 to $34,999 | 42 (9.0%) | 32 (14.0%) |
| $35,000 to $49,999 | 63 (13.4%) | 9 (3.9%) |
| $50,000 to $74,999 | 78 (16.6%) | 30 (13.1%) |
| $75,000 to $99,999 | 103 (22.0%) | 7 (3.1%) |
| $100,000 to $149,999 | 33 (7.0%) | 8 (3.5%) |
| $150,000 or more | 17 (3.6%) | 16 (7.0%) |
| Total | 469 (100.0%) | 229 (100.0%) |
Monthly Housing Cost Tiers in Murfreesboro
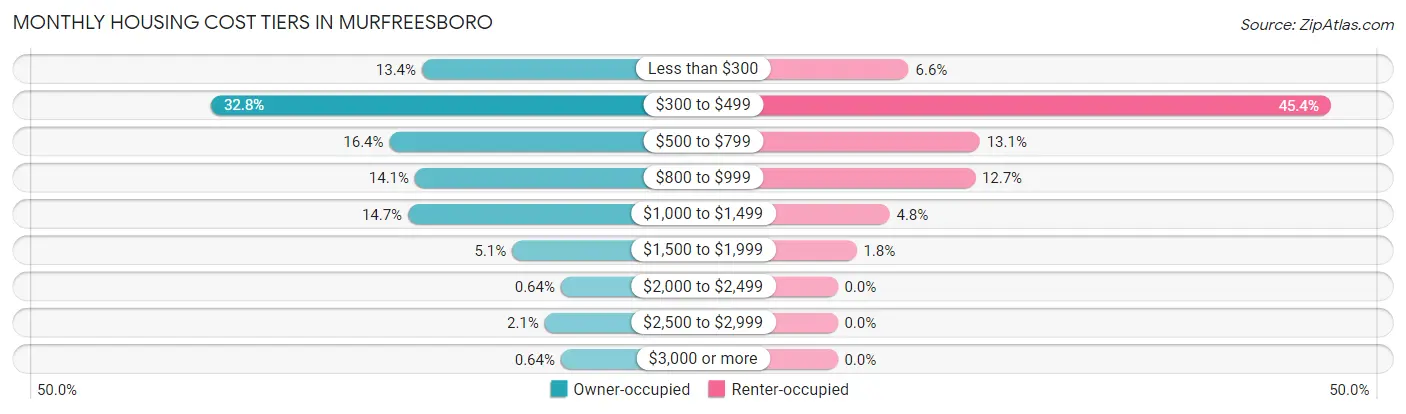
| Monthly Cost | Owner-occupied | Renter-occupied |
| Less than $300 | 63 (13.4%) | 15 (6.6%) |
| $300 to $499 | 154 (32.8%) | 104 (45.4%) |
| $500 to $799 | 77 (16.4%) | 30 (13.1%) |
| $800 to $999 | 66 (14.1%) | 29 (12.7%) |
| $1,000 to $1,499 | 69 (14.7%) | 11 (4.8%) |
| $1,500 to $1,999 | 24 (5.1%) | 4 (1.8%) |
| $2,000 to $2,499 | 3 (0.6%) | 0 (0.0%) |
| $2,500 to $2,999 | 10 (2.1%) | 0 (0.0%) |
| $3,000 or more | 3 (0.6%) | 0 (0.0%) |
| Total | 469 (100.0%) | 229 (100.0%) |
Physical Housing Characteristics in Murfreesboro
Housing Structures in Murfreesboro
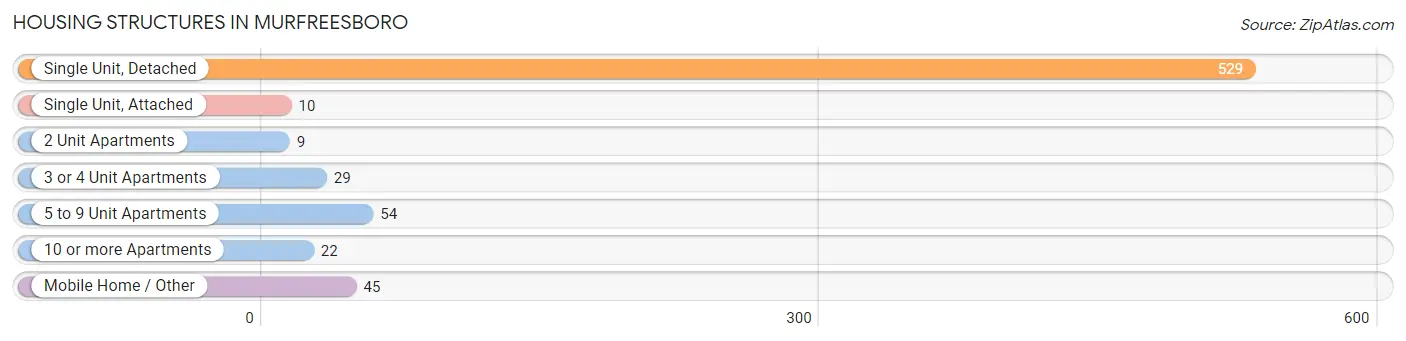
| Structure Type | # Housing Units | % Housing Units |
| Single Unit, Detached | 529 | 75.8% |
| Single Unit, Attached | 10 | 1.4% |
| 2 Unit Apartments | 9 | 1.3% |
| 3 or 4 Unit Apartments | 29 | 4.2% |
| 5 to 9 Unit Apartments | 54 | 7.7% |
| 10 or more Apartments | 22 | 3.2% |
| Mobile Home / Other | 45 | 6.5% |
| Total | 698 | 100.0% |
Housing Structures by Occupancy in Murfreesboro
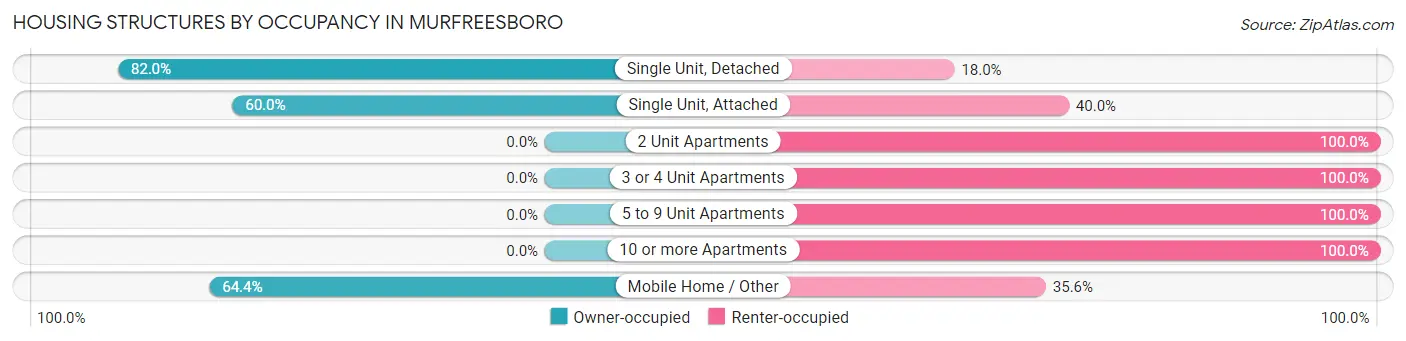
| Structure Type | Owner-occupied | Renter-occupied |
| Single Unit, Detached | 434 (82.0%) | 95 (18.0%) |
| Single Unit, Attached | 6 (60.0%) | 4 (40.0%) |
| 2 Unit Apartments | 0 (0.0%) | 9 (100.0%) |
| 3 or 4 Unit Apartments | 0 (0.0%) | 29 (100.0%) |
| 5 to 9 Unit Apartments | 0 (0.0%) | 54 (100.0%) |
| 10 or more Apartments | 0 (0.0%) | 22 (100.0%) |
| Mobile Home / Other | 29 (64.4%) | 16 (35.6%) |
| Total | 469 (67.2%) | 229 (32.8%) |
Housing Structures by Number of Rooms in Murfreesboro
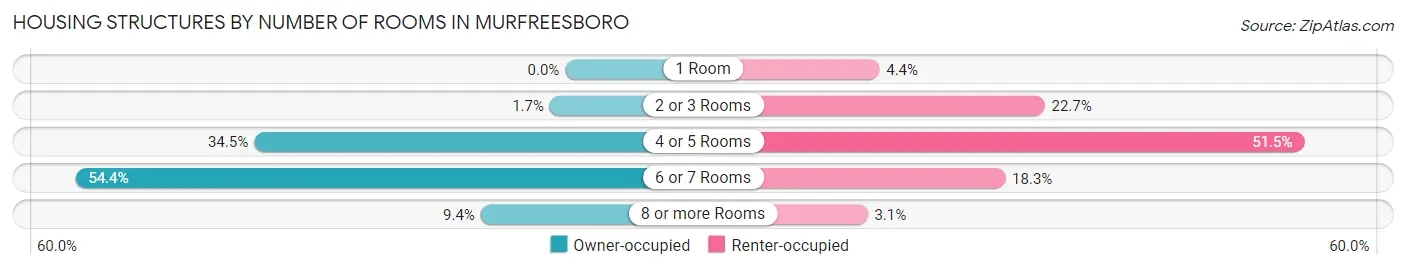
| Number of Rooms | Owner-occupied | Renter-occupied |
| 1 Room | 0 (0.0%) | 10 (4.4%) |
| 2 or 3 Rooms | 8 (1.7%) | 52 (22.7%) |
| 4 or 5 Rooms | 162 (34.5%) | 118 (51.5%) |
| 6 or 7 Rooms | 255 (54.4%) | 42 (18.3%) |
| 8 or more Rooms | 44 (9.4%) | 7 (3.1%) |
| Total | 469 (100.0%) | 229 (100.0%) |
Housing Structure by Heating Type in Murfreesboro
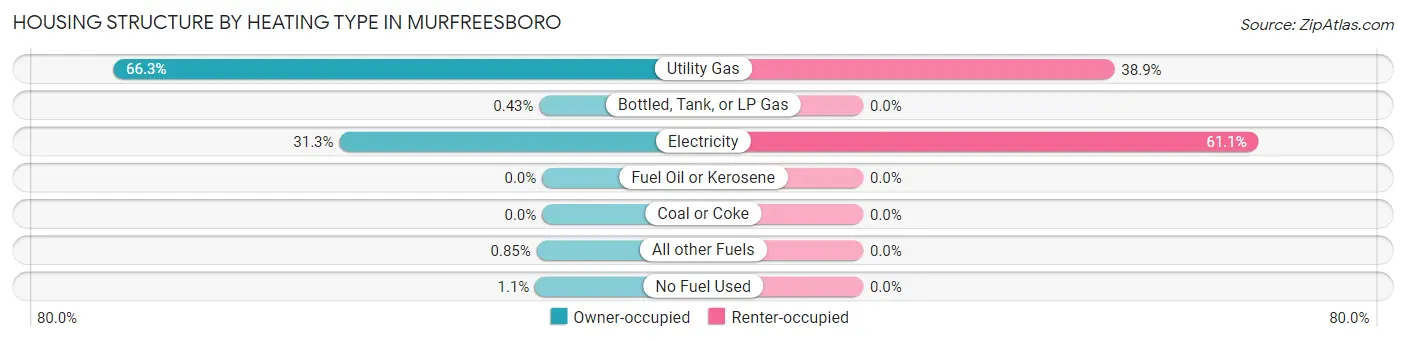
| Heating Type | Owner-occupied | Renter-occupied |
| Utility Gas | 311 (66.3%) | 89 (38.9%) |
| Bottled, Tank, or LP Gas | 2 (0.4%) | 0 (0.0%) |
| Electricity | 147 (31.3%) | 140 (61.1%) |
| Fuel Oil or Kerosene | 0 (0.0%) | 0 (0.0%) |
| Coal or Coke | 0 (0.0%) | 0 (0.0%) |
| All other Fuels | 4 (0.9%) | 0 (0.0%) |
| No Fuel Used | 5 (1.1%) | 0 (0.0%) |
| Total | 469 (100.0%) | 229 (100.0%) |
Household Vehicle Usage in Murfreesboro
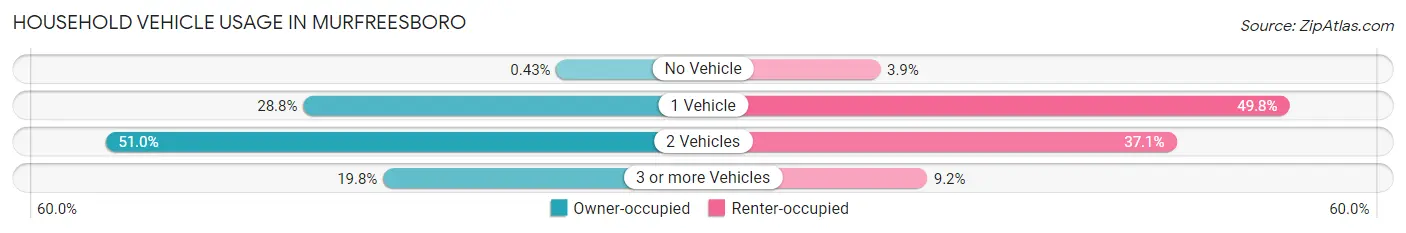
| Vehicles per Household | Owner-occupied | Renter-occupied |
| No Vehicle | 2 (0.4%) | 9 (3.9%) |
| 1 Vehicle | 135 (28.8%) | 114 (49.8%) |
| 2 Vehicles | 239 (51.0%) | 85 (37.1%) |
| 3 or more Vehicles | 93 (19.8%) | 21 (9.2%) |
| Total | 469 (100.0%) | 229 (100.0%) |
Real Estate & Mortgages in Murfreesboro
Real Estate and Mortgage Overview in Murfreesboro
| Characteristic | Without Mortgage | With Mortgage |
| Housing Units | 238 | 231 |
| Median Property Value | $73,800 | $106,700 |
| Median Household Income | $31,528 | $10 |
| Monthly Housing Costs | $347 | $3 |
| Real Estate Taxes | $439 | $36 |
Property Value by Mortgage Status in Murfreesboro
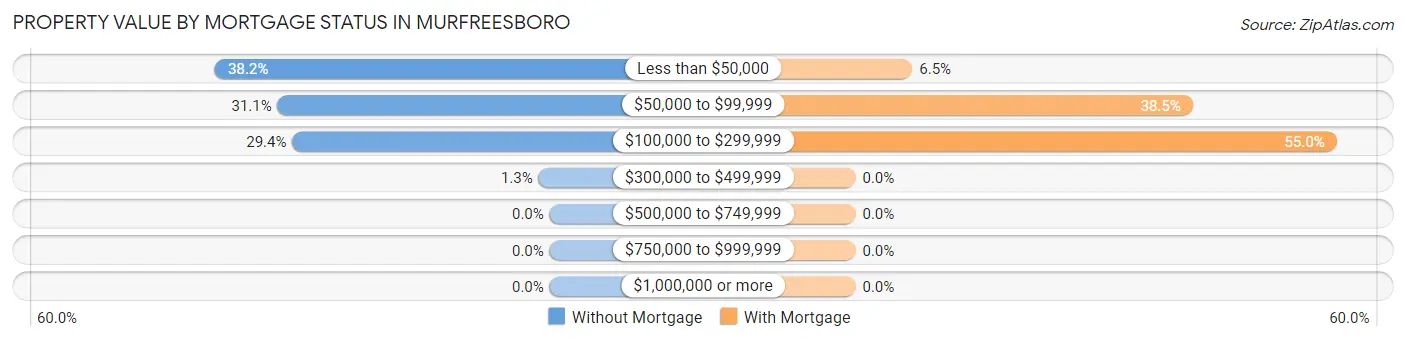
| Property Value | Without Mortgage | With Mortgage |
| Less than $50,000 | 91 (38.2%) | 15 (6.5%) |
| $50,000 to $99,999 | 74 (31.1%) | 89 (38.5%) |
| $100,000 to $299,999 | 70 (29.4%) | 127 (55.0%) |
| $300,000 to $499,999 | 3 (1.3%) | 0 (0.0%) |
| $500,000 to $749,999 | 0 (0.0%) | 0 (0.0%) |
| $750,000 to $999,999 | 0 (0.0%) | 0 (0.0%) |
| $1,000,000 or more | 0 (0.0%) | 0 (0.0%) |
| Total | 238 (100.0%) | 231 (100.0%) |
Household Income by Mortgage Status in Murfreesboro
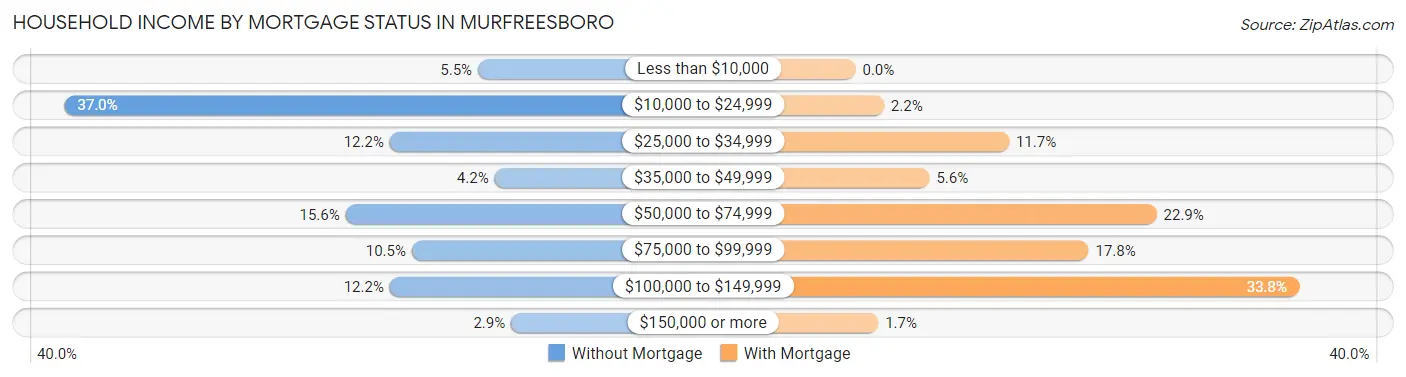
| Household Income | Without Mortgage | With Mortgage |
| Less than $10,000 | 13 (5.5%) | 0 (0.0%) |
| $10,000 to $24,999 | 88 (37.0%) | 5 (2.2%) |
| $25,000 to $34,999 | 29 (12.2%) | 27 (11.7%) |
| $35,000 to $49,999 | 10 (4.2%) | 13 (5.6%) |
| $50,000 to $74,999 | 37 (15.5%) | 53 (22.9%) |
| $75,000 to $99,999 | 25 (10.5%) | 41 (17.7%) |
| $100,000 to $149,999 | 29 (12.2%) | 78 (33.8%) |
| $150,000 or more | 7 (2.9%) | 4 (1.7%) |
| Total | 238 (100.0%) | 231 (100.0%) |
Property Value to Household Income Ratio in Murfreesboro
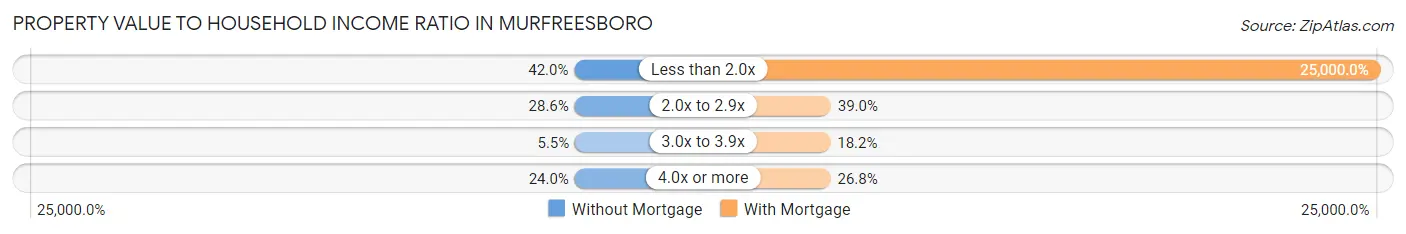
| Value-to-Income Ratio | Without Mortgage | With Mortgage |
| Less than 2.0x | 100 (42.0%) | 57,750 (25,000.0%) |
| 2.0x to 2.9x | 68 (28.6%) | 90 (39.0%) |
| 3.0x to 3.9x | 13 (5.5%) | 42 (18.2%) |
| 4.0x or more | 57 (23.9%) | 62 (26.8%) |
| Total | 238 (100.0%) | 231 (100.0%) |
Real Estate Taxes by Mortgage Status in Murfreesboro
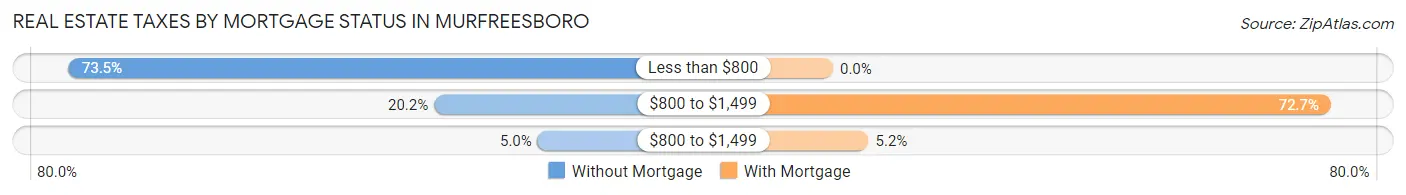
| Property Taxes | Without Mortgage | With Mortgage |
| Less than $800 | 175 (73.5%) | 0 (0.0%) |
| $800 to $1,499 | 48 (20.2%) | 168 (72.7%) |
| $800 to $1,499 | 12 (5.0%) | 12 (5.2%) |
| Total | 238 (100.0%) | 231 (100.0%) |
Health & Disability in Murfreesboro
Health Insurance Coverage by Age in Murfreesboro
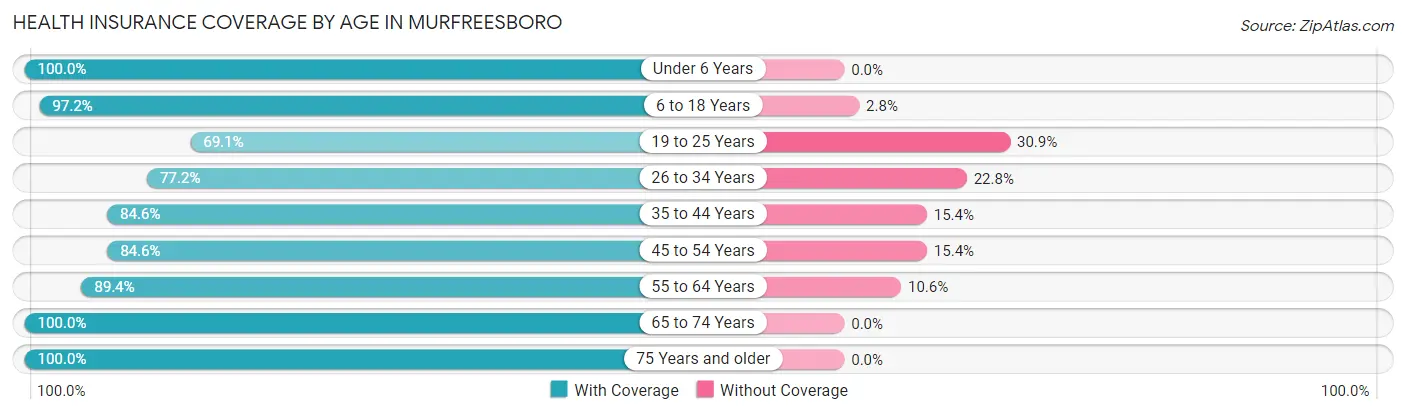
| Age Bracket | With Coverage | Without Coverage |
| Under 6 Years | 82 (100.0%) | 0 (0.0%) |
| 6 to 18 Years | 281 (97.2%) | 8 (2.8%) |
| 19 to 25 Years | 114 (69.1%) | 51 (30.9%) |
| 26 to 34 Years | 71 (77.2%) | 21 (22.8%) |
| 35 to 44 Years | 187 (84.6%) | 34 (15.4%) |
| 45 to 54 Years | 236 (84.6%) | 43 (15.4%) |
| 55 to 64 Years | 152 (89.4%) | 18 (10.6%) |
| 65 to 74 Years | 154 (100.0%) | 0 (0.0%) |
| 75 Years and older | 170 (100.0%) | 0 (0.0%) |
| Total | 1,447 (89.2%) | 175 (10.8%) |
Health Insurance Coverage by Citizenship Status in Murfreesboro
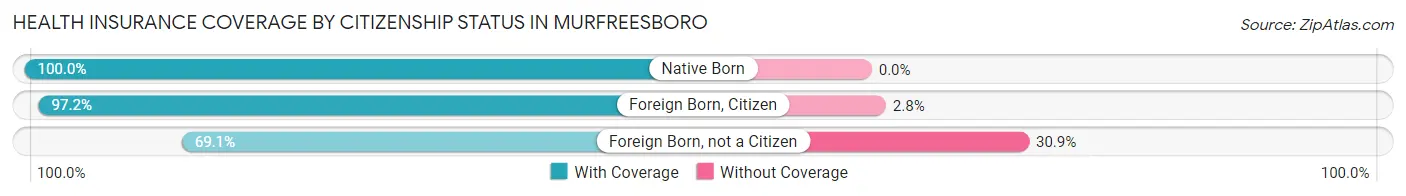
| Citizenship Status | With Coverage | Without Coverage |
| Native Born | 82 (100.0%) | 0 (0.0%) |
| Foreign Born, Citizen | 281 (97.2%) | 8 (2.8%) |
| Foreign Born, not a Citizen | 114 (69.1%) | 51 (30.9%) |
Health Insurance Coverage by Household Income in Murfreesboro
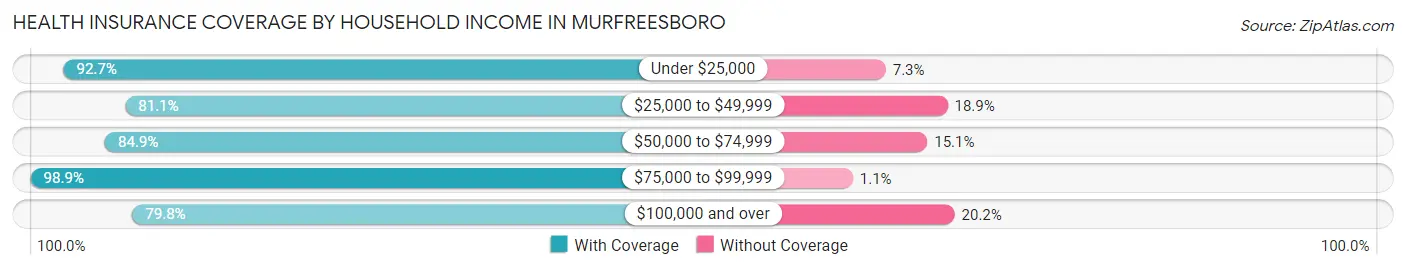
| Household Income | With Coverage | Without Coverage |
| Under $25,000 | 482 (92.7%) | 38 (7.3%) |
| $25,000 to $49,999 | 202 (81.1%) | 47 (18.9%) |
| $50,000 to $74,999 | 259 (84.9%) | 46 (15.1%) |
| $75,000 to $99,999 | 346 (98.9%) | 4 (1.1%) |
| $100,000 and over | 158 (79.8%) | 40 (20.2%) |
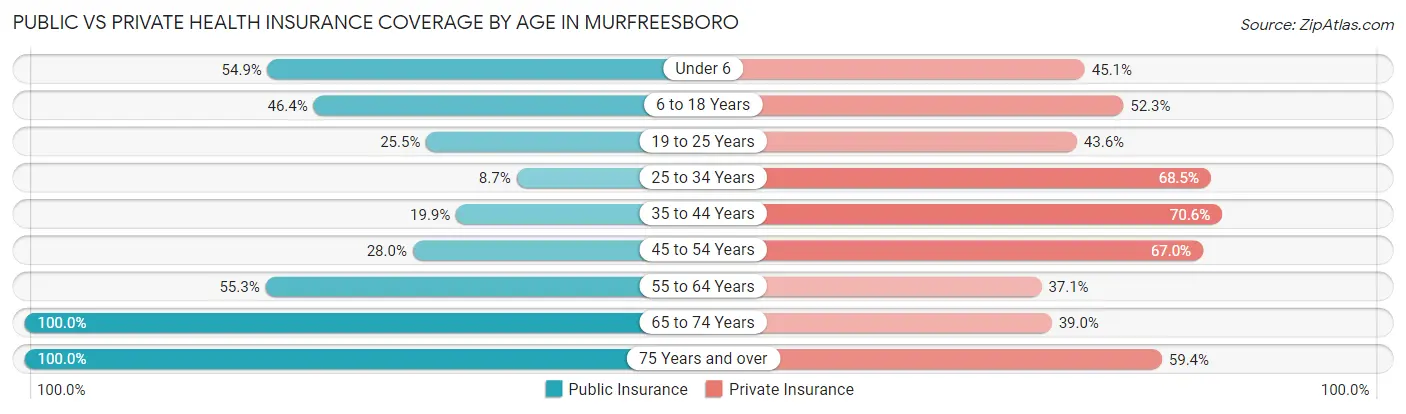
Public vs Private Health Insurance Coverage by Age in Murfreesboro
| Age Bracket | Public Insurance | Private Insurance |
| Under 6 | 45 (54.9%) | 37 (45.1%) |
| 6 to 18 Years | 134 (46.4%) | 151 (52.2%) |
| 19 to 25 Years | 42 (25.5%) | 72 (43.6%) |
| 25 to 34 Years | 8 (8.7%) | 63 (68.5%) |
| 35 to 44 Years | 44 (19.9%) | 156 (70.6%) |
| 45 to 54 Years | 78 (28.0%) | 187 (67.0%) |
| 55 to 64 Years | 94 (55.3%) | 63 (37.1%) |
| 65 to 74 Years | 154 (100.0%) | 60 (39.0%) |
| 75 Years and over | 170 (100.0%) | 101 (59.4%) |
| Total | 769 (47.4%) | 890 (54.9%) |
Disability Status by Sex by Age in Murfreesboro
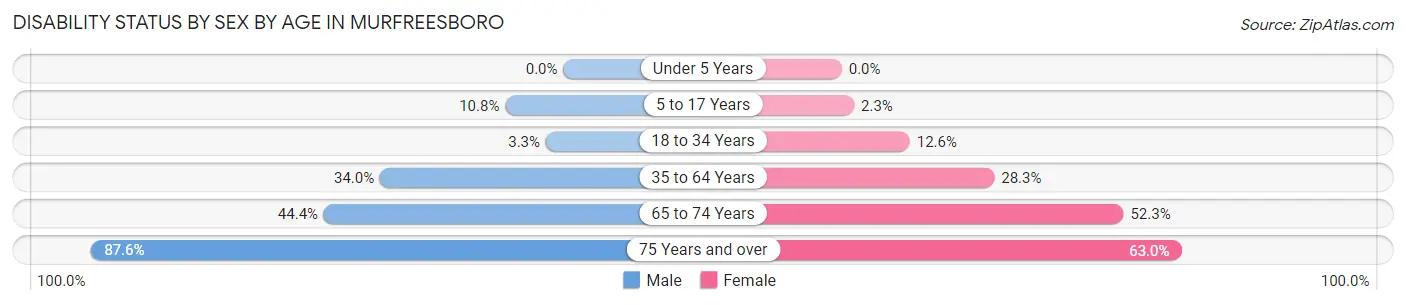
| Age Bracket | Male | Female |
| Under 5 Years | 0 (0.0%) | 0 (0.0%) |
| 5 to 17 Years | 15 (10.8%) | 4 (2.3%) |
| 18 to 34 Years | 5 (3.3%) | 13 (12.6%) |
| 35 to 64 Years | 115 (34.0%) | 94 (28.3%) |
| 65 to 74 Years | 20 (44.4%) | 57 (52.3%) |
| 75 Years and over | 85 (87.6%) | 46 (63.0%) |
Disability Class by Sex by Age in Murfreesboro
Disability Class: Hearing Difficulty
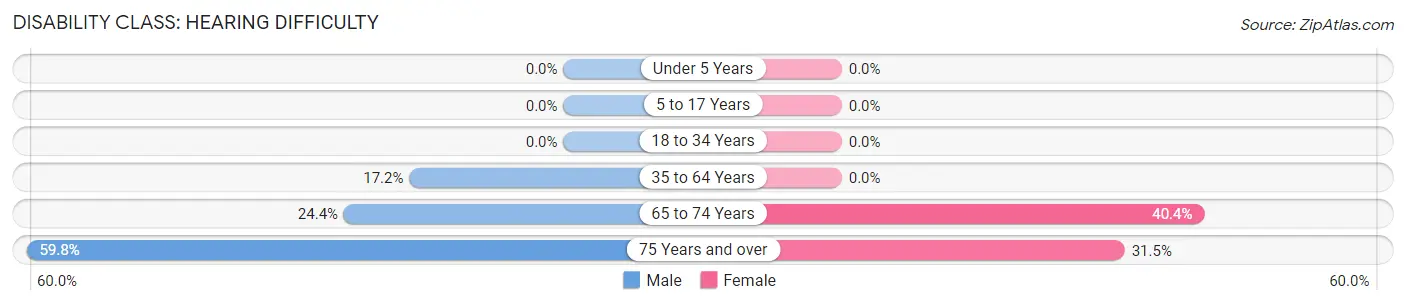
| Age Bracket | Male | Female |
| Under 5 Years | 0 (0.0%) | 0 (0.0%) |
| 5 to 17 Years | 0 (0.0%) | 0 (0.0%) |
| 18 to 34 Years | 0 (0.0%) | 0 (0.0%) |
| 35 to 64 Years | 58 (17.2%) | 0 (0.0%) |
| 65 to 74 Years | 11 (24.4%) | 44 (40.4%) |
| 75 Years and over | 58 (59.8%) | 23 (31.5%) |
Disability Class: Vision Difficulty
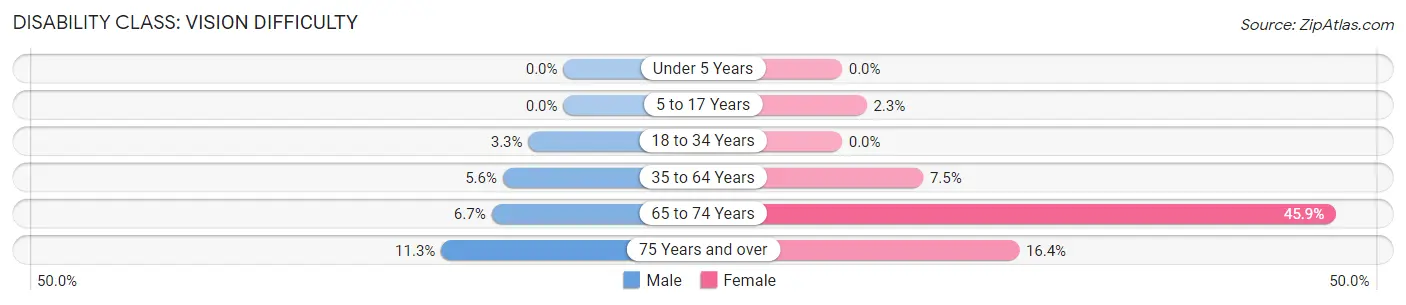
| Age Bracket | Male | Female |
| Under 5 Years | 0 (0.0%) | 0 (0.0%) |
| 5 to 17 Years | 0 (0.0%) | 4 (2.3%) |
| 18 to 34 Years | 5 (3.3%) | 0 (0.0%) |
| 35 to 64 Years | 19 (5.6%) | 25 (7.5%) |
| 65 to 74 Years | 3 (6.7%) | 50 (45.9%) |
| 75 Years and over | 11 (11.3%) | 12 (16.4%) |
Disability Class: Cognitive Difficulty
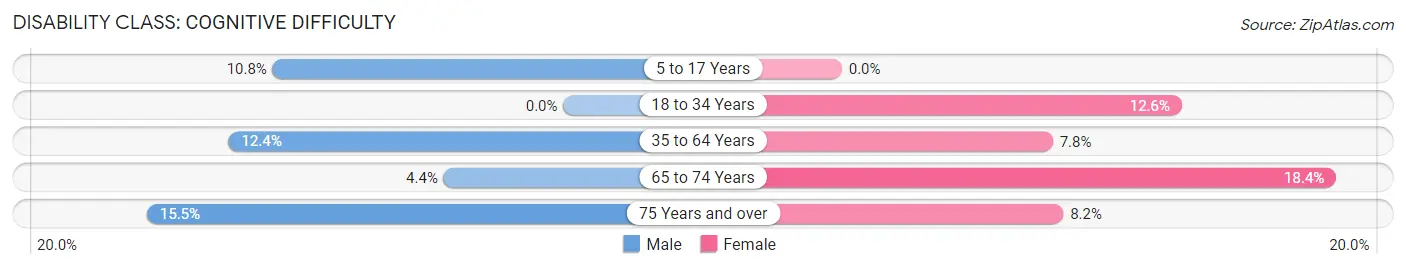
| Age Bracket | Male | Female |
| 5 to 17 Years | 15 (10.8%) | 0 (0.0%) |
| 18 to 34 Years | 0 (0.0%) | 13 (12.6%) |
| 35 to 64 Years | 42 (12.4%) | 26 (7.8%) |
| 65 to 74 Years | 2 (4.4%) | 20 (18.3%) |
| 75 Years and over | 15 (15.5%) | 6 (8.2%) |
Disability Class: Ambulatory Difficulty
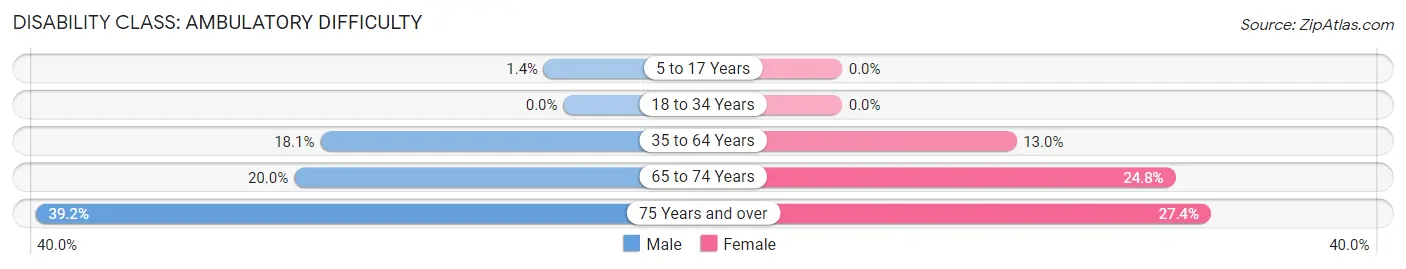
| Age Bracket | Male | Female |
| 5 to 17 Years | 2 (1.4%) | 0 (0.0%) |
| 18 to 34 Years | 0 (0.0%) | 0 (0.0%) |
| 35 to 64 Years | 61 (18.0%) | 43 (13.0%) |
| 65 to 74 Years | 9 (20.0%) | 27 (24.8%) |
| 75 Years and over | 38 (39.2%) | 20 (27.4%) |
Disability Class: Self-Care Difficulty
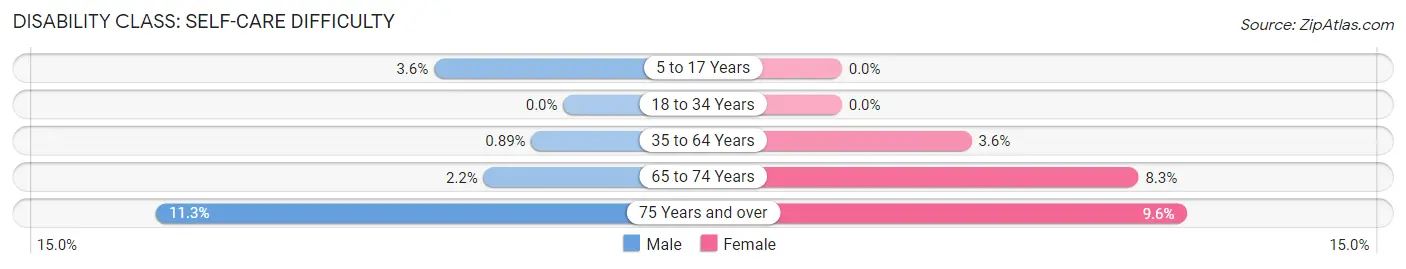
| Age Bracket | Male | Female |
| 5 to 17 Years | 5 (3.6%) | 0 (0.0%) |
| 18 to 34 Years | 0 (0.0%) | 0 (0.0%) |
| 35 to 64 Years | 3 (0.9%) | 12 (3.6%) |
| 65 to 74 Years | 1 (2.2%) | 9 (8.3%) |
| 75 Years and over | 11 (11.3%) | 7 (9.6%) |
Technology Access in Murfreesboro
Computing Device Access in Murfreesboro
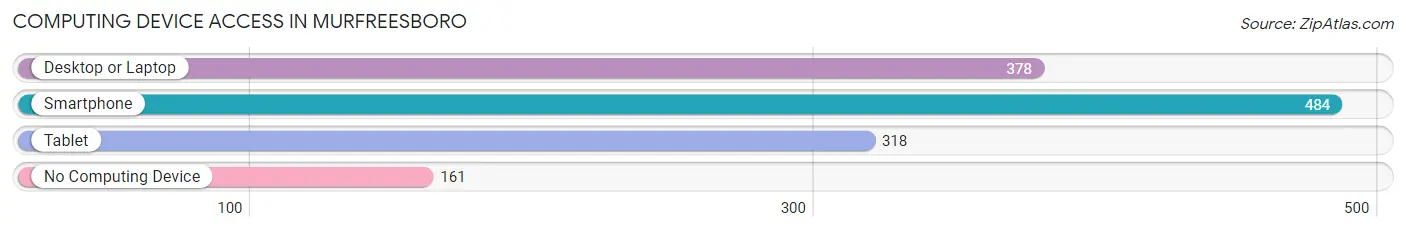
| Device Type | # Households | % Households |
| Desktop or Laptop | 378 | 54.1% |
| Smartphone | 484 | 69.3% |
| Tablet | 318 | 45.6% |
| No Computing Device | 161 | 23.1% |
| Total | 698 | 100.0% |
Internet Access in Murfreesboro
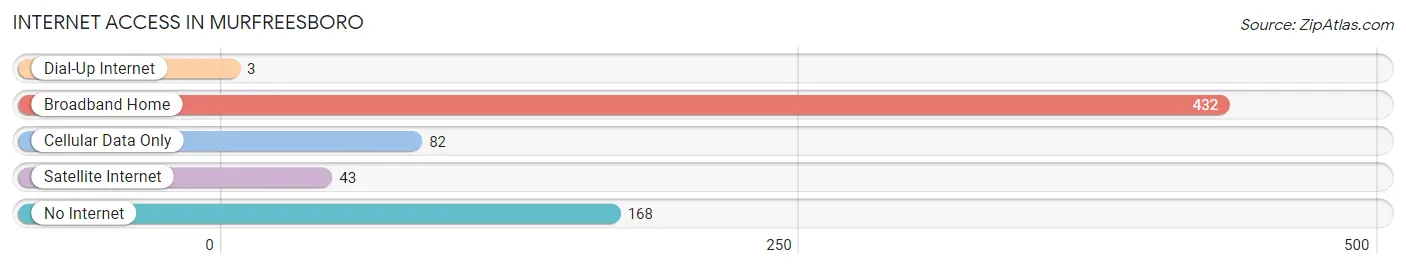
| Internet Type | # Households | % Households |
| Dial-Up Internet | 3 | 0.4% |
| Broadband Home | 432 | 61.9% |
| Cellular Data Only | 82 | 11.7% |
| Satellite Internet | 43 | 6.2% |
| No Internet | 168 | 24.1% |
| Total | 698 | 100.0% |
Murfreesboro Summary
Murfreesboro, Arkansas is a small town located in Pike County, Arkansas. It is situated in the foothills of the Ouachita Mountains, and is the county seat of Pike County. The town has a population of approximately 2,000 people, and is located about 90 miles southwest of Little Rock.
History
The area that is now Murfreesboro was first settled in the early 1800s by settlers from Tennessee. The town was originally known as "Crowley's Ridge", and was named after the local creek. In 1837, the town was renamed "Murfreesboro" after the town of Murfreesboro, Tennessee. The town was officially incorporated in 1848.
In the late 1800s, Murfreesboro was a thriving center of commerce and industry. The town was home to several sawmills, gristmills, and cotton gins. The town also had a thriving railroad industry, with several lines running through the town.
In the early 1900s, Murfreesboro was a popular tourist destination. The town was home to several resorts, including the famous "Hot Springs Hotel". The town was also home to several mineral springs, which were believed to have healing properties.
Geography
Murfreesboro is located in the foothills of the Ouachita Mountains. The town is situated on Crowley's Ridge, a narrow strip of land that runs through the area. The town is located about 90 miles southwest of Little Rock.
The climate in Murfreesboro is humid subtropical, with hot summers and mild winters. The average annual temperature is around 64°F, and the average annual precipitation is around 48 inches.
Economy
The economy of Murfreesboro is largely based on agriculture. The town is home to several farms, which produce a variety of crops, including cotton, soybeans, corn, and wheat. The town is also home to several poultry farms, which produce eggs and poultry products.
The town is also home to several small businesses, including restaurants, retail stores, and service providers. The town is also home to several manufacturing companies, which produce a variety of products, including furniture, clothing, and automotive parts.
Demographics
As of the 2010 census, the population of Murfreesboro was 2,000. The racial makeup of the town was 95.2% White, 0.7% African American, 0.3% Native American, 0.2% Asian, 0.1% Pacific Islander, and 3.5% from other races. The median household income was $30,000, and the median family income was $35,000.
Murfreesboro is home to several churches, including Baptist, Methodist, and Presbyterian. The town is also home to several schools, including Murfreesboro Elementary School, Murfreesboro High School, and Murfreesboro Middle School. The town is also home to several parks, including Crowley's Ridge State Park and Murfreesboro City Park.
Common Questions
What is the Total Population of Murfreesboro?
Total Population of Murfreesboro is 1,703.
What is the Total Male Population of Murfreesboro?
Total Male Population of Murfreesboro is 846.
What is the Total Female Population of Murfreesboro?
Total Female Population of Murfreesboro is 857.
What is the Ratio of Males per 100 Females in Murfreesboro?
There are 98.72 Males per 100 Females in Murfreesboro.
What is the Ratio of Females per 100 Males in Murfreesboro?
There are 101.30 Females per 100 Males in Murfreesboro.
What is the Median Population Age in Murfreesboro?
Median Population Age in Murfreesboro is 44.0 Years.
What is the Average Family Size in Murfreesboro
Average Family Size in Murfreesboro is 3.0 People.
What is the Average Household Size in Murfreesboro
Average Household Size in Murfreesboro is 2.3 People.
What is Per Capita Income in Murfreesboro?
Per Capita income in Murfreesboro is $22,241.
What is the Median Family Income in Murfreesboro?
Median Family Income in Murfreesboro is $58,810.
What is the Median Household income in Murfreesboro?
Median Household Income in Murfreesboro is $37,206.
What is Income or Wage Gap in Murfreesboro?
Income or Wage Gap in Murfreesboro is 46.6%.
Women in Murfreesboro earn 53.4 cents for every dollar earned by a man.
What is Family Income Deficit in Murfreesboro?
Family Income Deficit in Murfreesboro is $9,763.
Families that are below poverty line in Murfreesboro earn $9,763 less on average than the poverty threshold level.
What is Inequality or Gini Index in Murfreesboro?
Inequality or Gini Index in Murfreesboro is 0.45.
How Large is the Labor Force in Murfreesboro?
There are 747 People in the Labor Forcein in Murfreesboro.
What is the Percentage of People in the Labor Force in Murfreesboro?
54.5% of People are in the Labor Force in Murfreesboro.
What is the Unemployment Rate in Murfreesboro?
Unemployment Rate in Murfreesboro is 7.1%.