Guy, AR Map & Demographics
Guy Map
Guy Overview
$32,196
PER CAPITA INCOME
$72,440
AVG FAMILY INCOME
$70,000
AVG HOUSEHOLD INCOME
25.8%
WAGE / INCOME GAP [ % ]
74.2¢/ $1
WAGE / INCOME GAP [ $ ]
0.43
INEQUALITY / GINI INDEX
619
TOTAL POPULATION
328
MALE POPULATION
291
FEMALE POPULATION
112.71
MALES / 100 FEMALES
88.72
FEMALES / 100 MALES
39.0
MEDIAN AGE
3.0
AVG FAMILY SIZE
2.6
AVG HOUSEHOLD SIZE
287
LABOR FORCE [ PEOPLE ]
55.7%
PERCENT IN LABOR FORCE
10.8%
UNEMPLOYMENT RATE
Guy Zip Codes
Guy Area Codes
Income in Guy
Income Overview in Guy
Per Capita Income in Guy is $32,196, while median incomes of families and households are $72,440 and $70,000 respectively.
| Characteristic | Number | Measure |
| Per Capita Income | 619 | $32,196 |
| Median Family Income | 169 | $72,440 |
| Mean Family Income | 169 | $90,507 |
| Median Household Income | 240 | $70,000 |
| Mean Household Income | 240 | $77,269 |
| Income Deficit | 169 | $0 |
| Wage / Income Gap (%) | 619 | 25.82% |
| Wage / Income Gap ($) | 619 | 74.18¢ per $1 |
| Gini / Inequality Index | 619 | 0.43 |
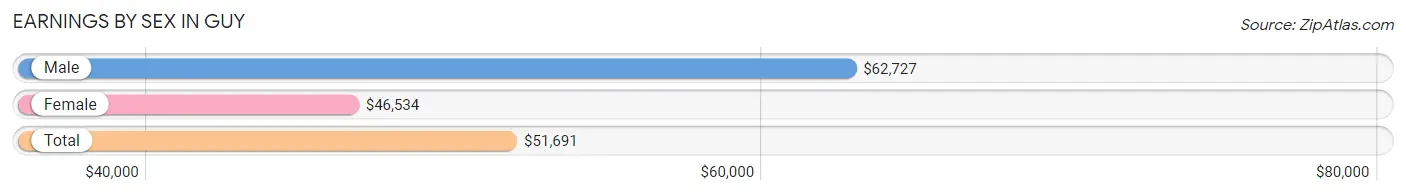
Earnings by Sex in Guy
Average Earnings in Guy are $51,691, $62,727 for men and $46,534 for women, a difference of 25.8%.
| Sex | Number | Average Earnings |
| Male | 144 (48.5%) | $62,727 |
| Female | 153 (51.5%) | $46,534 |
| Total | 297 (100.0%) | $51,691 |
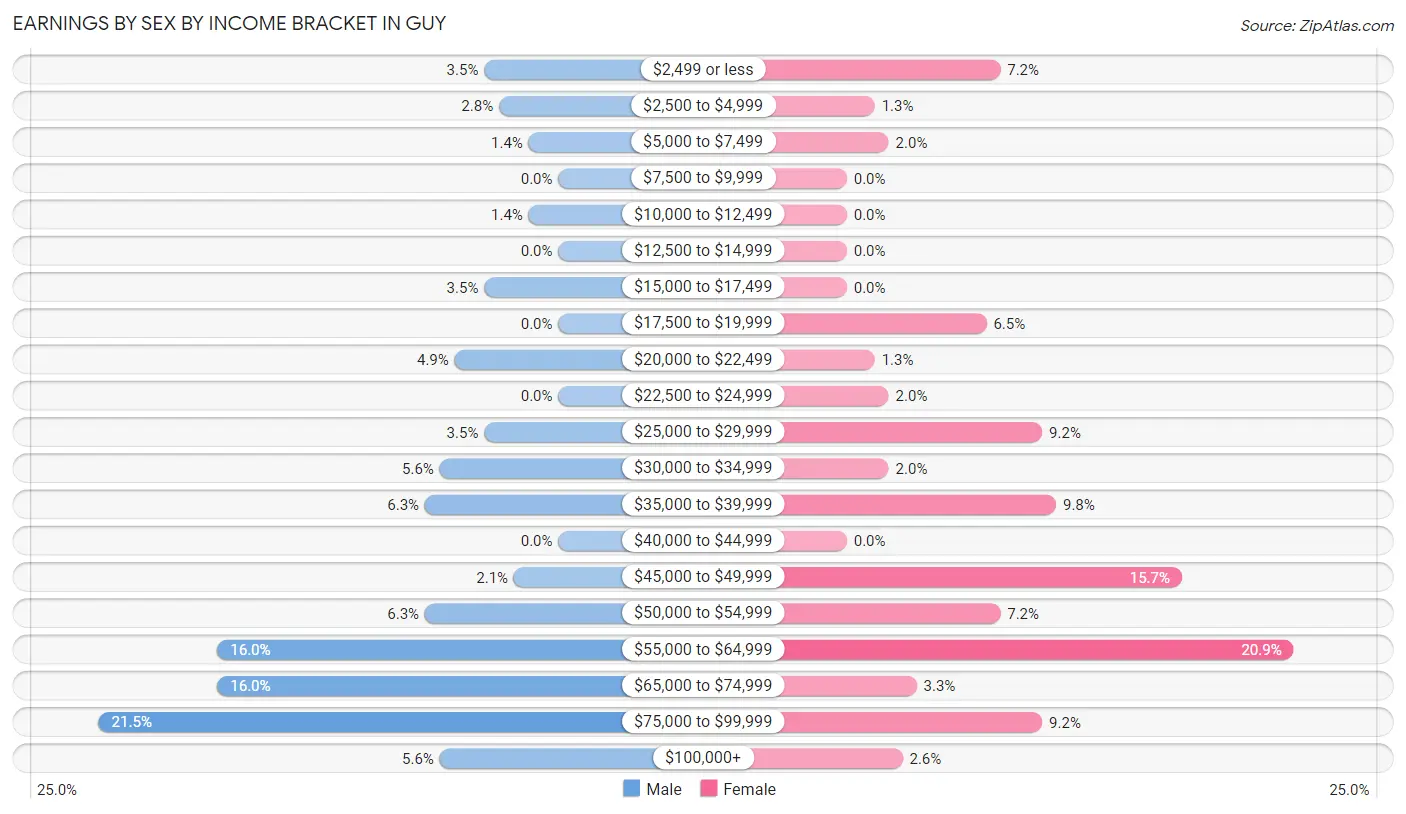
Earnings by Sex by Income Bracket in Guy
The most common earnings brackets in Guy are $75,000 to $99,999 for men (31 | 21.5%) and $55,000 to $64,999 for women (32 | 20.9%).
| Income | Male | Female |
| $2,499 or less | 5 (3.5%) | 11 (7.2%) |
| $2,500 to $4,999 | 4 (2.8%) | 2 (1.3%) |
| $5,000 to $7,499 | 2 (1.4%) | 3 (2.0%) |
| $7,500 to $9,999 | 0 (0.0%) | 0 (0.0%) |
| $10,000 to $12,499 | 2 (1.4%) | 0 (0.0%) |
| $12,500 to $14,999 | 0 (0.0%) | 0 (0.0%) |
| $15,000 to $17,499 | 5 (3.5%) | 0 (0.0%) |
| $17,500 to $19,999 | 0 (0.0%) | 10 (6.5%) |
| $20,000 to $22,499 | 7 (4.9%) | 2 (1.3%) |
| $22,500 to $24,999 | 0 (0.0%) | 3 (2.0%) |
| $25,000 to $29,999 | 5 (3.5%) | 14 (9.1%) |
| $30,000 to $34,999 | 8 (5.6%) | 3 (2.0%) |
| $35,000 to $39,999 | 9 (6.2%) | 15 (9.8%) |
| $40,000 to $44,999 | 0 (0.0%) | 0 (0.0%) |
| $45,000 to $49,999 | 3 (2.1%) | 24 (15.7%) |
| $50,000 to $54,999 | 9 (6.2%) | 11 (7.2%) |
| $55,000 to $64,999 | 23 (16.0%) | 32 (20.9%) |
| $65,000 to $74,999 | 23 (16.0%) | 5 (3.3%) |
| $75,000 to $99,999 | 31 (21.5%) | 14 (9.1%) |
| $100,000+ | 8 (5.6%) | 4 (2.6%) |
| Total | 144 (100.0%) | 153 (100.0%) |
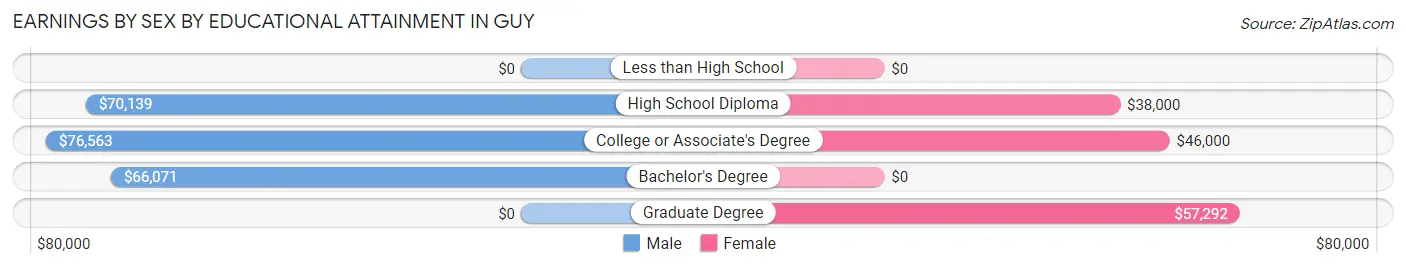
Earnings by Sex by Educational Attainment in Guy
Average earnings in Guy are $66,786 for men and $46,875 for women, a difference of 29.8%. Men with an educational attainment of college or associate's degree enjoy the highest average annual earnings of $76,563, while those with bachelor's degree education earn the least with $66,071. Women with an educational attainment of graduate degree earn the most with the average annual earnings of $57,292, while those with high school diploma education have the smallest earnings of $38,000.
| Educational Attainment | Male Income | Female Income |
| Less than High School | - | - |
| High School Diploma | $70,139 | $38,000 |
| College or Associate's Degree | $76,563 | $46,000 |
| Bachelor's Degree | $66,071 | $0 |
| Graduate Degree | - | - |
| Total | $66,786 | $46,875 |
Family Income in Guy
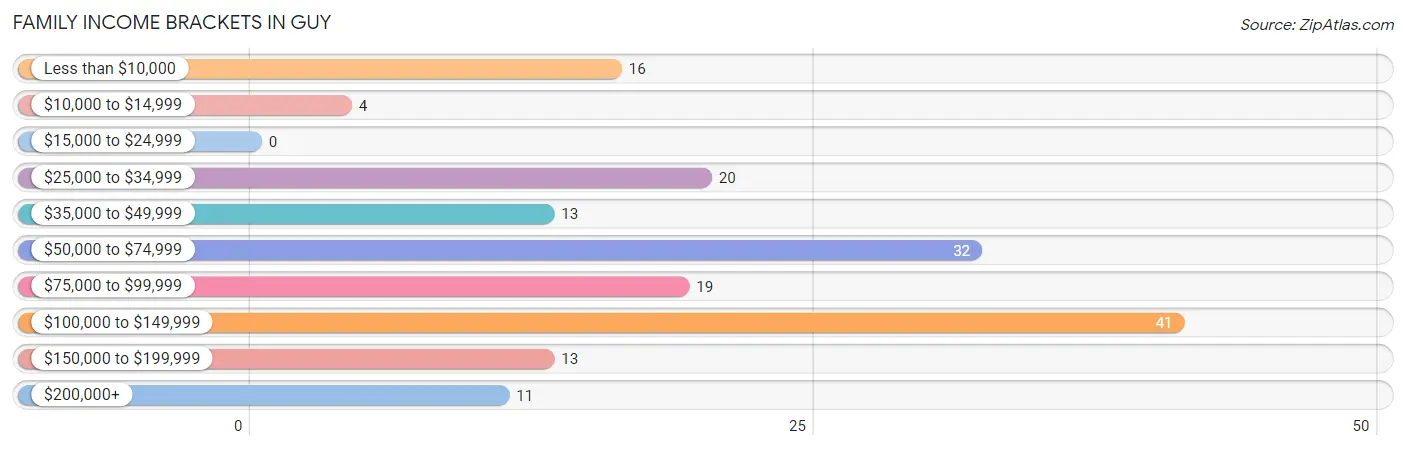
Family Income Brackets in Guy
According to the Guy family income data, there are 41 families falling into the $100,000 to $149,999 income range, which is the most common income bracket and makes up 24.3% of all families.
| Income Bracket | # Families | % Families |
| Less than $10,000 | 16 | 9.5% |
| $10,000 to $14,999 | 4 | 2.4% |
| $15,000 to $24,999 | 0 | 0.0% |
| $25,000 to $34,999 | 20 | 11.8% |
| $35,000 to $49,999 | 13 | 7.7% |
| $50,000 to $74,999 | 32 | 18.9% |
| $75,000 to $99,999 | 19 | 11.2% |
| $100,000 to $149,999 | 41 | 24.3% |
| $150,000 to $199,999 | 13 | 7.7% |
| $200,000+ | 11 | 6.5% |
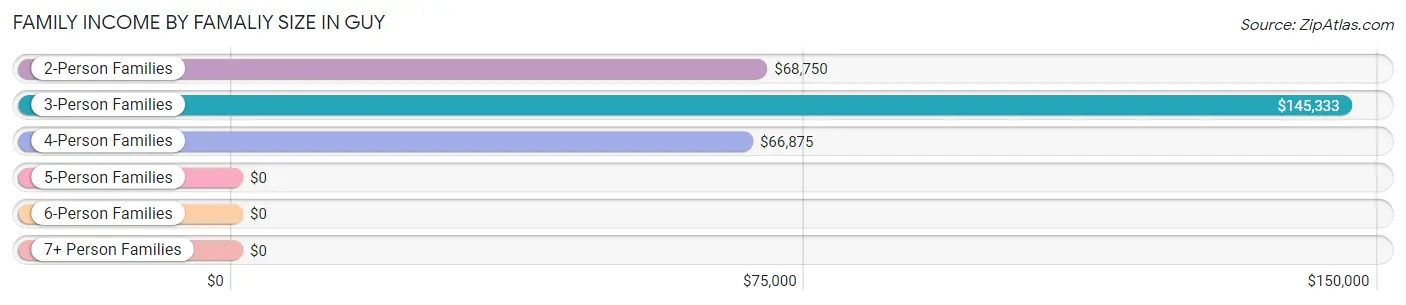
Family Income by Famaliy Size in Guy
3-person families (30 | 17.7%) account for the highest median family income in Guy with $145,333 per family, while 3-person families (30 | 17.7%) have the highest median income of $48,444 per family member.
| Income Bracket | # Families | Median Income |
| 2-Person Families | 99 (58.6%) | $68,750 |
| 3-Person Families | 30 (17.7%) | $145,333 |
| 4-Person Families | 11 (6.5%) | $66,875 |
| 5-Person Families | 24 (14.2%) | $0 |
| 6-Person Families | 5 (3.0%) | $0 |
| 7+ Person Families | 0 (0.0%) | $0 |
| Total | 169 (100.0%) | $72,440 |
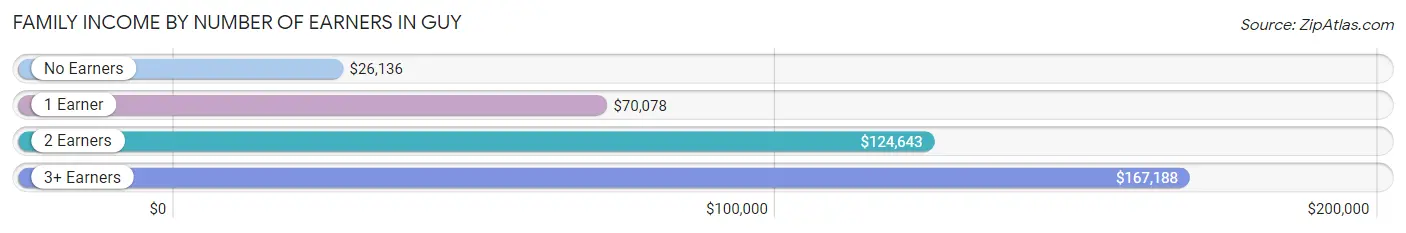
Family Income by Number of Earners in Guy
The median family income in Guy is $72,440, with families comprising 3+ earners (14) having the highest median family income of $167,188, while families with no earners (46) have the lowest median family income of $26,136, accounting for 8.3% and 27.2% of families, respectively.
| Number of Earners | # Families | Median Income |
| No Earners | 46 (27.2%) | $26,136 |
| 1 Earner | 37 (21.9%) | $70,078 |
| 2 Earners | 72 (42.6%) | $124,643 |
| 3+ Earners | 14 (8.3%) | $167,188 |
| Total | 169 (100.0%) | $72,440 |
Household Income in Guy
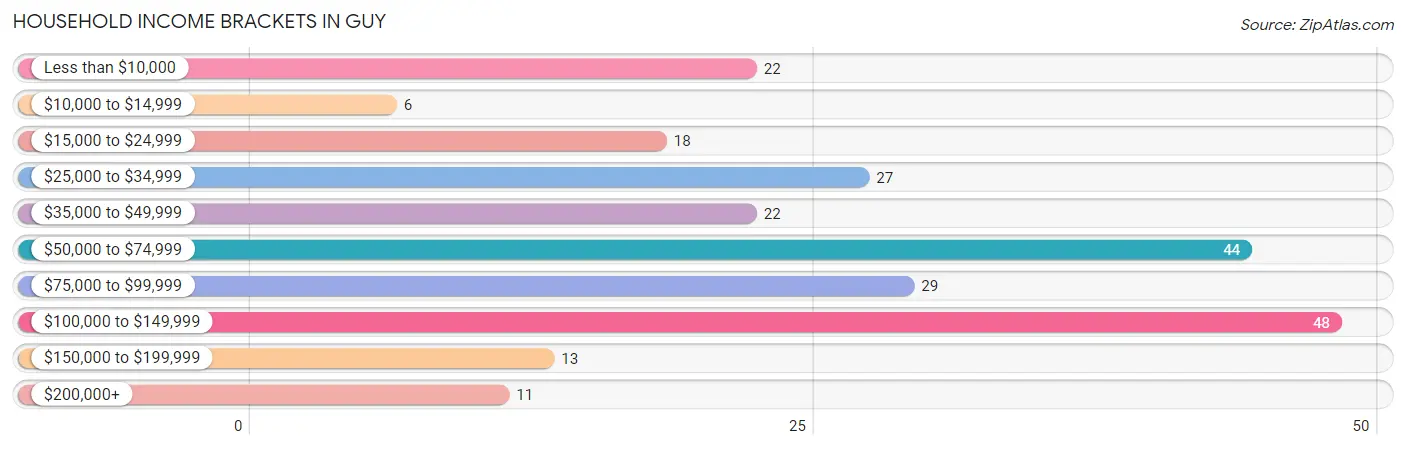
Household Income Brackets in Guy
With 48 households falling in the category, the $100,000 to $149,999 income range is the most frequent in Guy, accounting for 20.0% of all households. In contrast, only 6 households (2.5%) fall into the $10,000 to $14,999 income bracket, making it the least populous group.
| Income Bracket | # Households | % Households |
| Less than $10,000 | 22 | 9.2% |
| $10,000 to $14,999 | 6 | 2.5% |
| $15,000 to $24,999 | 18 | 7.5% |
| $25,000 to $34,999 | 27 | 11.3% |
| $35,000 to $49,999 | 22 | 9.2% |
| $50,000 to $74,999 | 44 | 18.3% |
| $75,000 to $99,999 | 29 | 12.1% |
| $100,000 to $149,999 | 48 | 20.0% |
| $150,000 to $199,999 | 13 | 5.4% |
| $200,000+ | 11 | 4.6% |
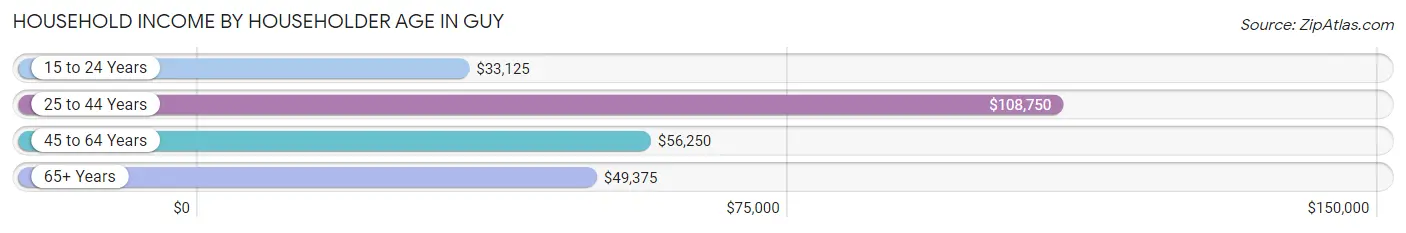
Household Income by Householder Age in Guy
The median household income in Guy is $70,000, with the highest median household income of $108,750 found in the 25 to 44 years age bracket for the primary householder. A total of 73 households (30.4%) fall into this category. Meanwhile, the 15 to 24 years age bracket for the primary householder has the lowest median household income of $33,125, with 22 households (9.2%) in this group.
| Income Bracket | # Households | Median Income |
| 15 to 24 Years | 22 (9.2%) | $33,125 |
| 25 to 44 Years | 73 (30.4%) | $108,750 |
| 45 to 64 Years | 68 (28.3%) | $56,250 |
| 65+ Years | 77 (32.1%) | $49,375 |
| Total | 240 (100.0%) | $70,000 |
Poverty in Guy
Income Below Poverty by Sex and Age in Guy
With 24.1% poverty level for males and 12.7% for females among the residents of Guy, 65 to 74 year old males and 5 year old females are the most vulnerable to poverty, with 36 males (52.2%) and 2 females (100.0%) in their respective age groups living below the poverty level.
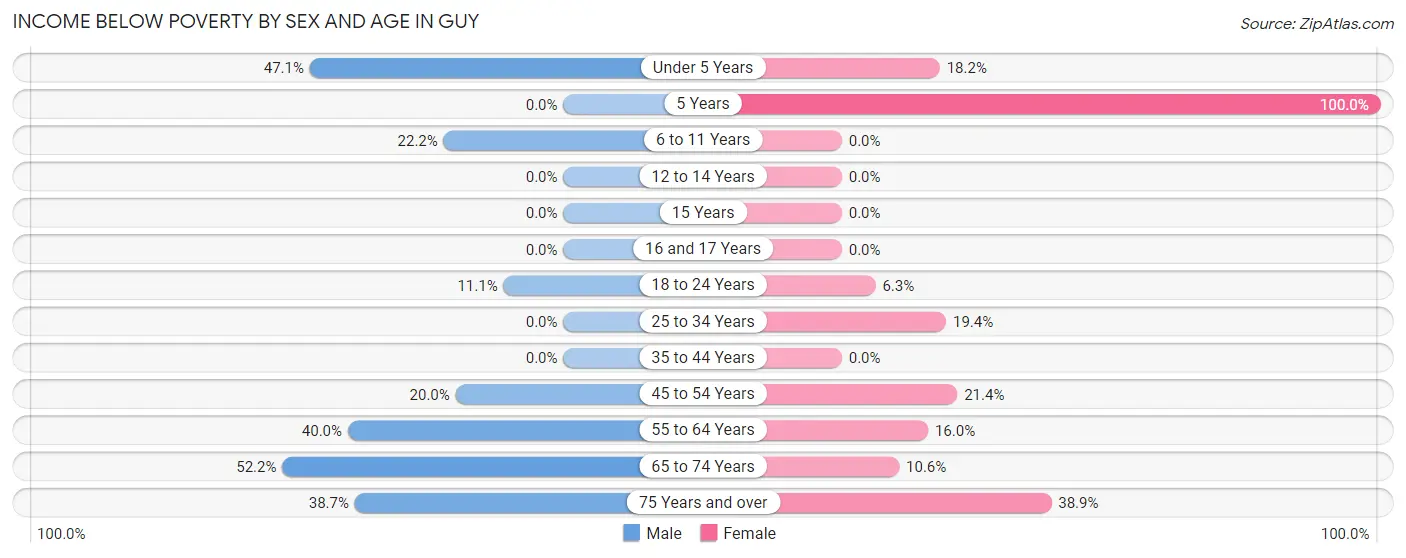
| Age Bracket | Male | Female |
| Under 5 Years | 8 (47.1%) | 2 (18.2%) |
| 5 Years | 0 (0.0%) | 2 (100.0%) |
| 6 to 11 Years | 6 (22.2%) | 0 (0.0%) |
| 12 to 14 Years | 0 (0.0%) | 0 (0.0%) |
| 15 Years | 0 (0.0%) | 0 (0.0%) |
| 16 and 17 Years | 0 (0.0%) | 0 (0.0%) |
| 18 to 24 Years | 4 (11.1%) | 2 (6.2%) |
| 25 to 34 Years | 0 (0.0%) | 6 (19.4%) |
| 35 to 44 Years | 0 (0.0%) | 0 (0.0%) |
| 45 to 54 Years | 7 (20.0%) | 9 (21.4%) |
| 55 to 64 Years | 6 (40.0%) | 4 (16.0%) |
| 65 to 74 Years | 36 (52.2%) | 5 (10.6%) |
| 75 Years and over | 12 (38.7%) | 7 (38.9%) |
| Total | 79 (24.1%) | 37 (12.7%) |
Income Above Poverty by Sex and Age in Guy
According to the poverty statistics in Guy, males aged 5 years and females aged 6 to 11 years are the age groups that are most secure financially, with 100.0% of males and 100.0% of females in these age groups living above the poverty line.
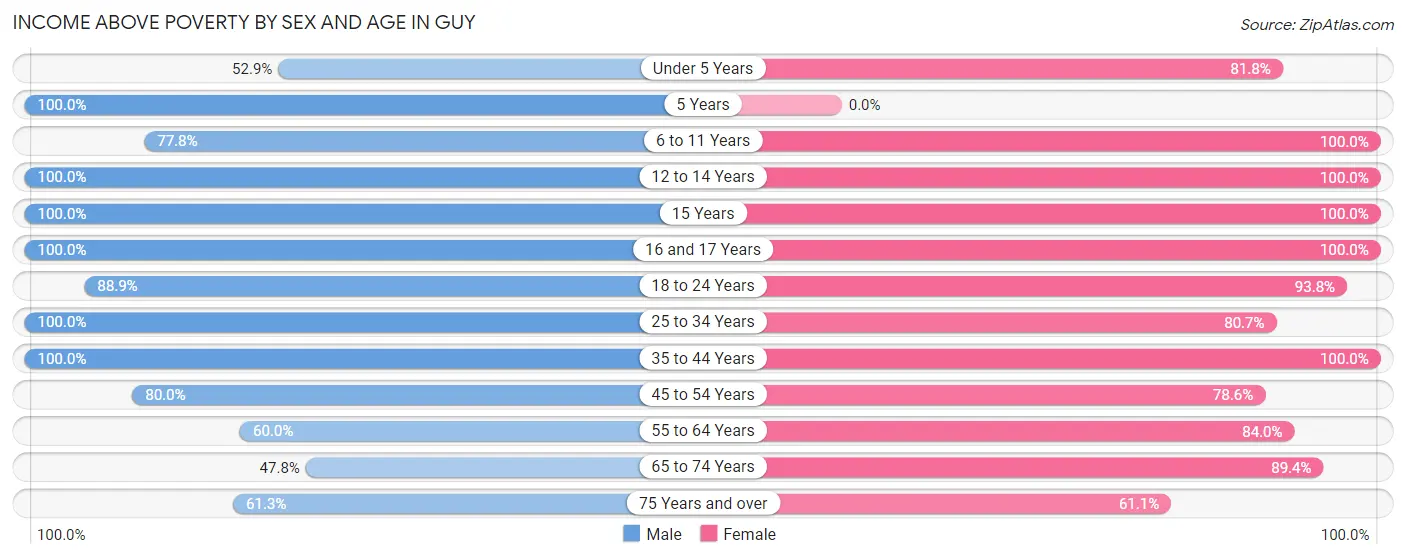
| Age Bracket | Male | Female |
| Under 5 Years | 9 (52.9%) | 9 (81.8%) |
| 5 Years | 6 (100.0%) | 0 (0.0%) |
| 6 to 11 Years | 21 (77.8%) | 12 (100.0%) |
| 12 to 14 Years | 11 (100.0%) | 7 (100.0%) |
| 15 Years | 6 (100.0%) | 5 (100.0%) |
| 16 and 17 Years | 6 (100.0%) | 11 (100.0%) |
| 18 to 24 Years | 32 (88.9%) | 30 (93.8%) |
| 25 to 34 Years | 22 (100.0%) | 25 (80.6%) |
| 35 to 44 Years | 47 (100.0%) | 48 (100.0%) |
| 45 to 54 Years | 28 (80.0%) | 33 (78.6%) |
| 55 to 64 Years | 9 (60.0%) | 21 (84.0%) |
| 65 to 74 Years | 33 (47.8%) | 42 (89.4%) |
| 75 Years and over | 19 (61.3%) | 11 (61.1%) |
| Total | 249 (75.9%) | 254 (87.3%) |
Income Below Poverty Among Married-Couple Families in Guy
The poverty statistics for married-couple families in Guy show that 5.0% or 6 of the total 119 families live below the poverty line. Families with 3 or 4 children have the highest poverty rate of 20.0%, comprising of 2 families. On the other hand, families with 1 or 2 children have the lowest poverty rate of 0.0%, which includes 0 families.
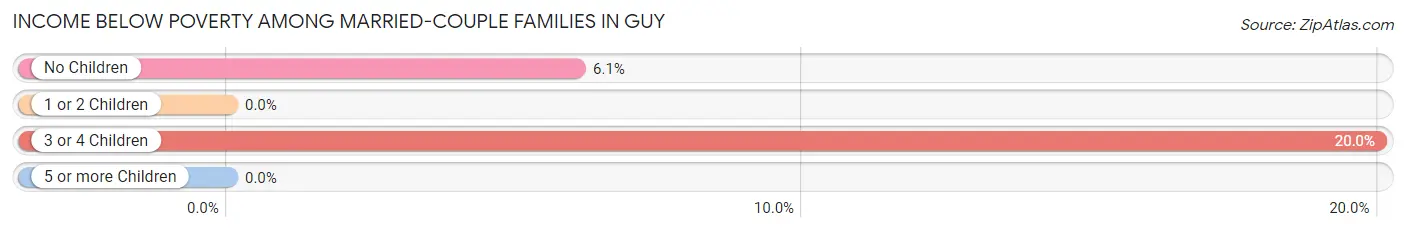
| Children | Above Poverty | Below Poverty |
| No Children | 62 (93.9%) | 4 (6.1%) |
| 1 or 2 Children | 43 (100.0%) | 0 (0.0%) |
| 3 or 4 Children | 8 (80.0%) | 2 (20.0%) |
| 5 or more Children | 0 (0.0%) | 0 (0.0%) |
| Total | 113 (95.0%) | 6 (5.0%) |
Income Below Poverty Among Single-Parent Households in Guy
According to the poverty data in Guy, 87.5% or 14 single-father households and 11.8% or 4 single-mother households are living below the poverty line. Among single-father households, those with no children have the highest poverty rate, with 14 households (100.0%) experiencing poverty. Likewise, among single-mother households, those with 3 or 4 children have the highest poverty rate, with 4 households (100.0%) falling below the poverty line.
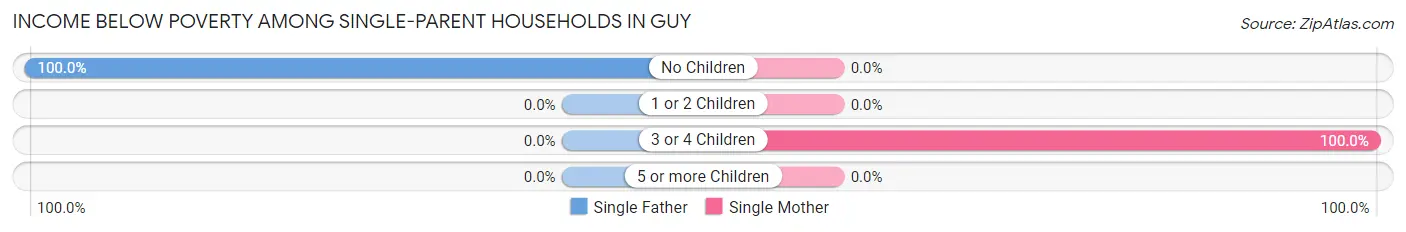
| Children | Single Father | Single Mother |
| No Children | 14 (100.0%) | 0 (0.0%) |
| 1 or 2 Children | 0 (0.0%) | 0 (0.0%) |
| 3 or 4 Children | 0 (0.0%) | 4 (100.0%) |
| 5 or more Children | 0 (0.0%) | 0 (0.0%) |
| Total | 14 (87.5%) | 4 (11.8%) |
Income Below Poverty Among Married-Couple vs Single-Parent Households in Guy
The poverty data for Guy shows that 6 of the married-couple family households (5.0%) and 18 of the single-parent households (36.0%) are living below the poverty level. Within the married-couple family households, those with 3 or 4 children have the highest poverty rate, with 2 households (20.0%) falling below the poverty line. Among the single-parent households, those with 3 or 4 children have the highest poverty rate, with 4 household (100.0%) living below poverty.
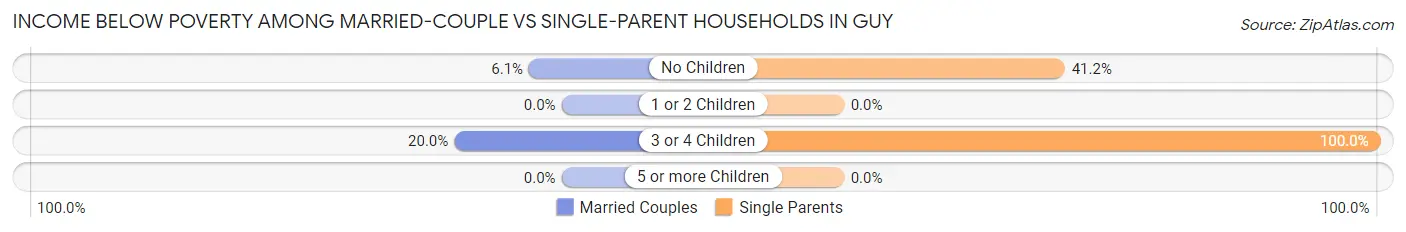
| Children | Married-Couple Families | Single-Parent Households |
| No Children | 4 (6.1%) | 14 (41.2%) |
| 1 or 2 Children | 0 (0.0%) | 0 (0.0%) |
| 3 or 4 Children | 2 (20.0%) | 4 (100.0%) |
| 5 or more Children | 0 (0.0%) | 0 (0.0%) |
| Total | 6 (5.0%) | 18 (36.0%) |
Race in Guy
The most populous races in Guy are White / Caucasian (554 | 89.5%), Native / Alaskan (36 | 5.8%), and Two or more Races (28 | 4.5%).
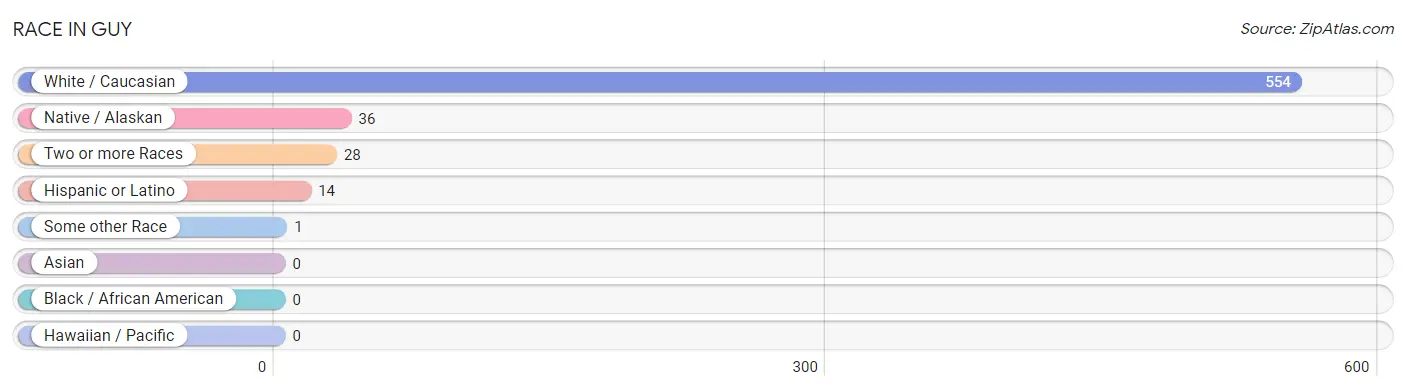
| Race | # Population | % Population |
| Asian | 0 | 0.0% |
| Black / African American | 0 | 0.0% |
| Hawaiian / Pacific | 0 | 0.0% |
| Hispanic or Latino | 14 | 2.3% |
| Native / Alaskan | 36 | 5.8% |
| White / Caucasian | 554 | 89.5% |
| Two or more Races | 28 | 4.5% |
| Some other Race | 1 | 0.2% |
| Total | 619 | 100.0% |
Ancestry in Guy
The most populous ancestries reported in Guy are English (42 | 6.8%), Cherokee (40 | 6.5%), Irish (40 | 6.5%), German (32 | 5.2%), and Scotch-Irish (30 | 4.9%), together accounting for 29.7% of all Guy residents.
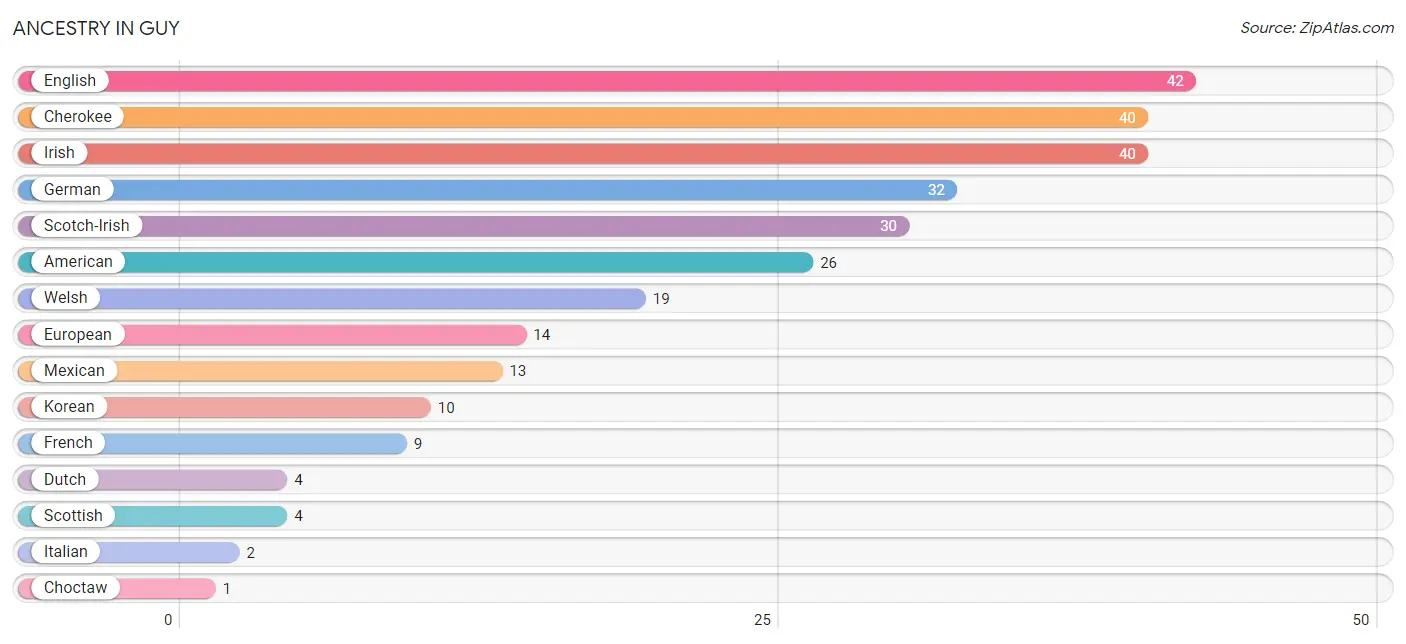
| Ancestry | # Population | % Population |
| American | 26 | 4.2% |
| Cherokee | 40 | 6.5% |
| Choctaw | 1 | 0.2% |
| Dutch | 4 | 0.6% |
| English | 42 | 6.8% |
| European | 14 | 2.3% |
| French | 9 | 1.5% |
| German | 32 | 5.2% |
| Irish | 40 | 6.5% |
| Italian | 2 | 0.3% |
| Korean | 10 | 1.6% |
| Mexican | 13 | 2.1% |
| Puerto Rican | 1 | 0.2% |
| Scandinavian | 1 | 0.2% |
| Scotch-Irish | 30 | 4.9% |
| Scottish | 4 | 0.6% |
| Welsh | 19 | 3.1% | View All 17 Rows |
Immigrants in Guy
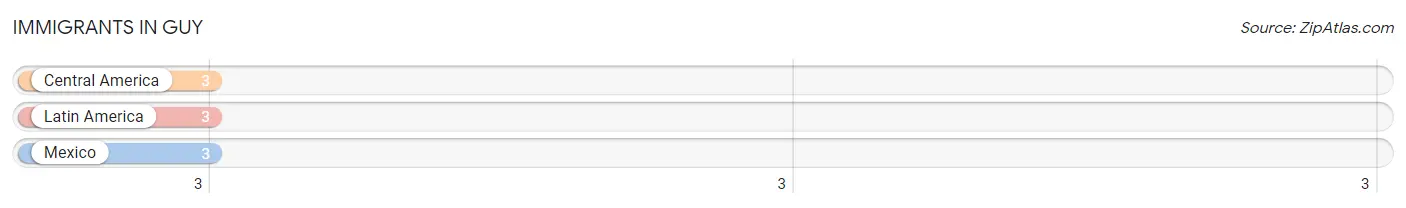
The most numerous immigrant groups reported in Guy came from Central America (3 | 0.5%), Latin America (3 | 0.5%), and Mexico (3 | 0.5%), together accounting for 1.4% of all Guy residents.
| Immigration Origin | # Population | % Population |
| Central America | 3 | 0.5% |
| Latin America | 3 | 0.5% |
| Mexico | 3 | 0.5% | View All 3 Rows |
Sex and Age in Guy
Sex and Age in Guy
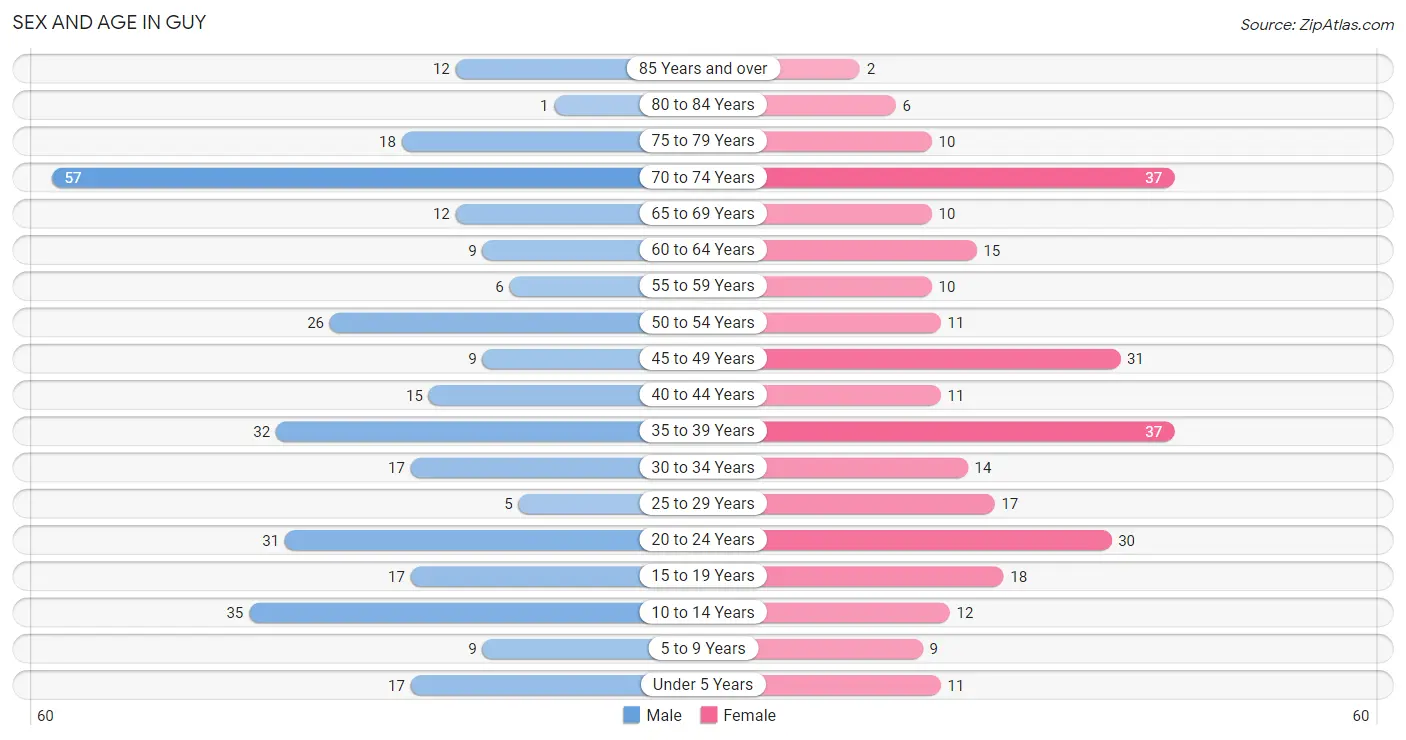
The most populous age groups in Guy are 70 to 74 Years (57 | 17.4%) for men and 35 to 39 Years (37 | 12.7%) for women.
| Age Bracket | Male | Female |
| Under 5 Years | 17 (5.2%) | 11 (3.8%) |
| 5 to 9 Years | 9 (2.7%) | 9 (3.1%) |
| 10 to 14 Years | 35 (10.7%) | 12 (4.1%) |
| 15 to 19 Years | 17 (5.2%) | 18 (6.2%) |
| 20 to 24 Years | 31 (9.5%) | 30 (10.3%) |
| 25 to 29 Years | 5 (1.5%) | 17 (5.8%) |
| 30 to 34 Years | 17 (5.2%) | 14 (4.8%) |
| 35 to 39 Years | 32 (9.8%) | 37 (12.7%) |
| 40 to 44 Years | 15 (4.6%) | 11 (3.8%) |
| 45 to 49 Years | 9 (2.7%) | 31 (10.6%) |
| 50 to 54 Years | 26 (7.9%) | 11 (3.8%) |
| 55 to 59 Years | 6 (1.8%) | 10 (3.4%) |
| 60 to 64 Years | 9 (2.7%) | 15 (5.1%) |
| 65 to 69 Years | 12 (3.7%) | 10 (3.4%) |
| 70 to 74 Years | 57 (17.4%) | 37 (12.7%) |
| 75 to 79 Years | 18 (5.5%) | 10 (3.4%) |
| 80 to 84 Years | 1 (0.3%) | 6 (2.1%) |
| 85 Years and over | 12 (3.7%) | 2 (0.7%) |
| Total | 328 (100.0%) | 291 (100.0%) |
Families and Households in Guy
Median Family Size in Guy
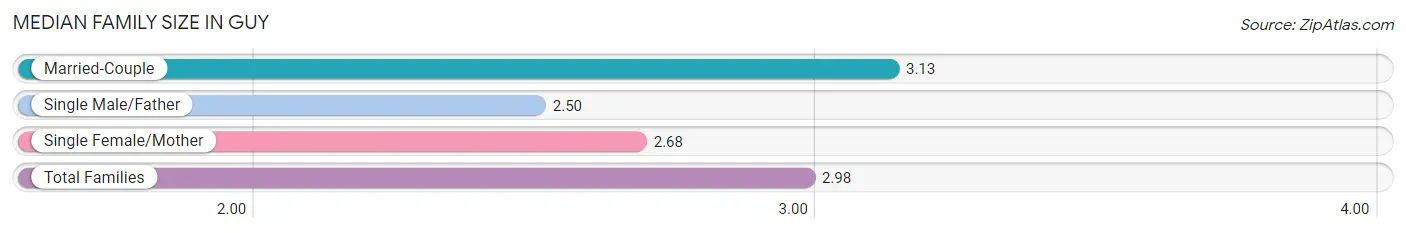
The median family size in Guy is 2.98 persons per family, with married-couple families (119 | 70.4%) accounting for the largest median family size of 3.13 persons per family. On the other hand, single male/father families (16 | 9.5%) represent the smallest median family size with 2.50 persons per family.
| Family Type | # Families | Family Size |
| Married-Couple | 119 (70.4%) | 3.13 |
| Single Male/Father | 16 (9.5%) | 2.50 |
| Single Female/Mother | 34 (20.1%) | 2.68 |
| Total Families | 169 (100.0%) | 2.98 |
Median Household Size in Guy
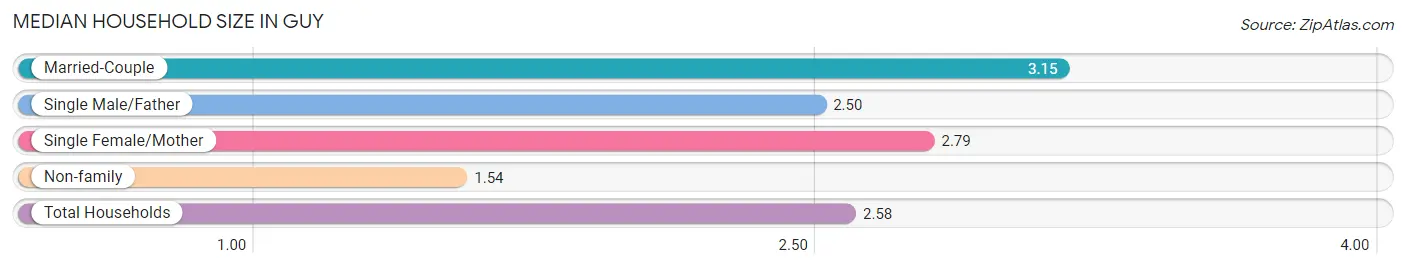
The median household size in Guy is 2.58 persons per household, with married-couple households (119 | 49.6%) accounting for the largest median household size of 3.15 persons per household. non-family households (71 | 29.6%) represent the smallest median household size with 1.54 persons per household.
| Household Type | # Households | Household Size |
| Married-Couple | 119 (49.6%) | 3.15 |
| Single Male/Father | 16 (6.7%) | 2.50 |
| Single Female/Mother | 34 (14.2%) | 2.79 |
| Non-family | 71 (29.6%) | 1.54 |
| Total Households | 240 (100.0%) | 2.58 |
Household Size by Marriage Status in Guy
Out of a total of 240 households in Guy, 169 (70.4%) are family households, while 71 (29.6%) are nonfamily households. The most numerous type of family households are 2-person households, comprising 99, and the most common type of nonfamily households are 1-person households, comprising 68.
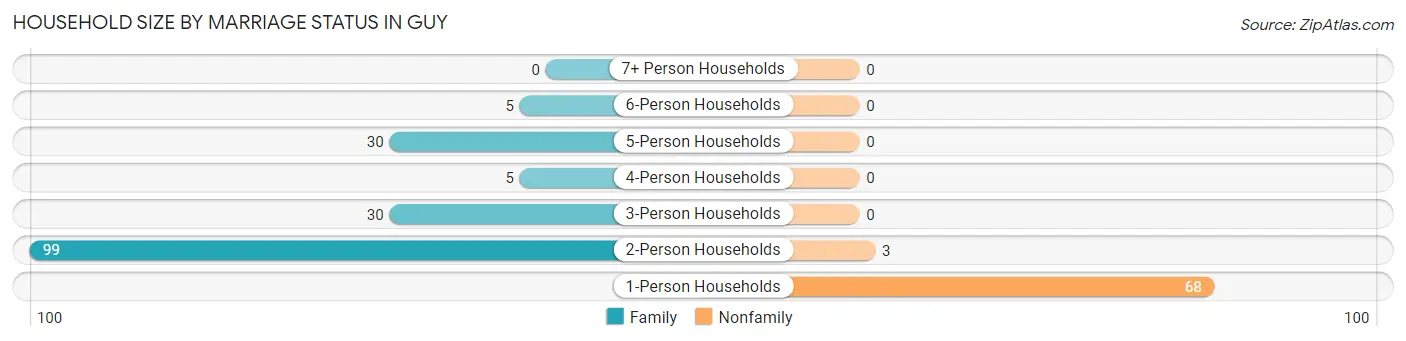
| Household Size | Family Households | Nonfamily Households |
| 1-Person Households | - | 68 (28.3%) |
| 2-Person Households | 99 (41.2%) | 3 (1.3%) |
| 3-Person Households | 30 (12.5%) | 0 (0.0%) |
| 4-Person Households | 5 (2.1%) | 0 (0.0%) |
| 5-Person Households | 30 (12.5%) | 0 (0.0%) |
| 6-Person Households | 5 (2.1%) | 0 (0.0%) |
| 7+ Person Households | 0 (0.0%) | 0 (0.0%) |
| Total | 169 (70.4%) | 71 (29.6%) |
Female Fertility in Guy
Fertility by Age in Guy
Average fertility rate in Guy is 25.0 births per 1,000 women. Women in the age bracket of 20 to 34 years have the highest fertility rate with 66.0 births per 1,000 women. Women in the age bracket of 20 to 34 years acount for 100.0% of all women with births.
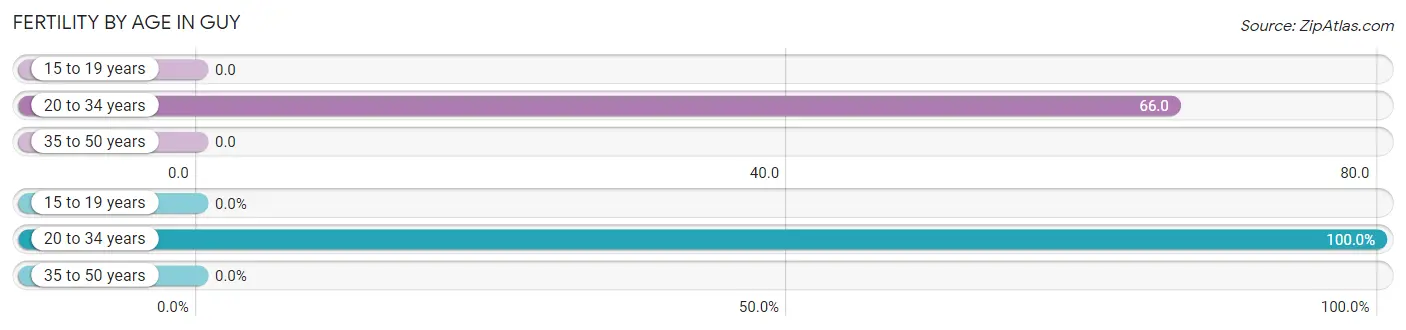
| Age Bracket | Women with Births | Births / 1,000 Women |
| 15 to 19 years | 0 (0.0%) | 0.0 |
| 20 to 34 years | 4 (100.0%) | 66.0 |
| 35 to 50 years | 0 (0.0%) | 0.0 |
| Total | 4 (100.0%) | 25.0 |
Fertility by Age by Marriage Status in Guy
50.0% of women with births (4) in Guy are married. The highest percentage of unmarried women with births falls into 20 to 34 years age bracket with 50.0% of them unmarried at the time of birth, while the lowest percentage of unmarried women with births belong to 20 to 34 years age bracket with 50.0% of them unmarried.
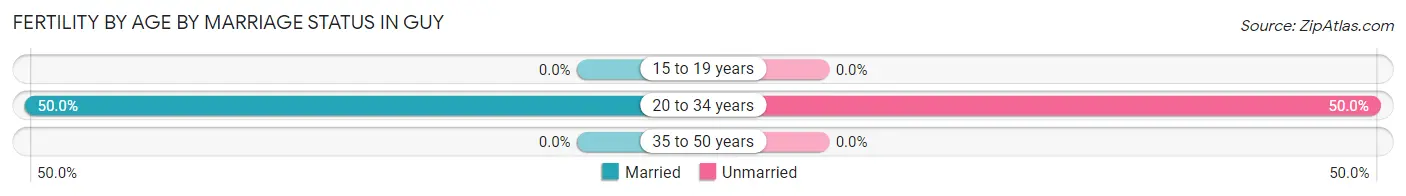
| Age Bracket | Married | Unmarried |
| 15 to 19 years | 0 (0.0%) | 0 (0.0%) |
| 20 to 34 years | 2 (50.0%) | 2 (50.0%) |
| 35 to 50 years | 0 (0.0%) | 0 (0.0%) |
| Total | 2 (50.0%) | 2 (50.0%) |
Fertility by Education in Guy
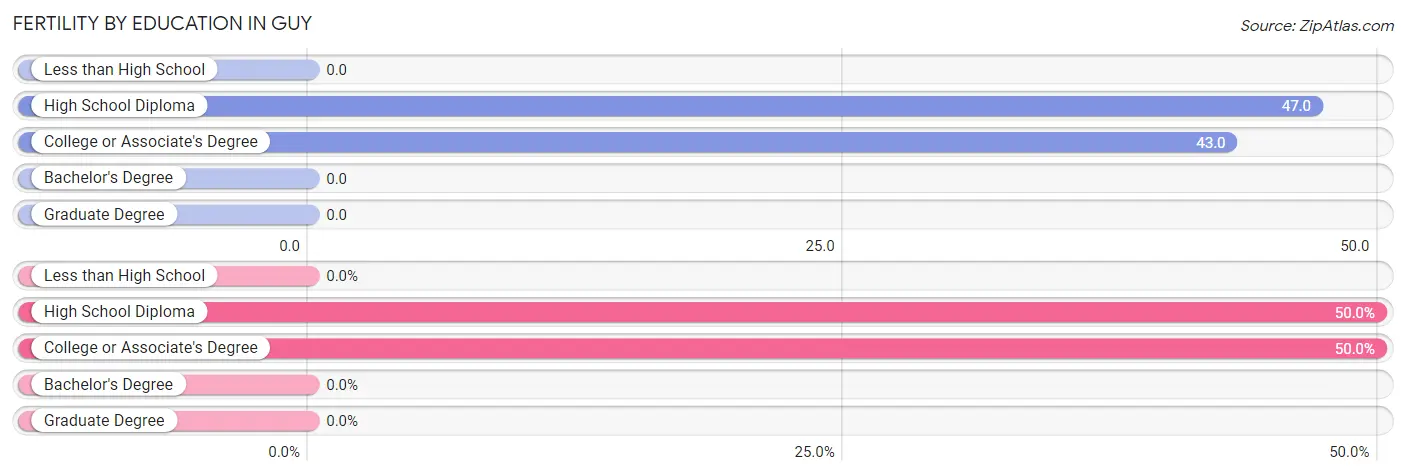
| Educational Attainment | Women with Births | Births / 1,000 Women |
| Less than High School | 0 (0.0%) | 0.0 |
| High School Diploma | 2 (50.0%) | 47.0 |
| College or Associate's Degree | 2 (50.0%) | 43.0 |
| Bachelor's Degree | 0 (0.0%) | 0.0 |
| Graduate Degree | 0 (0.0%) | 0.0 |
| Total | 4 (100.0%) | 25.0 |
Fertility by Education by Marriage Status in Guy
50.0% of women with births in Guy are unmarried. Women with the educational attainment of college or associate's degree are most likely to be married with 100.0% of them married at childbirth, while women with the educational attainment of high school diploma are least likely to be married with 100.0% of them unmarried at childbirth.
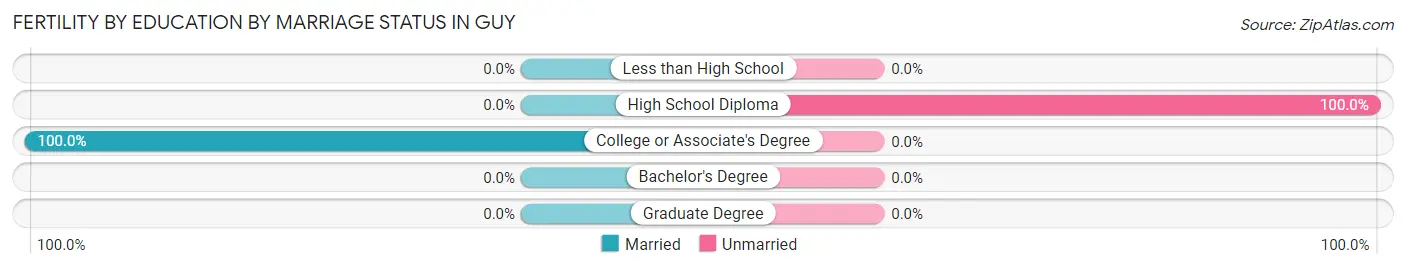
| Educational Attainment | Married | Unmarried |
| Less than High School | 0 (0.0%) | 0 (0.0%) |
| High School Diploma | 0 (0.0%) | 2 (100.0%) |
| College or Associate's Degree | 2 (100.0%) | 0 (0.0%) |
| Bachelor's Degree | 0 (0.0%) | 0 (0.0%) |
| Graduate Degree | 0 (0.0%) | 0 (0.0%) |
| Total | 2 (50.0%) | 2 (50.0%) |
Employment Characteristics in Guy
Employment by Class of Employer in Guy
Among the 255 employed individuals in Guy, private company employees (175 | 68.6%), local government employees (40 | 15.7%), and not-for-profit organizations (30 | 11.8%) make up the most common classes of employment.
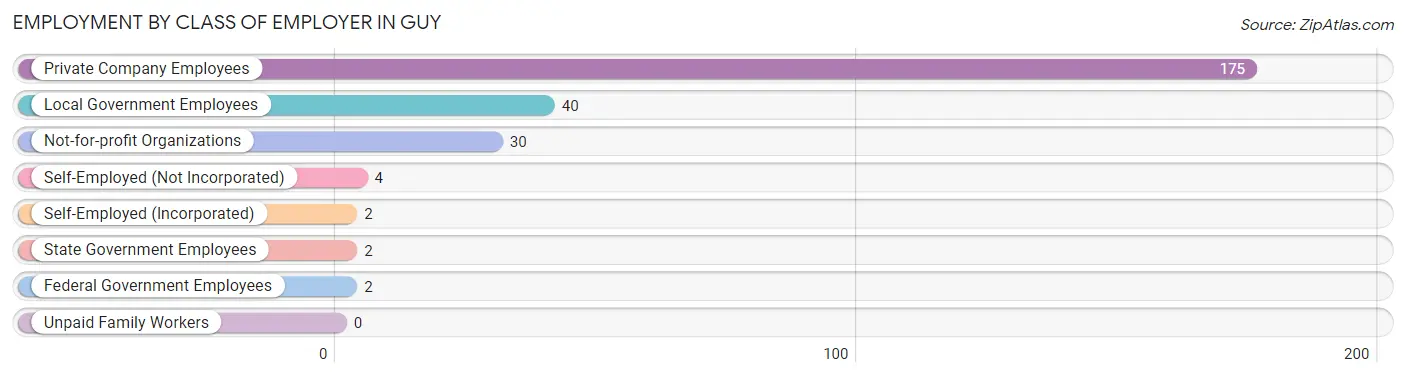
| Employer Class | # Employees | % Employees |
| Private Company Employees | 175 | 68.6% |
| Self-Employed (Incorporated) | 2 | 0.8% |
| Self-Employed (Not Incorporated) | 4 | 1.6% |
| Not-for-profit Organizations | 30 | 11.8% |
| Local Government Employees | 40 | 15.7% |
| State Government Employees | 2 | 0.8% |
| Federal Government Employees | 2 | 0.8% |
| Unpaid Family Workers | 0 | 0.0% |
| Total | 255 | 100.0% |
Employment Status by Age in Guy
According to the labor force statistics for Guy, out of the total population over 16 years of age (515), 55.7% or 287 individuals are in the labor force, with 10.8% or 31 of them unemployed. The age group with the highest labor force participation rate is 35 to 44 years, with 100.0% or 95 individuals in the labor force. Within the labor force, the 35 to 44 years age range has the highest percentage of unemployed individuals, with 23.2% or 22 of them being unemployed.
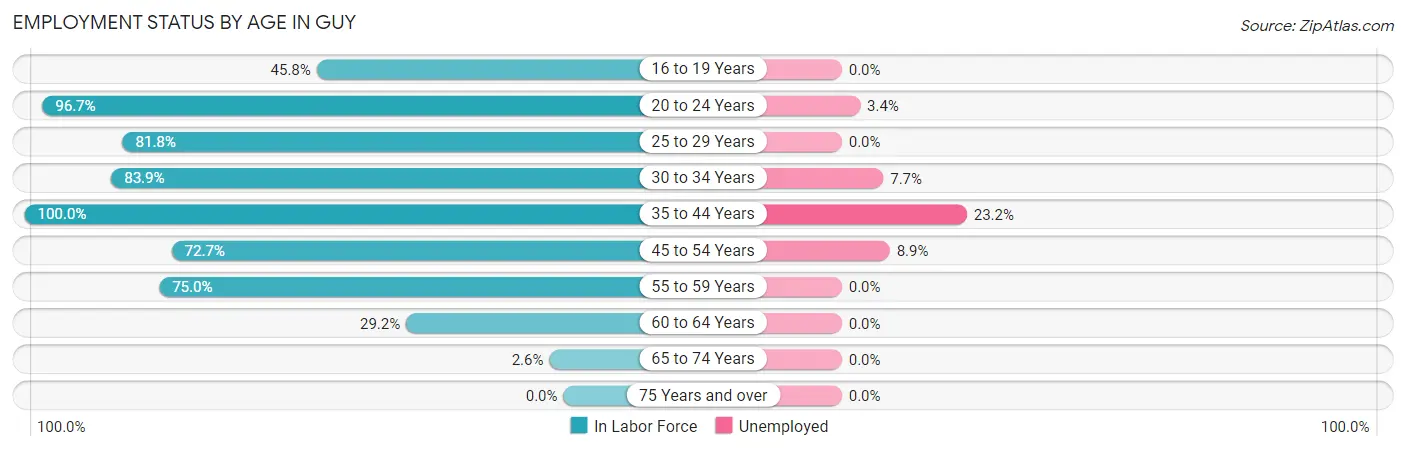
| Age Bracket | In Labor Force | Unemployed |
| 16 to 19 Years | 11 (45.8%) | 0 (0.0%) |
| 20 to 24 Years | 59 (96.7%) | 2 (3.4%) |
| 25 to 29 Years | 18 (81.8%) | 0 (0.0%) |
| 30 to 34 Years | 26 (83.9%) | 2 (7.7%) |
| 35 to 44 Years | 95 (100.0%) | 22 (23.2%) |
| 45 to 54 Years | 56 (72.7%) | 5 (8.9%) |
| 55 to 59 Years | 12 (75.0%) | 0 (0.0%) |
| 60 to 64 Years | 7 (29.2%) | 0 (0.0%) |
| 65 to 74 Years | 3 (2.6%) | 0 (0.0%) |
| 75 Years and over | 0 (0.0%) | 0 (0.0%) |
| Total | 287 (55.7%) | 31 (10.8%) |
Employment Status by Educational Attainment in Guy
According to labor force statistics for Guy, 80.8% of individuals (214) out of the total population between 25 and 64 years of age (265) are in the labor force, with 13.6% or 29 of them being unemployed. The group with the highest labor force participation rate are those with the educational attainment of college / associate degree, with 93.3% or 83 individuals in the labor force. Within the labor force, individuals with college / associate degree education have the highest percentage of unemployment, with 18.1% or 15 of them being unemployed.
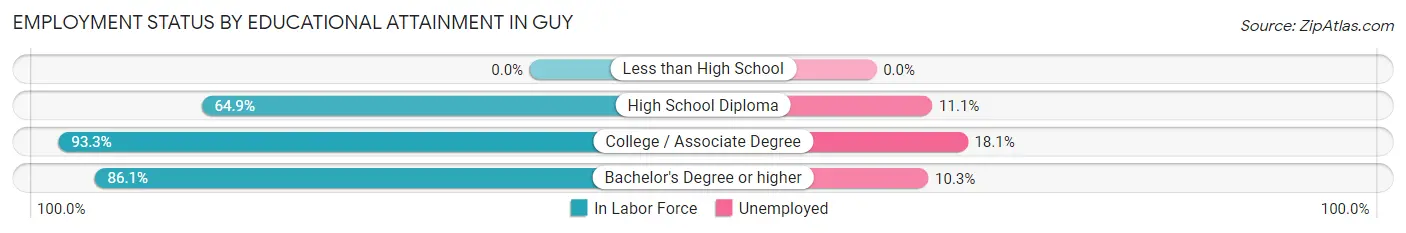
| Educational Attainment | In Labor Force | Unemployed |
| Less than High School | 0 (0.0%) | 0 (0.0%) |
| High School Diploma | 63 (64.9%) | 11 (11.1%) |
| College / Associate Degree | 83 (93.3%) | 16 (18.1%) |
| Bachelor's Degree or higher | 68 (86.1%) | 8 (10.3%) |
| Total | 214 (80.8%) | 36 (13.6%) |
Employment Occupations by Sex in Guy
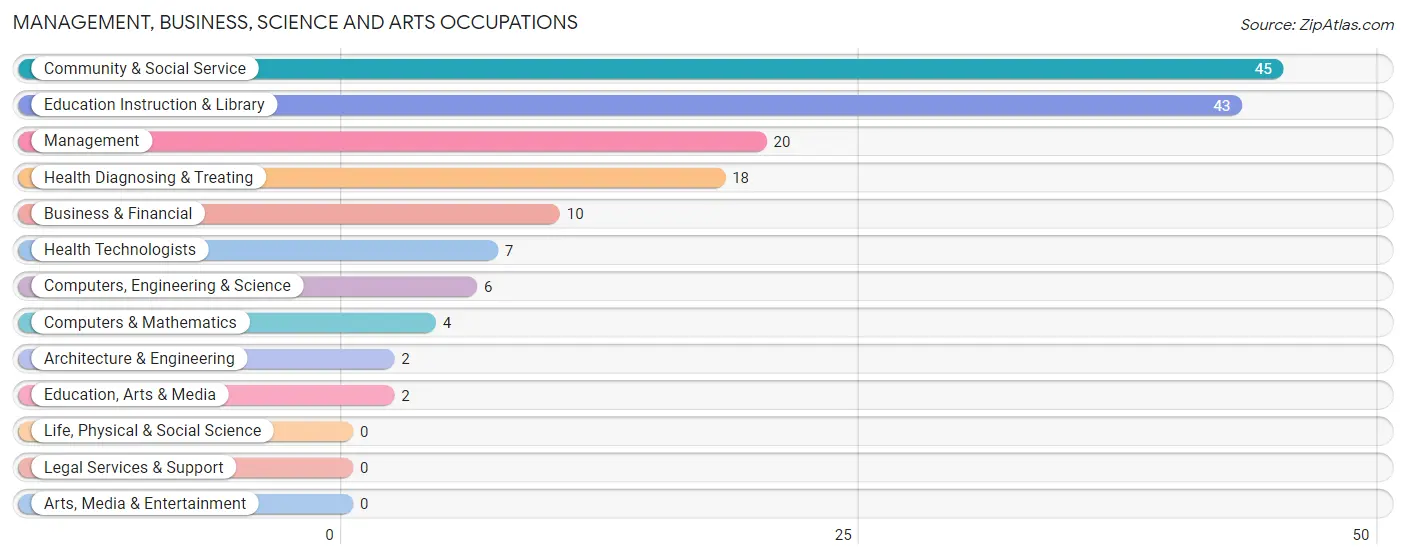
Management, Business, Science and Arts Occupations
The most common Management, Business, Science and Arts occupations in Guy are Community & Social Service (45 | 17.6%), Education Instruction & Library (43 | 16.8%), Management (20 | 7.8%), Health Diagnosing & Treating (18 | 7.0%), and Business & Financial (10 | 3.9%).
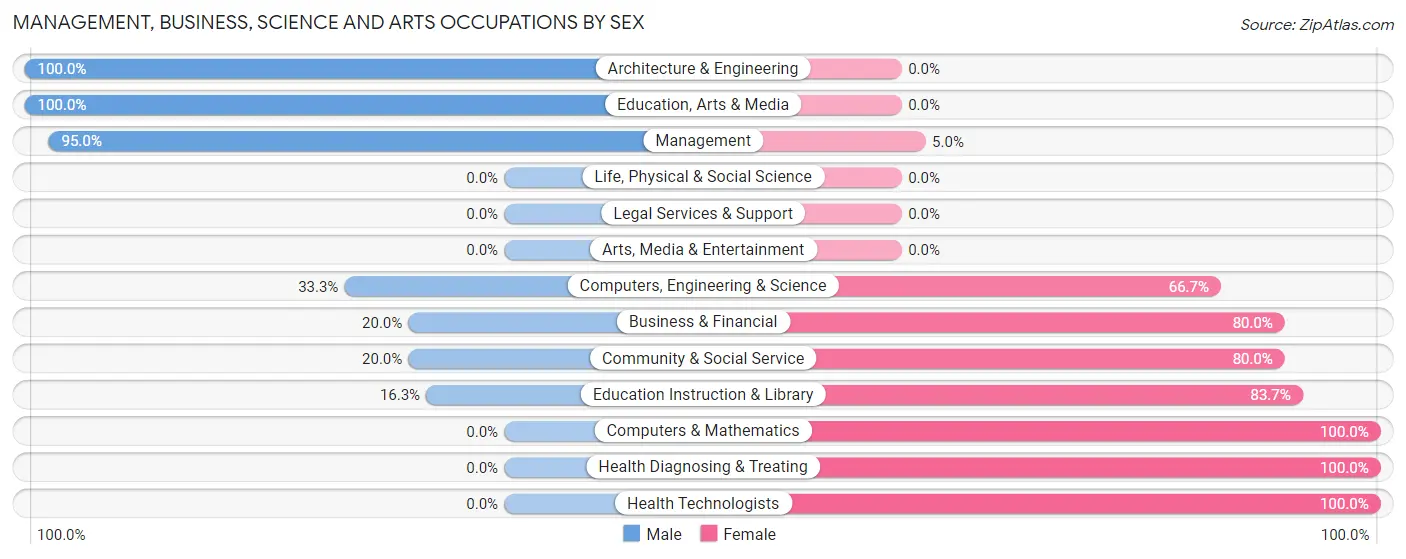
Management, Business, Science and Arts Occupations by Sex
Within the Management, Business, Science and Arts occupations in Guy, the most male-oriented occupations are Architecture & Engineering (100.0%), Education, Arts & Media (100.0%), and Management (95.0%), while the most female-oriented occupations are Computers & Mathematics (100.0%), Health Diagnosing & Treating (100.0%), and Health Technologists (100.0%).
| Occupation | Male | Female |
| Management | 19 (95.0%) | 1 (5.0%) |
| Business & Financial | 2 (20.0%) | 8 (80.0%) |
| Computers, Engineering & Science | 2 (33.3%) | 4 (66.7%) |
| Computers & Mathematics | 0 (0.0%) | 4 (100.0%) |
| Architecture & Engineering | 2 (100.0%) | 0 (0.0%) |
| Life, Physical & Social Science | 0 (0.0%) | 0 (0.0%) |
| Community & Social Service | 9 (20.0%) | 36 (80.0%) |
| Education, Arts & Media | 2 (100.0%) | 0 (0.0%) |
| Legal Services & Support | 0 (0.0%) | 0 (0.0%) |
| Education Instruction & Library | 7 (16.3%) | 36 (83.7%) |
| Arts, Media & Entertainment | 0 (0.0%) | 0 (0.0%) |
| Health Diagnosing & Treating | 0 (0.0%) | 18 (100.0%) |
| Health Technologists | 0 (0.0%) | 7 (100.0%) |
| Total (Category) | 32 (32.3%) | 67 (67.7%) |
| Total (Overall) | 124 (48.4%) | 132 (51.6%) |
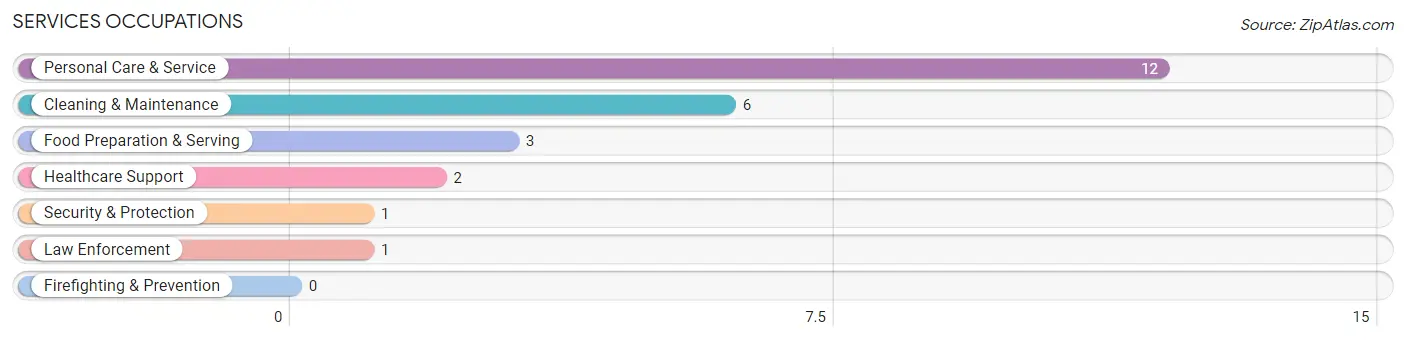
Services Occupations
The most common Services occupations in Guy are Personal Care & Service (12 | 4.7%), Cleaning & Maintenance (6 | 2.3%), Food Preparation & Serving (3 | 1.2%), Healthcare Support (2 | 0.8%), and Security & Protection (1 | 0.4%).
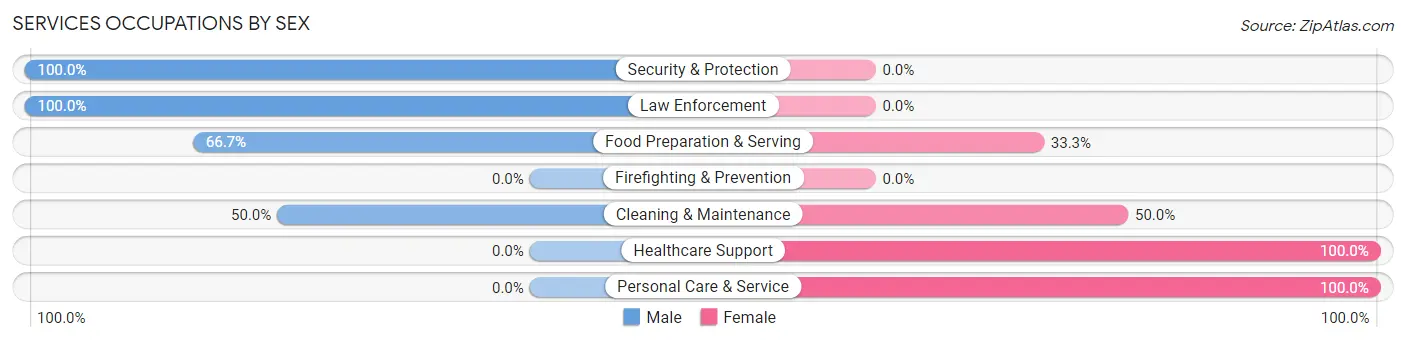
Services Occupations by Sex
Within the Services occupations in Guy, the most male-oriented occupations are Security & Protection (100.0%), Law Enforcement (100.0%), and Food Preparation & Serving (66.7%), while the most female-oriented occupations are Healthcare Support (100.0%), Personal Care & Service (100.0%), and Cleaning & Maintenance (50.0%).
| Occupation | Male | Female |
| Healthcare Support | 0 (0.0%) | 2 (100.0%) |
| Security & Protection | 1 (100.0%) | 0 (0.0%) |
| Firefighting & Prevention | 0 (0.0%) | 0 (0.0%) |
| Law Enforcement | 1 (100.0%) | 0 (0.0%) |
| Food Preparation & Serving | 2 (66.7%) | 1 (33.3%) |
| Cleaning & Maintenance | 3 (50.0%) | 3 (50.0%) |
| Personal Care & Service | 0 (0.0%) | 12 (100.0%) |
| Total (Category) | 6 (25.0%) | 18 (75.0%) |
| Total (Overall) | 124 (48.4%) | 132 (51.6%) |
Sales and Office Occupations
The most common Sales and Office occupations in Guy are Office & Administration (46 | 18.0%), and Sales & Related (22 | 8.6%).

Sales and Office Occupations by Sex

| Occupation | Male | Female |
| Sales & Related | 14 (63.6%) | 8 (36.4%) |
| Office & Administration | 9 (19.6%) | 37 (80.4%) |
| Total (Category) | 23 (33.8%) | 45 (66.2%) |
| Total (Overall) | 124 (48.4%) | 132 (51.6%) |
Natural Resources, Construction and Maintenance Occupations
The most common Natural Resources, Construction and Maintenance occupations in Guy are Construction & Extraction (35 | 13.7%), and Installation, Maintenance & Repair (17 | 6.6%).
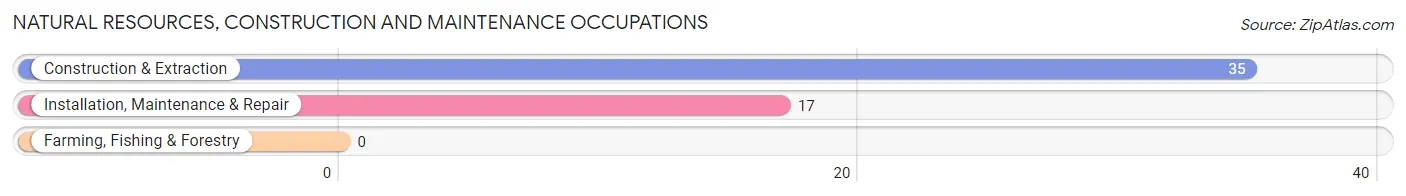
Natural Resources, Construction and Maintenance Occupations by Sex
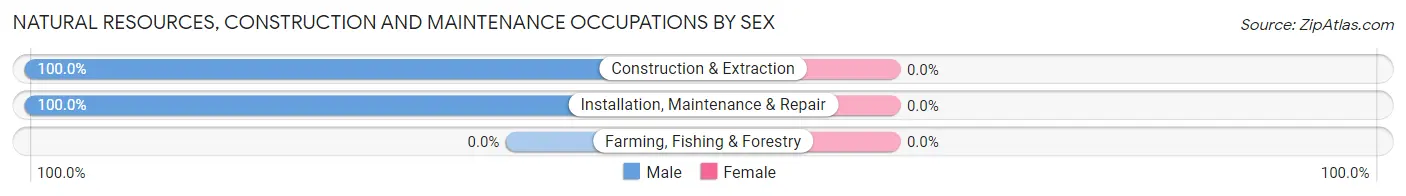
| Occupation | Male | Female |
| Farming, Fishing & Forestry | 0 (0.0%) | 0 (0.0%) |
| Construction & Extraction | 35 (100.0%) | 0 (0.0%) |
| Installation, Maintenance & Repair | 17 (100.0%) | 0 (0.0%) |
| Total (Category) | 52 (100.0%) | 0 (0.0%) |
| Total (Overall) | 124 (48.4%) | 132 (51.6%) |
Production, Transportation and Moving Occupations
The most common Production, Transportation and Moving occupations in Guy are Production (5 | 1.9%), Transportation (4 | 1.6%), and Material Moving (4 | 1.6%).
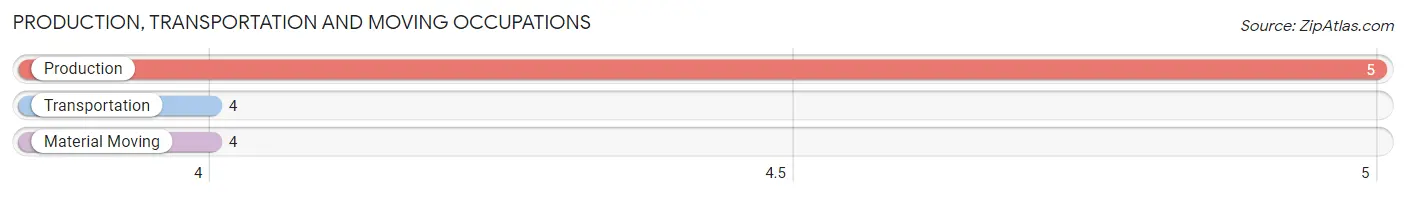
Production, Transportation and Moving Occupations by Sex
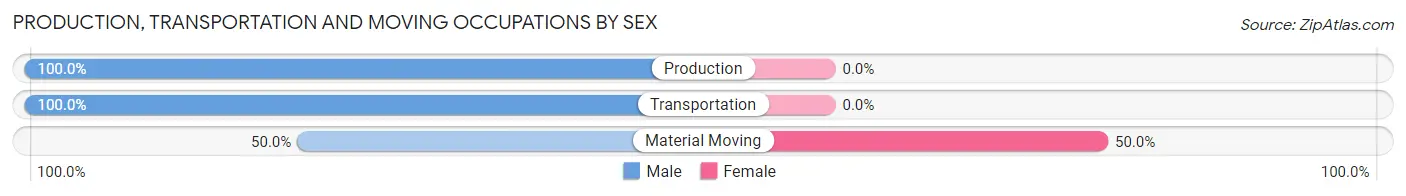
| Occupation | Male | Female |
| Production | 5 (100.0%) | 0 (0.0%) |
| Transportation | 4 (100.0%) | 0 (0.0%) |
| Material Moving | 2 (50.0%) | 2 (50.0%) |
| Total (Category) | 11 (84.6%) | 2 (15.4%) |
| Total (Overall) | 124 (48.4%) | 132 (51.6%) |
Employment Industries by Sex in Guy
Employment Industries in Guy
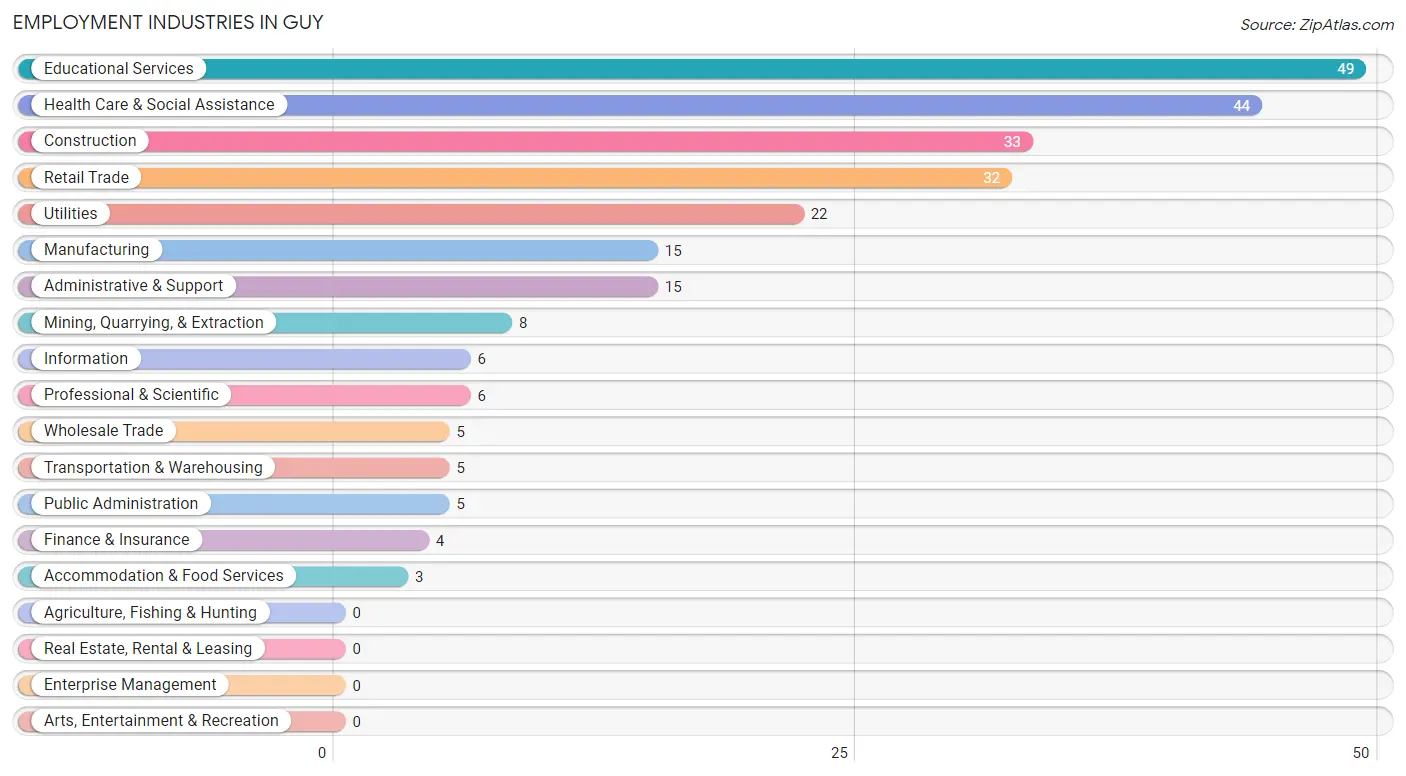
The major employment industries in Guy include Educational Services (49 | 19.1%), Health Care & Social Assistance (44 | 17.2%), Construction (33 | 12.9%), Retail Trade (32 | 12.5%), and Utilities (22 | 8.6%).
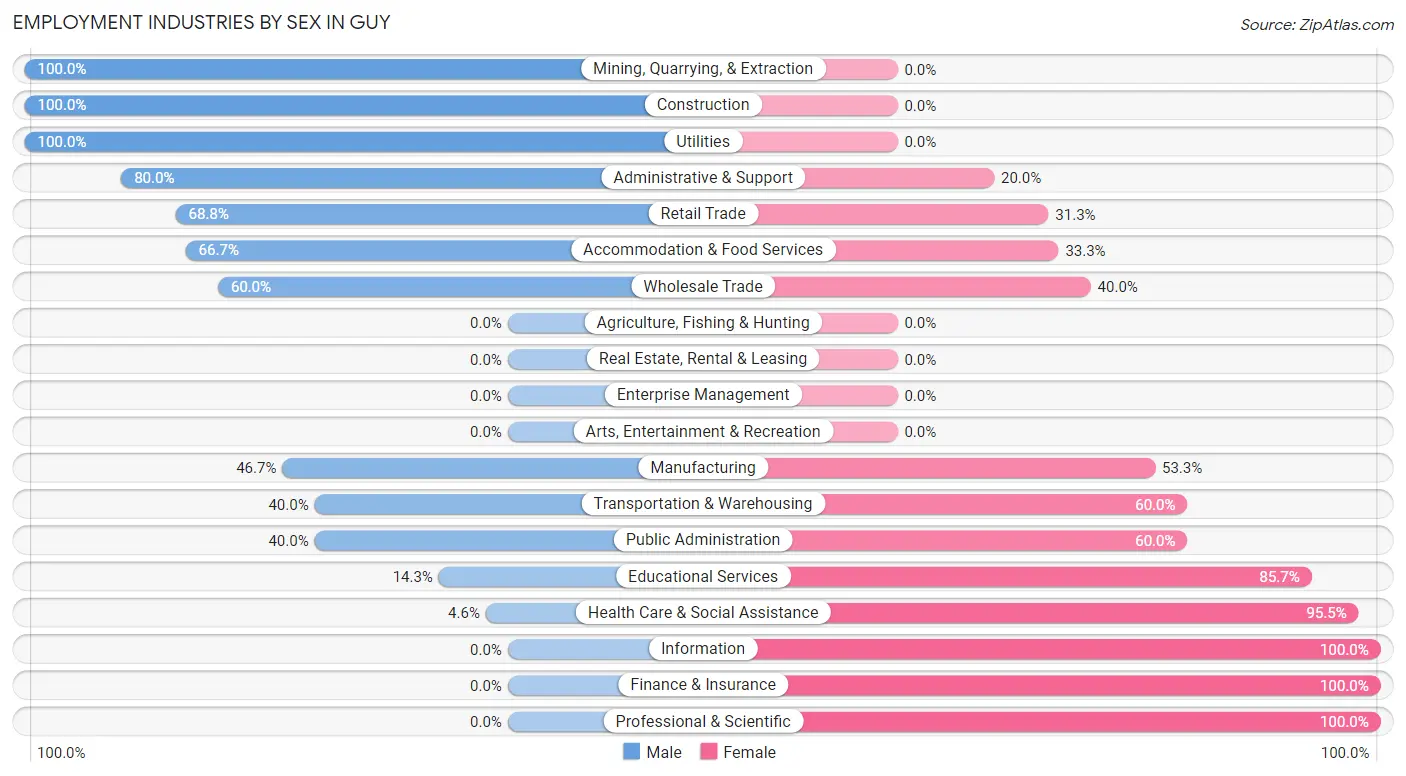
Employment Industries by Sex in Guy
The Guy industries that see more men than women are Mining, Quarrying, & Extraction (100.0%), Construction (100.0%), and Utilities (100.0%), whereas the industries that tend to have a higher number of women are Information (100.0%), Finance & Insurance (100.0%), and Professional & Scientific (100.0%).
| Industry | Male | Female |
| Agriculture, Fishing & Hunting | 0 (0.0%) | 0 (0.0%) |
| Mining, Quarrying, & Extraction | 8 (100.0%) | 0 (0.0%) |
| Construction | 33 (100.0%) | 0 (0.0%) |
| Manufacturing | 7 (46.7%) | 8 (53.3%) |
| Wholesale Trade | 3 (60.0%) | 2 (40.0%) |
| Retail Trade | 22 (68.8%) | 10 (31.2%) |
| Transportation & Warehousing | 2 (40.0%) | 3 (60.0%) |
| Utilities | 22 (100.0%) | 0 (0.0%) |
| Information | 0 (0.0%) | 6 (100.0%) |
| Finance & Insurance | 0 (0.0%) | 4 (100.0%) |
| Real Estate, Rental & Leasing | 0 (0.0%) | 0 (0.0%) |
| Professional & Scientific | 0 (0.0%) | 6 (100.0%) |
| Enterprise Management | 0 (0.0%) | 0 (0.0%) |
| Administrative & Support | 12 (80.0%) | 3 (20.0%) |
| Educational Services | 7 (14.3%) | 42 (85.7%) |
| Health Care & Social Assistance | 2 (4.5%) | 42 (95.5%) |
| Arts, Entertainment & Recreation | 0 (0.0%) | 0 (0.0%) |
| Accommodation & Food Services | 2 (66.7%) | 1 (33.3%) |
| Public Administration | 2 (40.0%) | 3 (60.0%) |
| Total | 124 (48.4%) | 132 (51.6%) |
Education in Guy
School Enrollment in Guy
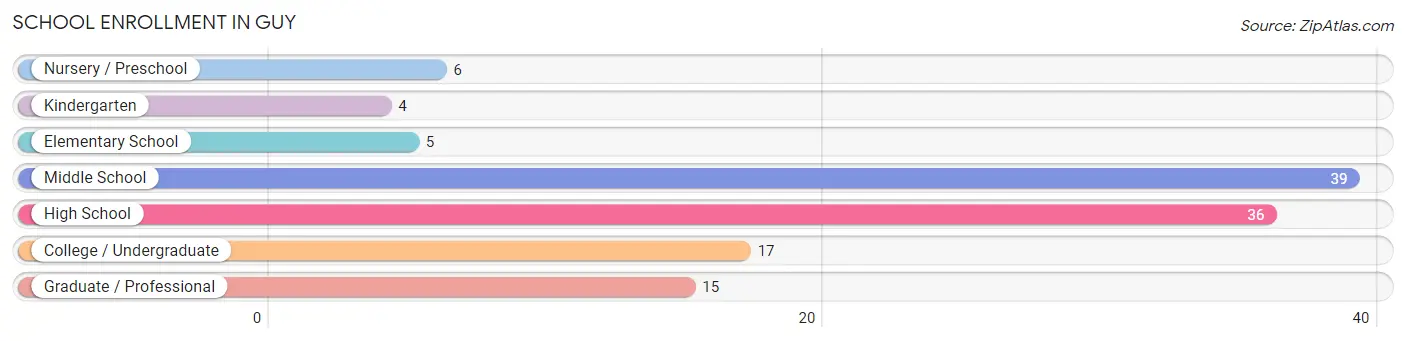
The most common levels of schooling among the 122 students in Guy are middle school (39 | 32.0%), high school (36 | 29.5%), and college / undergraduate (17 | 13.9%).
| School Level | # Students | % Students |
| Nursery / Preschool | 6 | 4.9% |
| Kindergarten | 4 | 3.3% |
| Elementary School | 5 | 4.1% |
| Middle School | 39 | 32.0% |
| High School | 36 | 29.5% |
| College / Undergraduate | 17 | 13.9% |
| Graduate / Professional | 15 | 12.3% |
| Total | 122 | 100.0% |
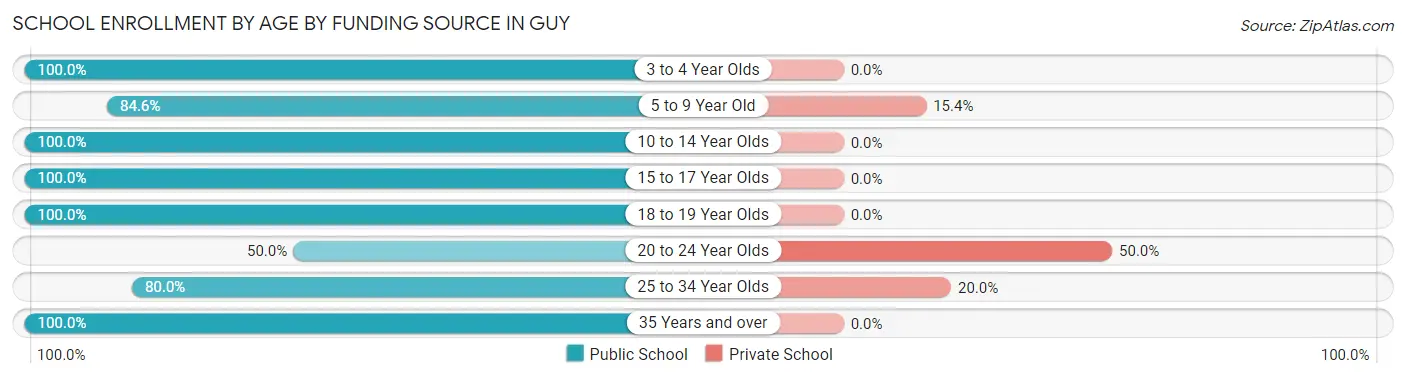
School Enrollment by Age by Funding Source in Guy
Out of a total of 122 students who are enrolled in schools in Guy, 6 (4.9%) attend a private institution, while the remaining 116 (95.1%) are enrolled in public schools. The age group of 20 to 24 year olds has the highest likelihood of being enrolled in private schools, with 2 (50.0% in the age bracket) enrolled. Conversely, the age group of 3 to 4 year olds has the lowest likelihood of being enrolled in a private school, with 2 (100.0% in the age bracket) attending a public institution.
| Age Bracket | Public School | Private School |
| 3 to 4 Year Olds | 2 (100.0%) | 0 (0.0%) |
| 5 to 9 Year Old | 11 (84.6%) | 2 (15.4%) |
| 10 to 14 Year Olds | 44 (100.0%) | 0 (0.0%) |
| 15 to 17 Year Olds | 28 (100.0%) | 0 (0.0%) |
| 18 to 19 Year Olds | 7 (100.0%) | 0 (0.0%) |
| 20 to 24 Year Olds | 2 (50.0%) | 2 (50.0%) |
| 25 to 34 Year Olds | 8 (80.0%) | 2 (20.0%) |
| 35 Years and over | 14 (100.0%) | 0 (0.0%) |
| Total | 116 (95.1%) | 6 (4.9%) |
Educational Attainment by Field of Study in Guy
Education (44 | 46.3%), business (18 | 19.0%), liberal arts & history (14 | 14.7%), bio, nature & agricultural (6 | 6.3%), and science & technology (4 | 4.2%) are the most common fields of study among 95 individuals in Guy who have obtained a bachelor's degree or higher.
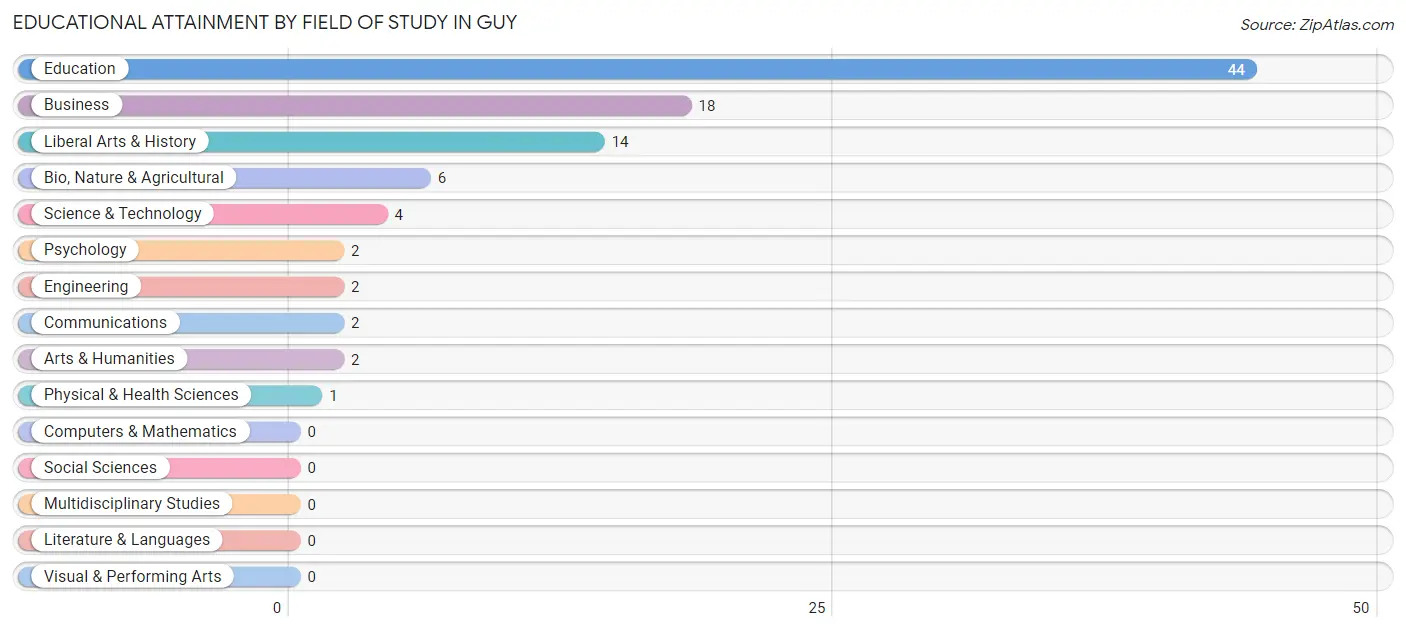
| Field of Study | # Graduates | % Graduates |
| Computers & Mathematics | 0 | 0.0% |
| Bio, Nature & Agricultural | 6 | 6.3% |
| Physical & Health Sciences | 1 | 1.1% |
| Psychology | 2 | 2.1% |
| Social Sciences | 0 | 0.0% |
| Engineering | 2 | 2.1% |
| Multidisciplinary Studies | 0 | 0.0% |
| Science & Technology | 4 | 4.2% |
| Business | 18 | 19.0% |
| Education | 44 | 46.3% |
| Literature & Languages | 0 | 0.0% |
| Liberal Arts & History | 14 | 14.7% |
| Visual & Performing Arts | 0 | 0.0% |
| Communications | 2 | 2.1% |
| Arts & Humanities | 2 | 2.1% |
| Total | 95 | 100.0% |
Transportation & Commute in Guy
Vehicle Availability by Sex in Guy
The most prevalent vehicle ownership categories in Guy are males with 3 vehicles (42, accounting for 33.9%) and females with 3 vehicles (36, making up 32.1%).
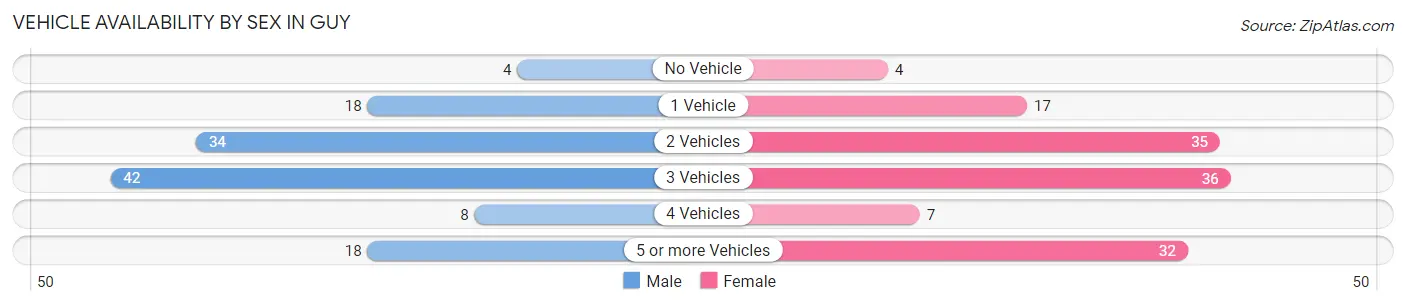
| Vehicles Available | Male | Female |
| No Vehicle | 4 (3.2%) | 4 (3.0%) |
| 1 Vehicle | 18 (14.5%) | 17 (13.0%) |
| 2 Vehicles | 34 (27.4%) | 35 (26.7%) |
| 3 Vehicles | 42 (33.9%) | 36 (27.5%) |
| 4 Vehicles | 8 (6.5%) | 7 (5.3%) |
| 5 or more Vehicles | 18 (14.5%) | 32 (24.4%) |
| Total | 124 (100.0%) | 131 (100.0%) |
Commute Time in Guy
The most frequently occuring commute durations in Guy are 30 to 34 minutes (44 commuters, 18.6%), less than 5 minutes (40 commuters, 16.9%), and 20 to 24 minutes (34 commuters, 14.3%).
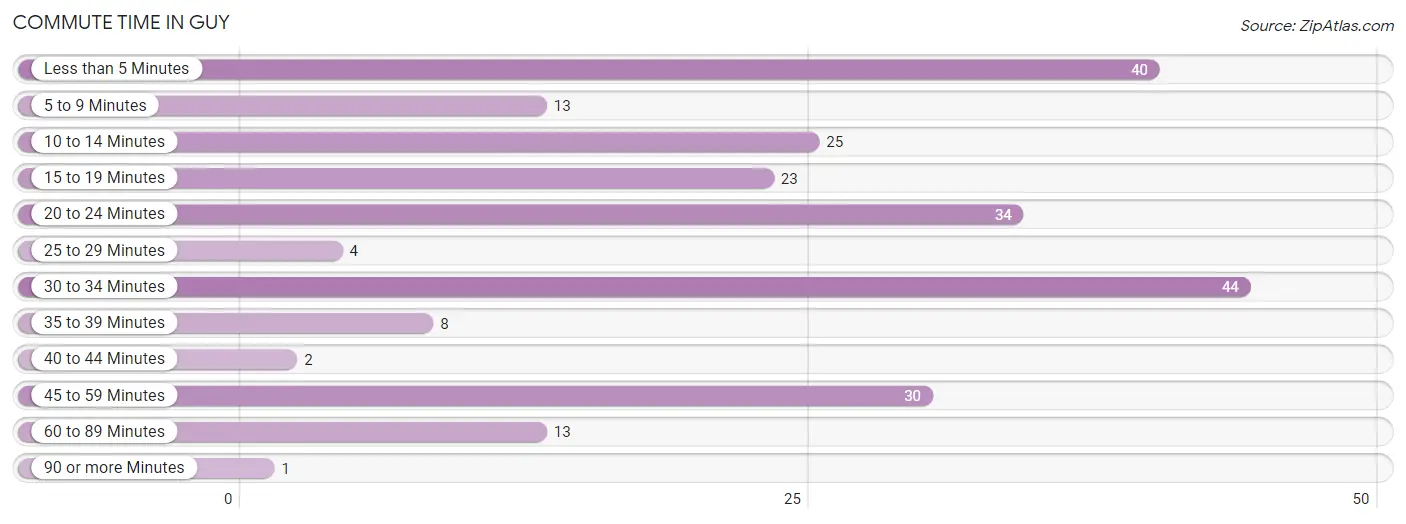
| Commute Time | # Commuters | % Commuters |
| Less than 5 Minutes | 40 | 16.9% |
| 5 to 9 Minutes | 13 | 5.5% |
| 10 to 14 Minutes | 25 | 10.5% |
| 15 to 19 Minutes | 23 | 9.7% |
| 20 to 24 Minutes | 34 | 14.3% |
| 25 to 29 Minutes | 4 | 1.7% |
| 30 to 34 Minutes | 44 | 18.6% |
| 35 to 39 Minutes | 8 | 3.4% |
| 40 to 44 Minutes | 2 | 0.8% |
| 45 to 59 Minutes | 30 | 12.7% |
| 60 to 89 Minutes | 13 | 5.5% |
| 90 or more Minutes | 1 | 0.4% |
Commute Time by Sex in Guy
The most common commute times in Guy are 45 to 59 minutes (24 commuters, 19.7%) for males and less than 5 minutes (22 commuters, 19.1%) for females.
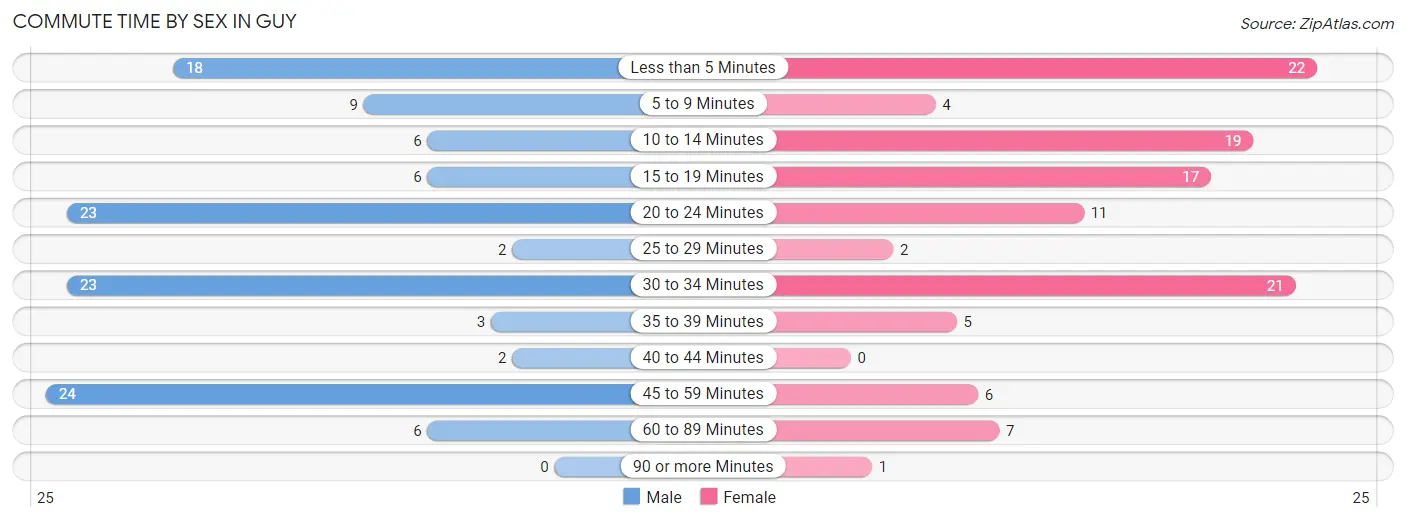
| Commute Time | Male | Female |
| Less than 5 Minutes | 18 (14.7%) | 22 (19.1%) |
| 5 to 9 Minutes | 9 (7.4%) | 4 (3.5%) |
| 10 to 14 Minutes | 6 (4.9%) | 19 (16.5%) |
| 15 to 19 Minutes | 6 (4.9%) | 17 (14.8%) |
| 20 to 24 Minutes | 23 (18.9%) | 11 (9.6%) |
| 25 to 29 Minutes | 2 (1.6%) | 2 (1.7%) |
| 30 to 34 Minutes | 23 (18.9%) | 21 (18.3%) |
| 35 to 39 Minutes | 3 (2.5%) | 5 (4.3%) |
| 40 to 44 Minutes | 2 (1.6%) | 0 (0.0%) |
| 45 to 59 Minutes | 24 (19.7%) | 6 (5.2%) |
| 60 to 89 Minutes | 6 (4.9%) | 7 (6.1%) |
| 90 or more Minutes | 0 (0.0%) | 1 (0.9%) |
Time of Departure to Work by Sex in Guy
The most frequent times of departure to work in Guy are 6:30 AM to 6:59 AM (30, 24.6%) for males and 7:00 AM to 7:29 AM (57, 49.6%) for females.
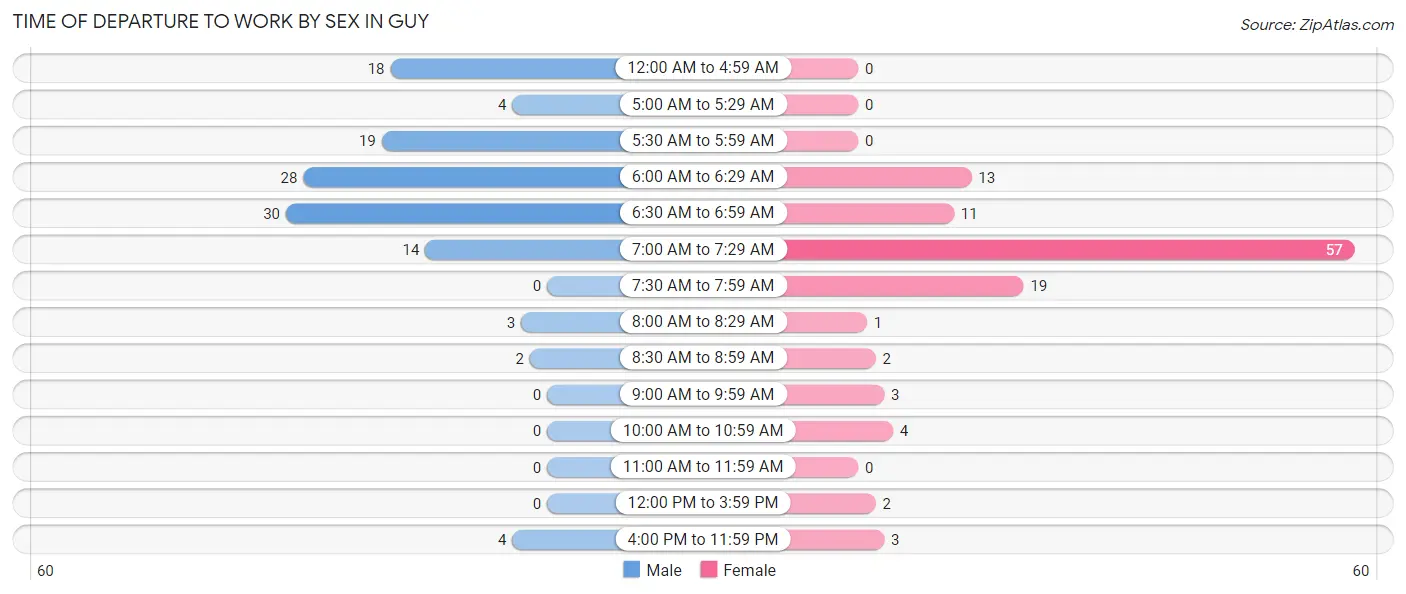
| Time of Departure | Male | Female |
| 12:00 AM to 4:59 AM | 18 (14.7%) | 0 (0.0%) |
| 5:00 AM to 5:29 AM | 4 (3.3%) | 0 (0.0%) |
| 5:30 AM to 5:59 AM | 19 (15.6%) | 0 (0.0%) |
| 6:00 AM to 6:29 AM | 28 (23.0%) | 13 (11.3%) |
| 6:30 AM to 6:59 AM | 30 (24.6%) | 11 (9.6%) |
| 7:00 AM to 7:29 AM | 14 (11.5%) | 57 (49.6%) |
| 7:30 AM to 7:59 AM | 0 (0.0%) | 19 (16.5%) |
| 8:00 AM to 8:29 AM | 3 (2.5%) | 1 (0.9%) |
| 8:30 AM to 8:59 AM | 2 (1.6%) | 2 (1.7%) |
| 9:00 AM to 9:59 AM | 0 (0.0%) | 3 (2.6%) |
| 10:00 AM to 10:59 AM | 0 (0.0%) | 4 (3.5%) |
| 11:00 AM to 11:59 AM | 0 (0.0%) | 0 (0.0%) |
| 12:00 PM to 3:59 PM | 0 (0.0%) | 2 (1.7%) |
| 4:00 PM to 11:59 PM | 4 (3.3%) | 3 (2.6%) |
| Total | 122 (100.0%) | 115 (100.0%) |
Housing Occupancy in Guy
Occupancy by Ownership in Guy
Of the total 240 dwellings in Guy, owner-occupied units account for 197 (82.1%), while renter-occupied units make up 43 (17.9%).
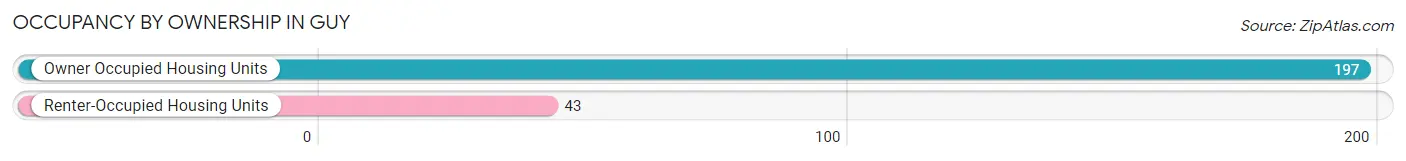
| Occupancy | # Housing Units | % Housing Units |
| Owner Occupied Housing Units | 197 | 82.1% |
| Renter-Occupied Housing Units | 43 | 17.9% |
| Total Occupied Housing Units | 240 | 100.0% |
Occupancy by Household Size in Guy
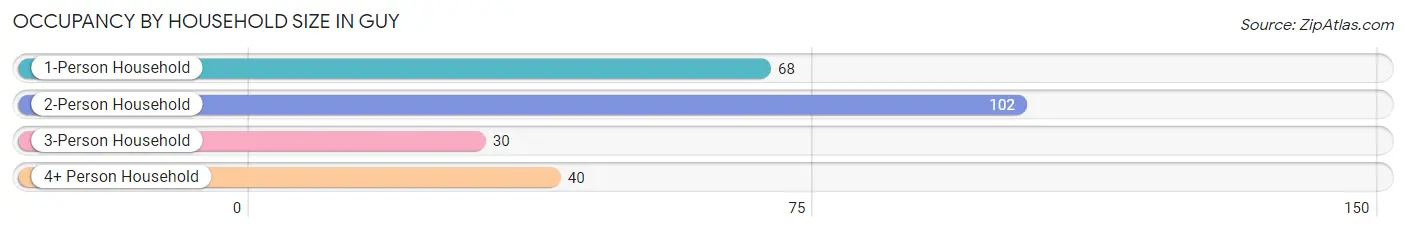
| Household Size | # Housing Units | % Housing Units |
| 1-Person Household | 68 | 28.3% |
| 2-Person Household | 102 | 42.5% |
| 3-Person Household | 30 | 12.5% |
| 4+ Person Household | 40 | 16.7% |
| Total Housing Units | 240 | 100.0% |
Occupancy by Ownership by Household Size in Guy
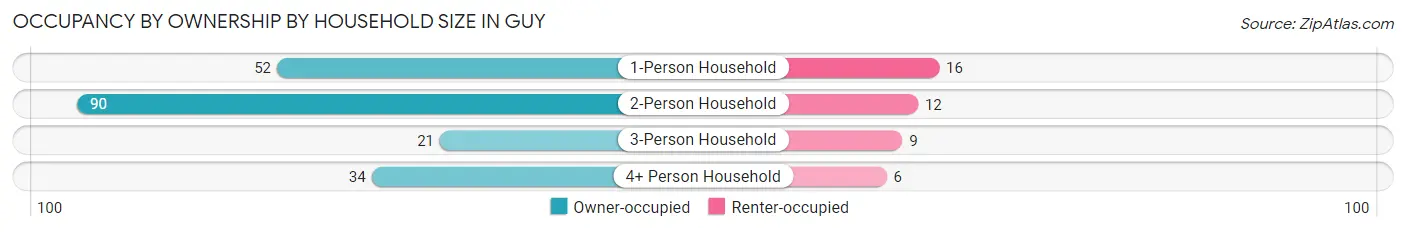
| Household Size | Owner-occupied | Renter-occupied |
| 1-Person Household | 52 (76.5%) | 16 (23.5%) |
| 2-Person Household | 90 (88.2%) | 12 (11.8%) |
| 3-Person Household | 21 (70.0%) | 9 (30.0%) |
| 4+ Person Household | 34 (85.0%) | 6 (15.0%) |
| Total Housing Units | 197 (82.1%) | 43 (17.9%) |
Occupancy by Educational Attainment in Guy
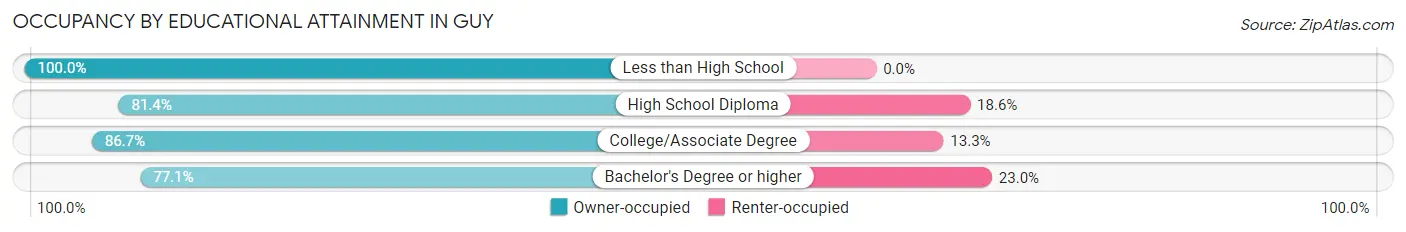
| Household Size | Owner-occupied | Renter-occupied |
| Less than High School | 2 (100.0%) | 0 (0.0%) |
| High School Diploma | 83 (81.4%) | 19 (18.6%) |
| College/Associate Degree | 65 (86.7%) | 10 (13.3%) |
| Bachelor's Degree or higher | 47 (77.0%) | 14 (23.0%) |
Occupancy by Age of Householder in Guy
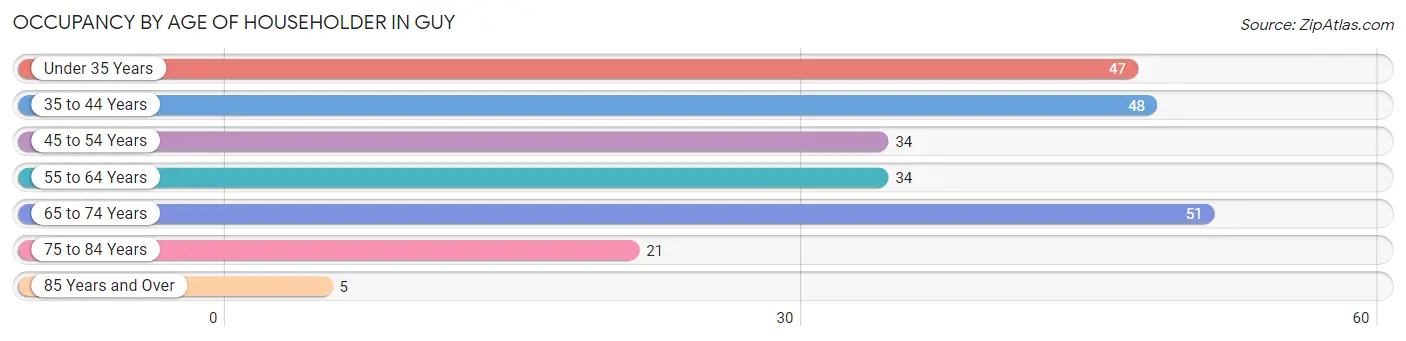
| Age Bracket | # Households | % Households |
| Under 35 Years | 47 | 19.6% |
| 35 to 44 Years | 48 | 20.0% |
| 45 to 54 Years | 34 | 14.2% |
| 55 to 64 Years | 34 | 14.2% |
| 65 to 74 Years | 51 | 21.2% |
| 75 to 84 Years | 21 | 8.7% |
| 85 Years and Over | 5 | 2.1% |
| Total | 240 | 100.0% |
Housing Finances in Guy
Median Income by Occupancy in Guy
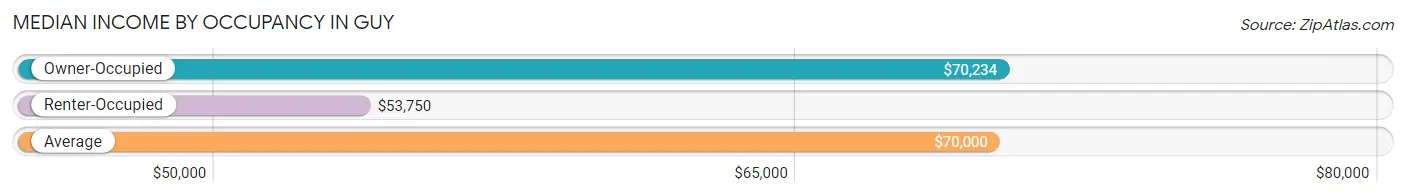
| Occupancy Type | # Households | Median Income |
| Owner-Occupied | 197 (82.1%) | $70,234 |
| Renter-Occupied | 43 (17.9%) | $53,750 |
| Average | 240 (100.0%) | $70,000 |
Occupancy by Householder Income Bracket in Guy
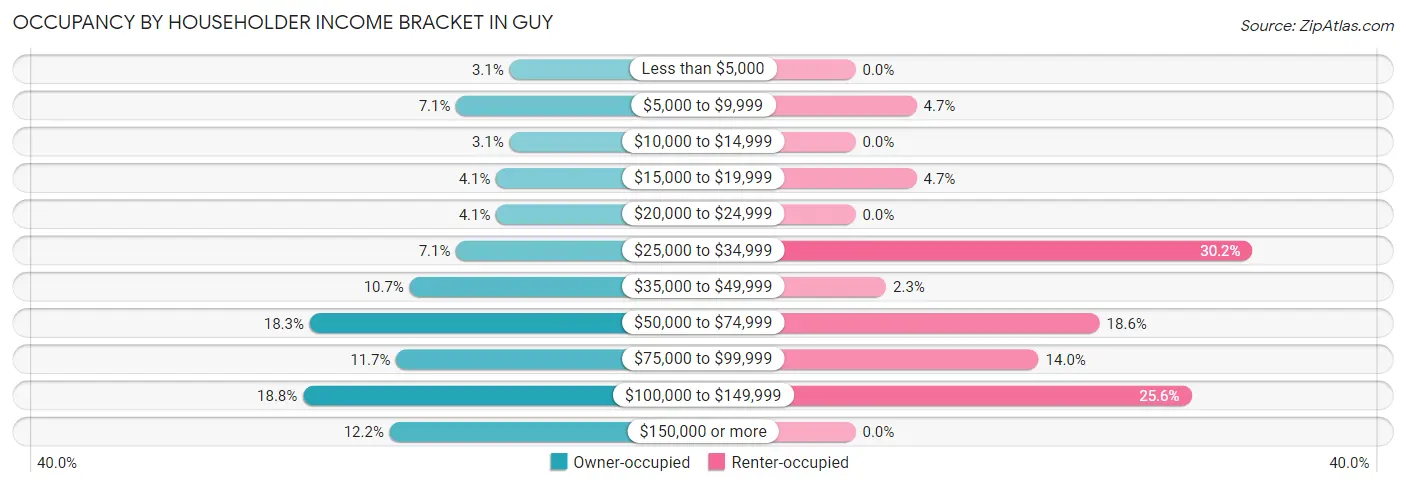
| Income Bracket | Owner-occupied | Renter-occupied |
| Less than $5,000 | 6 (3.0%) | 0 (0.0%) |
| $5,000 to $9,999 | 14 (7.1%) | 2 (4.6%) |
| $10,000 to $14,999 | 6 (3.0%) | 0 (0.0%) |
| $15,000 to $19,999 | 8 (4.1%) | 2 (4.6%) |
| $20,000 to $24,999 | 8 (4.1%) | 0 (0.0%) |
| $25,000 to $34,999 | 14 (7.1%) | 13 (30.2%) |
| $35,000 to $49,999 | 21 (10.7%) | 1 (2.3%) |
| $50,000 to $74,999 | 36 (18.3%) | 8 (18.6%) |
| $75,000 to $99,999 | 23 (11.7%) | 6 (14.0%) |
| $100,000 to $149,999 | 37 (18.8%) | 11 (25.6%) |
| $150,000 or more | 24 (12.2%) | 0 (0.0%) |
| Total | 197 (100.0%) | 43 (100.0%) |
Monthly Housing Cost Tiers in Guy
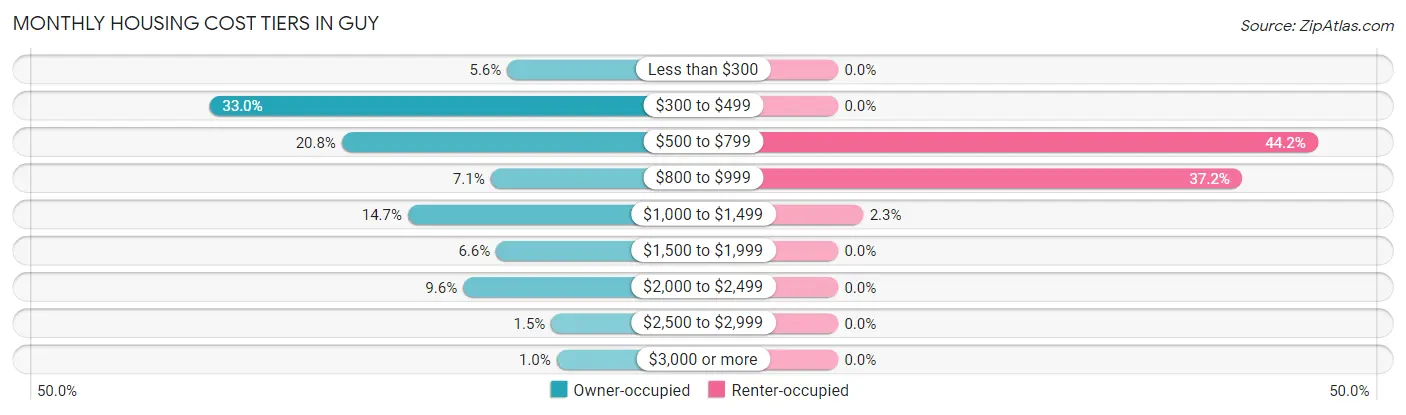
| Monthly Cost | Owner-occupied | Renter-occupied |
| Less than $300 | 11 (5.6%) | 0 (0.0%) |
| $300 to $499 | 65 (33.0%) | 0 (0.0%) |
| $500 to $799 | 41 (20.8%) | 19 (44.2%) |
| $800 to $999 | 14 (7.1%) | 16 (37.2%) |
| $1,000 to $1,499 | 29 (14.7%) | 1 (2.3%) |
| $1,500 to $1,999 | 13 (6.6%) | 0 (0.0%) |
| $2,000 to $2,499 | 19 (9.6%) | 0 (0.0%) |
| $2,500 to $2,999 | 3 (1.5%) | 0 (0.0%) |
| $3,000 or more | 2 (1.0%) | 0 (0.0%) |
| Total | 197 (100.0%) | 43 (100.0%) |
Physical Housing Characteristics in Guy
Housing Structures in Guy
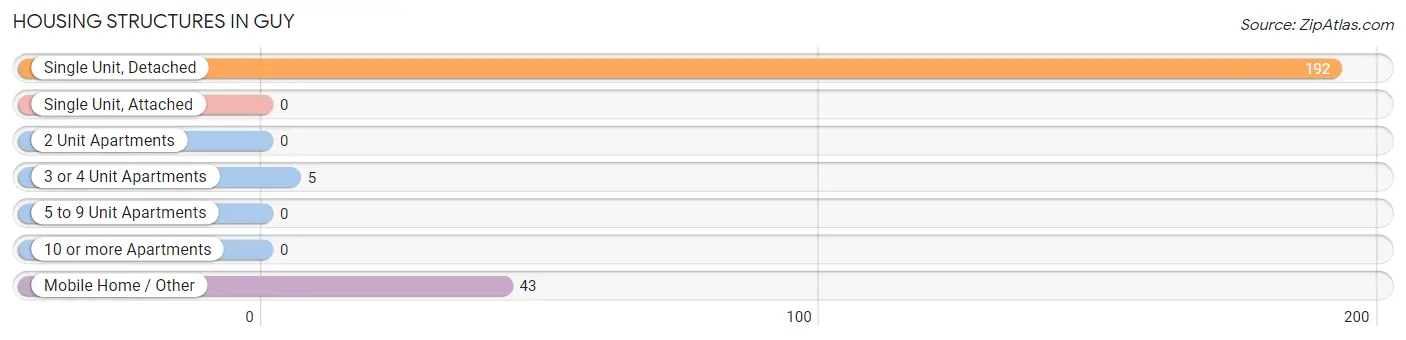
| Structure Type | # Housing Units | % Housing Units |
| Single Unit, Detached | 192 | 80.0% |
| Single Unit, Attached | 0 | 0.0% |
| 2 Unit Apartments | 0 | 0.0% |
| 3 or 4 Unit Apartments | 5 | 2.1% |
| 5 to 9 Unit Apartments | 0 | 0.0% |
| 10 or more Apartments | 0 | 0.0% |
| Mobile Home / Other | 43 | 17.9% |
| Total | 240 | 100.0% |
Housing Structures by Occupancy in Guy
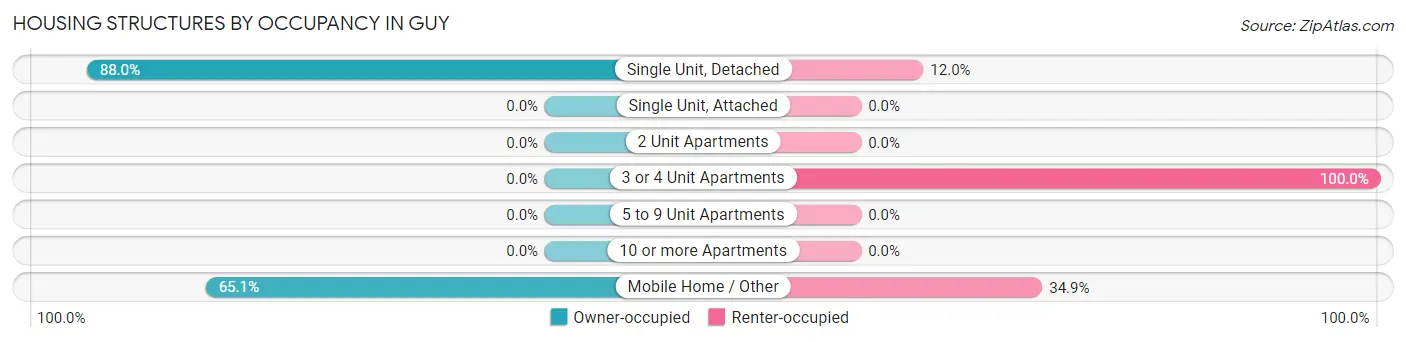
| Structure Type | Owner-occupied | Renter-occupied |
| Single Unit, Detached | 169 (88.0%) | 23 (12.0%) |
| Single Unit, Attached | 0 (0.0%) | 0 (0.0%) |
| 2 Unit Apartments | 0 (0.0%) | 0 (0.0%) |
| 3 or 4 Unit Apartments | 0 (0.0%) | 5 (100.0%) |
| 5 to 9 Unit Apartments | 0 (0.0%) | 0 (0.0%) |
| 10 or more Apartments | 0 (0.0%) | 0 (0.0%) |
| Mobile Home / Other | 28 (65.1%) | 15 (34.9%) |
| Total | 197 (82.1%) | 43 (17.9%) |
Housing Structures by Number of Rooms in Guy
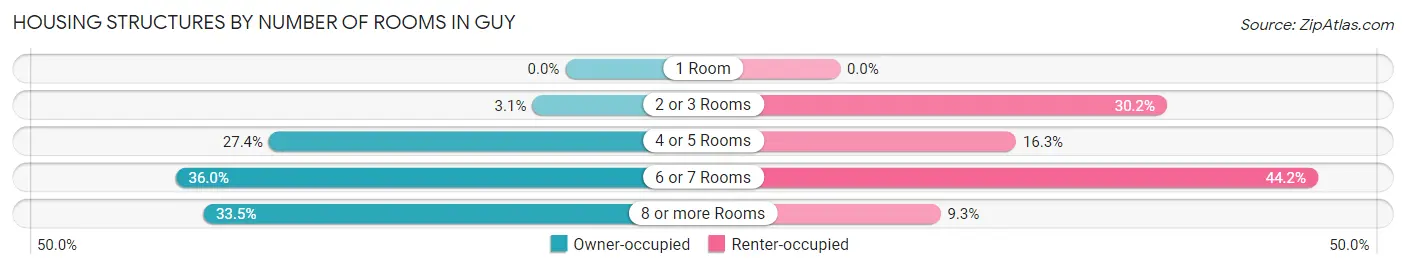
| Number of Rooms | Owner-occupied | Renter-occupied |
| 1 Room | 0 (0.0%) | 0 (0.0%) |
| 2 or 3 Rooms | 6 (3.0%) | 13 (30.2%) |
| 4 or 5 Rooms | 54 (27.4%) | 7 (16.3%) |
| 6 or 7 Rooms | 71 (36.0%) | 19 (44.2%) |
| 8 or more Rooms | 66 (33.5%) | 4 (9.3%) |
| Total | 197 (100.0%) | 43 (100.0%) |
Housing Structure by Heating Type in Guy
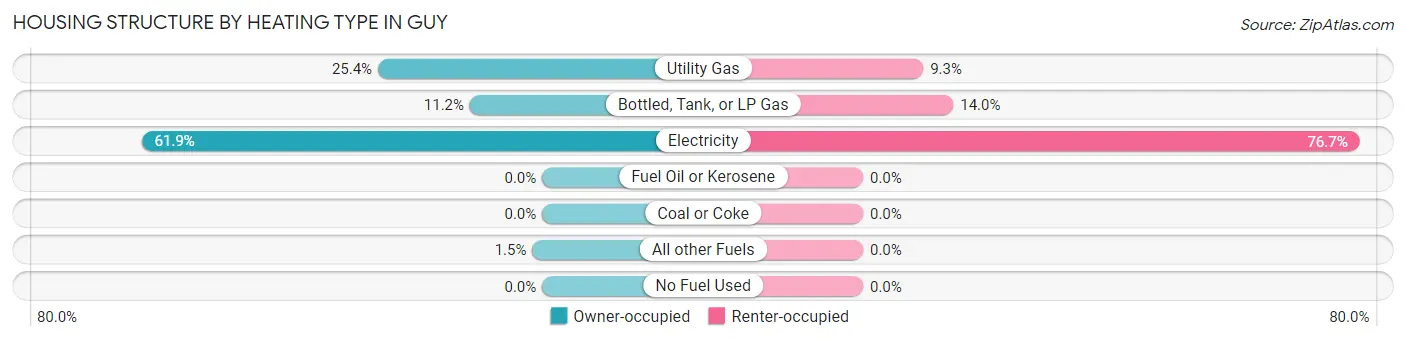
| Heating Type | Owner-occupied | Renter-occupied |
| Utility Gas | 50 (25.4%) | 4 (9.3%) |
| Bottled, Tank, or LP Gas | 22 (11.2%) | 6 (14.0%) |
| Electricity | 122 (61.9%) | 33 (76.7%) |
| Fuel Oil or Kerosene | 0 (0.0%) | 0 (0.0%) |
| Coal or Coke | 0 (0.0%) | 0 (0.0%) |
| All other Fuels | 3 (1.5%) | 0 (0.0%) |
| No Fuel Used | 0 (0.0%) | 0 (0.0%) |
| Total | 197 (100.0%) | 43 (100.0%) |
Household Vehicle Usage in Guy
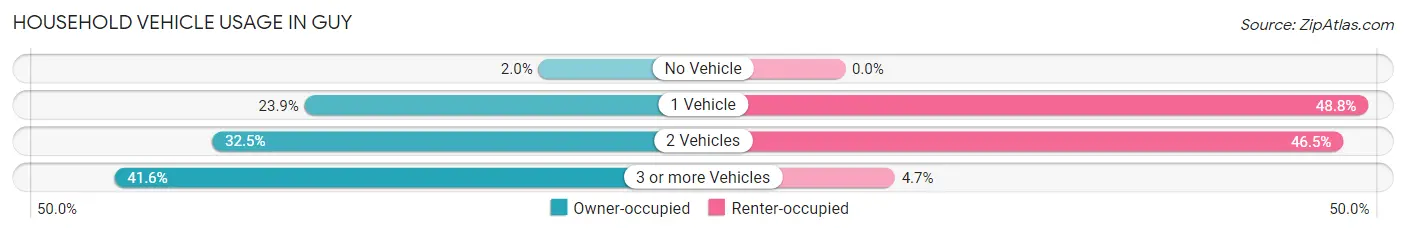
| Vehicles per Household | Owner-occupied | Renter-occupied |
| No Vehicle | 4 (2.0%) | 0 (0.0%) |
| 1 Vehicle | 47 (23.9%) | 21 (48.8%) |
| 2 Vehicles | 64 (32.5%) | 20 (46.5%) |
| 3 or more Vehicles | 82 (41.6%) | 2 (4.6%) |
| Total | 197 (100.0%) | 43 (100.0%) |
Real Estate & Mortgages in Guy
Real Estate and Mortgage Overview in Guy
| Characteristic | Without Mortgage | With Mortgage |
| Housing Units | 114 | 83 |
| Median Property Value | $183,300 | $223,200 |
| Median Household Income | $37,500 | $24 |
| Monthly Housing Costs | $451 | $2 |
| Real Estate Taxes | $1,000 | $0 |
Property Value by Mortgage Status in Guy
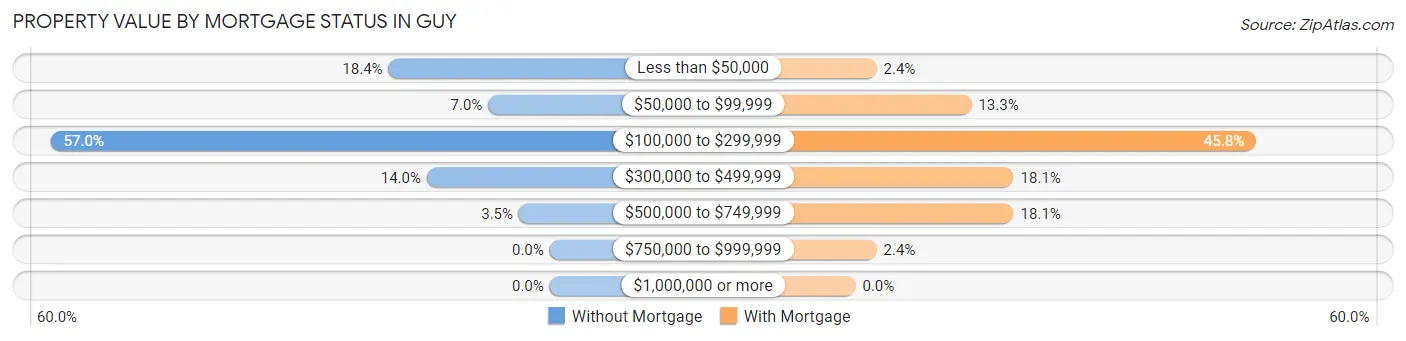
| Property Value | Without Mortgage | With Mortgage |
| Less than $50,000 | 21 (18.4%) | 2 (2.4%) |
| $50,000 to $99,999 | 8 (7.0%) | 11 (13.3%) |
| $100,000 to $299,999 | 65 (57.0%) | 38 (45.8%) |
| $300,000 to $499,999 | 16 (14.0%) | 15 (18.1%) |
| $500,000 to $749,999 | 4 (3.5%) | 15 (18.1%) |
| $750,000 to $999,999 | 0 (0.0%) | 2 (2.4%) |
| $1,000,000 or more | 0 (0.0%) | 0 (0.0%) |
| Total | 114 (100.0%) | 83 (100.0%) |
Household Income by Mortgage Status in Guy
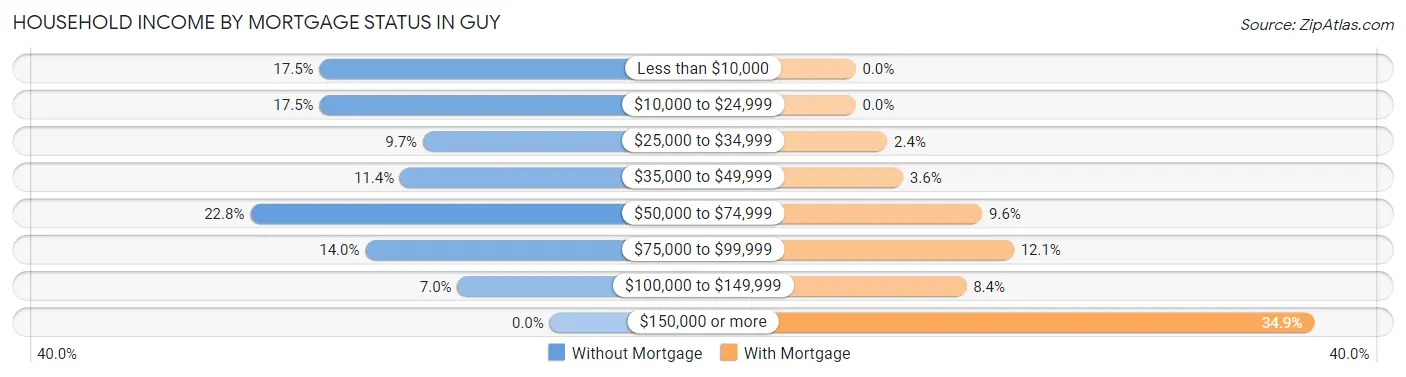
| Household Income | Without Mortgage | With Mortgage |
| Less than $10,000 | 20 (17.5%) | 0 (0.0%) |
| $10,000 to $24,999 | 20 (17.5%) | 0 (0.0%) |
| $25,000 to $34,999 | 11 (9.7%) | 2 (2.4%) |
| $35,000 to $49,999 | 13 (11.4%) | 3 (3.6%) |
| $50,000 to $74,999 | 26 (22.8%) | 8 (9.6%) |
| $75,000 to $99,999 | 16 (14.0%) | 10 (12.0%) |
| $100,000 to $149,999 | 8 (7.0%) | 7 (8.4%) |
| $150,000 or more | 0 (0.0%) | 29 (34.9%) |
| Total | 114 (100.0%) | 83 (100.0%) |
Property Value to Household Income Ratio in Guy
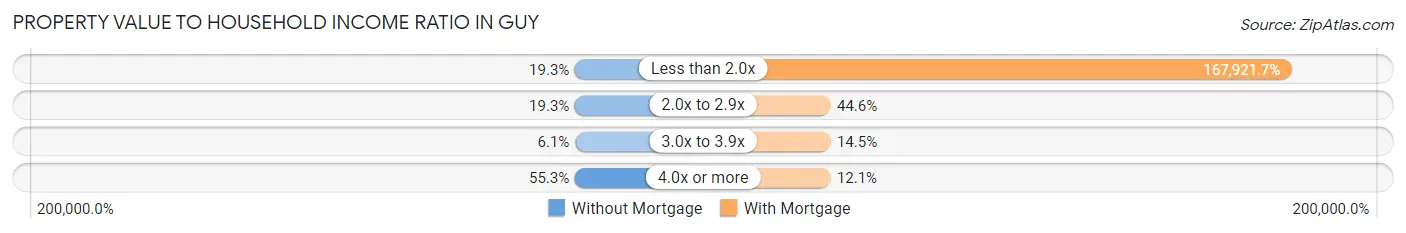
| Value-to-Income Ratio | Without Mortgage | With Mortgage |
| Less than 2.0x | 22 (19.3%) | 139,375 (167,921.7%) |
| 2.0x to 2.9x | 22 (19.3%) | 37 (44.6%) |
| 3.0x to 3.9x | 7 (6.1%) | 12 (14.5%) |
| 4.0x or more | 63 (55.3%) | 10 (12.0%) |
| Total | 114 (100.0%) | 83 (100.0%) |
Real Estate Taxes by Mortgage Status in Guy
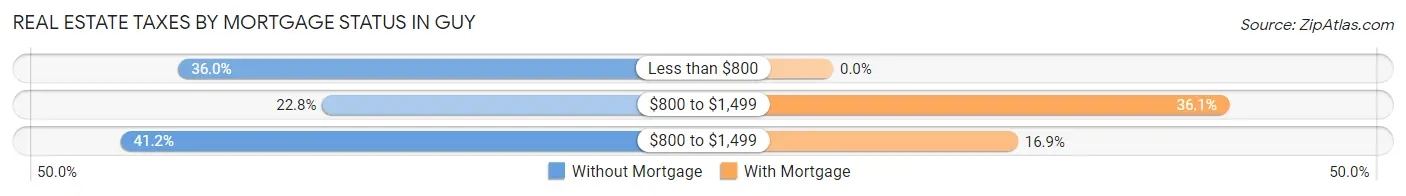
| Property Taxes | Without Mortgage | With Mortgage |
| Less than $800 | 41 (36.0%) | 0 (0.0%) |
| $800 to $1,499 | 26 (22.8%) | 30 (36.1%) |
| $800 to $1,499 | 47 (41.2%) | 14 (16.9%) |
| Total | 114 (100.0%) | 83 (100.0%) |
Health & Disability in Guy
Health Insurance Coverage by Age in Guy
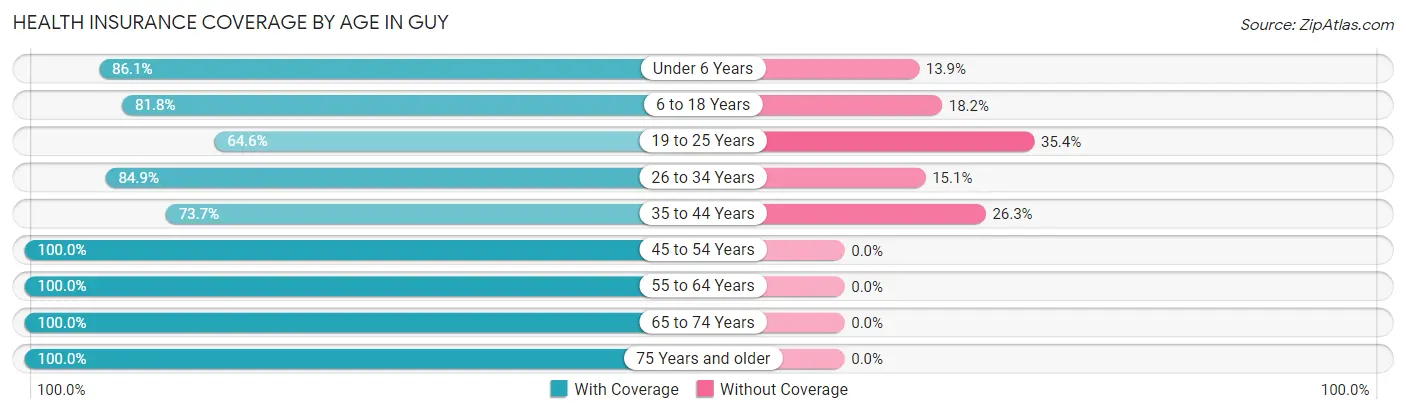
| Age Bracket | With Coverage | Without Coverage |
| Under 6 Years | 31 (86.1%) | 5 (13.9%) |
| 6 to 18 Years | 72 (81.8%) | 16 (18.2%) |
| 19 to 25 Years | 42 (64.6%) | 23 (35.4%) |
| 26 to 34 Years | 45 (84.9%) | 8 (15.1%) |
| 35 to 44 Years | 70 (73.7%) | 25 (26.3%) |
| 45 to 54 Years | 77 (100.0%) | 0 (0.0%) |
| 55 to 64 Years | 40 (100.0%) | 0 (0.0%) |
| 65 to 74 Years | 116 (100.0%) | 0 (0.0%) |
| 75 Years and older | 49 (100.0%) | 0 (0.0%) |
| Total | 542 (87.6%) | 77 (12.4%) |
Health Insurance Coverage by Citizenship Status in Guy
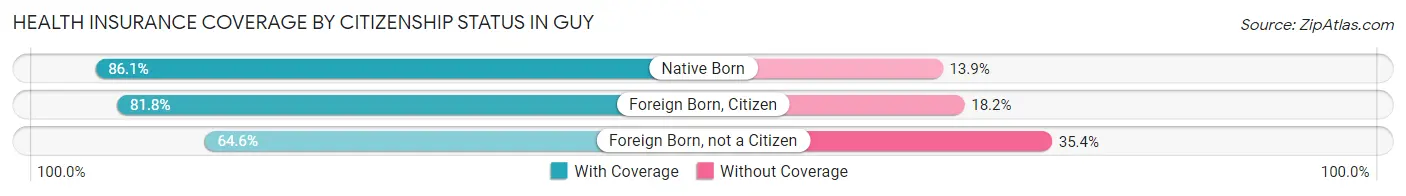
| Citizenship Status | With Coverage | Without Coverage |
| Native Born | 31 (86.1%) | 5 (13.9%) |
| Foreign Born, Citizen | 72 (81.8%) | 16 (18.2%) |
| Foreign Born, not a Citizen | 42 (64.6%) | 23 (35.4%) |
Health Insurance Coverage by Household Income in Guy
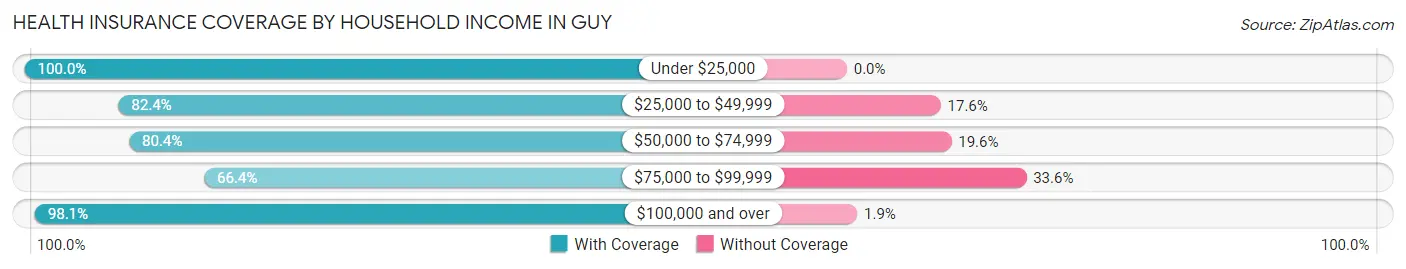
| Household Income | With Coverage | Without Coverage |
| Under $25,000 | 113 (100.0%) | 0 (0.0%) |
| $25,000 to $49,999 | 75 (82.4%) | 16 (17.6%) |
| $50,000 to $74,999 | 74 (80.4%) | 18 (19.6%) |
| $75,000 to $99,999 | 77 (66.4%) | 39 (33.6%) |
| $100,000 and over | 203 (98.1%) | 4 (1.9%) |
Public vs Private Health Insurance Coverage by Age in Guy
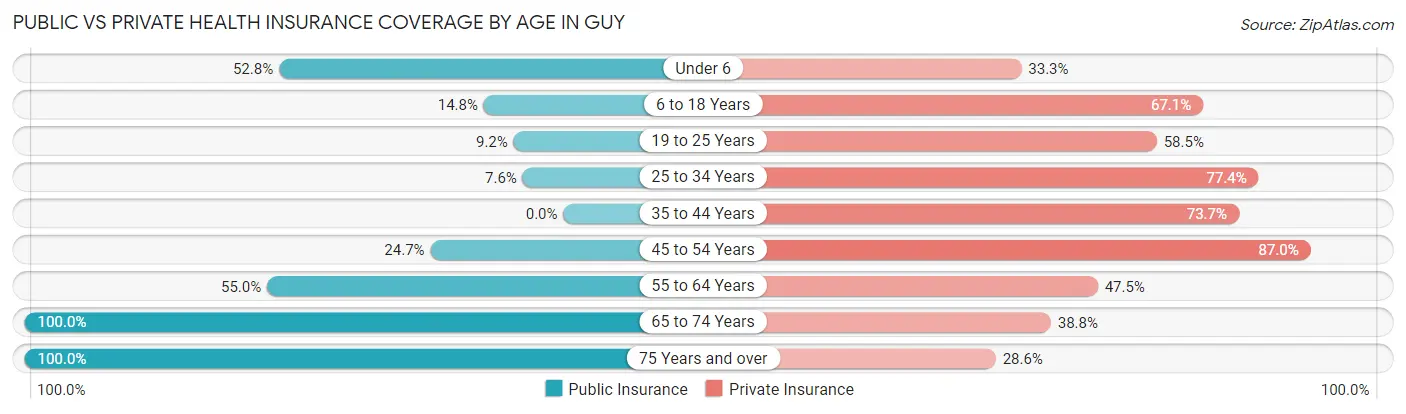
| Age Bracket | Public Insurance | Private Insurance |
| Under 6 | 19 (52.8%) | 12 (33.3%) |
| 6 to 18 Years | 13 (14.8%) | 59 (67.0%) |
| 19 to 25 Years | 6 (9.2%) | 38 (58.5%) |
| 25 to 34 Years | 4 (7.5%) | 41 (77.4%) |
| 35 to 44 Years | 0 (0.0%) | 70 (73.7%) |
| 45 to 54 Years | 19 (24.7%) | 67 (87.0%) |
| 55 to 64 Years | 22 (55.0%) | 19 (47.5%) |
| 65 to 74 Years | 116 (100.0%) | 45 (38.8%) |
| 75 Years and over | 49 (100.0%) | 14 (28.6%) |
| Total | 248 (40.1%) | 365 (59.0%) |
Disability Status by Sex by Age in Guy
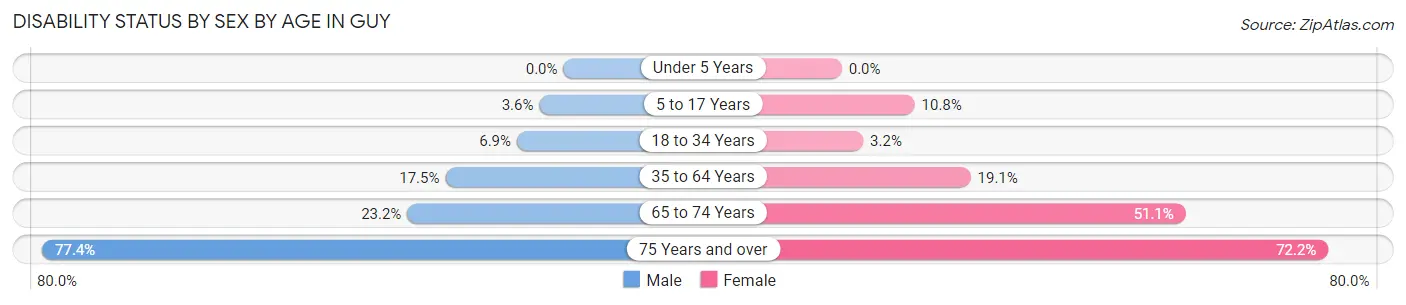
| Age Bracket | Male | Female |
| Under 5 Years | 0 (0.0%) | 0 (0.0%) |
| 5 to 17 Years | 2 (3.6%) | 4 (10.8%) |
| 18 to 34 Years | 4 (6.9%) | 2 (3.2%) |
| 35 to 64 Years | 17 (17.5%) | 22 (19.1%) |
| 65 to 74 Years | 16 (23.2%) | 24 (51.1%) |
| 75 Years and over | 24 (77.4%) | 13 (72.2%) |
Disability Class by Sex by Age in Guy
Disability Class: Hearing Difficulty
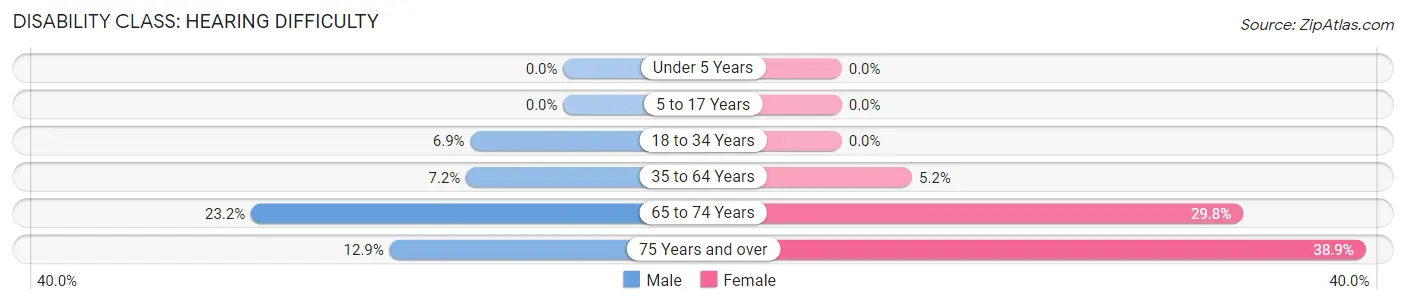
| Age Bracket | Male | Female |
| Under 5 Years | 0 (0.0%) | 0 (0.0%) |
| 5 to 17 Years | 0 (0.0%) | 0 (0.0%) |
| 18 to 34 Years | 4 (6.9%) | 0 (0.0%) |
| 35 to 64 Years | 7 (7.2%) | 6 (5.2%) |
| 65 to 74 Years | 16 (23.2%) | 14 (29.8%) |
| 75 Years and over | 4 (12.9%) | 7 (38.9%) |
Disability Class: Vision Difficulty
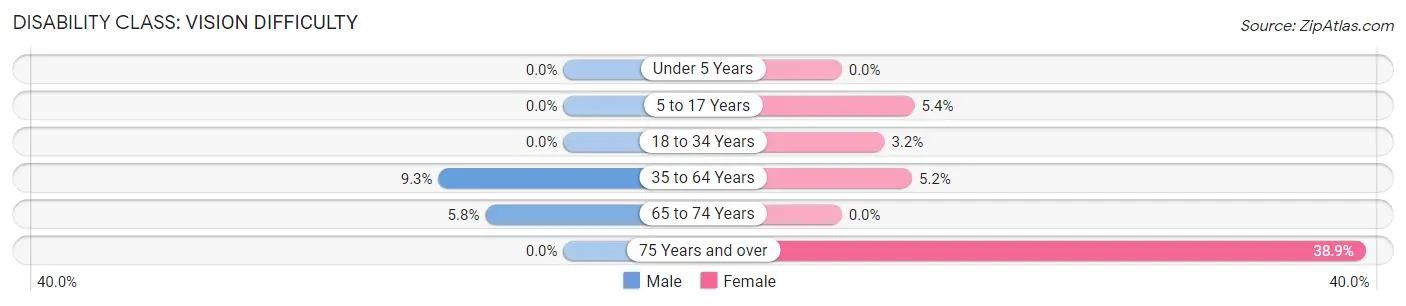
| Age Bracket | Male | Female |
| Under 5 Years | 0 (0.0%) | 0 (0.0%) |
| 5 to 17 Years | 0 (0.0%) | 2 (5.4%) |
| 18 to 34 Years | 0 (0.0%) | 2 (3.2%) |
| 35 to 64 Years | 9 (9.3%) | 6 (5.2%) |
| 65 to 74 Years | 4 (5.8%) | 0 (0.0%) |
| 75 Years and over | 0 (0.0%) | 7 (38.9%) |
Disability Class: Cognitive Difficulty
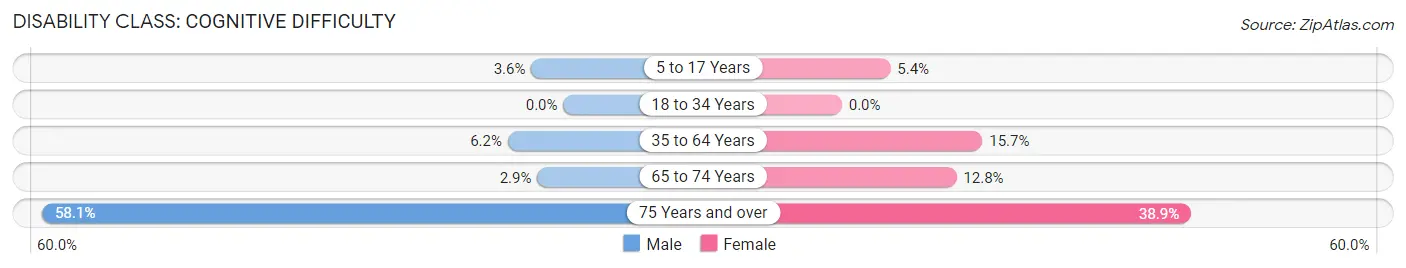
| Age Bracket | Male | Female |
| 5 to 17 Years | 2 (3.6%) | 2 (5.4%) |
| 18 to 34 Years | 0 (0.0%) | 0 (0.0%) |
| 35 to 64 Years | 6 (6.2%) | 18 (15.7%) |
| 65 to 74 Years | 2 (2.9%) | 6 (12.8%) |
| 75 Years and over | 18 (58.1%) | 7 (38.9%) |
Disability Class: Ambulatory Difficulty
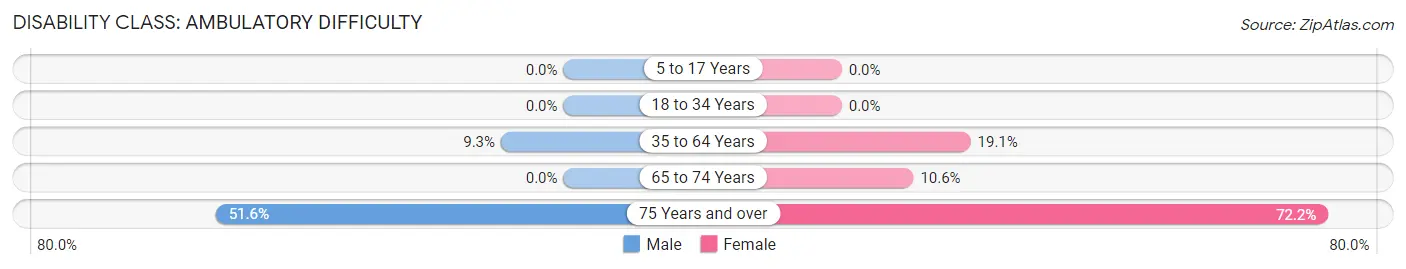
| Age Bracket | Male | Female |
| 5 to 17 Years | 0 (0.0%) | 0 (0.0%) |
| 18 to 34 Years | 0 (0.0%) | 0 (0.0%) |
| 35 to 64 Years | 9 (9.3%) | 22 (19.1%) |
| 65 to 74 Years | 0 (0.0%) | 5 (10.6%) |
| 75 Years and over | 16 (51.6%) | 13 (72.2%) |
Disability Class: Self-Care Difficulty
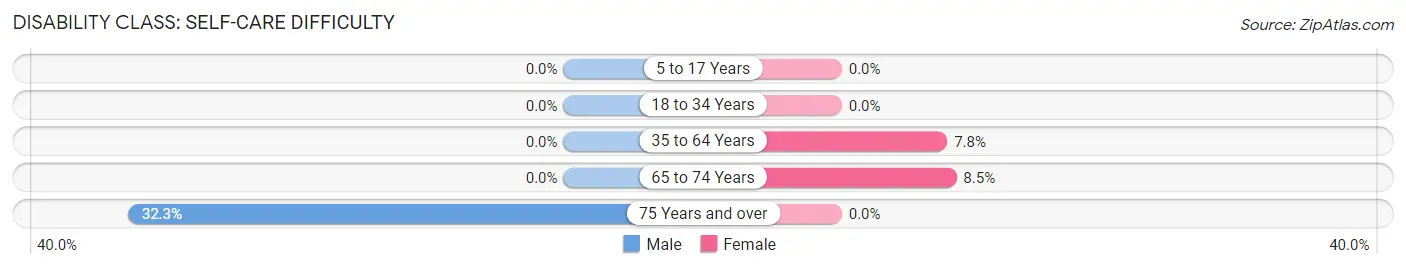
| Age Bracket | Male | Female |
| 5 to 17 Years | 0 (0.0%) | 0 (0.0%) |
| 18 to 34 Years | 0 (0.0%) | 0 (0.0%) |
| 35 to 64 Years | 0 (0.0%) | 9 (7.8%) |
| 65 to 74 Years | 0 (0.0%) | 4 (8.5%) |
| 75 Years and over | 10 (32.3%) | 0 (0.0%) |
Technology Access in Guy
Computing Device Access in Guy
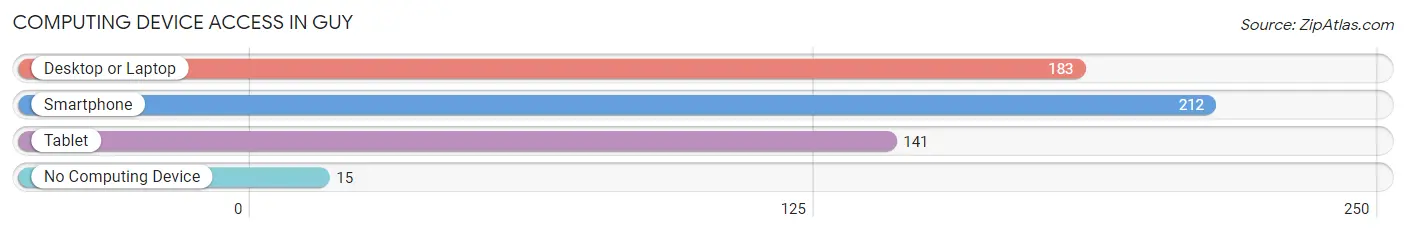
| Device Type | # Households | % Households |
| Desktop or Laptop | 183 | 76.2% |
| Smartphone | 212 | 88.3% |
| Tablet | 141 | 58.8% |
| No Computing Device | 15 | 6.2% |
| Total | 240 | 100.0% |
Internet Access in Guy
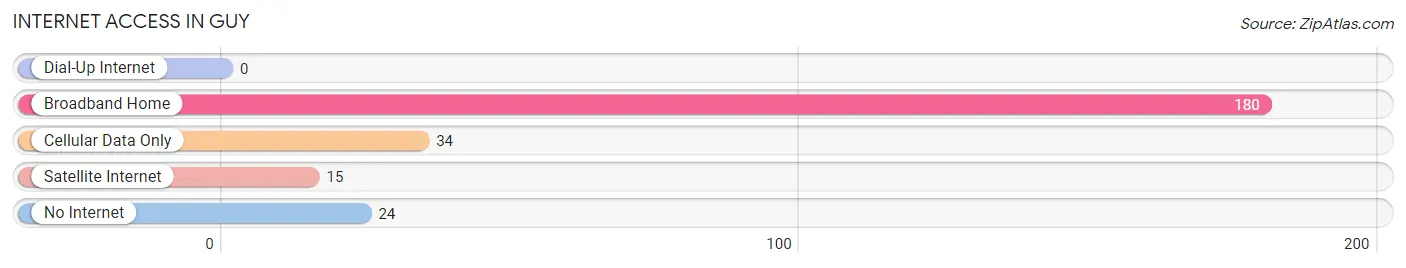
| Internet Type | # Households | % Households |
| Dial-Up Internet | 0 | 0.0% |
| Broadband Home | 180 | 75.0% |
| Cellular Data Only | 34 | 14.2% |
| Satellite Internet | 15 | 6.2% |
| No Internet | 24 | 10.0% |
| Total | 240 | 100.0% |
Guy Summary
History
Guy, Arkansas is a small town located in the northwest corner of the state. It is part of the Fayetteville-Springdale-Rogers Metropolitan Statistical Area and is located in Washington County. The town was founded in 1872 and was named after William Guy, a prominent local landowner.
The area was first settled by Native Americans, including the Osage, Quapaw, and Caddo tribes. The first European settlers arrived in the area in the early 1800s, and the town was officially established in 1872.
The town was an important stop on the St. Louis-San Francisco Railway, which ran through the area in the late 1800s. This railway helped to spur the growth of the town, and it soon became a thriving agricultural center.
In the early 1900s, Guy was home to several businesses, including a cotton gin, a grist mill, and a sawmill. The town also had a school, a post office, and a bank.
Geography
Guy is located in the northwest corner of Arkansas, in Washington County. It is situated in the Ozark Mountains, and the town is surrounded by rolling hills and forests. The town is located near the White River, which is a popular destination for fishing and boating.
The town is located about 25 miles north of Fayetteville and about 40 miles south of Bentonville. It is also located about 50 miles east of the Oklahoma border.
Economy
The economy of Guy is largely based on agriculture. The town is home to several farms, and the surrounding area is known for its production of cotton, soybeans, and other crops.
The town is also home to several small businesses, including a grocery store, a hardware store, and a few restaurants. There is also a small manufacturing plant in the town.
Demographics
As of the 2010 census, the population of Guy was 1,845. The town is predominantly white, with about 95% of the population being Caucasian. The median household income is $37,000, and the median age is 38.
Conclusion
Guy, Arkansas is a small town located in the northwest corner of the state. It is part of the Fayetteville-Springdale-Rogers Metropolitan Statistical Area and is located in Washington County. The town was founded in 1872 and was named after William Guy, a prominent local landowner. The economy of Guy is largely based on agriculture, and the town is home to several small businesses. As of the 2010 census, the population of Guy was 1,845. The town is predominantly white, with about 95% of the population being Caucasian.
Common Questions
What is Per Capita Income in Guy?
Per Capita income in Guy is $32,196.
What is the Median Family Income in Guy?
Median Family Income in Guy is $72,440.
What is the Median Household income in Guy?
Median Household Income in Guy is $70,000.
What is Income or Wage Gap in Guy?
Income or Wage Gap in Guy is 25.8%.
Women in Guy earn 74.2 cents for every dollar earned by a man.
What is Inequality or Gini Index in Guy?
Inequality or Gini Index in Guy is 0.43.
What is the Total Population of Guy?
Total Population of Guy is 619.
What is the Total Male Population of Guy?
Total Male Population of Guy is 328.
What is the Total Female Population of Guy?
Total Female Population of Guy is 291.
What is the Ratio of Males per 100 Females in Guy?
There are 112.71 Males per 100 Females in Guy.
What is the Ratio of Females per 100 Males in Guy?
There are 88.72 Females per 100 Males in Guy.
What is the Median Population Age in Guy?
Median Population Age in Guy is 39.0 Years.
What is the Average Family Size in Guy
Average Family Size in Guy is 3.0 People.
What is the Average Household Size in Guy
Average Household Size in Guy is 2.6 People.
How Large is the Labor Force in Guy?
There are 287 People in the Labor Forcein in Guy.
What is the Percentage of People in the Labor Force in Guy?
55.7% of People are in the Labor Force in Guy.
What is the Unemployment Rate in Guy?
Unemployment Rate in Guy is 10.8%.