Charleston, AR Map & Demographics
Charleston Map
Charleston Overview
$29,348
PER CAPITA INCOME
$83,009
AVG FAMILY INCOME
$63,661
AVG HOUSEHOLD INCOME
19.4%
WAGE / INCOME GAP [ % ]
80.6¢/ $1
WAGE / INCOME GAP [ $ ]
0.42
INEQUALITY / GINI INDEX
2,585
TOTAL POPULATION
1,183
MALE POPULATION
1,402
FEMALE POPULATION
84.38
MALES / 100 FEMALES
118.51
FEMALES / 100 MALES
40.6
MEDIAN AGE
3.1
AVG FAMILY SIZE
2.5
AVG HOUSEHOLD SIZE
1,275
LABOR FORCE [ PEOPLE ]
60.3%
PERCENT IN LABOR FORCE
4.2%
UNEMPLOYMENT RATE
Charleston Zip Codes
Charleston Area Codes
Income in Charleston
Income Overview in Charleston
Per Capita Income in Charleston is $29,348, while median incomes of families and households are $83,009 and $63,661 respectively.
| Characteristic | Number | Measure |
| Per Capita Income | 2,585 | $29,348 |
| Median Family Income | 665 | $83,009 |
| Mean Family Income | 665 | $93,305 |
| Median Household Income | 1,006 | $63,661 |
| Mean Household Income | 1,006 | $74,419 |
| Income Deficit | 665 | $0 |
| Wage / Income Gap (%) | 2,585 | 19.38% |
| Wage / Income Gap ($) | 2,585 | 80.62¢ per $1 |
| Gini / Inequality Index | 2,585 | 0.42 |
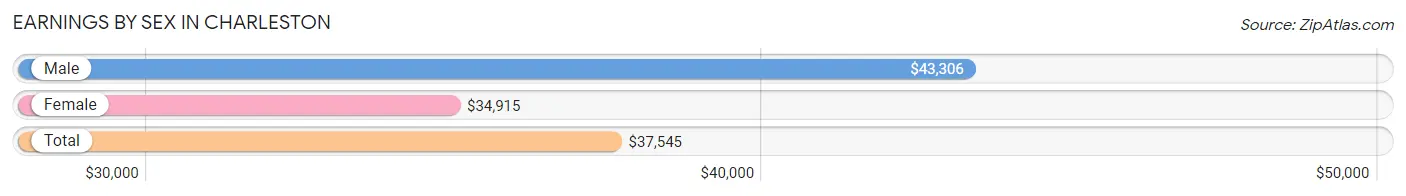
Earnings by Sex in Charleston
Average Earnings in Charleston are $37,545, $43,306 for men and $34,915 for women, a difference of 19.4%.
| Sex | Number | Average Earnings |
| Male | 642 (51.0%) | $43,306 |
| Female | 617 (49.0%) | $34,915 |
| Total | 1,259 (100.0%) | $37,545 |
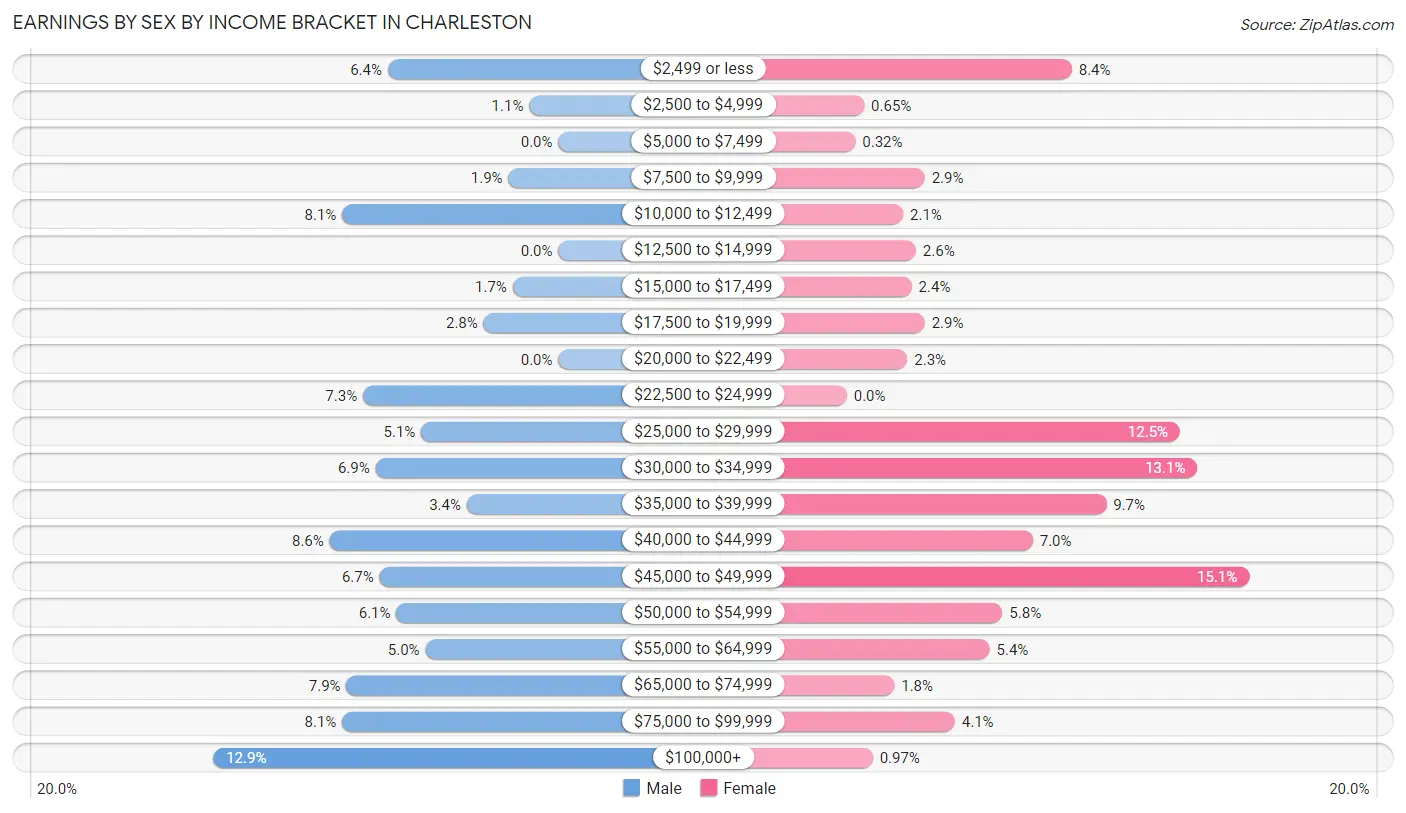
Earnings by Sex by Income Bracket in Charleston
The most common earnings brackets in Charleston are $100,000+ for men (83 | 12.9%) and $45,000 to $49,999 for women (93 | 15.1%).
| Income | Male | Female |
| $2,499 or less | 41 (6.4%) | 52 (8.4%) |
| $2,500 to $4,999 | 7 (1.1%) | 4 (0.6%) |
| $5,000 to $7,499 | 0 (0.0%) | 2 (0.3%) |
| $7,500 to $9,999 | 12 (1.9%) | 18 (2.9%) |
| $10,000 to $12,499 | 52 (8.1%) | 13 (2.1%) |
| $12,500 to $14,999 | 0 (0.0%) | 16 (2.6%) |
| $15,000 to $17,499 | 11 (1.7%) | 15 (2.4%) |
| $17,500 to $19,999 | 18 (2.8%) | 18 (2.9%) |
| $20,000 to $22,499 | 0 (0.0%) | 14 (2.3%) |
| $22,500 to $24,999 | 47 (7.3%) | 0 (0.0%) |
| $25,000 to $29,999 | 33 (5.1%) | 77 (12.5%) |
| $30,000 to $34,999 | 44 (6.9%) | 81 (13.1%) |
| $35,000 to $39,999 | 22 (3.4%) | 60 (9.7%) |
| $40,000 to $44,999 | 55 (8.6%) | 43 (7.0%) |
| $45,000 to $49,999 | 43 (6.7%) | 93 (15.1%) |
| $50,000 to $54,999 | 39 (6.1%) | 36 (5.8%) |
| $55,000 to $64,999 | 32 (5.0%) | 33 (5.3%) |
| $65,000 to $74,999 | 51 (7.9%) | 11 (1.8%) |
| $75,000 to $99,999 | 52 (8.1%) | 25 (4.1%) |
| $100,000+ | 83 (12.9%) | 6 (1.0%) |
| Total | 642 (100.0%) | 617 (100.0%) |
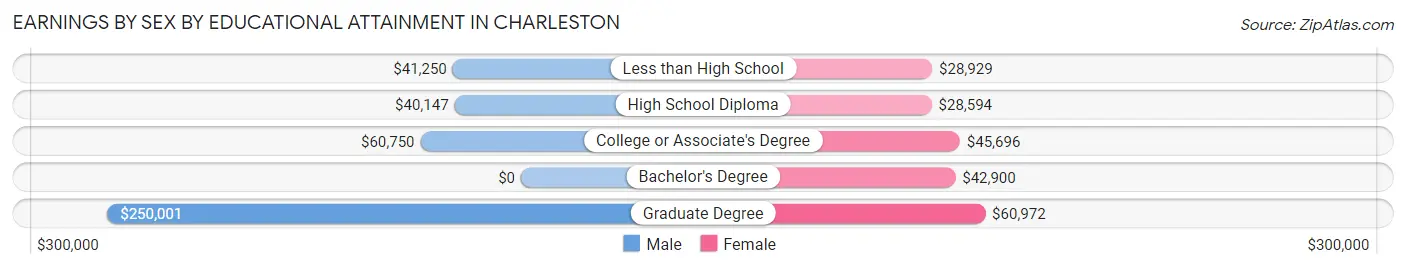
Earnings by Sex by Educational Attainment in Charleston
Average earnings in Charleston are $47,462 for men and $36,442 for women, a difference of 23.2%. Men with an educational attainment of graduate degree enjoy the highest average annual earnings of $250,001, while those with high school diploma education earn the least with $40,147. Women with an educational attainment of graduate degree earn the most with the average annual earnings of $60,972, while those with high school diploma education have the smallest earnings of $28,594.
| Educational Attainment | Male Income | Female Income |
| Less than High School | $41,250 | $28,929 |
| High School Diploma | $40,147 | $28,594 |
| College or Associate's Degree | $60,750 | $45,696 |
| Bachelor's Degree | - | - |
| Graduate Degree | $250,001 | $60,972 |
| Total | $47,462 | $36,442 |
Family Income in Charleston
Family Income Brackets in Charleston
According to the Charleston family income data, there are 149 families falling into the $100,000 to $149,999 income range, which is the most common income bracket and makes up 22.4% of all families. Conversely, the $10,000 to $14,999 income bracket is the least frequent group with only 4 families (0.6%) belonging to this category.
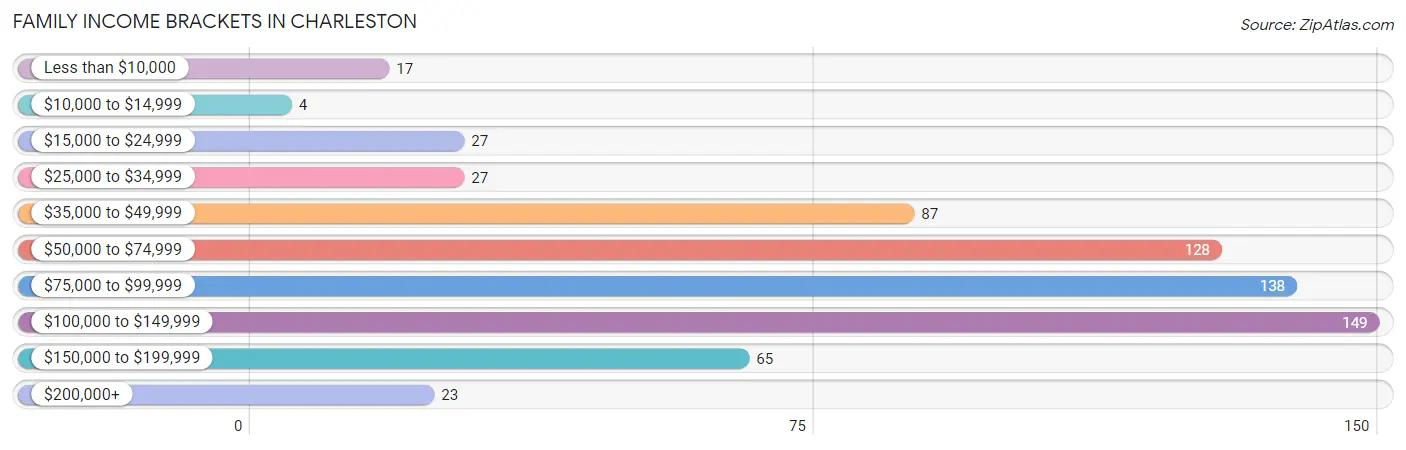
| Income Bracket | # Families | % Families |
| Less than $10,000 | 17 | 2.6% |
| $10,000 to $14,999 | 4 | 0.6% |
| $15,000 to $24,999 | 27 | 4.1% |
| $25,000 to $34,999 | 27 | 4.1% |
| $35,000 to $49,999 | 87 | 13.1% |
| $50,000 to $74,999 | 128 | 19.2% |
| $75,000 to $99,999 | 138 | 20.8% |
| $100,000 to $149,999 | 149 | 22.4% |
| $150,000 to $199,999 | 65 | 9.8% |
| $200,000+ | 23 | 3.5% |
Family Income by Famaliy Size in Charleston
4-person families (101 | 15.2%) account for the highest median family income in Charleston with $110,893 per family, while 2-person families (304 | 45.7%) have the highest median income of $32,322 per family member.
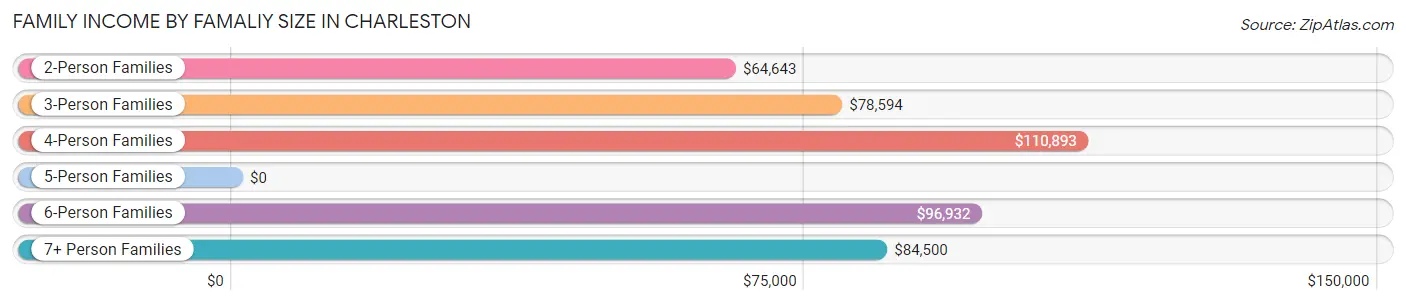
| Income Bracket | # Families | Median Income |
| 2-Person Families | 304 (45.7%) | $64,643 |
| 3-Person Families | 186 (28.0%) | $78,594 |
| 4-Person Families | 101 (15.2%) | $110,893 |
| 5-Person Families | 21 (3.2%) | $0 |
| 6-Person Families | 31 (4.7%) | $96,932 |
| 7+ Person Families | 22 (3.3%) | $84,500 |
| Total | 665 (100.0%) | $83,009 |
Family Income by Number of Earners in Charleston
The median family income in Charleston is $83,009, with families comprising 2 earners (294) having the highest median family income of $110,278, while families with 1 earner (244) have the lowest median family income of $51,324, accounting for 44.2% and 36.7% of families, respectively.
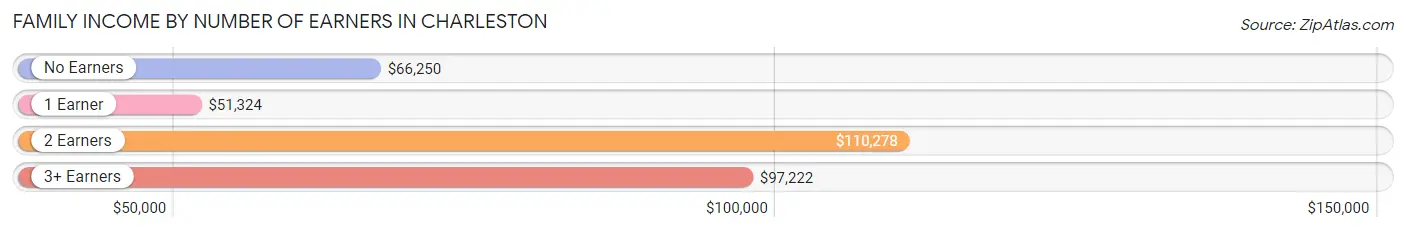
| Number of Earners | # Families | Median Income |
| No Earners | 77 (11.6%) | $66,250 |
| 1 Earner | 244 (36.7%) | $51,324 |
| 2 Earners | 294 (44.2%) | $110,278 |
| 3+ Earners | 50 (7.5%) | $97,222 |
| Total | 665 (100.0%) | $83,009 |
Household Income in Charleston
Household Income Brackets in Charleston
With 178 households falling in the category, the $50,000 to $74,999 income range is the most frequent in Charleston, accounting for 17.7% of all households. In contrast, only 23 households (2.3%) fall into the $200,000+ income bracket, making it the least populous group.
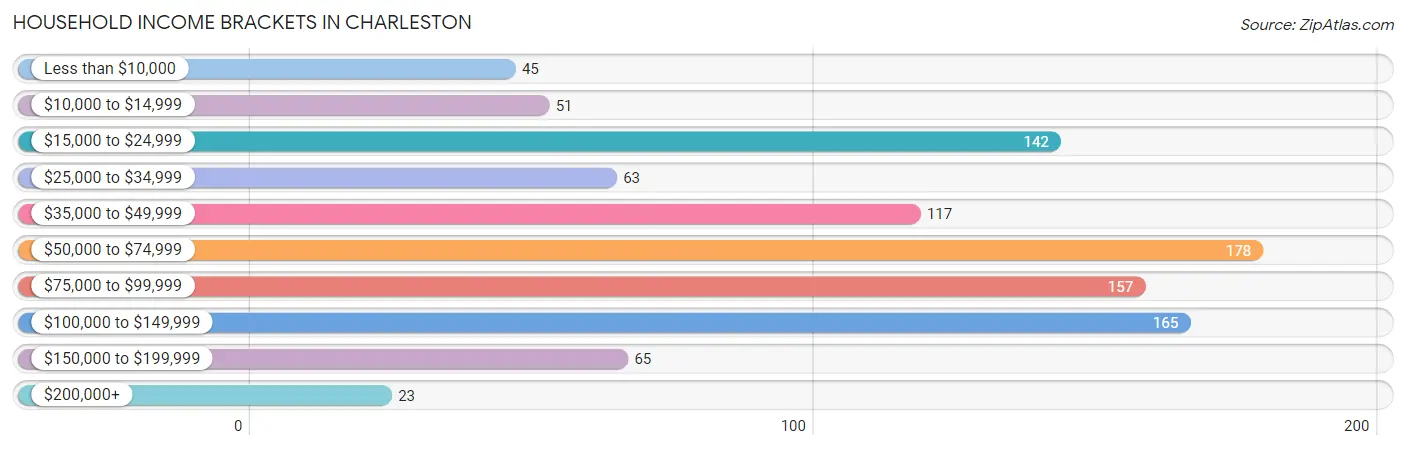
| Income Bracket | # Households | % Households |
| Less than $10,000 | 45 | 4.5% |
| $10,000 to $14,999 | 51 | 5.1% |
| $15,000 to $24,999 | 142 | 14.1% |
| $25,000 to $34,999 | 63 | 6.3% |
| $35,000 to $49,999 | 117 | 11.6% |
| $50,000 to $74,999 | 178 | 17.7% |
| $75,000 to $99,999 | 157 | 15.6% |
| $100,000 to $149,999 | 165 | 16.4% |
| $150,000 to $199,999 | 65 | 6.5% |
| $200,000+ | 23 | 2.3% |
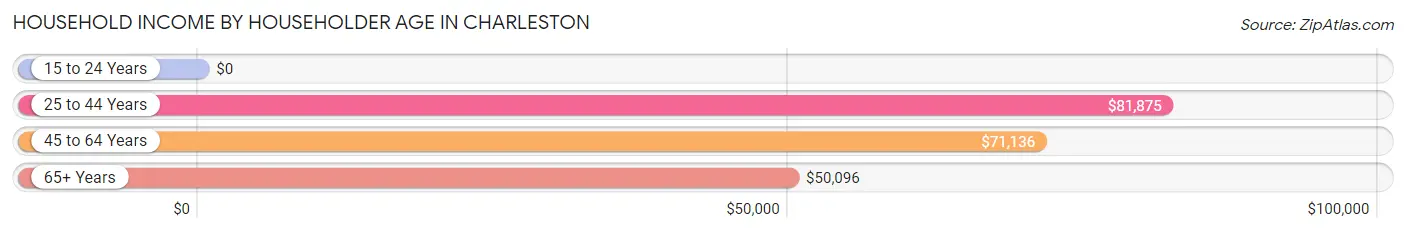
Household Income by Householder Age in Charleston
The median household income in Charleston is $63,661, with the highest median household income of $81,875 found in the 25 to 44 years age bracket for the primary householder. A total of 302 households (30.0%) fall into this category. Meanwhile, the 15 to 24 years age bracket for the primary householder has the lowest median household income of $0, with 73 households (7.3%) in this group.
| Income Bracket | # Households | Median Income |
| 15 to 24 Years | 73 (7.3%) | $0 |
| 25 to 44 Years | 302 (30.0%) | $81,875 |
| 45 to 64 Years | 338 (33.6%) | $71,136 |
| 65+ Years | 293 (29.1%) | $50,096 |
| Total | 1,006 (100.0%) | $63,661 |
Poverty in Charleston
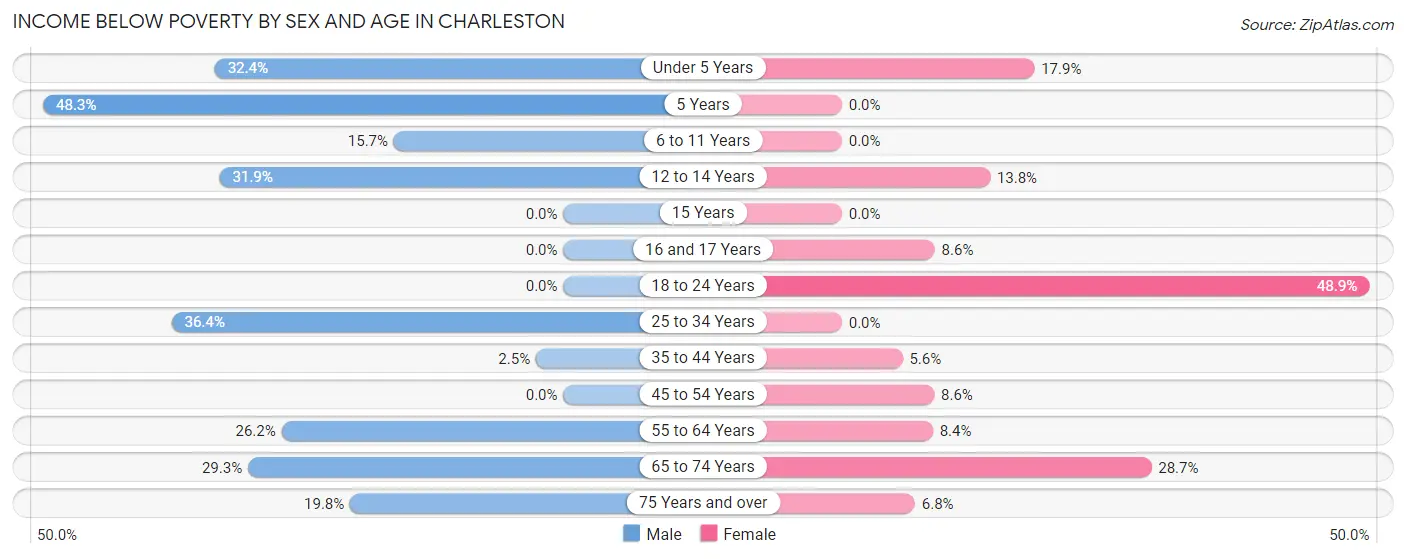
Income Below Poverty by Sex and Age in Charleston
With 14.5% poverty level for males and 11.3% for females among the residents of Charleston, 5 year old males and 18 to 24 year old females are the most vulnerable to poverty, with 14 males (48.3%) and 46 females (48.9%) in their respective age groups living below the poverty level.
| Age Bracket | Male | Female |
| Under 5 Years | 22 (32.4%) | 5 (17.9%) |
| 5 Years | 14 (48.3%) | 0 (0.0%) |
| 6 to 11 Years | 14 (15.7%) | 0 (0.0%) |
| 12 to 14 Years | 15 (31.9%) | 11 (13.8%) |
| 15 Years | 0 (0.0%) | 0 (0.0%) |
| 16 and 17 Years | 0 (0.0%) | 5 (8.6%) |
| 18 to 24 Years | 0 (0.0%) | 46 (48.9%) |
| 25 to 34 Years | 20 (36.4%) | 0 (0.0%) |
| 35 to 44 Years | 5 (2.5%) | 20 (5.6%) |
| 45 to 54 Years | 0 (0.0%) | 9 (8.6%) |
| 55 to 64 Years | 34 (26.2%) | 13 (8.4%) |
| 65 to 74 Years | 24 (29.3%) | 27 (28.7%) |
| 75 Years and over | 19 (19.8%) | 12 (6.8%) |
| Total | 167 (14.5%) | 148 (11.3%) |
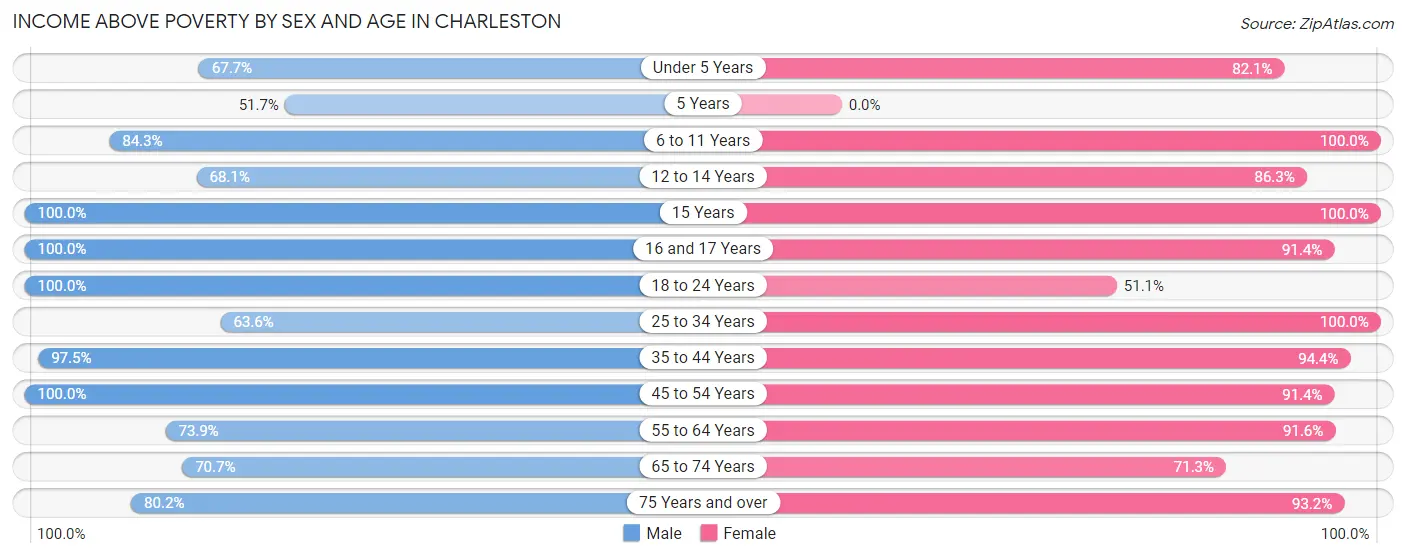
Income Above Poverty by Sex and Age in Charleston
According to the poverty statistics in Charleston, males aged 15 years and females aged 6 to 11 years are the age groups that are most secure financially, with 100.0% of males and 100.0% of females in these age groups living above the poverty line.
| Age Bracket | Male | Female |
| Under 5 Years | 46 (67.6%) | 23 (82.1%) |
| 5 Years | 15 (51.7%) | 0 (0.0%) |
| 6 to 11 Years | 75 (84.3%) | 55 (100.0%) |
| 12 to 14 Years | 32 (68.1%) | 69 (86.3%) |
| 15 Years | 13 (100.0%) | 46 (100.0%) |
| 16 and 17 Years | 53 (100.0%) | 53 (91.4%) |
| 18 to 24 Years | 156 (100.0%) | 48 (51.1%) |
| 25 to 34 Years | 35 (63.6%) | 63 (100.0%) |
| 35 to 44 Years | 192 (97.5%) | 335 (94.4%) |
| 45 to 54 Years | 140 (100.0%) | 96 (91.4%) |
| 55 to 64 Years | 96 (73.9%) | 141 (91.6%) |
| 65 to 74 Years | 58 (70.7%) | 67 (71.3%) |
| 75 Years and over | 77 (80.2%) | 165 (93.2%) |
| Total | 988 (85.5%) | 1,161 (88.7%) |
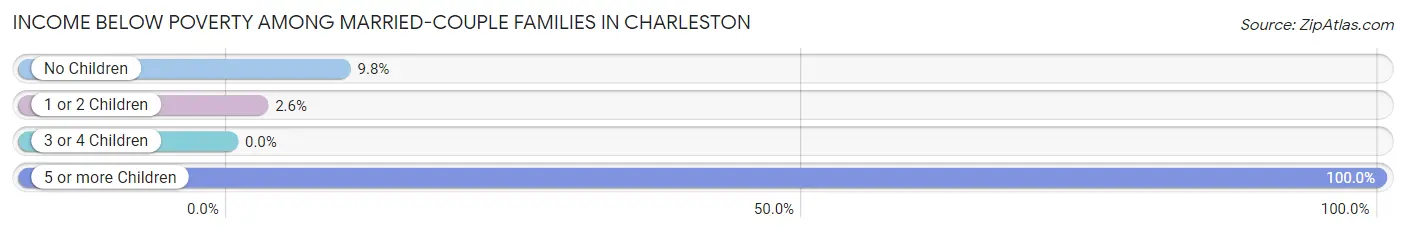
Income Below Poverty Among Married-Couple Families in Charleston
The poverty statistics for married-couple families in Charleston show that 7.5% or 37 of the total 493 families live below the poverty line. Families with 5 or more children have the highest poverty rate of 100.0%, comprising of 7 families. On the other hand, families with 3 or 4 children have the lowest poverty rate of 0.0%, which includes 0 families.
| Children | Above Poverty | Below Poverty |
| No Children | 230 (90.2%) | 25 (9.8%) |
| 1 or 2 Children | 185 (97.4%) | 5 (2.6%) |
| 3 or 4 Children | 41 (100.0%) | 0 (0.0%) |
| 5 or more Children | 0 (0.0%) | 7 (100.0%) |
| Total | 456 (92.5%) | 37 (7.5%) |
Income Below Poverty Among Single-Parent Households in Charleston
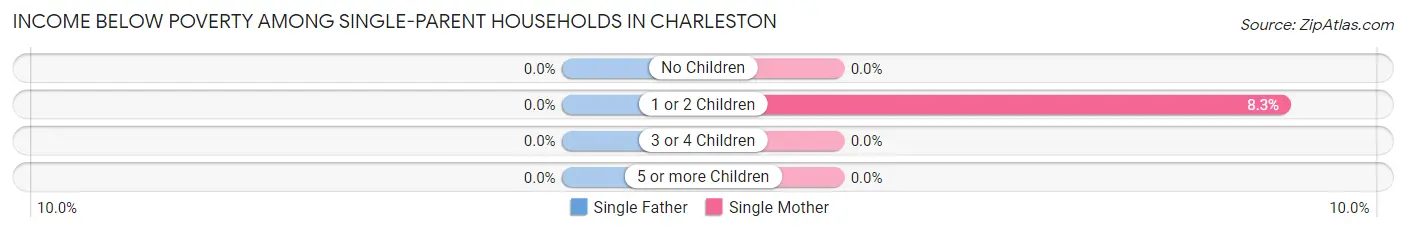
| Children | Single Father | Single Mother |
| No Children | 0 (0.0%) | 0 (0.0%) |
| 1 or 2 Children | 0 (0.0%) | 9 (8.3%) |
| 3 or 4 Children | 0 (0.0%) | 0 (0.0%) |
| 5 or more Children | 0 (0.0%) | 0 (0.0%) |
| Total | 0 (0.0%) | 9 (6.3%) |
Income Below Poverty Among Married-Couple vs Single-Parent Households in Charleston
The poverty data for Charleston shows that 37 of the married-couple family households (7.5%) and 9 of the single-parent households (5.2%) are living below the poverty level. Within the married-couple family households, those with 5 or more children have the highest poverty rate, with 7 households (100.0%) falling below the poverty line. Among the single-parent households, those with 1 or 2 children have the highest poverty rate, with 9 household (6.7%) living below poverty.
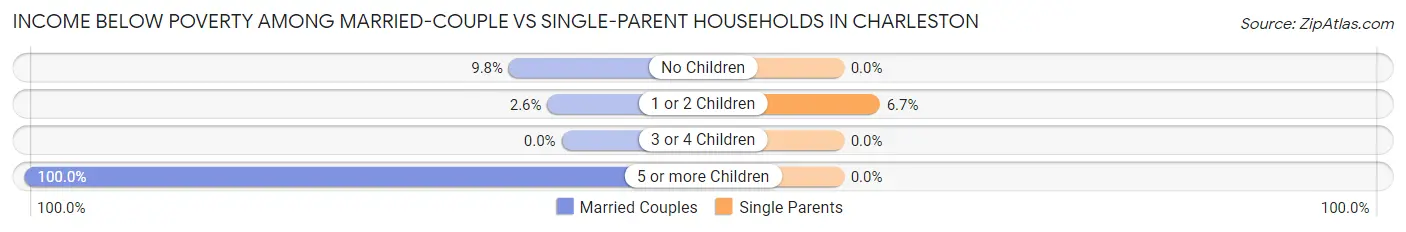
| Children | Married-Couple Families | Single-Parent Households |
| No Children | 25 (9.8%) | 0 (0.0%) |
| 1 or 2 Children | 5 (2.6%) | 9 (6.7%) |
| 3 or 4 Children | 0 (0.0%) | 0 (0.0%) |
| 5 or more Children | 7 (100.0%) | 0 (0.0%) |
| Total | 37 (7.5%) | 9 (5.2%) |
Race in Charleston
The most populous races in Charleston are White / Caucasian (2,264 | 87.6%), Two or more Races (274 | 10.6%), and Black / African American (24 | 0.9%).
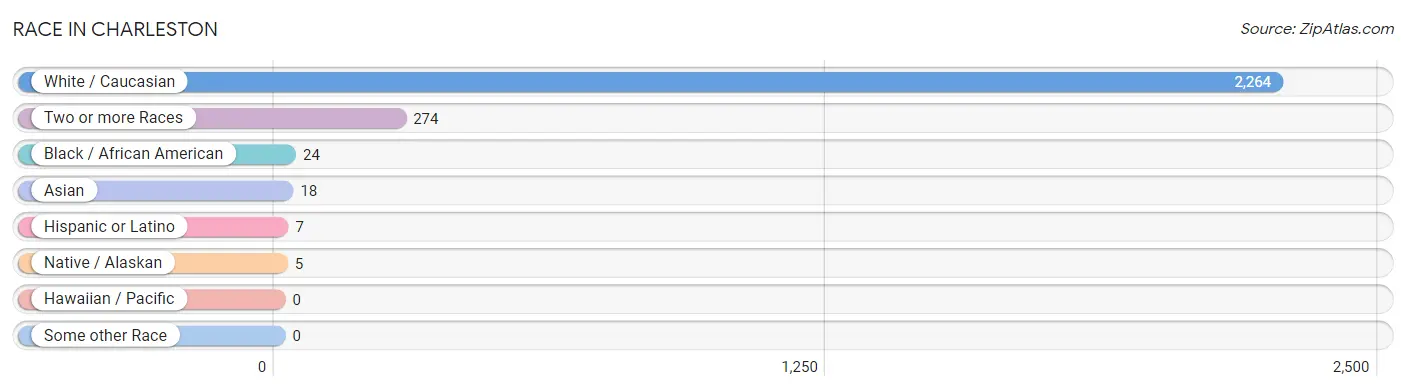
| Race | # Population | % Population |
| Asian | 18 | 0.7% |
| Black / African American | 24 | 0.9% |
| Hawaiian / Pacific | 0 | 0.0% |
| Hispanic or Latino | 7 | 0.3% |
| Native / Alaskan | 5 | 0.2% |
| White / Caucasian | 2,264 | 87.6% |
| Two or more Races | 274 | 10.6% |
| Some other Race | 0 | 0.0% |
| Total | 2,585 | 100.0% |
Ancestry in Charleston
The most populous ancestries reported in Charleston are American (719 | 27.8%), German (357 | 13.8%), Irish (237 | 9.2%), English (141 | 5.4%), and Dutch (79 | 3.1%), together accounting for 59.3% of all Charleston residents.
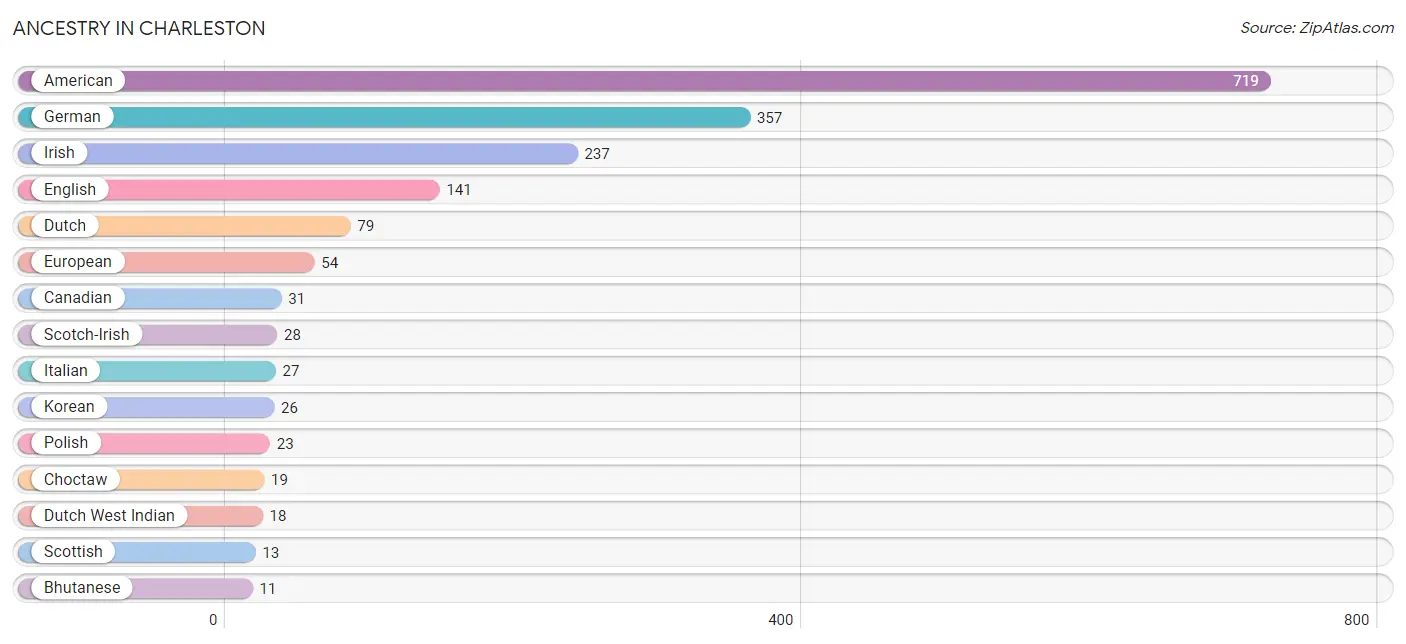
| Ancestry | # Population | % Population |
| American | 719 | 27.8% |
| Bhutanese | 11 | 0.4% |
| British | 5 | 0.2% |
| Burmese | 6 | 0.2% |
| Canadian | 31 | 1.2% |
| Cherokee | 9 | 0.4% |
| Choctaw | 19 | 0.7% |
| Cuban | 7 | 0.3% |
| Danish | 6 | 0.2% |
| Dutch | 79 | 3.1% |
| Dutch West Indian | 18 | 0.7% |
| English | 141 | 5.4% |
| European | 54 | 2.1% |
| German | 357 | 13.8% |
| Irish | 237 | 9.2% |
| Italian | 27 | 1.0% |
| Korean | 26 | 1.0% |
| Norwegian | 11 | 0.4% |
| Polish | 23 | 0.9% |
| Scotch-Irish | 28 | 1.1% |
| Scottish | 13 | 0.5% |
| Welsh | 10 | 0.4% | View All 22 Rows |
Immigrants in Charleston
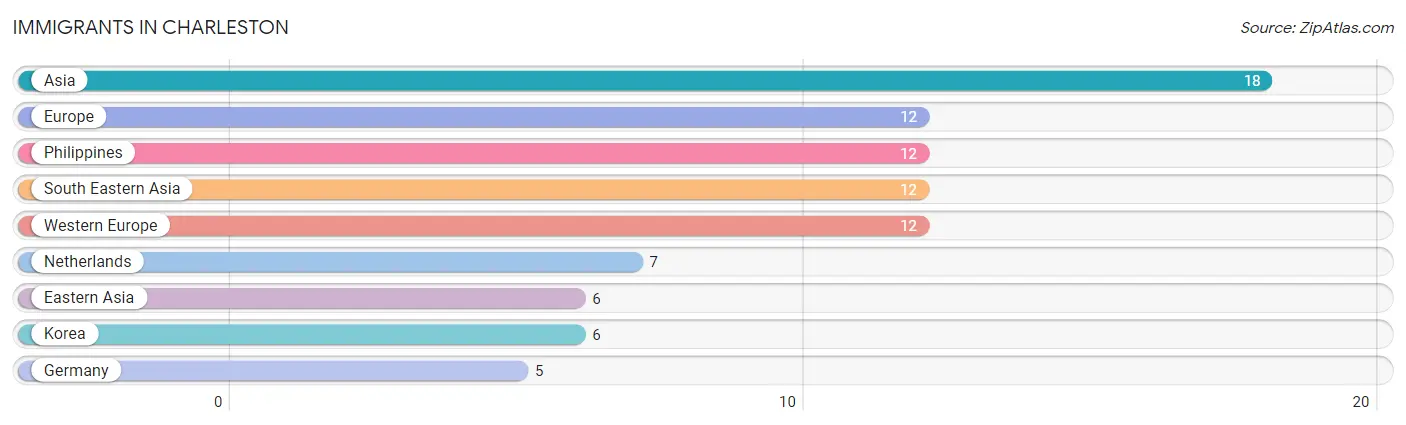
The most numerous immigrant groups reported in Charleston came from Asia (18 | 0.7%), Europe (12 | 0.5%), Philippines (12 | 0.5%), South Eastern Asia (12 | 0.5%), and Western Europe (12 | 0.5%), together accounting for 2.5% of all Charleston residents.
| Immigration Origin | # Population | % Population |
| Asia | 18 | 0.7% |
| Eastern Asia | 6 | 0.2% |
| Europe | 12 | 0.5% |
| Germany | 5 | 0.2% |
| Korea | 6 | 0.2% |
| Netherlands | 7 | 0.3% |
| Philippines | 12 | 0.5% |
| South Eastern Asia | 12 | 0.5% |
| Western Europe | 12 | 0.5% | View All 9 Rows |
Sex and Age in Charleston
Sex and Age in Charleston
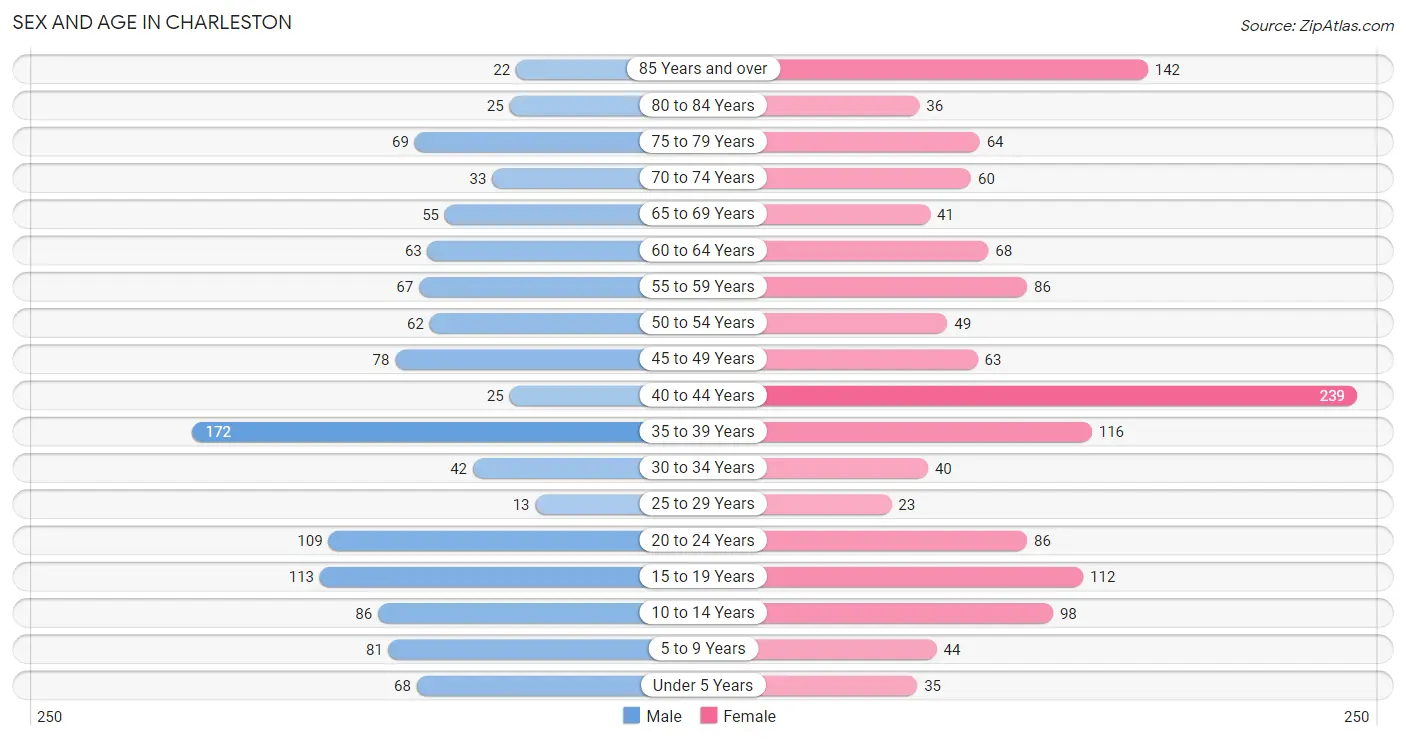
The most populous age groups in Charleston are 35 to 39 Years (172 | 14.5%) for men and 40 to 44 Years (239 | 17.1%) for women.
| Age Bracket | Male | Female |
| Under 5 Years | 68 (5.8%) | 35 (2.5%) |
| 5 to 9 Years | 81 (6.9%) | 44 (3.1%) |
| 10 to 14 Years | 86 (7.3%) | 98 (7.0%) |
| 15 to 19 Years | 113 (9.6%) | 112 (8.0%) |
| 20 to 24 Years | 109 (9.2%) | 86 (6.1%) |
| 25 to 29 Years | 13 (1.1%) | 23 (1.6%) |
| 30 to 34 Years | 42 (3.5%) | 40 (2.9%) |
| 35 to 39 Years | 172 (14.5%) | 116 (8.3%) |
| 40 to 44 Years | 25 (2.1%) | 239 (17.1%) |
| 45 to 49 Years | 78 (6.6%) | 63 (4.5%) |
| 50 to 54 Years | 62 (5.2%) | 49 (3.5%) |
| 55 to 59 Years | 67 (5.7%) | 86 (6.1%) |
| 60 to 64 Years | 63 (5.3%) | 68 (4.9%) |
| 65 to 69 Years | 55 (4.6%) | 41 (2.9%) |
| 70 to 74 Years | 33 (2.8%) | 60 (4.3%) |
| 75 to 79 Years | 69 (5.8%) | 64 (4.6%) |
| 80 to 84 Years | 25 (2.1%) | 36 (2.6%) |
| 85 Years and over | 22 (1.9%) | 142 (10.1%) |
| Total | 1,183 (100.0%) | 1,402 (100.0%) |
Families and Households in Charleston
Median Family Size in Charleston
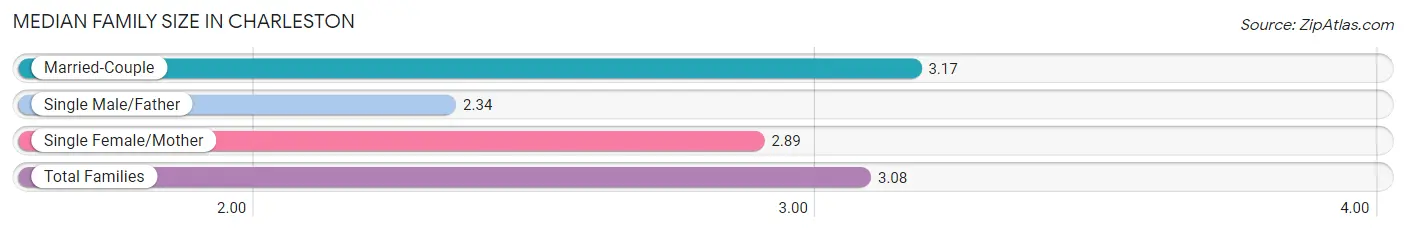
The median family size in Charleston is 3.08 persons per family, with married-couple families (493 | 74.1%) accounting for the largest median family size of 3.17 persons per family. On the other hand, single male/father families (29 | 4.4%) represent the smallest median family size with 2.34 persons per family.
| Family Type | # Families | Family Size |
| Married-Couple | 493 (74.1%) | 3.17 |
| Single Male/Father | 29 (4.4%) | 2.34 |
| Single Female/Mother | 143 (21.5%) | 2.89 |
| Total Families | 665 (100.0%) | 3.08 |
Median Household Size in Charleston
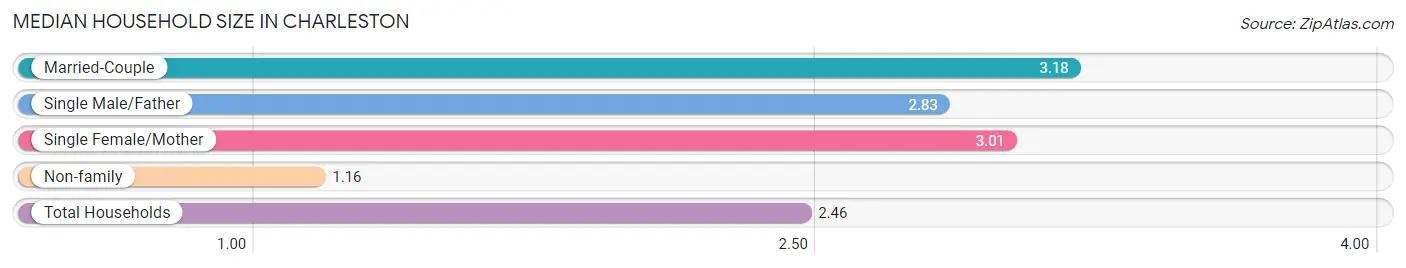
The median household size in Charleston is 2.46 persons per household, with married-couple households (493 | 49.0%) accounting for the largest median household size of 3.18 persons per household. non-family households (341 | 33.9%) represent the smallest median household size with 1.16 persons per household.
| Household Type | # Households | Household Size |
| Married-Couple | 493 (49.0%) | 3.18 |
| Single Male/Father | 29 (2.9%) | 2.83 |
| Single Female/Mother | 143 (14.2%) | 3.01 |
| Non-family | 341 (33.9%) | 1.16 |
| Total Households | 1,006 (100.0%) | 2.46 |
Household Size by Marriage Status in Charleston
Out of a total of 1,006 households in Charleston, 665 (66.1%) are family households, while 341 (33.9%) are nonfamily households. The most numerous type of family households are 2-person households, comprising 296, and the most common type of nonfamily households are 1-person households, comprising 284.
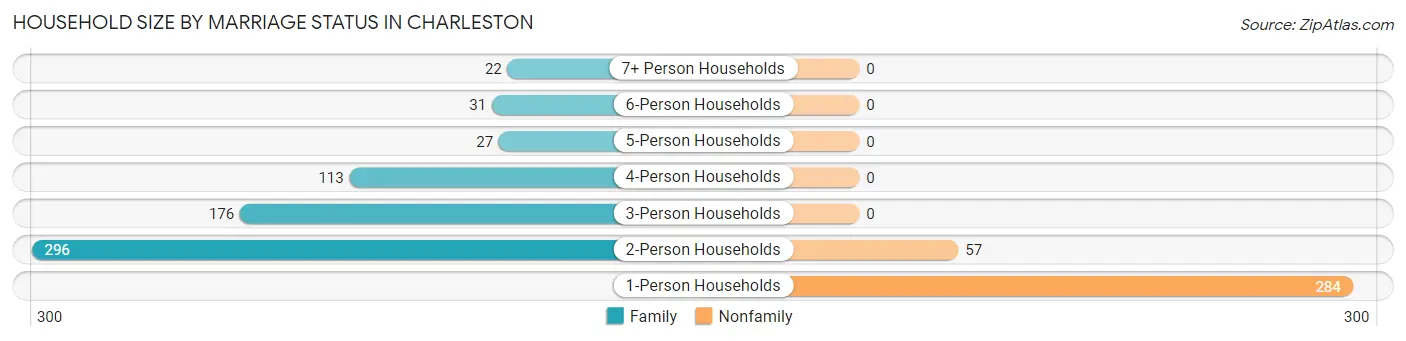
| Household Size | Family Households | Nonfamily Households |
| 1-Person Households | - | 284 (28.2%) |
| 2-Person Households | 296 (29.4%) | 57 (5.7%) |
| 3-Person Households | 176 (17.5%) | 0 (0.0%) |
| 4-Person Households | 113 (11.2%) | 0 (0.0%) |
| 5-Person Households | 27 (2.7%) | 0 (0.0%) |
| 6-Person Households | 31 (3.1%) | 0 (0.0%) |
| 7+ Person Households | 22 (2.2%) | 0 (0.0%) |
| Total | 665 (66.1%) | 341 (33.9%) |
Female Fertility in Charleston
Fertility by Age in Charleston
Average fertility rate in Charleston is 30.0 births per 1,000 women. Women in the age bracket of 20 to 34 years have the highest fertility rate with 141.0 births per 1,000 women. Women in the age bracket of 20 to 34 years acount for 100.0% of all women with births.
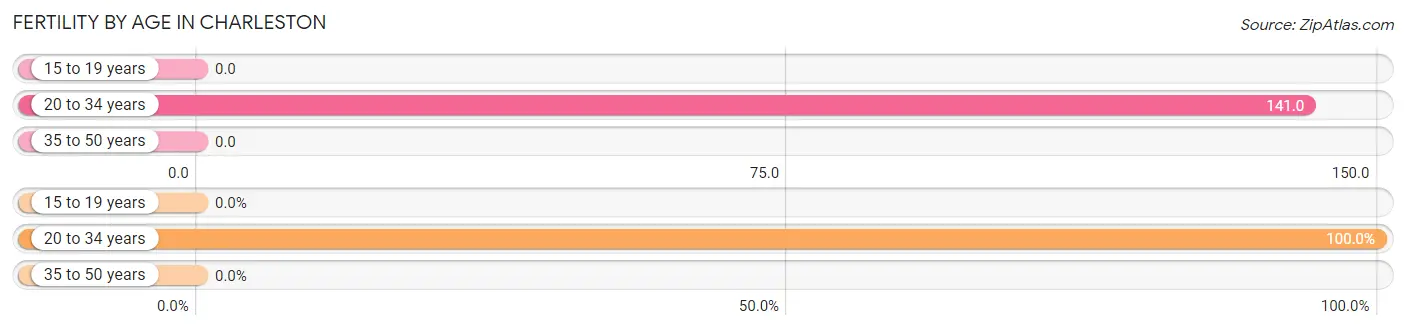
| Age Bracket | Women with Births | Births / 1,000 Women |
| 15 to 19 years | 0 (0.0%) | 0.0 |
| 20 to 34 years | 21 (100.0%) | 141.0 |
| 35 to 50 years | 0 (0.0%) | 0.0 |
| Total | 21 (100.0%) | 30.0 |
Fertility by Age by Marriage Status in Charleston
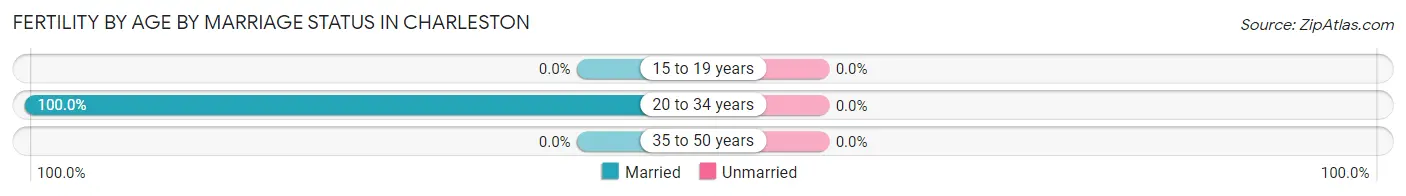
| Age Bracket | Married | Unmarried |
| 15 to 19 years | 0 (0.0%) | 0 (0.0%) |
| 20 to 34 years | 21 (100.0%) | 0 (0.0%) |
| 35 to 50 years | 0 (0.0%) | 0 (0.0%) |
| Total | 21 (100.0%) | 0 (0.0%) |
Fertility by Education in Charleston
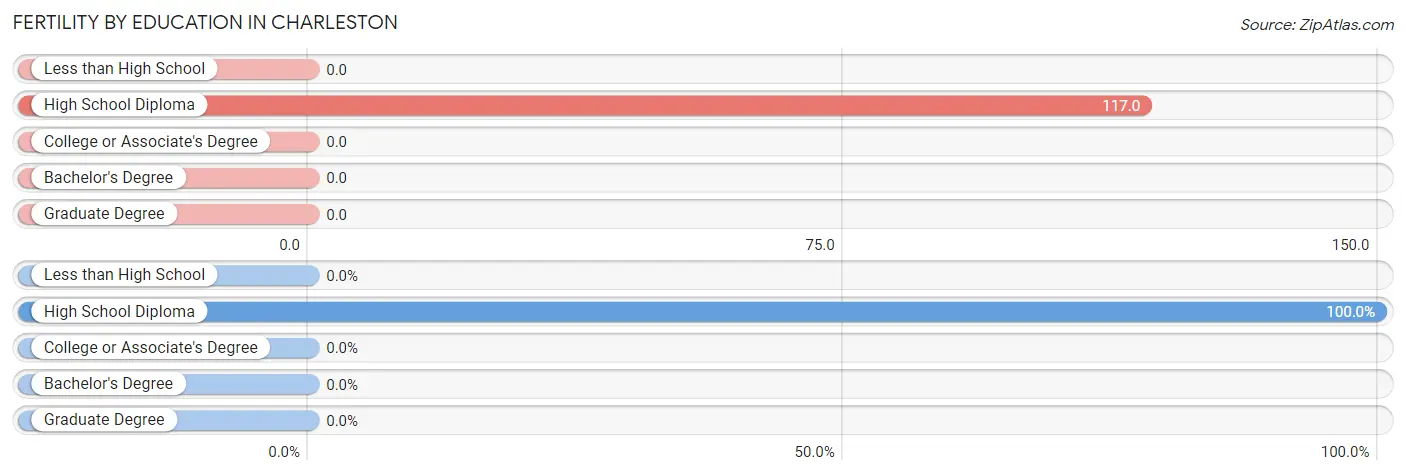
| Educational Attainment | Women with Births | Births / 1,000 Women |
| Less than High School | 0 (0.0%) | 0.0 |
| High School Diploma | 21 (100.0%) | 117.0 |
| College or Associate's Degree | 0 (0.0%) | 0.0 |
| Bachelor's Degree | 0 (0.0%) | 0.0 |
| Graduate Degree | 0 (0.0%) | 0.0 |
| Total | 21 (100.0%) | 30.0 |
Fertility by Education by Marriage Status in Charleston
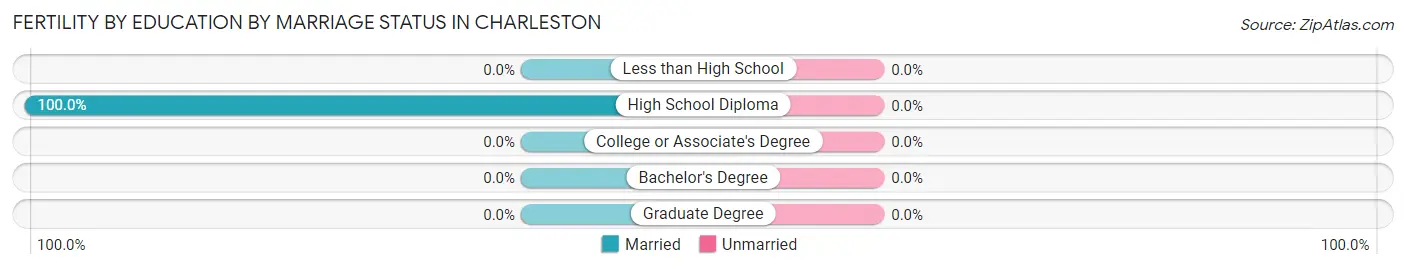
| Educational Attainment | Married | Unmarried |
| Less than High School | 0 (0.0%) | 0 (0.0%) |
| High School Diploma | 21 (100.0%) | 0 (0.0%) |
| College or Associate's Degree | 0 (0.0%) | 0 (0.0%) |
| Bachelor's Degree | 0 (0.0%) | 0 (0.0%) |
| Graduate Degree | 0 (0.0%) | 0 (0.0%) |
| Total | 21 (100.0%) | 0 (0.0%) |
Employment Characteristics in Charleston
Employment by Class of Employer in Charleston
Among the 1,206 employed individuals in Charleston, private company employees (858 | 71.1%), not-for-profit organizations (120 | 10.0%), and state government employees (83 | 6.9%) make up the most common classes of employment.
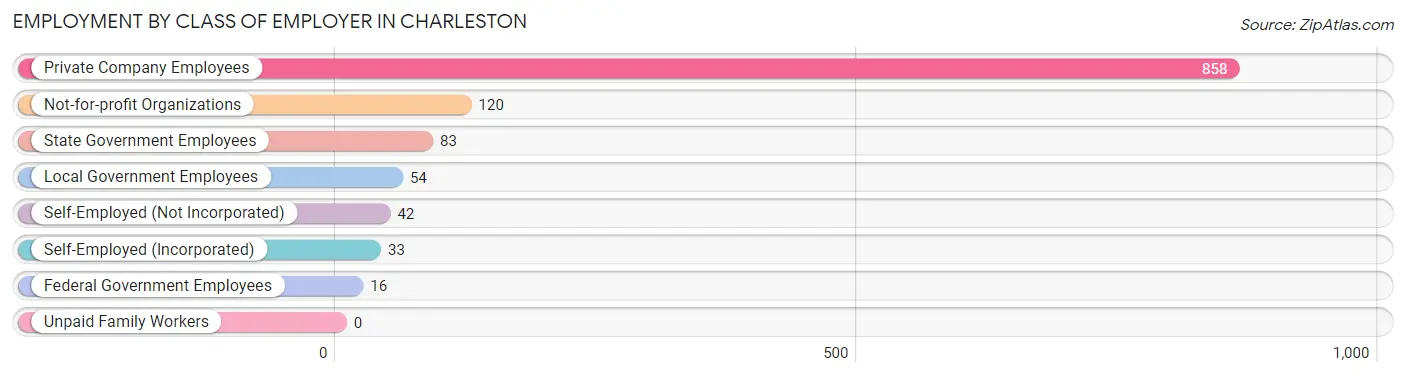
| Employer Class | # Employees | % Employees |
| Private Company Employees | 858 | 71.1% |
| Self-Employed (Incorporated) | 33 | 2.7% |
| Self-Employed (Not Incorporated) | 42 | 3.5% |
| Not-for-profit Organizations | 120 | 10.0% |
| Local Government Employees | 54 | 4.5% |
| State Government Employees | 83 | 6.9% |
| Federal Government Employees | 16 | 1.3% |
| Unpaid Family Workers | 0 | 0.0% |
| Total | 1,206 | 100.0% |
Employment Status by Age in Charleston
According to the labor force statistics for Charleston, out of the total population over 16 years of age (2,114), 60.3% or 1,275 individuals are in the labor force, with 4.2% or 54 of them unemployed. The age group with the highest labor force participation rate is 35 to 44 years, with 88.6% or 489 individuals in the labor force. Within the labor force, the 16 to 19 years age range has the highest percentage of unemployed individuals, with 18.5% or 5 of them being unemployed.
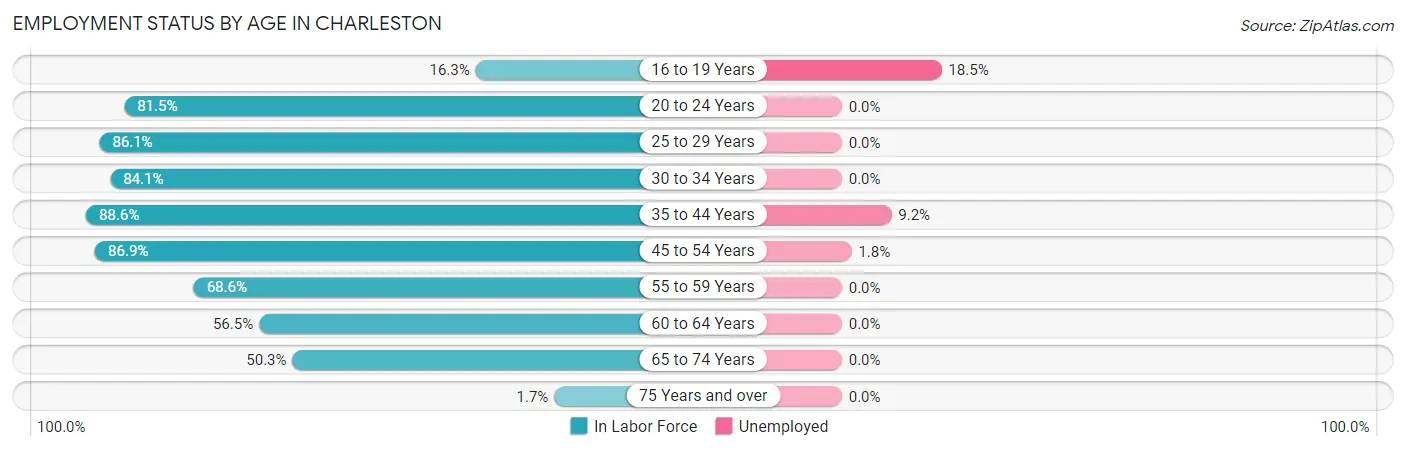
| Age Bracket | In Labor Force | Unemployed |
| 16 to 19 Years | 27 (16.3%) | 5 (18.5%) |
| 20 to 24 Years | 159 (81.5%) | 0 (0.0%) |
| 25 to 29 Years | 31 (86.1%) | 0 (0.0%) |
| 30 to 34 Years | 69 (84.1%) | 0 (0.0%) |
| 35 to 44 Years | 489 (88.6%) | 45 (9.2%) |
| 45 to 54 Years | 219 (86.9%) | 4 (1.8%) |
| 55 to 59 Years | 105 (68.6%) | 0 (0.0%) |
| 60 to 64 Years | 74 (56.5%) | 0 (0.0%) |
| 65 to 74 Years | 95 (50.3%) | 0 (0.0%) |
| 75 Years and over | 6 (1.7%) | 0 (0.0%) |
| Total | 1,275 (60.3%) | 54 (4.2%) |
Employment Status by Educational Attainment in Charleston
According to labor force statistics for Charleston, 81.8% of individuals (987) out of the total population between 25 and 64 years of age (1,206) are in the labor force, with 5.0% or 49 of them being unemployed. The group with the highest labor force participation rate are those with the educational attainment of college / associate degree, with 90.6% or 357 individuals in the labor force. Within the labor force, individuals with less than high school education have the highest percentage of unemployment, with 23.8% or 15 of them being unemployed.
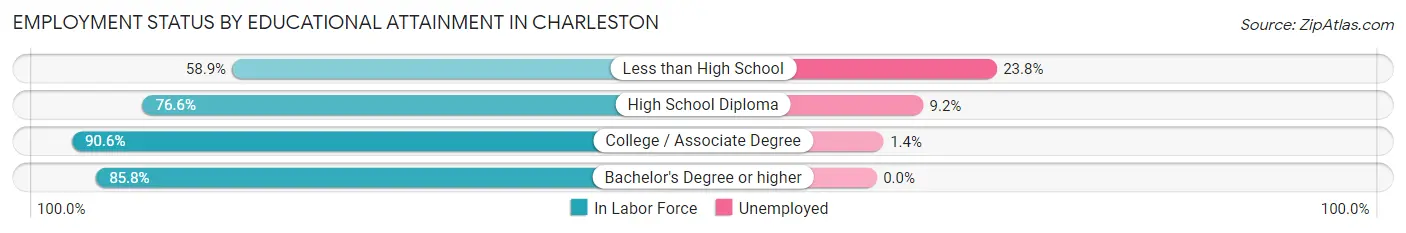
| Educational Attainment | In Labor Force | Unemployed |
| Less than High School | 63 (58.9%) | 25 (23.8%) |
| High School Diploma | 314 (76.6%) | 38 (9.2%) |
| College / Associate Degree | 357 (90.6%) | 6 (1.4%) |
| Bachelor's Degree or higher | 253 (85.8%) | 0 (0.0%) |
| Total | 987 (81.8%) | 60 (5.0%) |
Employment Occupations by Sex in Charleston
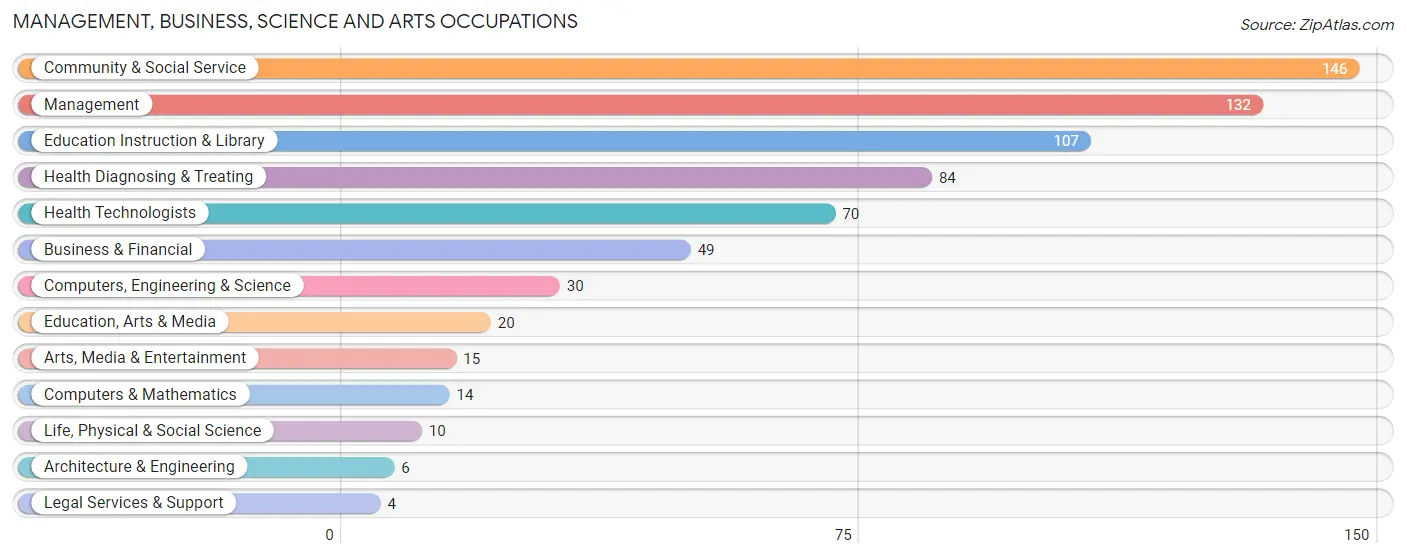
Management, Business, Science and Arts Occupations
The most common Management, Business, Science and Arts occupations in Charleston are Community & Social Service (146 | 12.0%), Management (132 | 10.8%), Education Instruction & Library (107 | 8.8%), Health Diagnosing & Treating (84 | 6.9%), and Health Technologists (70 | 5.7%).
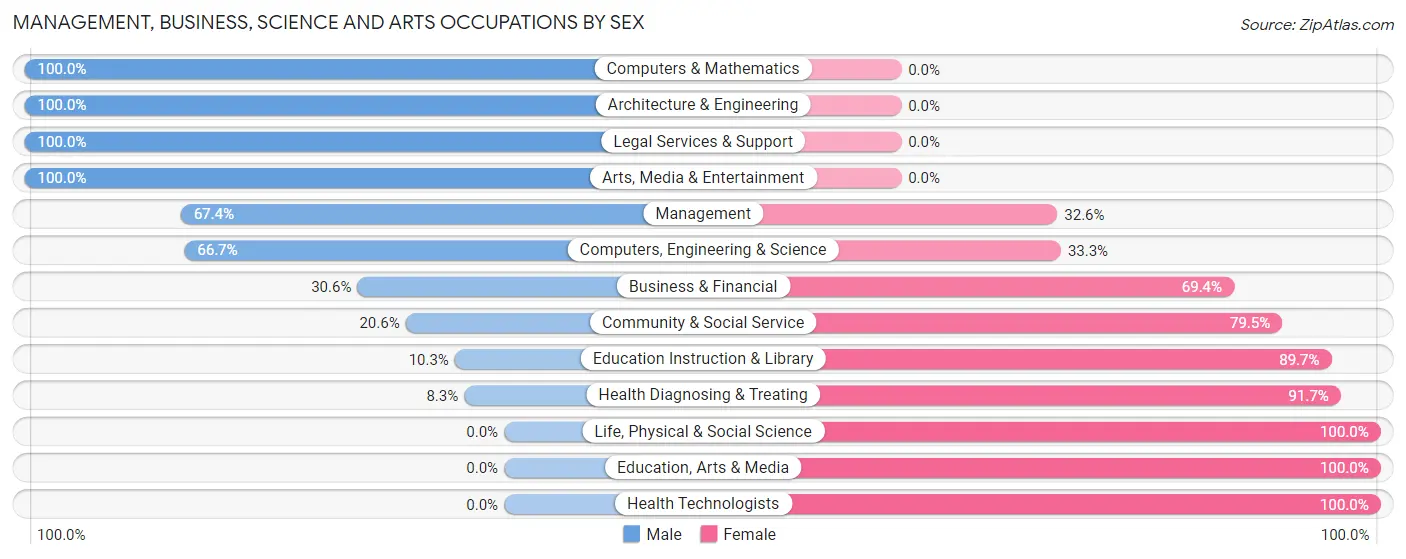
Management, Business, Science and Arts Occupations by Sex
Within the Management, Business, Science and Arts occupations in Charleston, the most male-oriented occupations are Computers & Mathematics (100.0%), Architecture & Engineering (100.0%), and Legal Services & Support (100.0%), while the most female-oriented occupations are Life, Physical & Social Science (100.0%), Education, Arts & Media (100.0%), and Health Technologists (100.0%).
| Occupation | Male | Female |
| Management | 89 (67.4%) | 43 (32.6%) |
| Business & Financial | 15 (30.6%) | 34 (69.4%) |
| Computers, Engineering & Science | 20 (66.7%) | 10 (33.3%) |
| Computers & Mathematics | 14 (100.0%) | 0 (0.0%) |
| Architecture & Engineering | 6 (100.0%) | 0 (0.0%) |
| Life, Physical & Social Science | 0 (0.0%) | 10 (100.0%) |
| Community & Social Service | 30 (20.5%) | 116 (79.4%) |
| Education, Arts & Media | 0 (0.0%) | 20 (100.0%) |
| Legal Services & Support | 4 (100.0%) | 0 (0.0%) |
| Education Instruction & Library | 11 (10.3%) | 96 (89.7%) |
| Arts, Media & Entertainment | 15 (100.0%) | 0 (0.0%) |
| Health Diagnosing & Treating | 7 (8.3%) | 77 (91.7%) |
| Health Technologists | 0 (0.0%) | 70 (100.0%) |
| Total (Category) | 161 (36.5%) | 280 (63.5%) |
| Total (Overall) | 614 (50.3%) | 606 (49.7%) |
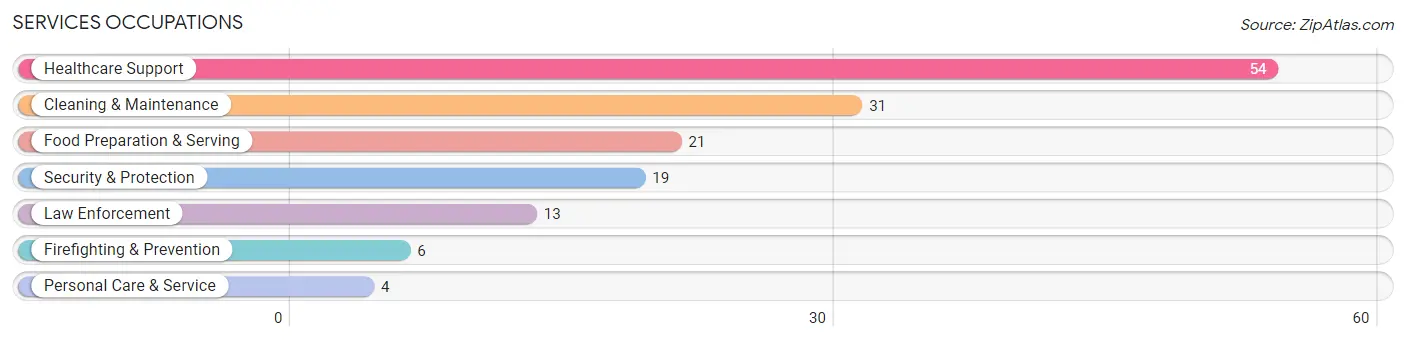
Services Occupations
The most common Services occupations in Charleston are Healthcare Support (54 | 4.4%), Cleaning & Maintenance (31 | 2.5%), Food Preparation & Serving (21 | 1.7%), Security & Protection (19 | 1.6%), and Law Enforcement (13 | 1.1%).
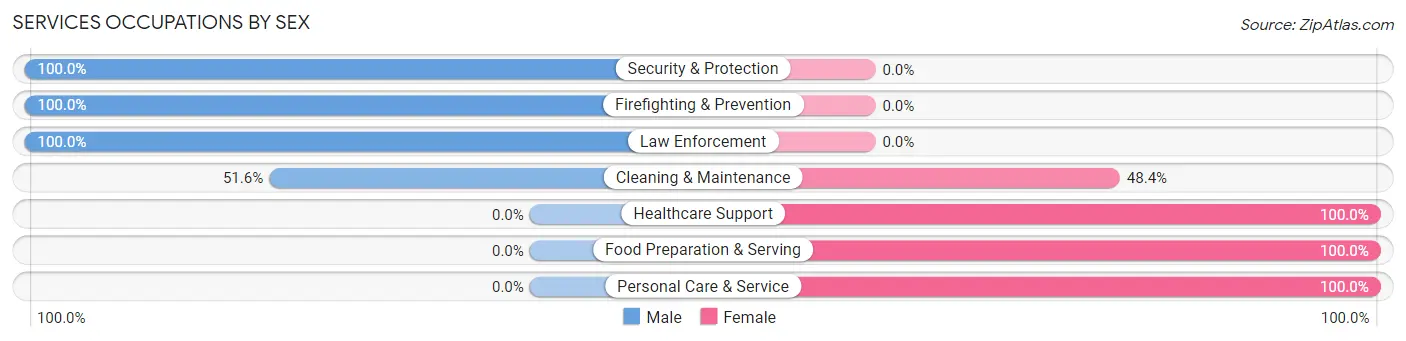
Services Occupations by Sex
Within the Services occupations in Charleston, the most male-oriented occupations are Security & Protection (100.0%), Firefighting & Prevention (100.0%), and Law Enforcement (100.0%), while the most female-oriented occupations are Healthcare Support (100.0%), Food Preparation & Serving (100.0%), and Personal Care & Service (100.0%).
| Occupation | Male | Female |
| Healthcare Support | 0 (0.0%) | 54 (100.0%) |
| Security & Protection | 19 (100.0%) | 0 (0.0%) |
| Firefighting & Prevention | 6 (100.0%) | 0 (0.0%) |
| Law Enforcement | 13 (100.0%) | 0 (0.0%) |
| Food Preparation & Serving | 0 (0.0%) | 21 (100.0%) |
| Cleaning & Maintenance | 16 (51.6%) | 15 (48.4%) |
| Personal Care & Service | 0 (0.0%) | 4 (100.0%) |
| Total (Category) | 35 (27.1%) | 94 (72.9%) |
| Total (Overall) | 614 (50.3%) | 606 (49.7%) |
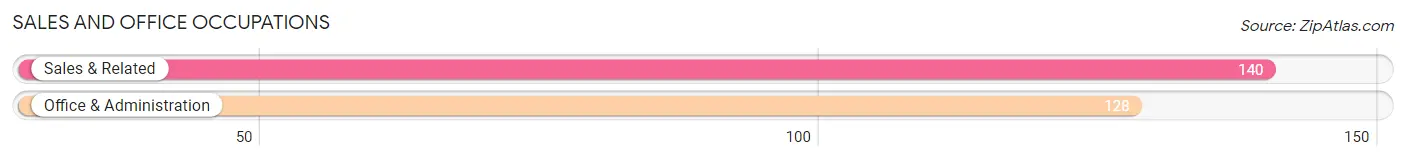
Sales and Office Occupations
The most common Sales and Office occupations in Charleston are Sales & Related (140 | 11.5%), and Office & Administration (128 | 10.5%).
Sales and Office Occupations by Sex
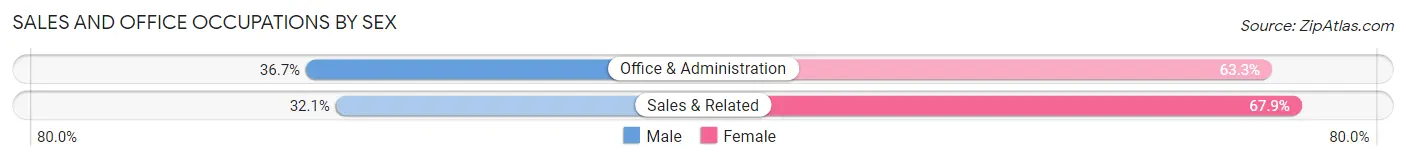
| Occupation | Male | Female |
| Sales & Related | 45 (32.1%) | 95 (67.9%) |
| Office & Administration | 47 (36.7%) | 81 (63.3%) |
| Total (Category) | 92 (34.3%) | 176 (65.7%) |
| Total (Overall) | 614 (50.3%) | 606 (49.7%) |
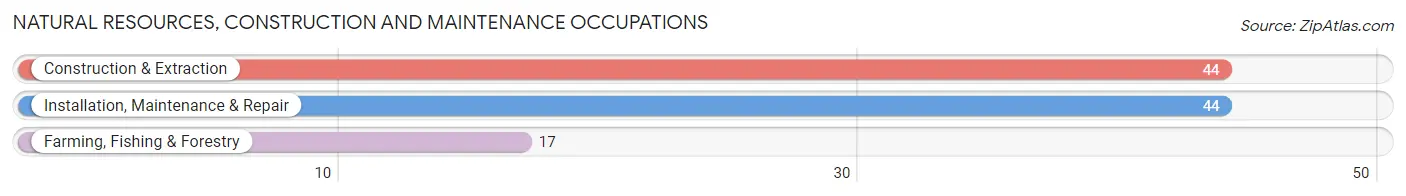
Natural Resources, Construction and Maintenance Occupations
The most common Natural Resources, Construction and Maintenance occupations in Charleston are Construction & Extraction (44 | 3.6%), Installation, Maintenance & Repair (44 | 3.6%), and Farming, Fishing & Forestry (17 | 1.4%).
Natural Resources, Construction and Maintenance Occupations by Sex
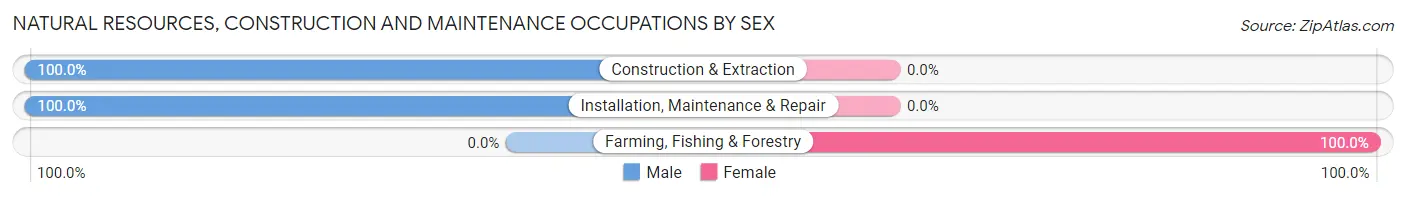
| Occupation | Male | Female |
| Farming, Fishing & Forestry | 0 (0.0%) | 17 (100.0%) |
| Construction & Extraction | 44 (100.0%) | 0 (0.0%) |
| Installation, Maintenance & Repair | 44 (100.0%) | 0 (0.0%) |
| Total (Category) | 88 (83.8%) | 17 (16.2%) |
| Total (Overall) | 614 (50.3%) | 606 (49.7%) |
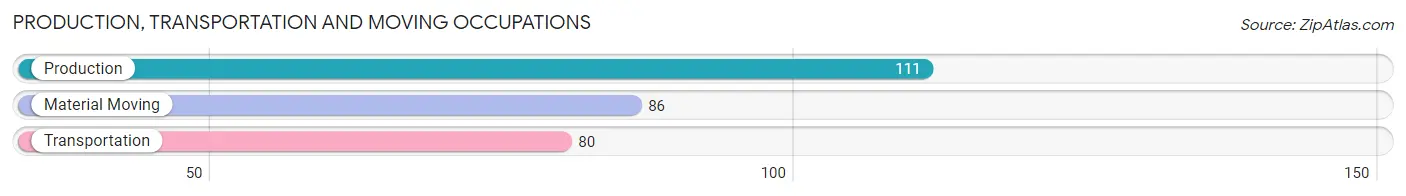
Production, Transportation and Moving Occupations
The most common Production, Transportation and Moving occupations in Charleston are Production (111 | 9.1%), Material Moving (86 | 7.0%), and Transportation (80 | 6.6%).
Production, Transportation and Moving Occupations by Sex
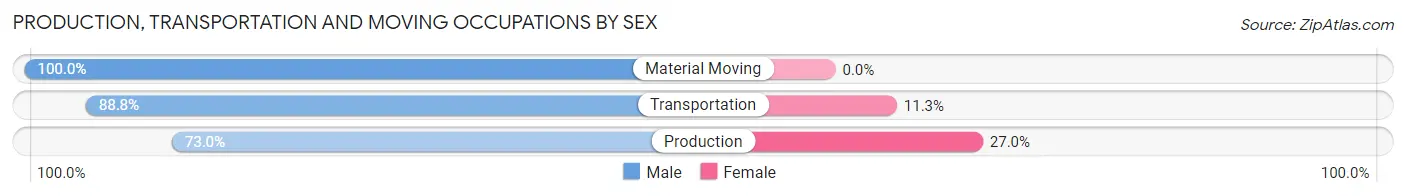
| Occupation | Male | Female |
| Production | 81 (73.0%) | 30 (27.0%) |
| Transportation | 71 (88.7%) | 9 (11.3%) |
| Material Moving | 86 (100.0%) | 0 (0.0%) |
| Total (Category) | 238 (85.9%) | 39 (14.1%) |
| Total (Overall) | 614 (50.3%) | 606 (49.7%) |
Employment Industries by Sex in Charleston
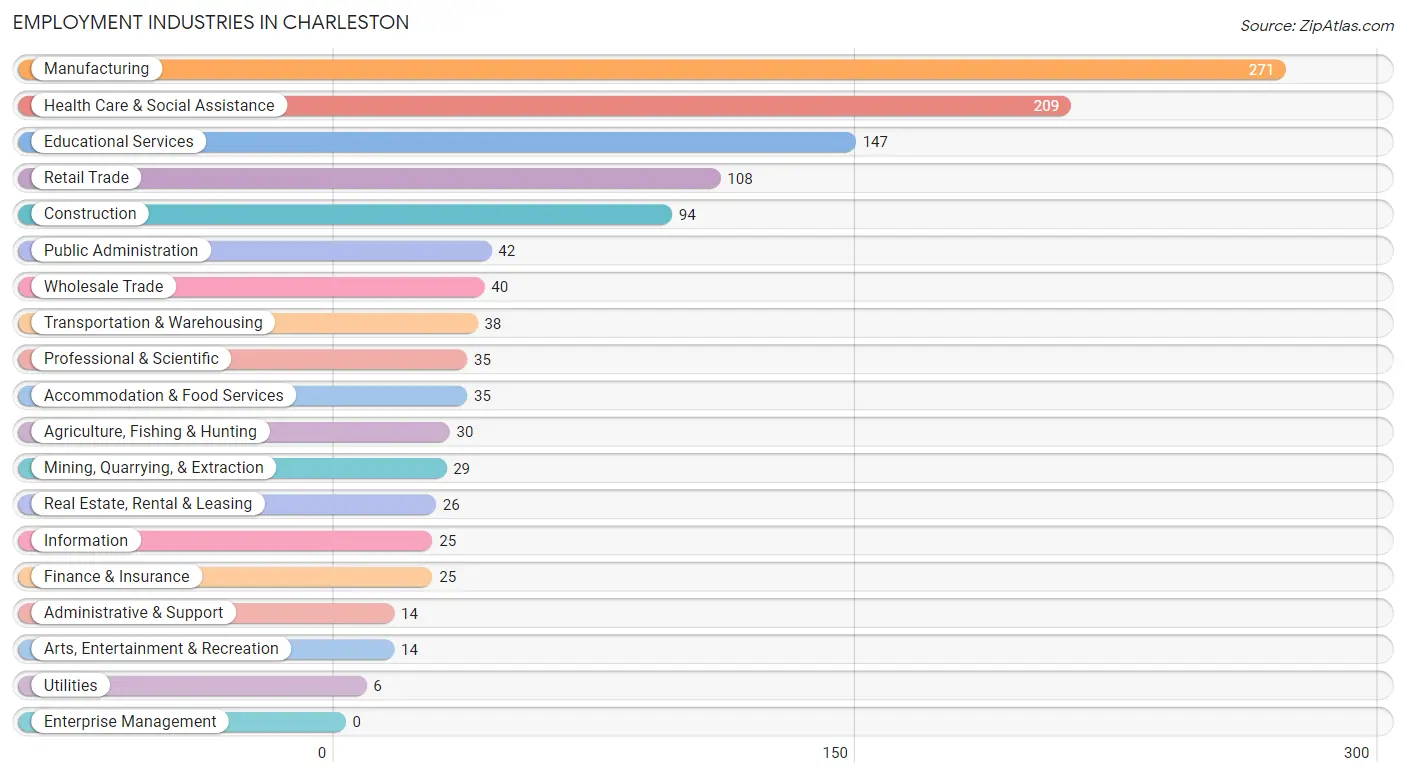
Employment Industries in Charleston
The major employment industries in Charleston include Manufacturing (271 | 22.2%), Health Care & Social Assistance (209 | 17.1%), Educational Services (147 | 12.0%), Retail Trade (108 | 8.8%), and Construction (94 | 7.7%).
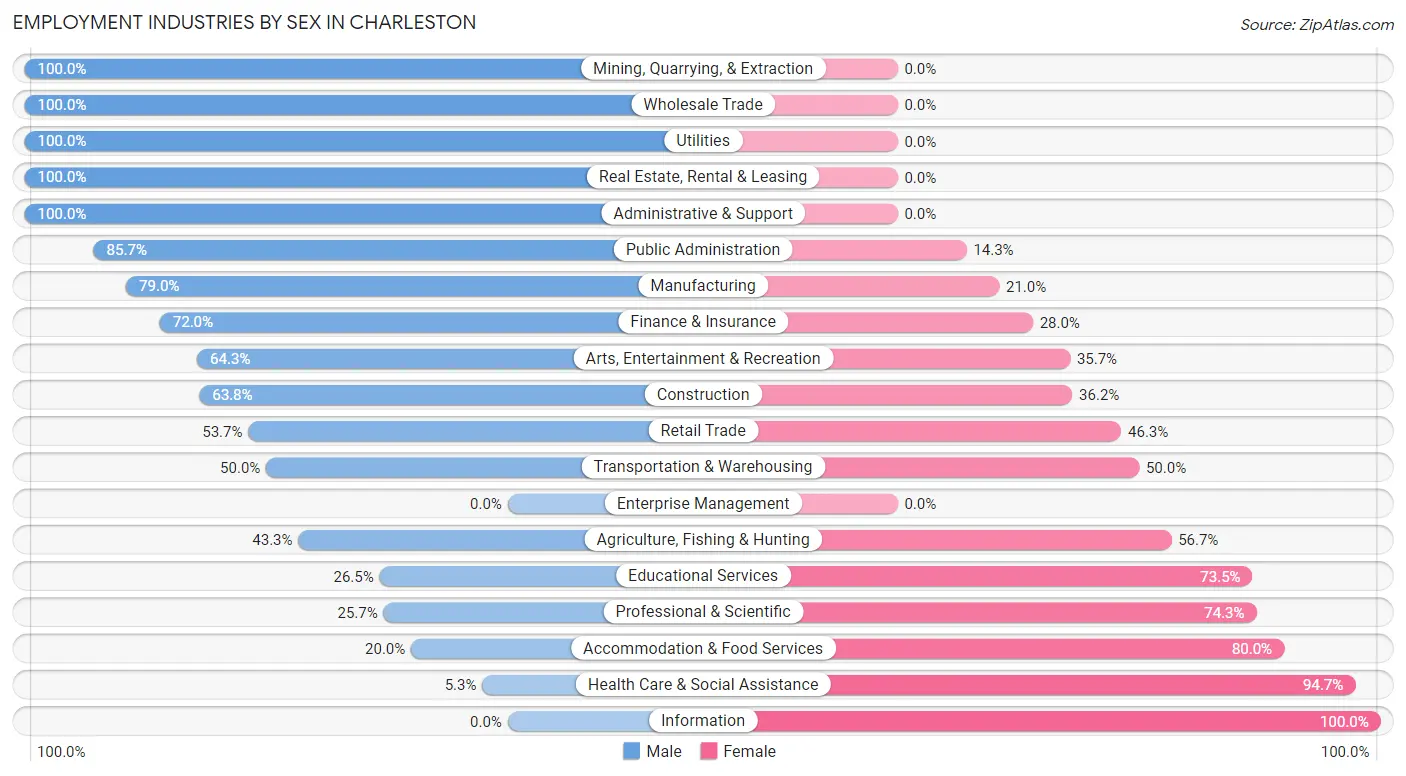
Employment Industries by Sex in Charleston
The Charleston industries that see more men than women are Mining, Quarrying, & Extraction (100.0%), Wholesale Trade (100.0%), and Utilities (100.0%), whereas the industries that tend to have a higher number of women are Information (100.0%), Health Care & Social Assistance (94.7%), and Accommodation & Food Services (80.0%).
| Industry | Male | Female |
| Agriculture, Fishing & Hunting | 13 (43.3%) | 17 (56.7%) |
| Mining, Quarrying, & Extraction | 29 (100.0%) | 0 (0.0%) |
| Construction | 60 (63.8%) | 34 (36.2%) |
| Manufacturing | 214 (79.0%) | 57 (21.0%) |
| Wholesale Trade | 40 (100.0%) | 0 (0.0%) |
| Retail Trade | 58 (53.7%) | 50 (46.3%) |
| Transportation & Warehousing | 19 (50.0%) | 19 (50.0%) |
| Utilities | 6 (100.0%) | 0 (0.0%) |
| Information | 0 (0.0%) | 25 (100.0%) |
| Finance & Insurance | 18 (72.0%) | 7 (28.0%) |
| Real Estate, Rental & Leasing | 26 (100.0%) | 0 (0.0%) |
| Professional & Scientific | 9 (25.7%) | 26 (74.3%) |
| Enterprise Management | 0 (0.0%) | 0 (0.0%) |
| Administrative & Support | 14 (100.0%) | 0 (0.0%) |
| Educational Services | 39 (26.5%) | 108 (73.5%) |
| Health Care & Social Assistance | 11 (5.3%) | 198 (94.7%) |
| Arts, Entertainment & Recreation | 9 (64.3%) | 5 (35.7%) |
| Accommodation & Food Services | 7 (20.0%) | 28 (80.0%) |
| Public Administration | 36 (85.7%) | 6 (14.3%) |
| Total | 614 (50.3%) | 606 (49.7%) |
Education in Charleston
School Enrollment in Charleston
The most common levels of schooling among the 601 students in Charleston are high school (187 | 31.1%), middle school (161 | 26.8%), and elementary school (98 | 16.3%).
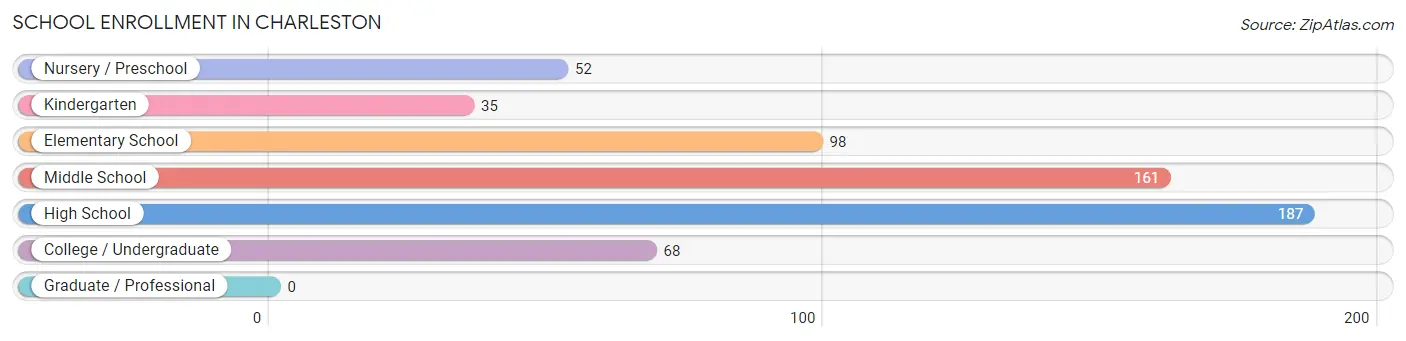
| School Level | # Students | % Students |
| Nursery / Preschool | 52 | 8.6% |
| Kindergarten | 35 | 5.8% |
| Elementary School | 98 | 16.3% |
| Middle School | 161 | 26.8% |
| High School | 187 | 31.1% |
| College / Undergraduate | 68 | 11.3% |
| Graduate / Professional | 0 | 0.0% |
| Total | 601 | 100.0% |
School Enrollment by Age by Funding Source in Charleston
Out of a total of 601 students who are enrolled in schools in Charleston, 104 (17.3%) attend a private institution, while the remaining 497 (82.7%) are enrolled in public schools. The age group of 25 to 34 year olds has the highest likelihood of being enrolled in private schools, with 7 (100.0% in the age bracket) enrolled. Conversely, the age group of 18 to 19 year olds has the lowest likelihood of being enrolled in a private school, with 35 (100.0% in the age bracket) attending a public institution.
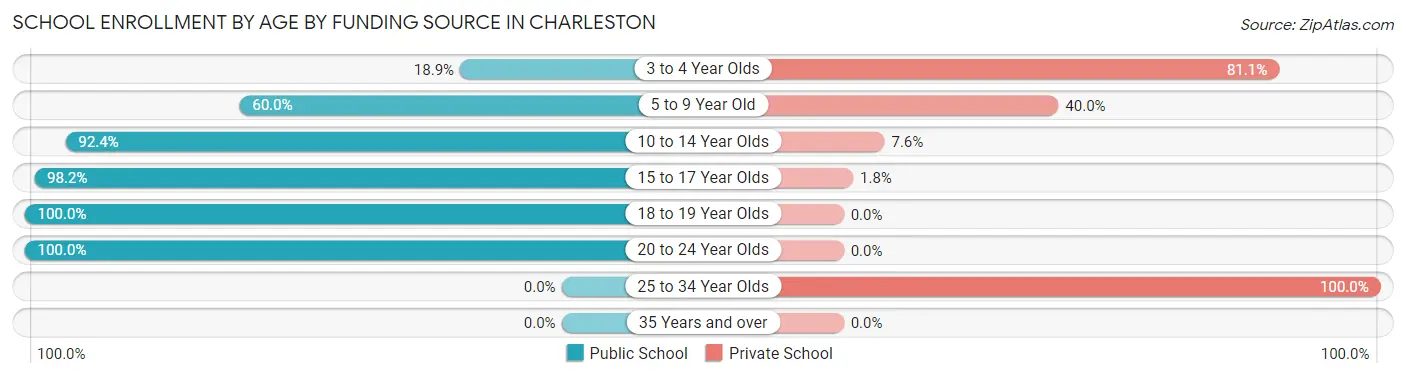
| Age Bracket | Public School | Private School |
| 3 to 4 Year Olds | 7 (18.9%) | 30 (81.1%) |
| 5 to 9 Year Old | 75 (60.0%) | 50 (40.0%) |
| 10 to 14 Year Olds | 170 (92.4%) | 14 (7.6%) |
| 15 to 17 Year Olds | 167 (98.2%) | 3 (1.8%) |
| 18 to 19 Year Olds | 35 (100.0%) | 0 (0.0%) |
| 20 to 24 Year Olds | 43 (100.0%) | 0 (0.0%) |
| 25 to 34 Year Olds | 0 (0.0%) | 7 (100.0%) |
| 35 Years and over | 0 (0.0%) | 0 (0.0%) |
| Total | 497 (82.7%) | 104 (17.3%) |
Educational Attainment by Field of Study in Charleston
Education (120 | 28.0%), business (94 | 21.9%), social sciences (49 | 11.4%), science & technology (44 | 10.3%), and literature & languages (27 | 6.3%) are the most common fields of study among 429 individuals in Charleston who have obtained a bachelor's degree or higher.
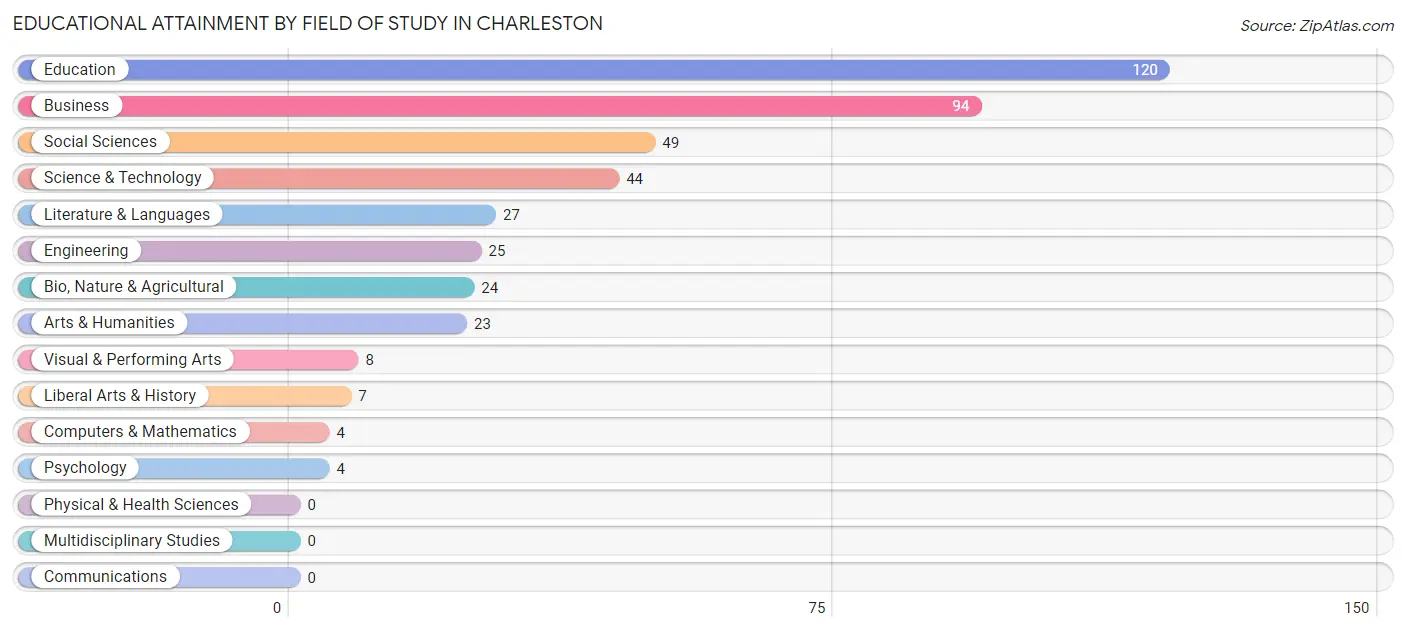
| Field of Study | # Graduates | % Graduates |
| Computers & Mathematics | 4 | 0.9% |
| Bio, Nature & Agricultural | 24 | 5.6% |
| Physical & Health Sciences | 0 | 0.0% |
| Psychology | 4 | 0.9% |
| Social Sciences | 49 | 11.4% |
| Engineering | 25 | 5.8% |
| Multidisciplinary Studies | 0 | 0.0% |
| Science & Technology | 44 | 10.3% |
| Business | 94 | 21.9% |
| Education | 120 | 28.0% |
| Literature & Languages | 27 | 6.3% |
| Liberal Arts & History | 7 | 1.6% |
| Visual & Performing Arts | 8 | 1.9% |
| Communications | 0 | 0.0% |
| Arts & Humanities | 23 | 5.4% |
| Total | 429 | 100.0% |
Transportation & Commute in Charleston
Vehicle Availability by Sex in Charleston
The most prevalent vehicle ownership categories in Charleston are males with 2 vehicles (344, accounting for 56.0%) and females with 2 vehicles (290, making up 58.1%).
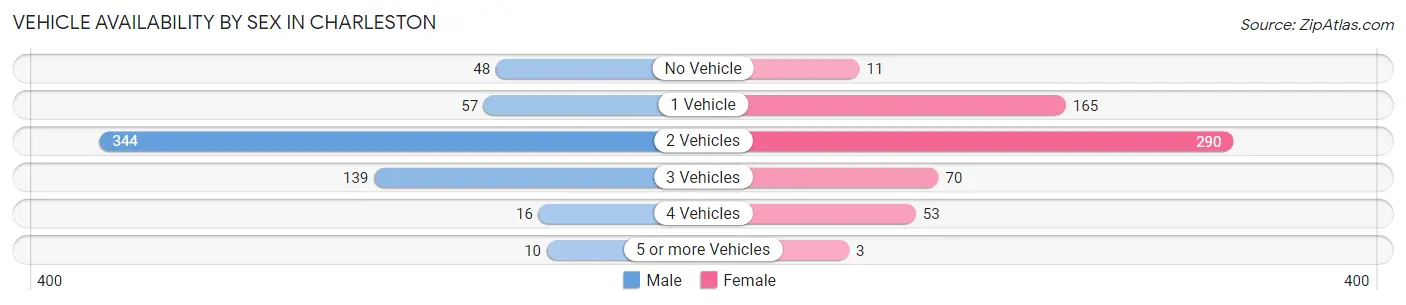
| Vehicles Available | Male | Female |
| No Vehicle | 48 (7.8%) | 11 (1.9%) |
| 1 Vehicle | 57 (9.3%) | 165 (27.9%) |
| 2 Vehicles | 344 (56.0%) | 290 (49.0%) |
| 3 Vehicles | 139 (22.6%) | 70 (11.8%) |
| 4 Vehicles | 16 (2.6%) | 53 (8.9%) |
| 5 or more Vehicles | 10 (1.6%) | 3 (0.5%) |
| Total | 614 (100.0%) | 592 (100.0%) |
Commute Time in Charleston
The most frequently occuring commute durations in Charleston are 30 to 34 minutes (232 commuters, 20.3%), 40 to 44 minutes (153 commuters, 13.4%), and 45 to 59 minutes (140 commuters, 12.3%).
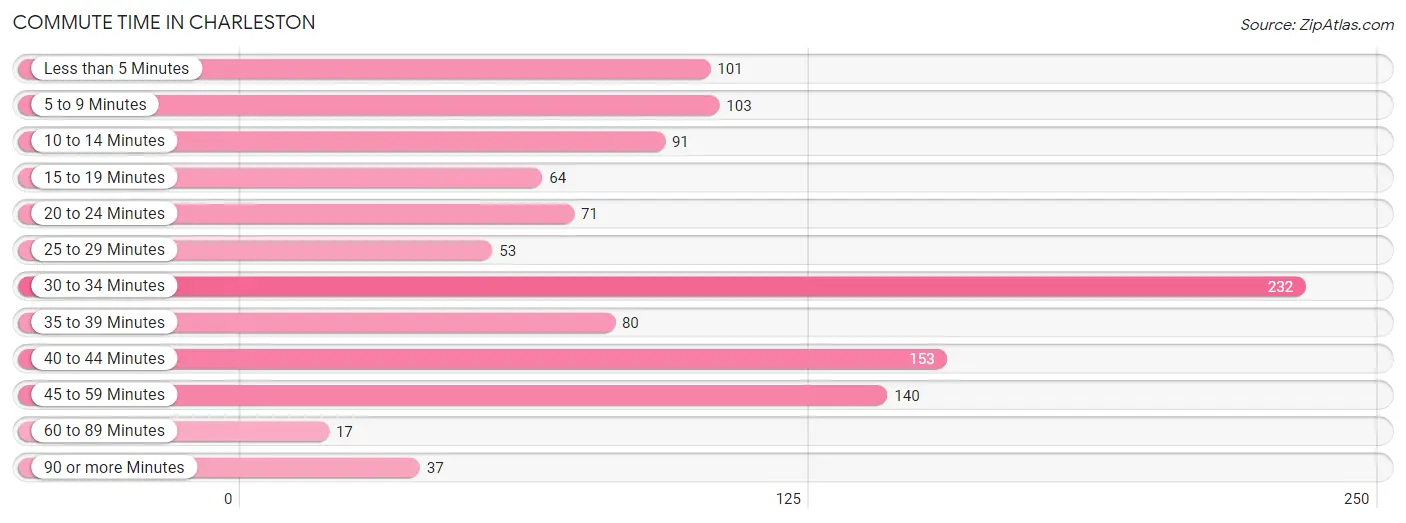
| Commute Time | # Commuters | % Commuters |
| Less than 5 Minutes | 101 | 8.8% |
| 5 to 9 Minutes | 103 | 9.0% |
| 10 to 14 Minutes | 91 | 8.0% |
| 15 to 19 Minutes | 64 | 5.6% |
| 20 to 24 Minutes | 71 | 6.2% |
| 25 to 29 Minutes | 53 | 4.6% |
| 30 to 34 Minutes | 232 | 20.3% |
| 35 to 39 Minutes | 80 | 7.0% |
| 40 to 44 Minutes | 153 | 13.4% |
| 45 to 59 Minutes | 140 | 12.3% |
| 60 to 89 Minutes | 17 | 1.5% |
| 90 or more Minutes | 37 | 3.2% |
Commute Time by Sex in Charleston
The most common commute times in Charleston are 30 to 34 minutes (142 commuters, 24.4%) for males and 40 to 44 minutes (92 commuters, 16.4%) for females.
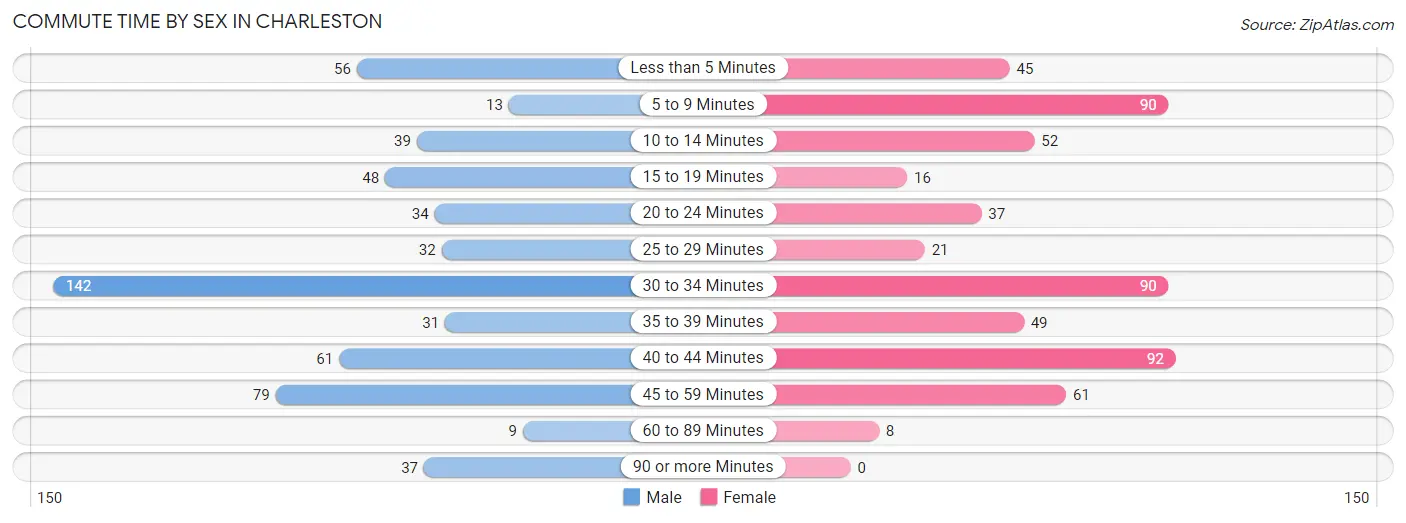
| Commute Time | Male | Female |
| Less than 5 Minutes | 56 (9.6%) | 45 (8.0%) |
| 5 to 9 Minutes | 13 (2.2%) | 90 (16.0%) |
| 10 to 14 Minutes | 39 (6.7%) | 52 (9.3%) |
| 15 to 19 Minutes | 48 (8.3%) | 16 (2.9%) |
| 20 to 24 Minutes | 34 (5.9%) | 37 (6.6%) |
| 25 to 29 Minutes | 32 (5.5%) | 21 (3.7%) |
| 30 to 34 Minutes | 142 (24.4%) | 90 (16.0%) |
| 35 to 39 Minutes | 31 (5.3%) | 49 (8.7%) |
| 40 to 44 Minutes | 61 (10.5%) | 92 (16.4%) |
| 45 to 59 Minutes | 79 (13.6%) | 61 (10.9%) |
| 60 to 89 Minutes | 9 (1.5%) | 8 (1.4%) |
| 90 or more Minutes | 37 (6.4%) | 0 (0.0%) |
Time of Departure to Work by Sex in Charleston
The most frequent times of departure to work in Charleston are 6:00 AM to 6:29 AM (122, 21.0%) for males and 7:00 AM to 7:29 AM (188, 33.5%) for females.
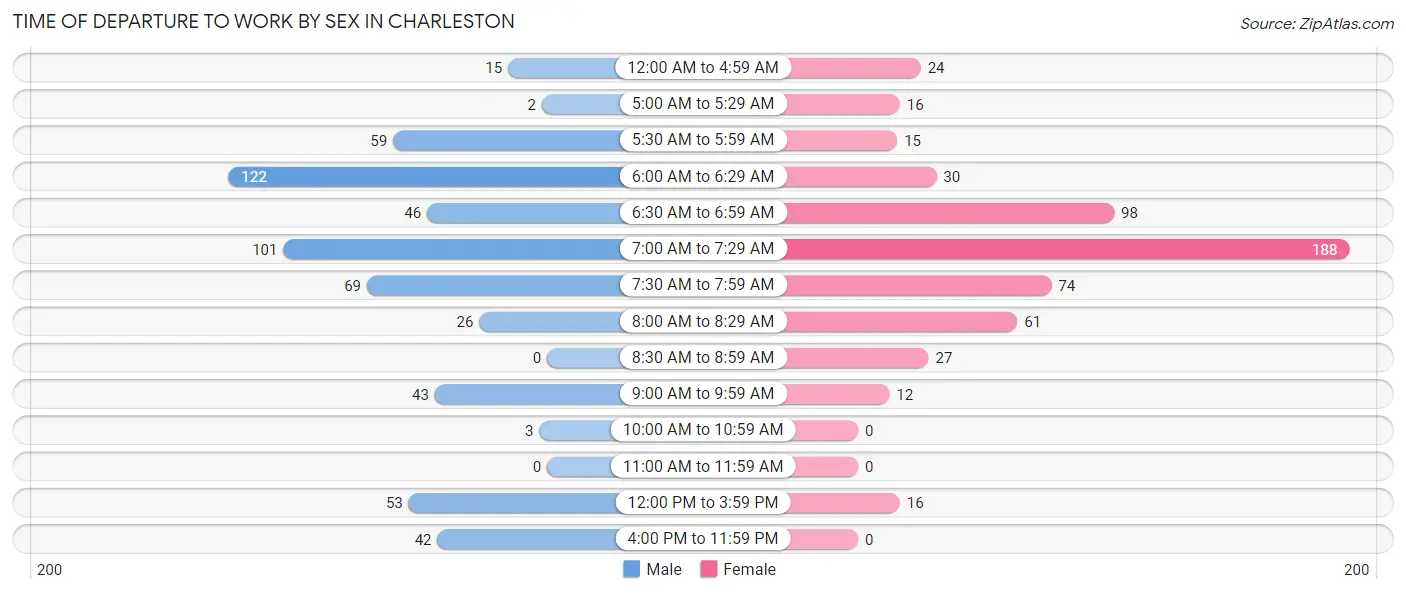
| Time of Departure | Male | Female |
| 12:00 AM to 4:59 AM | 15 (2.6%) | 24 (4.3%) |
| 5:00 AM to 5:29 AM | 2 (0.3%) | 16 (2.9%) |
| 5:30 AM to 5:59 AM | 59 (10.2%) | 15 (2.7%) |
| 6:00 AM to 6:29 AM | 122 (21.0%) | 30 (5.3%) |
| 6:30 AM to 6:59 AM | 46 (7.9%) | 98 (17.5%) |
| 7:00 AM to 7:29 AM | 101 (17.4%) | 188 (33.5%) |
| 7:30 AM to 7:59 AM | 69 (11.9%) | 74 (13.2%) |
| 8:00 AM to 8:29 AM | 26 (4.5%) | 61 (10.9%) |
| 8:30 AM to 8:59 AM | 0 (0.0%) | 27 (4.8%) |
| 9:00 AM to 9:59 AM | 43 (7.4%) | 12 (2.1%) |
| 10:00 AM to 10:59 AM | 3 (0.5%) | 0 (0.0%) |
| 11:00 AM to 11:59 AM | 0 (0.0%) | 0 (0.0%) |
| 12:00 PM to 3:59 PM | 53 (9.1%) | 16 (2.9%) |
| 4:00 PM to 11:59 PM | 42 (7.2%) | 0 (0.0%) |
| Total | 581 (100.0%) | 561 (100.0%) |
Housing Occupancy in Charleston
Occupancy by Ownership in Charleston
Of the total 1,006 dwellings in Charleston, owner-occupied units account for 751 (74.7%), while renter-occupied units make up 255 (25.4%).
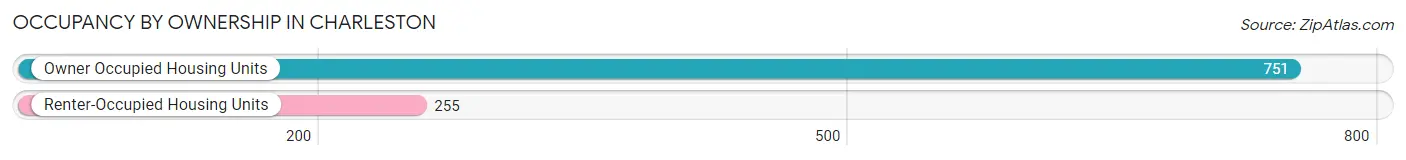
| Occupancy | # Housing Units | % Housing Units |
| Owner Occupied Housing Units | 751 | 74.7% |
| Renter-Occupied Housing Units | 255 | 25.4% |
| Total Occupied Housing Units | 1,006 | 100.0% |
Occupancy by Household Size in Charleston
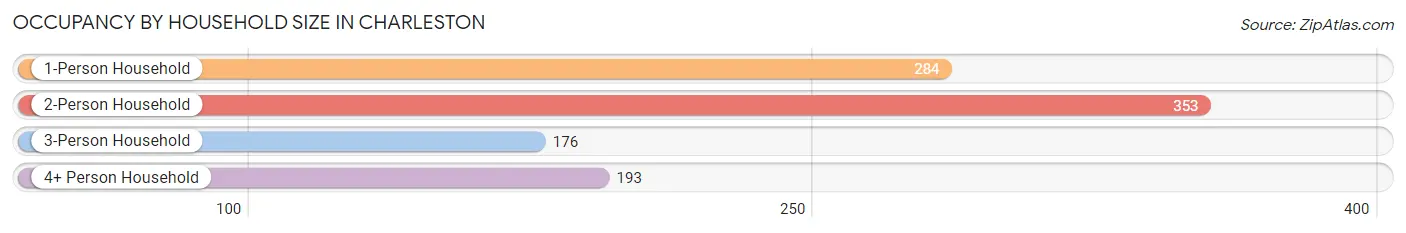
| Household Size | # Housing Units | % Housing Units |
| 1-Person Household | 284 | 28.2% |
| 2-Person Household | 353 | 35.1% |
| 3-Person Household | 176 | 17.5% |
| 4+ Person Household | 193 | 19.2% |
| Total Housing Units | 1,006 | 100.0% |
Occupancy by Ownership by Household Size in Charleston
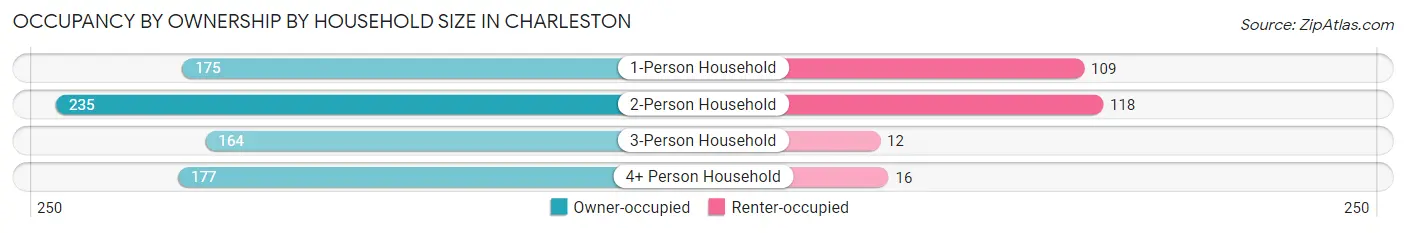
| Household Size | Owner-occupied | Renter-occupied |
| 1-Person Household | 175 (61.6%) | 109 (38.4%) |
| 2-Person Household | 235 (66.6%) | 118 (33.4%) |
| 3-Person Household | 164 (93.2%) | 12 (6.8%) |
| 4+ Person Household | 177 (91.7%) | 16 (8.3%) |
| Total Housing Units | 751 (74.7%) | 255 (25.4%) |
Occupancy by Educational Attainment in Charleston
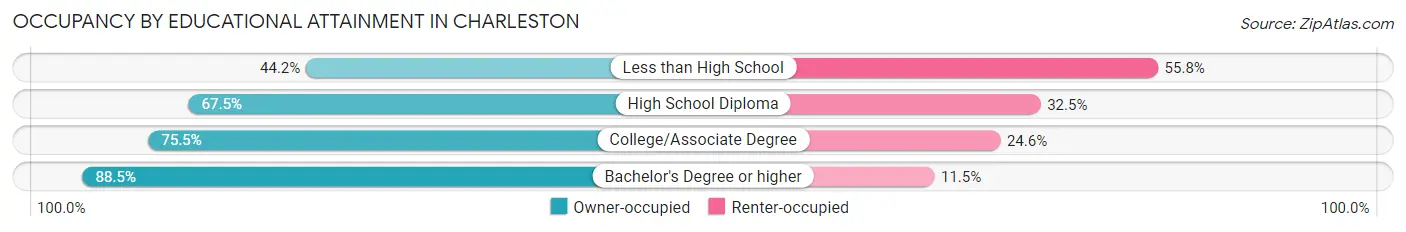
| Household Size | Owner-occupied | Renter-occupied |
| Less than High School | 19 (44.2%) | 24 (55.8%) |
| High School Diploma | 224 (67.5%) | 108 (32.5%) |
| College/Associate Degree | 292 (75.4%) | 95 (24.5%) |
| Bachelor's Degree or higher | 216 (88.5%) | 28 (11.5%) |
Occupancy by Age of Householder in Charleston
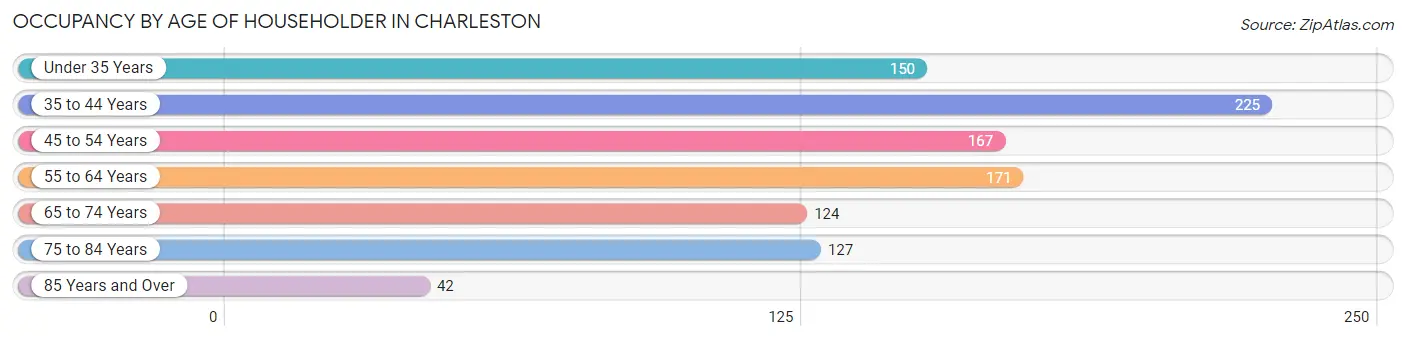
| Age Bracket | # Households | % Households |
| Under 35 Years | 150 | 14.9% |
| 35 to 44 Years | 225 | 22.4% |
| 45 to 54 Years | 167 | 16.6% |
| 55 to 64 Years | 171 | 17.0% |
| 65 to 74 Years | 124 | 12.3% |
| 75 to 84 Years | 127 | 12.6% |
| 85 Years and Over | 42 | 4.2% |
| Total | 1,006 | 100.0% |
Housing Finances in Charleston
Median Income by Occupancy in Charleston
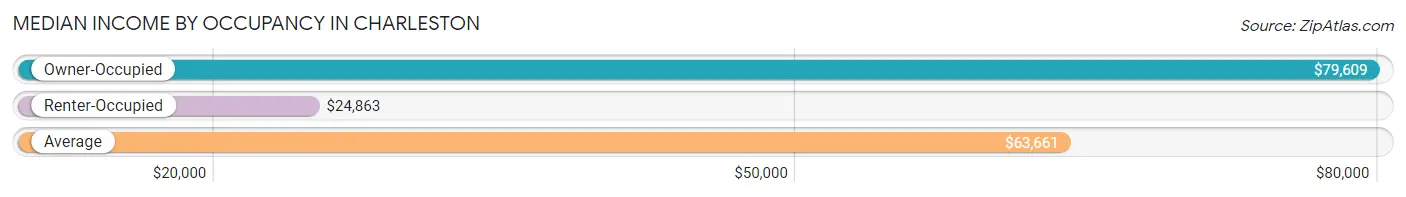
| Occupancy Type | # Households | Median Income |
| Owner-Occupied | 751 (74.7%) | $79,609 |
| Renter-Occupied | 255 (25.4%) | $24,863 |
| Average | 1,006 (100.0%) | $63,661 |
Occupancy by Householder Income Bracket in Charleston
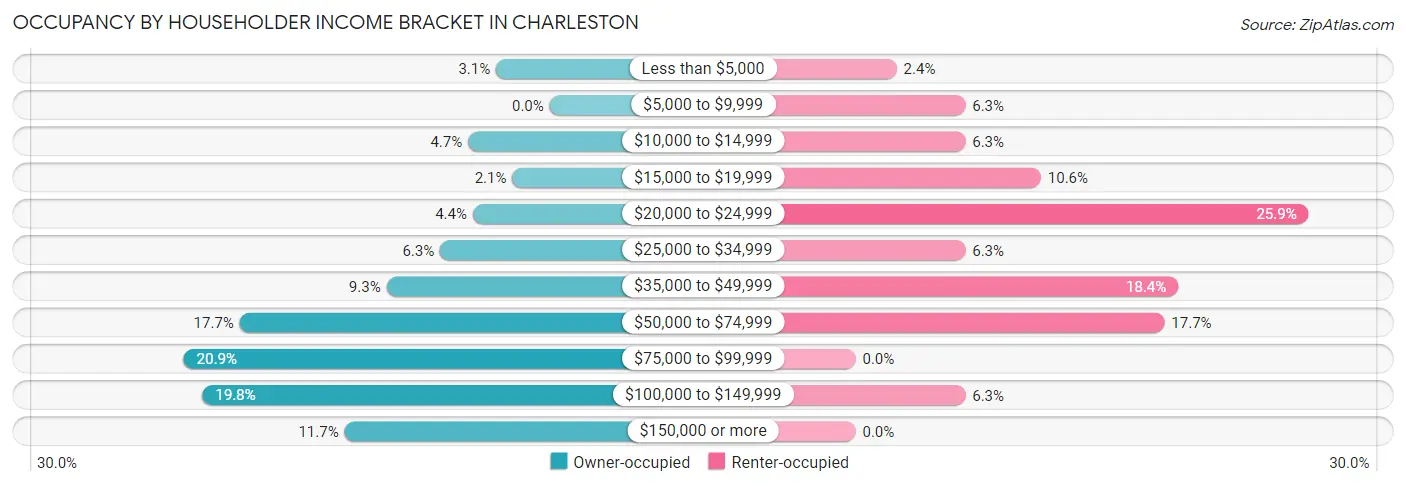
| Income Bracket | Owner-occupied | Renter-occupied |
| Less than $5,000 | 23 (3.1%) | 6 (2.4%) |
| $5,000 to $9,999 | 0 (0.0%) | 16 (6.3%) |
| $10,000 to $14,999 | 35 (4.7%) | 16 (6.3%) |
| $15,000 to $19,999 | 16 (2.1%) | 27 (10.6%) |
| $20,000 to $24,999 | 33 (4.4%) | 66 (25.9%) |
| $25,000 to $34,999 | 47 (6.3%) | 16 (6.3%) |
| $35,000 to $49,999 | 70 (9.3%) | 47 (18.4%) |
| $50,000 to $74,999 | 133 (17.7%) | 45 (17.6%) |
| $75,000 to $99,999 | 157 (20.9%) | 0 (0.0%) |
| $100,000 to $149,999 | 149 (19.8%) | 16 (6.3%) |
| $150,000 or more | 88 (11.7%) | 0 (0.0%) |
| Total | 751 (100.0%) | 255 (100.0%) |
Monthly Housing Cost Tiers in Charleston
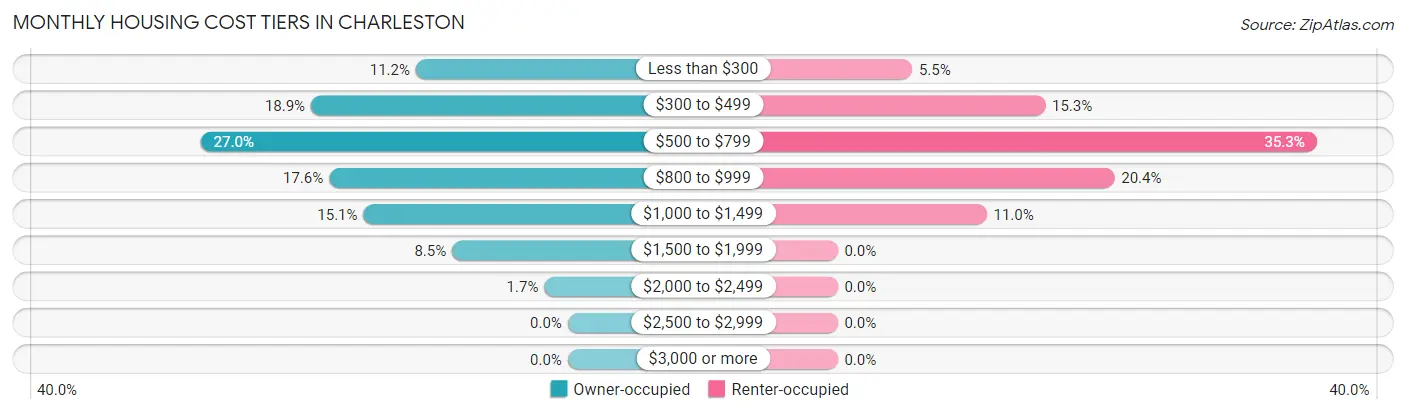
| Monthly Cost | Owner-occupied | Renter-occupied |
| Less than $300 | 84 (11.2%) | 14 (5.5%) |
| $300 to $499 | 142 (18.9%) | 39 (15.3%) |
| $500 to $799 | 203 (27.0%) | 90 (35.3%) |
| $800 to $999 | 132 (17.6%) | 52 (20.4%) |
| $1,000 to $1,499 | 113 (15.0%) | 28 (11.0%) |
| $1,500 to $1,999 | 64 (8.5%) | 0 (0.0%) |
| $2,000 to $2,499 | 13 (1.7%) | 0 (0.0%) |
| $2,500 to $2,999 | 0 (0.0%) | 0 (0.0%) |
| $3,000 or more | 0 (0.0%) | 0 (0.0%) |
| Total | 751 (100.0%) | 255 (100.0%) |
Physical Housing Characteristics in Charleston
Housing Structures in Charleston
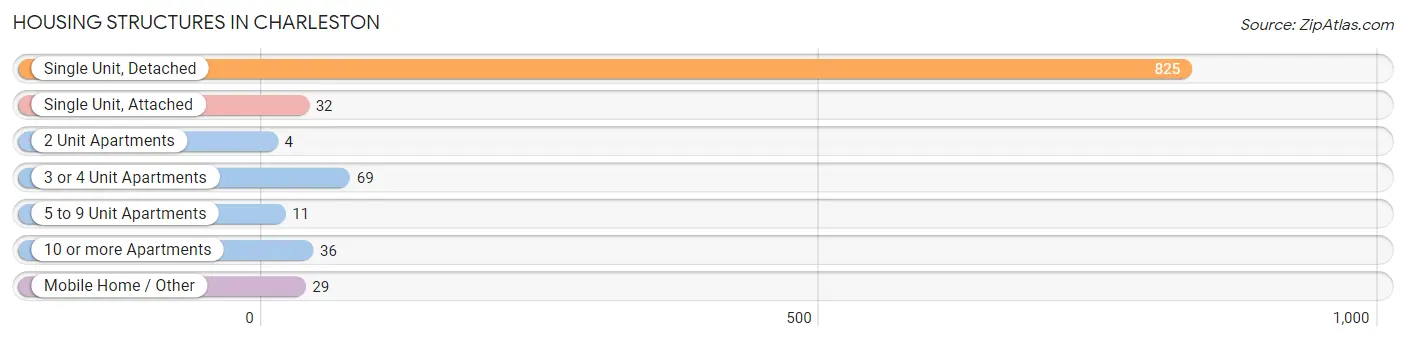
| Structure Type | # Housing Units | % Housing Units |
| Single Unit, Detached | 825 | 82.0% |
| Single Unit, Attached | 32 | 3.2% |
| 2 Unit Apartments | 4 | 0.4% |
| 3 or 4 Unit Apartments | 69 | 6.9% |
| 5 to 9 Unit Apartments | 11 | 1.1% |
| 10 or more Apartments | 36 | 3.6% |
| Mobile Home / Other | 29 | 2.9% |
| Total | 1,006 | 100.0% |
Housing Structures by Occupancy in Charleston
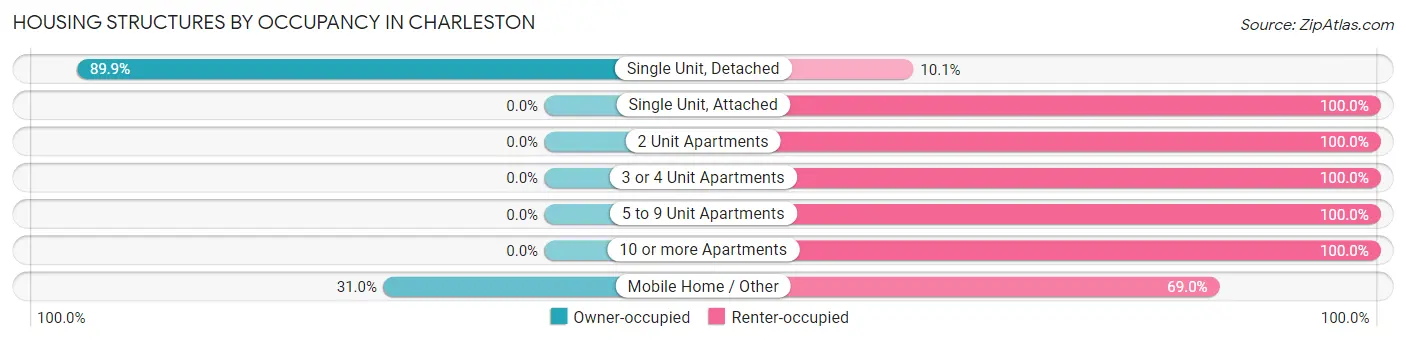
| Structure Type | Owner-occupied | Renter-occupied |
| Single Unit, Detached | 742 (89.9%) | 83 (10.1%) |
| Single Unit, Attached | 0 (0.0%) | 32 (100.0%) |
| 2 Unit Apartments | 0 (0.0%) | 4 (100.0%) |
| 3 or 4 Unit Apartments | 0 (0.0%) | 69 (100.0%) |
| 5 to 9 Unit Apartments | 0 (0.0%) | 11 (100.0%) |
| 10 or more Apartments | 0 (0.0%) | 36 (100.0%) |
| Mobile Home / Other | 9 (31.0%) | 20 (69.0%) |
| Total | 751 (74.7%) | 255 (25.4%) |
Housing Structures by Number of Rooms in Charleston
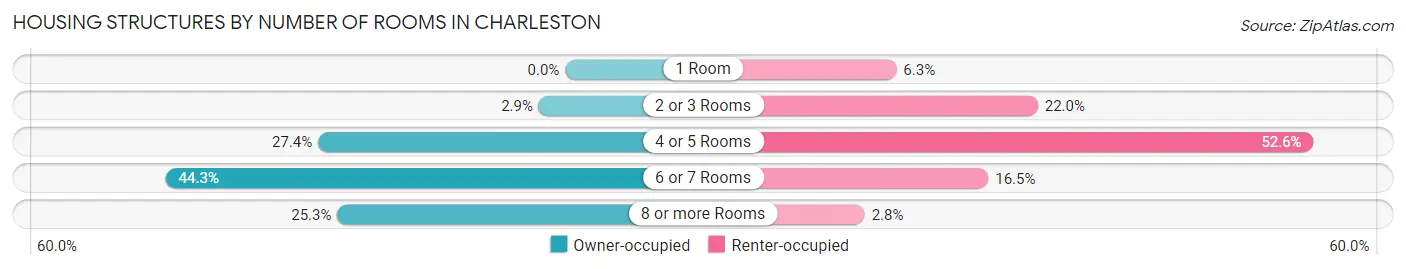
| Number of Rooms | Owner-occupied | Renter-occupied |
| 1 Room | 0 (0.0%) | 16 (6.3%) |
| 2 or 3 Rooms | 22 (2.9%) | 56 (22.0%) |
| 4 or 5 Rooms | 206 (27.4%) | 134 (52.5%) |
| 6 or 7 Rooms | 333 (44.3%) | 42 (16.5%) |
| 8 or more Rooms | 190 (25.3%) | 7 (2.8%) |
| Total | 751 (100.0%) | 255 (100.0%) |
Housing Structure by Heating Type in Charleston
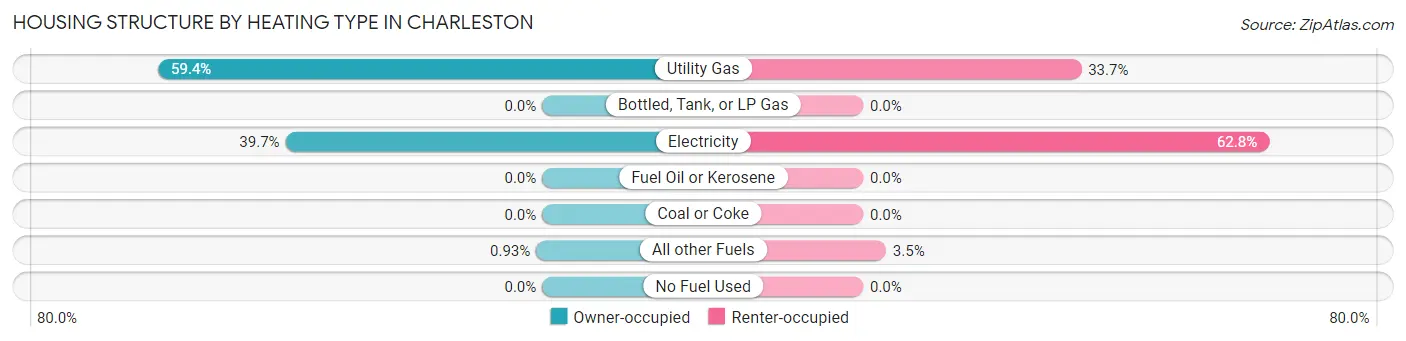
| Heating Type | Owner-occupied | Renter-occupied |
| Utility Gas | 446 (59.4%) | 86 (33.7%) |
| Bottled, Tank, or LP Gas | 0 (0.0%) | 0 (0.0%) |
| Electricity | 298 (39.7%) | 160 (62.7%) |
| Fuel Oil or Kerosene | 0 (0.0%) | 0 (0.0%) |
| Coal or Coke | 0 (0.0%) | 0 (0.0%) |
| All other Fuels | 7 (0.9%) | 9 (3.5%) |
| No Fuel Used | 0 (0.0%) | 0 (0.0%) |
| Total | 751 (100.0%) | 255 (100.0%) |
Household Vehicle Usage in Charleston
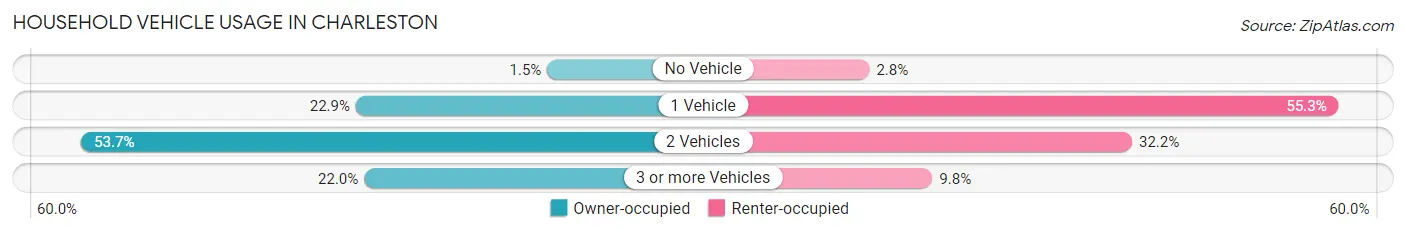
| Vehicles per Household | Owner-occupied | Renter-occupied |
| No Vehicle | 11 (1.5%) | 7 (2.8%) |
| 1 Vehicle | 172 (22.9%) | 141 (55.3%) |
| 2 Vehicles | 403 (53.7%) | 82 (32.2%) |
| 3 or more Vehicles | 165 (22.0%) | 25 (9.8%) |
| Total | 751 (100.0%) | 255 (100.0%) |
Real Estate & Mortgages in Charleston
Real Estate and Mortgage Overview in Charleston
| Characteristic | Without Mortgage | With Mortgage |
| Housing Units | 304 | 447 |
| Median Property Value | $113,700 | $139,900 |
| Median Household Income | $61,111 | $63 |
| Monthly Housing Costs | $382 | $0 |
| Real Estate Taxes | $972 | $36 |
Property Value by Mortgage Status in Charleston
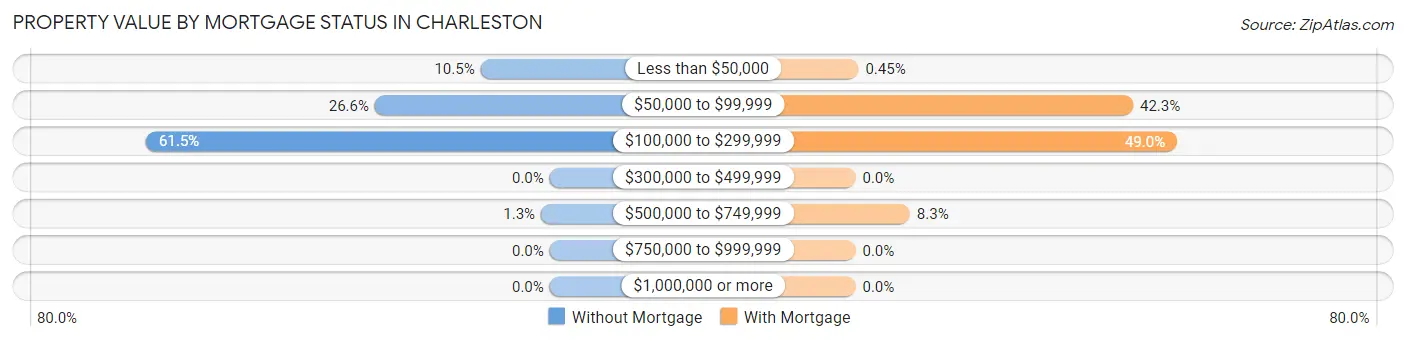
| Property Value | Without Mortgage | With Mortgage |
| Less than $50,000 | 32 (10.5%) | 2 (0.4%) |
| $50,000 to $99,999 | 81 (26.6%) | 189 (42.3%) |
| $100,000 to $299,999 | 187 (61.5%) | 219 (49.0%) |
| $300,000 to $499,999 | 0 (0.0%) | 0 (0.0%) |
| $500,000 to $749,999 | 4 (1.3%) | 37 (8.3%) |
| $750,000 to $999,999 | 0 (0.0%) | 0 (0.0%) |
| $1,000,000 or more | 0 (0.0%) | 0 (0.0%) |
| Total | 304 (100.0%) | 447 (100.0%) |
Household Income by Mortgage Status in Charleston
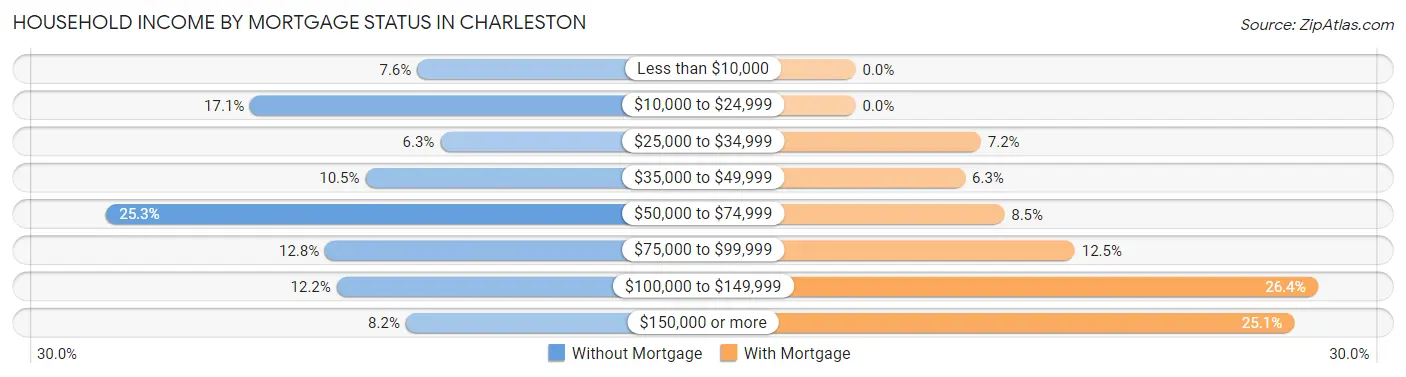
| Household Income | Without Mortgage | With Mortgage |
| Less than $10,000 | 23 (7.6%) | 0 (0.0%) |
| $10,000 to $24,999 | 52 (17.1%) | 0 (0.0%) |
| $25,000 to $34,999 | 19 (6.2%) | 32 (7.2%) |
| $35,000 to $49,999 | 32 (10.5%) | 28 (6.3%) |
| $50,000 to $74,999 | 77 (25.3%) | 38 (8.5%) |
| $75,000 to $99,999 | 39 (12.8%) | 56 (12.5%) |
| $100,000 to $149,999 | 37 (12.2%) | 118 (26.4%) |
| $150,000 or more | 25 (8.2%) | 112 (25.1%) |
| Total | 304 (100.0%) | 447 (100.0%) |
Property Value to Household Income Ratio in Charleston
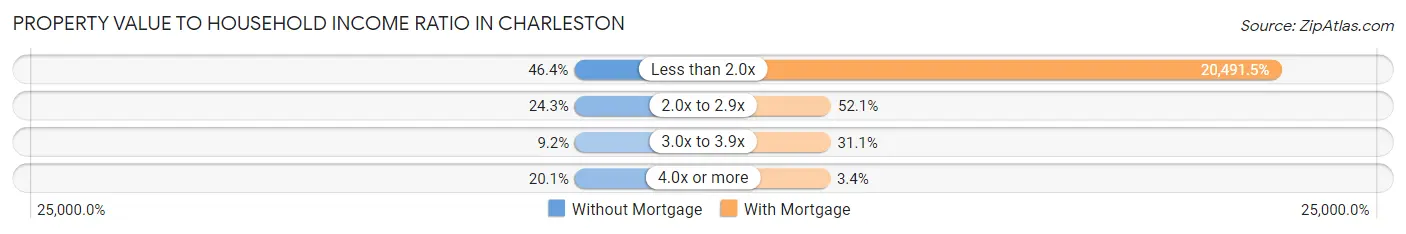
| Value-to-Income Ratio | Without Mortgage | With Mortgage |
| Less than 2.0x | 141 (46.4%) | 91,597 (20,491.5%) |
| 2.0x to 2.9x | 74 (24.3%) | 233 (52.1%) |
| 3.0x to 3.9x | 28 (9.2%) | 139 (31.1%) |
| 4.0x or more | 61 (20.1%) | 15 (3.4%) |
| Total | 304 (100.0%) | 447 (100.0%) |
Real Estate Taxes by Mortgage Status in Charleston
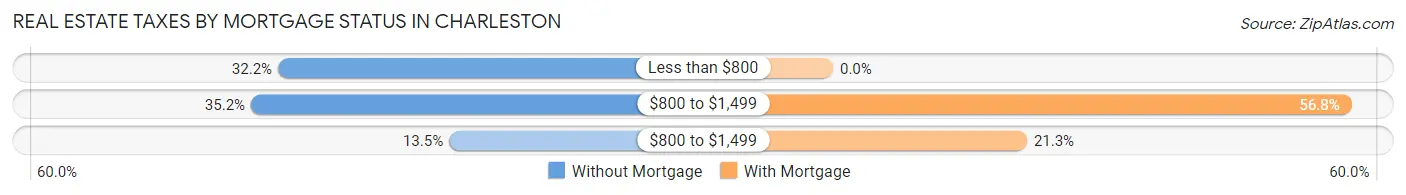
| Property Taxes | Without Mortgage | With Mortgage |
| Less than $800 | 98 (32.2%) | 0 (0.0%) |
| $800 to $1,499 | 107 (35.2%) | 254 (56.8%) |
| $800 to $1,499 | 41 (13.5%) | 95 (21.2%) |
| Total | 304 (100.0%) | 447 (100.0%) |
Health & Disability in Charleston
Health Insurance Coverage by Age in Charleston
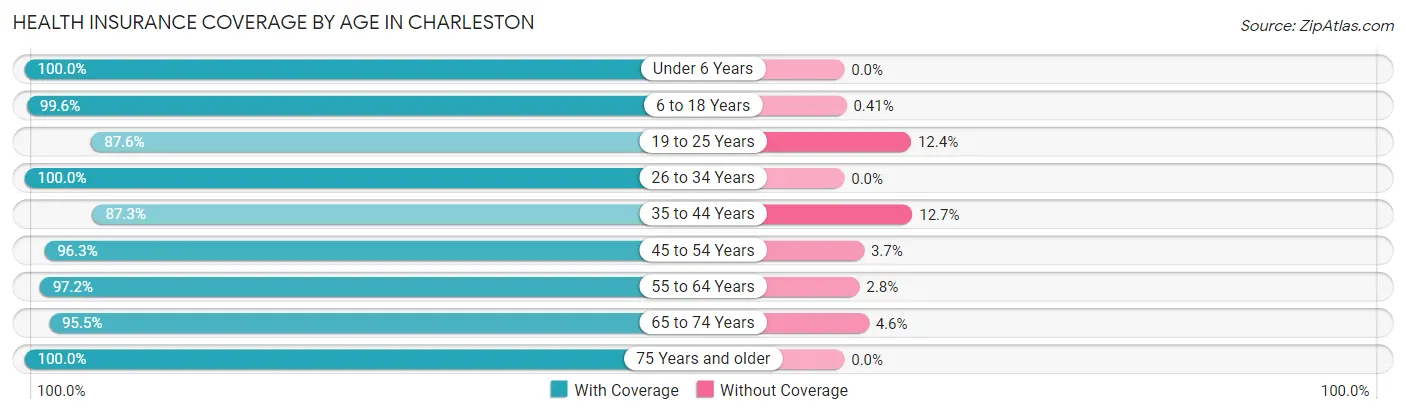
| Age Bracket | With Coverage | Without Coverage |
| Under 6 Years | 132 (100.0%) | 0 (0.0%) |
| 6 to 18 Years | 481 (99.6%) | 2 (0.4%) |
| 19 to 25 Years | 197 (87.6%) | 28 (12.4%) |
| 26 to 34 Years | 108 (100.0%) | 0 (0.0%) |
| 35 to 44 Years | 482 (87.3%) | 70 (12.7%) |
| 45 to 54 Years | 236 (96.3%) | 9 (3.7%) |
| 55 to 64 Years | 276 (97.2%) | 8 (2.8%) |
| 65 to 74 Years | 168 (95.5%) | 8 (4.5%) |
| 75 Years and older | 273 (100.0%) | 0 (0.0%) |
| Total | 2,353 (95.0%) | 125 (5.0%) |
Health Insurance Coverage by Citizenship Status in Charleston
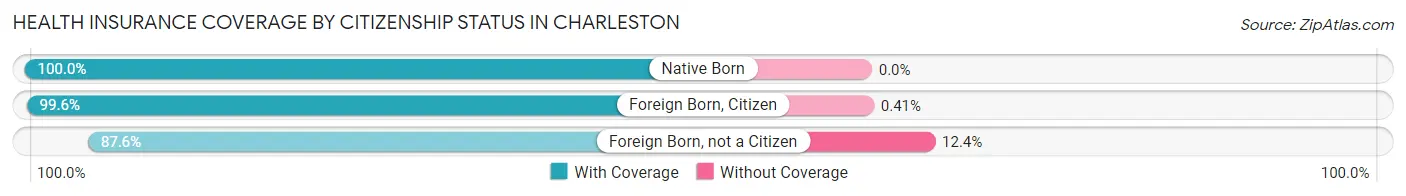
| Citizenship Status | With Coverage | Without Coverage |
| Native Born | 132 (100.0%) | 0 (0.0%) |
| Foreign Born, Citizen | 481 (99.6%) | 2 (0.4%) |
| Foreign Born, not a Citizen | 197 (87.6%) | 28 (12.4%) |
Health Insurance Coverage by Household Income in Charleston
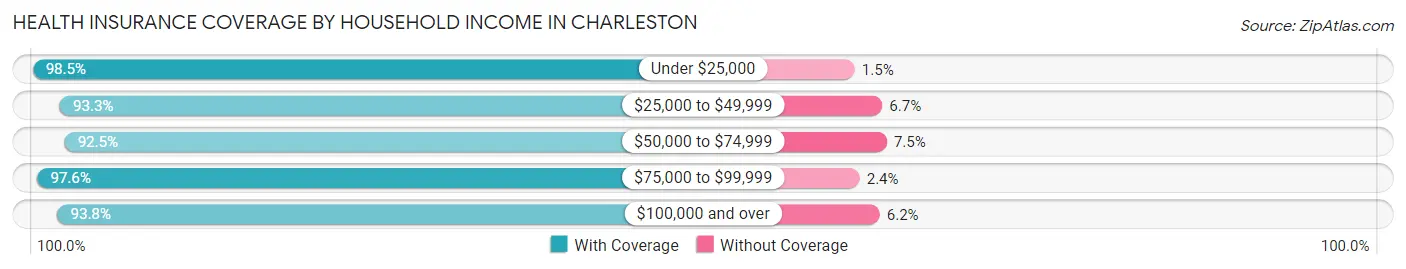
| Household Income | With Coverage | Without Coverage |
| Under $25,000 | 325 (98.5%) | 5 (1.5%) |
| $25,000 to $49,999 | 434 (93.3%) | 31 (6.7%) |
| $50,000 to $74,999 | 344 (92.5%) | 28 (7.5%) |
| $75,000 to $99,999 | 522 (97.6%) | 13 (2.4%) |
| $100,000 and over | 728 (93.8%) | 48 (6.2%) |
Public vs Private Health Insurance Coverage by Age in Charleston
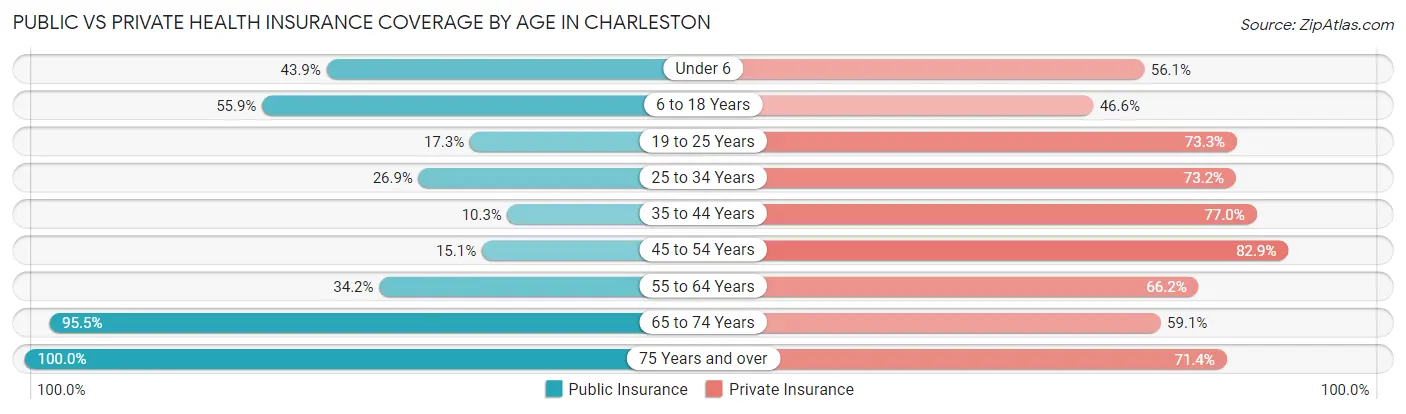
| Age Bracket | Public Insurance | Private Insurance |
| Under 6 | 58 (43.9%) | 74 (56.1%) |
| 6 to 18 Years | 270 (55.9%) | 225 (46.6%) |
| 19 to 25 Years | 39 (17.3%) | 165 (73.3%) |
| 25 to 34 Years | 29 (26.9%) | 79 (73.2%) |
| 35 to 44 Years | 57 (10.3%) | 425 (77.0%) |
| 45 to 54 Years | 37 (15.1%) | 203 (82.9%) |
| 55 to 64 Years | 97 (34.2%) | 188 (66.2%) |
| 65 to 74 Years | 168 (95.5%) | 104 (59.1%) |
| 75 Years and over | 273 (100.0%) | 195 (71.4%) |
| Total | 1,028 (41.5%) | 1,658 (66.9%) |
Disability Status by Sex by Age in Charleston
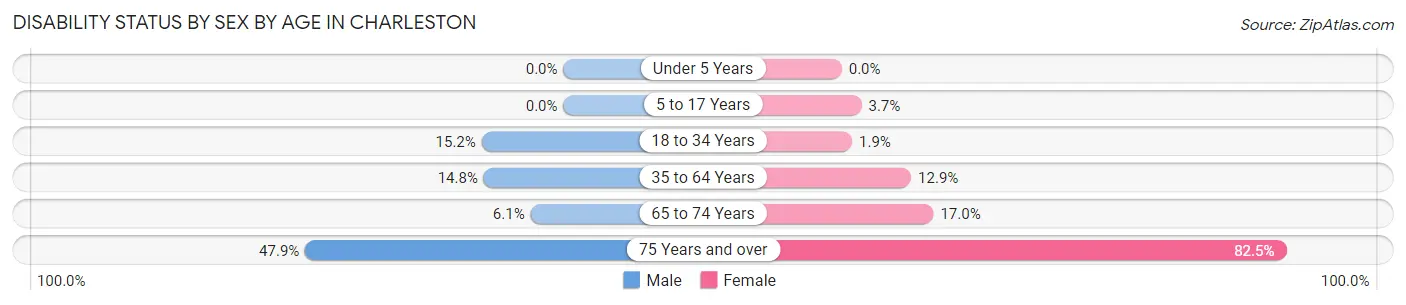
| Age Bracket | Male | Female |
| Under 5 Years | 0 (0.0%) | 0 (0.0%) |
| 5 to 17 Years | 0 (0.0%) | 9 (3.7%) |
| 18 to 34 Years | 32 (15.2%) | 3 (1.9%) |
| 35 to 64 Years | 69 (14.8%) | 79 (12.9%) |
| 65 to 74 Years | 5 (6.1%) | 16 (17.0%) |
| 75 Years and over | 46 (47.9%) | 146 (82.5%) |
Disability Class by Sex by Age in Charleston
Disability Class: Hearing Difficulty
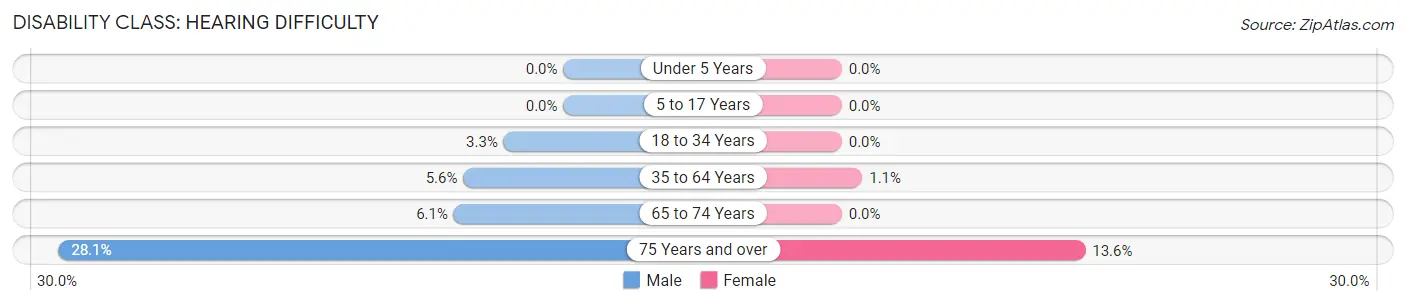
| Age Bracket | Male | Female |
| Under 5 Years | 0 (0.0%) | 0 (0.0%) |
| 5 to 17 Years | 0 (0.0%) | 0 (0.0%) |
| 18 to 34 Years | 7 (3.3%) | 0 (0.0%) |
| 35 to 64 Years | 26 (5.6%) | 7 (1.1%) |
| 65 to 74 Years | 5 (6.1%) | 0 (0.0%) |
| 75 Years and over | 27 (28.1%) | 24 (13.6%) |
Disability Class: Vision Difficulty
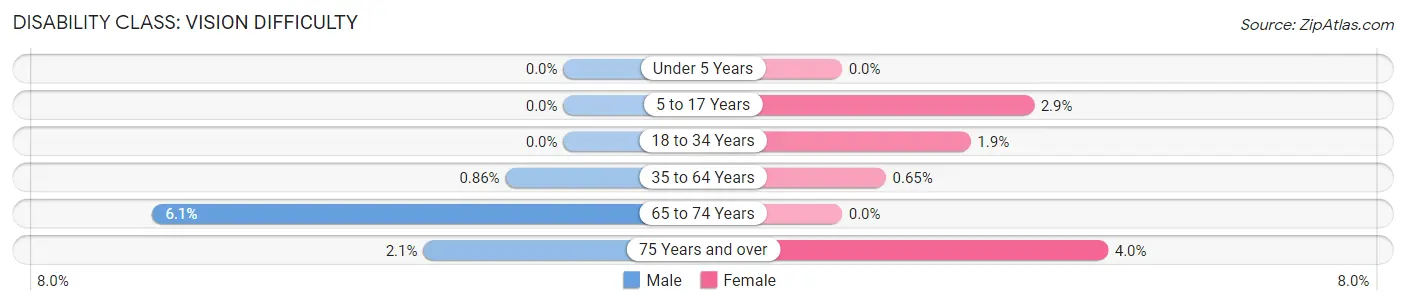
| Age Bracket | Male | Female |
| Under 5 Years | 0 (0.0%) | 0 (0.0%) |
| 5 to 17 Years | 0 (0.0%) | 7 (2.9%) |
| 18 to 34 Years | 0 (0.0%) | 3 (1.9%) |
| 35 to 64 Years | 4 (0.9%) | 4 (0.6%) |
| 65 to 74 Years | 5 (6.1%) | 0 (0.0%) |
| 75 Years and over | 2 (2.1%) | 7 (4.0%) |
Disability Class: Cognitive Difficulty
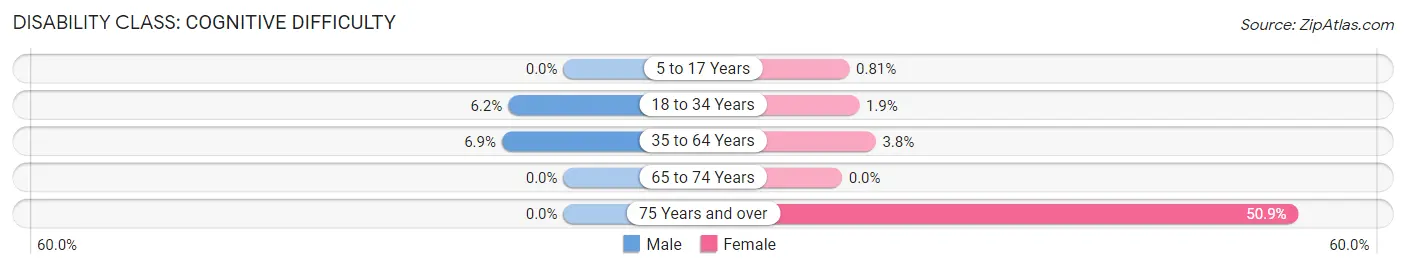
| Age Bracket | Male | Female |
| 5 to 17 Years | 0 (0.0%) | 2 (0.8%) |
| 18 to 34 Years | 13 (6.2%) | 3 (1.9%) |
| 35 to 64 Years | 32 (6.9%) | 23 (3.7%) |
| 65 to 74 Years | 0 (0.0%) | 0 (0.0%) |
| 75 Years and over | 0 (0.0%) | 90 (50.8%) |
Disability Class: Ambulatory Difficulty
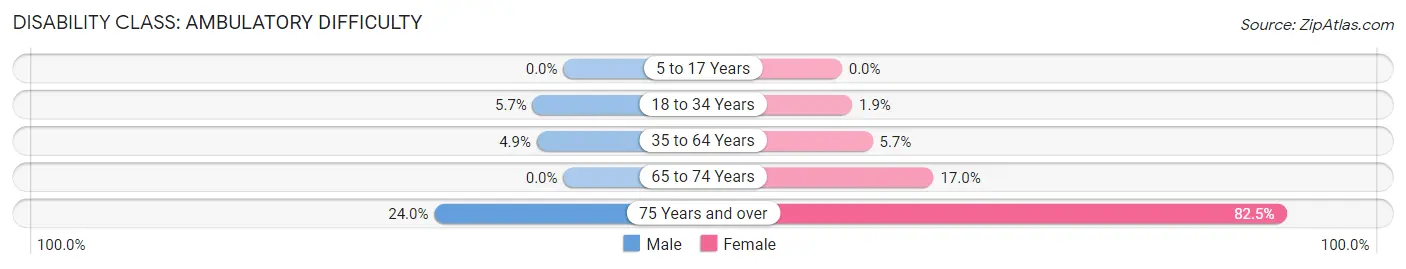
| Age Bracket | Male | Female |
| 5 to 17 Years | 0 (0.0%) | 0 (0.0%) |
| 18 to 34 Years | 12 (5.7%) | 3 (1.9%) |
| 35 to 64 Years | 23 (4.9%) | 35 (5.7%) |
| 65 to 74 Years | 0 (0.0%) | 16 (17.0%) |
| 75 Years and over | 23 (24.0%) | 146 (82.5%) |
Disability Class: Self-Care Difficulty
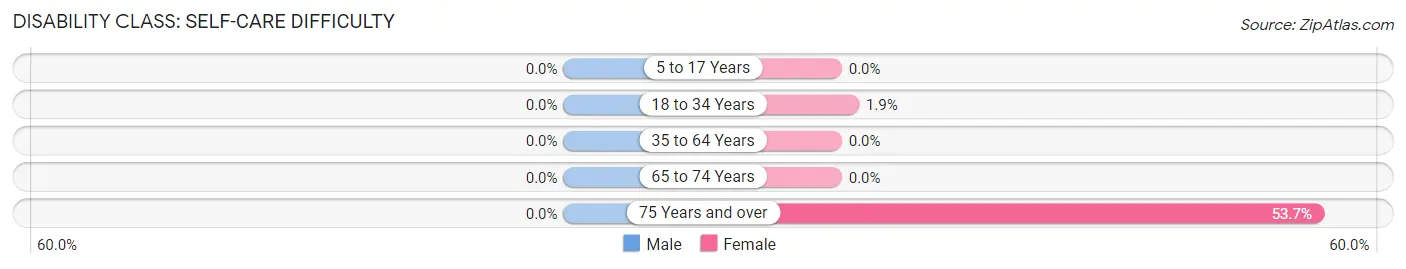
| Age Bracket | Male | Female |
| 5 to 17 Years | 0 (0.0%) | 0 (0.0%) |
| 18 to 34 Years | 0 (0.0%) | 3 (1.9%) |
| 35 to 64 Years | 0 (0.0%) | 0 (0.0%) |
| 65 to 74 Years | 0 (0.0%) | 0 (0.0%) |
| 75 Years and over | 0 (0.0%) | 95 (53.7%) |
Technology Access in Charleston
Computing Device Access in Charleston
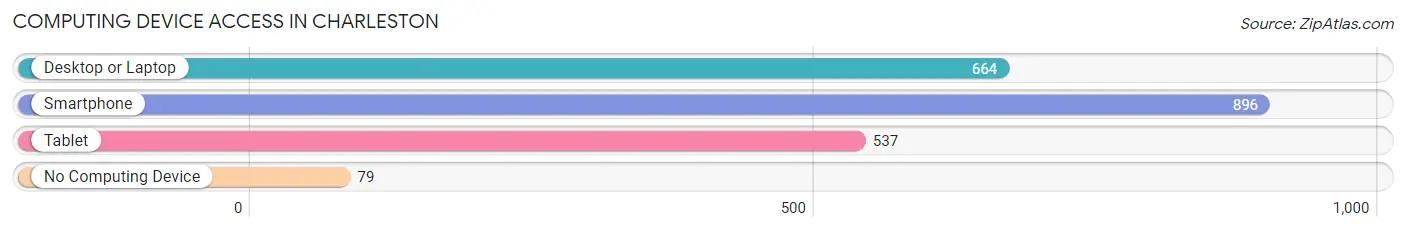
| Device Type | # Households | % Households |
| Desktop or Laptop | 664 | 66.0% |
| Smartphone | 896 | 89.1% |
| Tablet | 537 | 53.4% |
| No Computing Device | 79 | 7.9% |
| Total | 1,006 | 100.0% |
Internet Access in Charleston
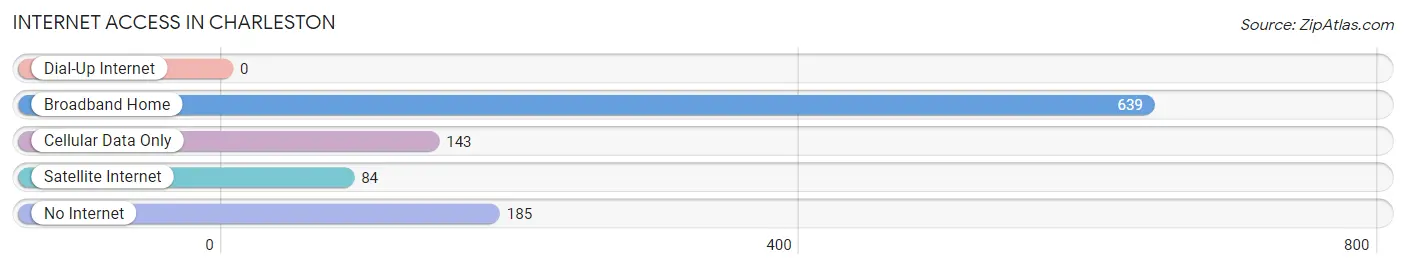
| Internet Type | # Households | % Households |
| Dial-Up Internet | 0 | 0.0% |
| Broadband Home | 639 | 63.5% |
| Cellular Data Only | 143 | 14.2% |
| Satellite Internet | 84 | 8.4% |
| No Internet | 185 | 18.4% |
| Total | 1,006 | 100.0% |
Charleston Summary
Charleston is a city located in Franklin County, Arkansas, United States. It is the county seat of Franklin County and is located in the foothills of the Ozark Mountains. The population was 1,945 at the 2010 census.
History
The area that is now Charleston was first settled in the early 1800s by settlers from the Carolinas. The town was originally known as "Carolina City" and was later renamed "Charleston" in 1837. The town was incorporated in 1875.
Charleston was a major center of the timber industry in the late 19th and early 20th centuries. The town was also home to a large cotton mill, which was built in 1891 and operated until the 1950s.
Geography
Charleston is located in the foothills of the Ozark Mountains in northwestern Arkansas. The city is situated at the intersection of U.S. Route 62 and Arkansas Highway 22. The city is located approximately 30 miles north of Fort Smith and 60 miles south of Fayetteville.
The city has a total area of 2.2 square miles, all of which is land. The city is located in the Boston Mountains region of the Ozark Mountains.
Economy
The economy of Charleston is largely based on agriculture and timber. The city is home to several large farms and ranches, as well as several timber companies. The city is also home to several small businesses, including a grocery store, a hardware store, and a few restaurants.
Demographics
As of the 2010 census, there were 1,945 people, 790 households, and 517 families residing in the city. The population density was 876.8 people per square mile. There were 890 housing units at an average density of 400.9 per square mile. The racial makeup of the city was 95.2% White, 0.3% African American, 0.7% Native American, 0.2% Asian, 0.1% Pacific Islander, 1.7% from other races, and 1.8% from two or more races. Hispanic or Latino of any race were 3.2% of the population.
There were 790 households, out of which 28.2% had children under the age of 18 living with them, 48.1% were married couples living together, 12.3% had a female householder with no husband present, and 35.6% were non-families. 32.3% of all households were made up of individuals, and 16.3% had someone living alone who was 65 years of age or older. The average household size was 2.37 and the average family size was 2.97.
In the city, the population was spread out, with 24.2% under the age of 18, 8.2% from 18 to 24, 25.2% from 25 to 44, 22.7% from 45 to 64, and 19.7% who were 65 years of age or older. The median age was 39 years. For every 100 females, there were 87.2 males. For every 100 females age 18 and over, there were 82.3 males.
The median income for a household in the city was $27,917, and the median income for a family was $35,000. Males had a median income of $27,500 versus $20,000 for females. The per capita income for the city was $14,945. About 13.2% of families and 17.2% of the population were below the poverty line, including 22.2% of those under age 18 and 16.2% of those age 65 or over.
Common Questions
What is Per Capita Income in Charleston?
Per Capita income in Charleston is $29,348.
What is the Median Family Income in Charleston?
Median Family Income in Charleston is $83,009.
What is the Median Household income in Charleston?
Median Household Income in Charleston is $63,661.
What is Income or Wage Gap in Charleston?
Income or Wage Gap in Charleston is 19.4%.
Women in Charleston earn 80.6 cents for every dollar earned by a man.
What is Inequality or Gini Index in Charleston?
Inequality or Gini Index in Charleston is 0.42.
What is the Total Population of Charleston?
Total Population of Charleston is 2,585.
What is the Total Male Population of Charleston?
Total Male Population of Charleston is 1,183.
What is the Total Female Population of Charleston?
Total Female Population of Charleston is 1,402.
What is the Ratio of Males per 100 Females in Charleston?
There are 84.38 Males per 100 Females in Charleston.
What is the Ratio of Females per 100 Males in Charleston?
There are 118.51 Females per 100 Males in Charleston.
What is the Median Population Age in Charleston?
Median Population Age in Charleston is 40.6 Years.
What is the Average Family Size in Charleston
Average Family Size in Charleston is 3.1 People.
What is the Average Household Size in Charleston
Average Household Size in Charleston is 2.5 People.
How Large is the Labor Force in Charleston?
There are 1,275 People in the Labor Forcein in Charleston.
What is the Percentage of People in the Labor Force in Charleston?
60.3% of People are in the Labor Force in Charleston.
What is the Unemployment Rate in Charleston?
Unemployment Rate in Charleston is 4.2%.