Flippin, AR
Flippin Map
Flippin Overview
1,366
TOTAL POPULATION
613
MALE POPULATION
753
FEMALE POPULATION
81.41
MALES / 100 FEMALES
122.84
FEMALES / 100 MALES
31.1
MEDIAN AGE
3.3
AVG FAMILY SIZE
2.5
AVG HOUSEHOLD SIZE
$18,487
PER CAPITA INCOME
$48,125
AVG FAMILY INCOME
$38,686
AVG HOUSEHOLD INCOME
41.3%
WAGE / INCOME GAP [ % ]
58.7¢/ $1
WAGE / INCOME GAP [ $ ]
0.40
INEQUALITY / GINI INDEX
565
LABOR FORCE [ PEOPLE ]
58.3%
PERCENT IN LABOR FORCE
9.4%
UNEMPLOYMENT RATE
Flippin Zip Codes
Flippin Area Codes
Race in Flippin
The most populous races in Flippin are White / Caucasian (1,284 | 94.0%), Two or more Races (60 | 4.4%), and Hispanic or Latino (53 | 3.9%).
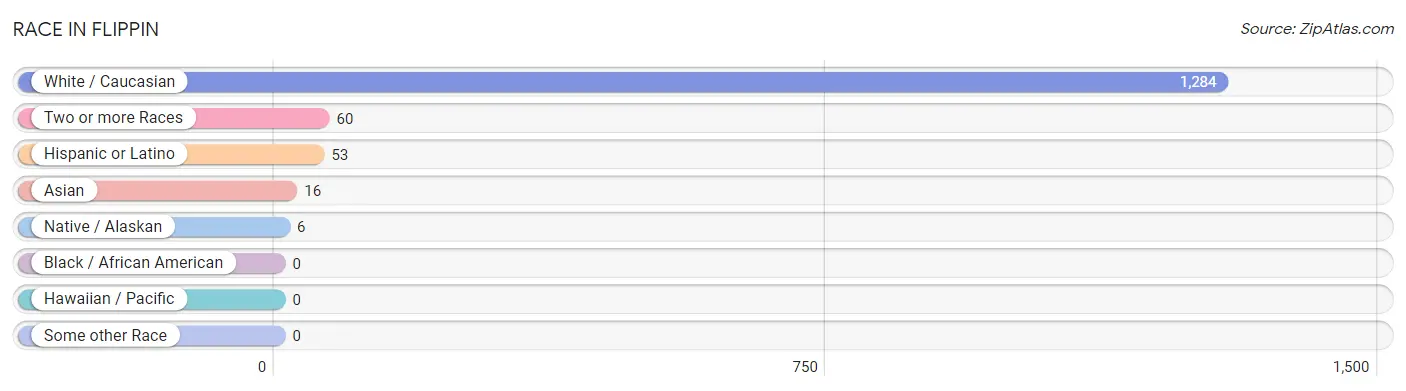
| Race | # Population | % Population |
| Asian | 16 | 1.2% |
| Black / African American | 0 | 0.0% |
| Hawaiian / Pacific | 0 | 0.0% |
| Hispanic or Latino | 53 | 3.9% |
| Native / Alaskan | 6 | 0.4% |
| White / Caucasian | 1,284 | 94.0% |
| Two or more Races | 60 | 4.4% |
| Some other Race | 0 | 0.0% |
| Total | 1,366 | 100.0% |
Ancestry in Flippin
The most populous ancestries reported in Flippin are English (276 | 20.2%), Irish (266 | 19.5%), German (199 | 14.6%), Dutch (86 | 6.3%), and American (61 | 4.5%), together accounting for 65.0% of all Flippin residents.
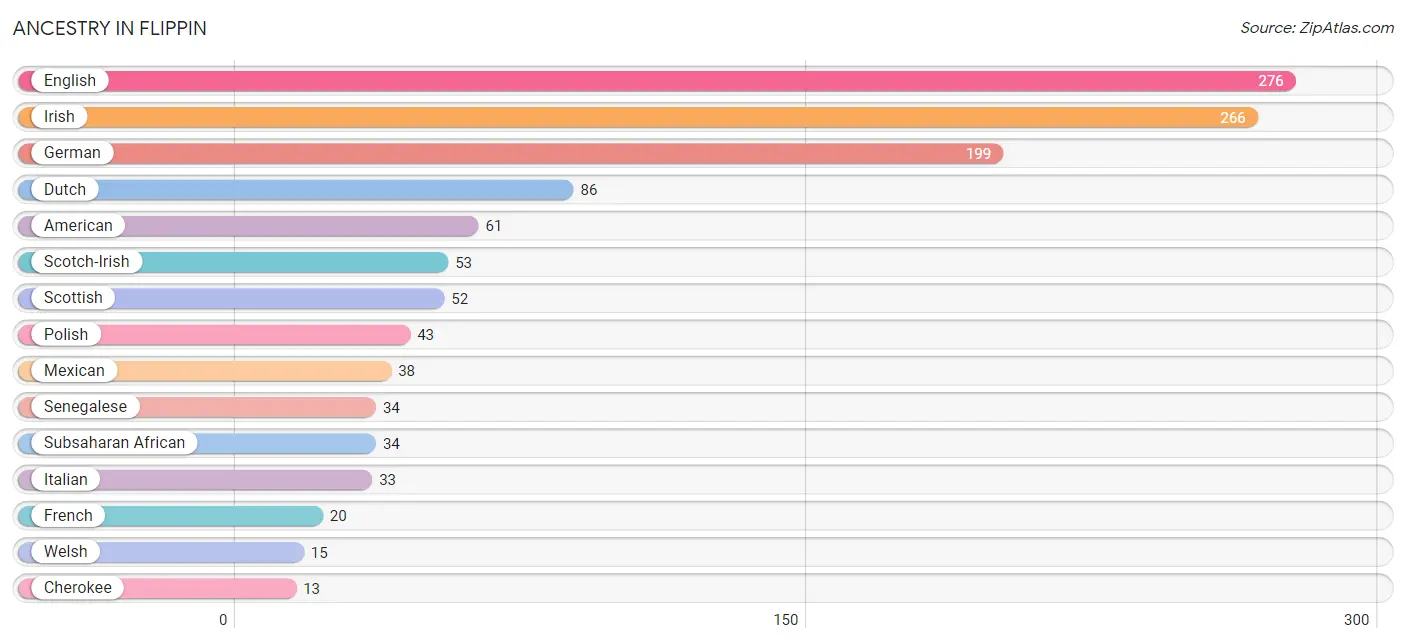
| Ancestry | # Population | % Population |
| American | 61 | 4.5% |
| Bhutanese | 5 | 0.4% |
| British | 3 | 0.2% |
| Cajun | 9 | 0.7% |
| Canadian | 4 | 0.3% |
| Celtic | 2 | 0.2% |
| Cherokee | 13 | 0.9% |
| Chilean | 7 | 0.5% |
| Croatian | 3 | 0.2% |
| Cuban | 3 | 0.2% |
| Czech | 3 | 0.2% |
| Dutch | 86 | 6.3% |
| English | 276 | 20.2% |
| European | 2 | 0.2% |
| French | 20 | 1.5% |
| French Canadian | 7 | 0.5% |
| German | 199 | 14.6% |
| Hungarian | 8 | 0.6% |
| Indian (Asian) | 3 | 0.2% |
| Irish | 266 | 19.5% |
| Italian | 33 | 2.4% |
| Korean | 9 | 0.7% |
| Laotian | 5 | 0.4% |
| Luxembourger | 1 | 0.1% |
| Mexican | 38 | 2.8% |
| Norwegian | 8 | 0.6% |
| Polish | 43 | 3.2% |
| Puerto Rican | 5 | 0.4% |
| Russian | 8 | 0.6% |
| Scandinavian | 3 | 0.2% |
| Scotch-Irish | 53 | 3.9% |
| Scottish | 52 | 3.8% |
| Senegalese | 34 | 2.5% |
| Slavic | 3 | 0.2% |
| South American | 7 | 0.5% |
| Subsaharan African | 34 | 2.5% |
| Swedish | 9 | 0.7% |
| Welsh | 15 | 1.1% | View All 38 Rows |
Immigrants in Flippin
The most numerous immigrant groups reported in Flippin came from Asia (8 | 0.6%), Canada (8 | 0.6%), Europe (8 | 0.6%), Germany (8 | 0.6%), and South Eastern Asia (8 | 0.6%), together accounting for 2.9% of all Flippin residents.
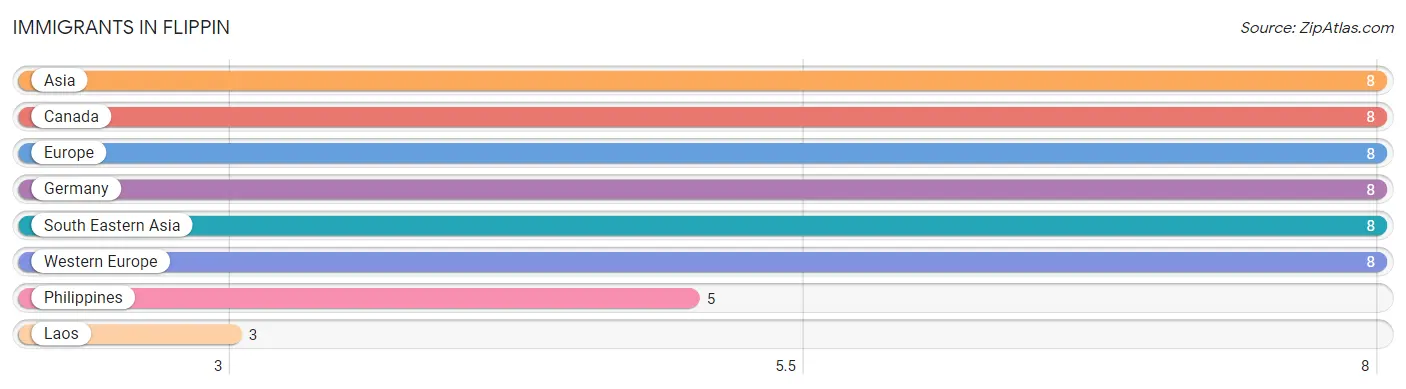
| Immigration Origin | # Population | % Population |
| Asia | 8 | 0.6% |
| Canada | 8 | 0.6% |
| Europe | 8 | 0.6% |
| Germany | 8 | 0.6% |
| Laos | 3 | 0.2% |
| Philippines | 5 | 0.4% |
| South Eastern Asia | 8 | 0.6% |
| Western Europe | 8 | 0.6% | View All 8 Rows |
Sex and Age in Flippin
Sex and Age in Flippin
The most populous age groups in Flippin are 5 to 9 Years (88 | 14.4%) for men and Under 5 Years (108 | 14.3%) for women.
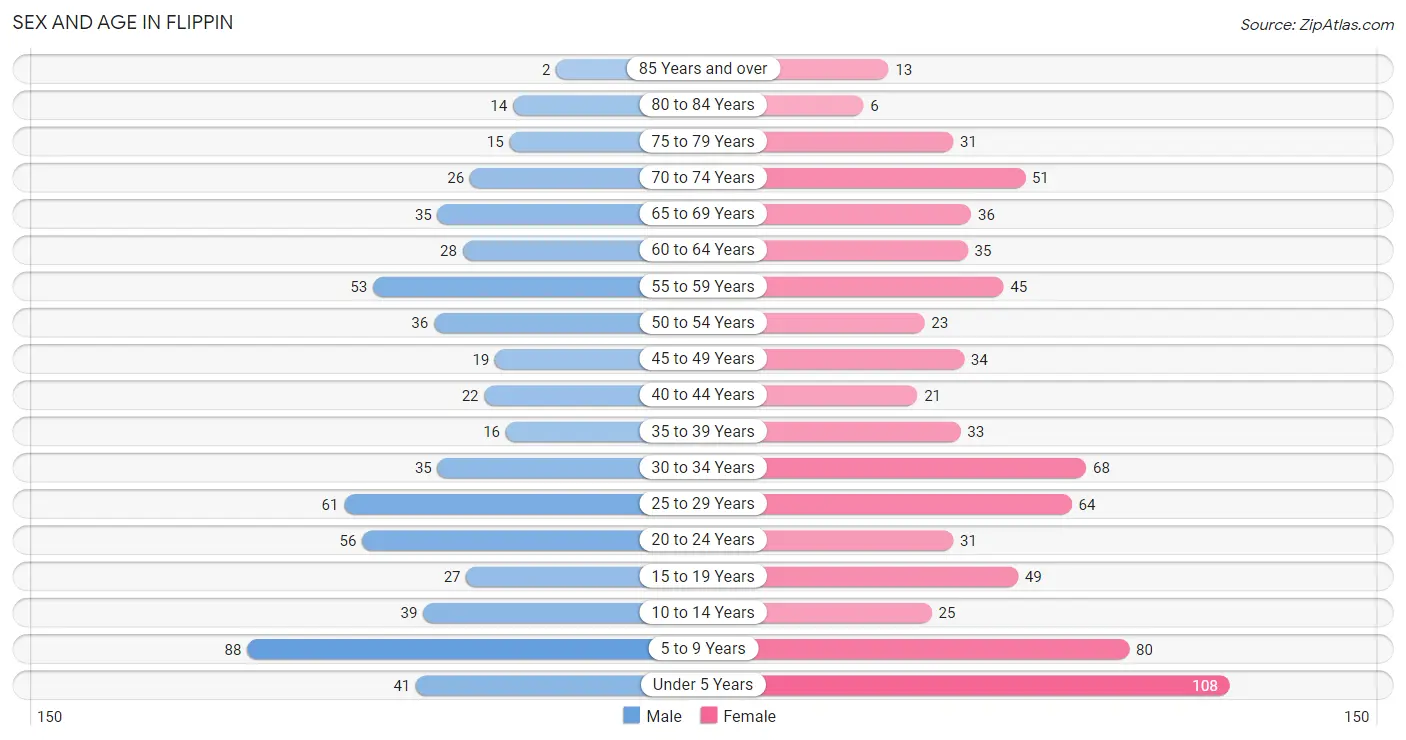
| Age Bracket | Male | Female |
| Under 5 Years | 41 (6.7%) | 108 (14.3%) |
| 5 to 9 Years | 88 (14.4%) | 80 (10.6%) |
| 10 to 14 Years | 39 (6.4%) | 25 (3.3%) |
| 15 to 19 Years | 27 (4.4%) | 49 (6.5%) |
| 20 to 24 Years | 56 (9.1%) | 31 (4.1%) |
| 25 to 29 Years | 61 (10.0%) | 64 (8.5%) |
| 30 to 34 Years | 35 (5.7%) | 68 (9.0%) |
| 35 to 39 Years | 16 (2.6%) | 33 (4.4%) |
| 40 to 44 Years | 22 (3.6%) | 21 (2.8%) |
| 45 to 49 Years | 19 (3.1%) | 34 (4.5%) |
| 50 to 54 Years | 36 (5.9%) | 23 (3.0%) |
| 55 to 59 Years | 53 (8.6%) | 45 (6.0%) |
| 60 to 64 Years | 28 (4.6%) | 35 (4.6%) |
| 65 to 69 Years | 35 (5.7%) | 36 (4.8%) |
| 70 to 74 Years | 26 (4.2%) | 51 (6.8%) |
| 75 to 79 Years | 15 (2.5%) | 31 (4.1%) |
| 80 to 84 Years | 14 (2.3%) | 6 (0.8%) |
| 85 Years and over | 2 (0.3%) | 13 (1.7%) |
| Total | 613 (100.0%) | 753 (100.0%) |
Families and Households in Flippin
Median Family Size in Flippin
The median family size in Flippin is 3.27 persons per family, with single female/mother families (100 | 29.8%) accounting for the largest median family size of 3.45 persons per family. On the other hand, single male/father families (25 | 7.5%) represent the smallest median family size with 2.32 persons per family.
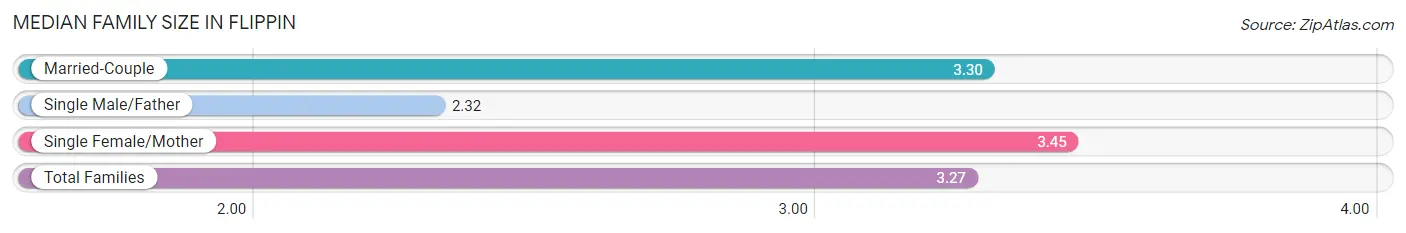
| Family Type | # Families | Family Size |
| Married-Couple | 210 (62.7%) | 3.30 |
| Single Male/Father | 25 (7.5%) | 2.32 |
| Single Female/Mother | 100 (29.8%) | 3.45 |
| Total Families | 335 (100.0%) | 3.27 |
Median Household Size in Flippin
The median household size in Flippin is 2.53 persons per household, with single female/mother households (100 | 18.5%) accounting for the largest median household size of 3.56 persons per household. non-family households (204 | 37.9%) represent the smallest median household size with 1.20 persons per household.
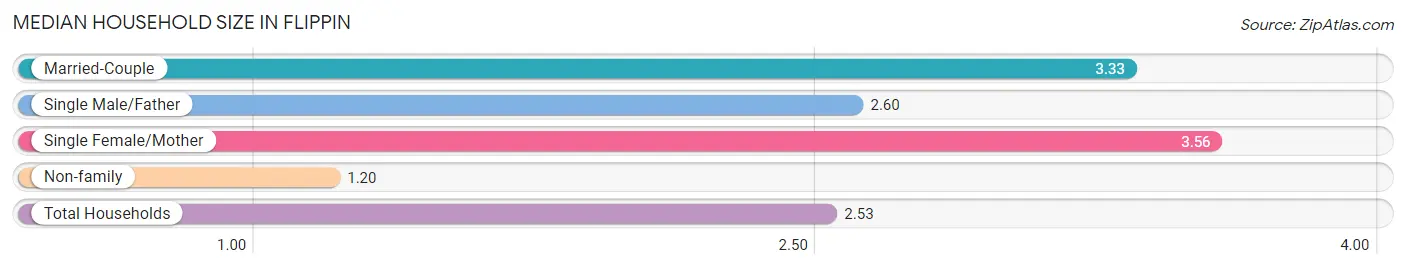
| Household Type | # Households | Household Size |
| Married-Couple | 210 (39.0%) | 3.33 |
| Single Male/Father | 25 (4.6%) | 2.60 |
| Single Female/Mother | 100 (18.5%) | 3.56 |
| Non-family | 204 (37.9%) | 1.20 |
| Total Households | 539 (100.0%) | 2.53 |
Household Size by Marriage Status in Flippin
Out of a total of 539 households in Flippin, 335 (62.2%) are family households, while 204 (37.9%) are nonfamily households. The most numerous type of family households are 2-person households, comprising 136, and the most common type of nonfamily households are 1-person households, comprising 175.
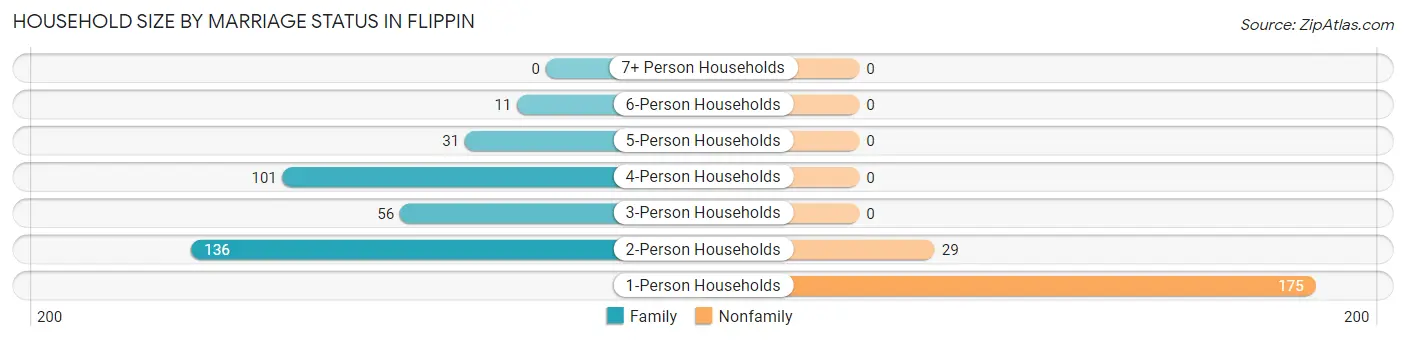
| Household Size | Family Households | Nonfamily Households |
| 1-Person Households | - | 175 (32.5%) |
| 2-Person Households | 136 (25.2%) | 29 (5.4%) |
| 3-Person Households | 56 (10.4%) | 0 (0.0%) |
| 4-Person Households | 101 (18.7%) | 0 (0.0%) |
| 5-Person Households | 31 (5.8%) | 0 (0.0%) |
| 6-Person Households | 11 (2.0%) | 0 (0.0%) |
| 7+ Person Households | 0 (0.0%) | 0 (0.0%) |
| Total | 335 (62.2%) | 204 (37.9%) |
Female Fertility in Flippin
Fertility by Age in Flippin
Average fertility rate in Flippin is 73.0 births per 1,000 women. Women in the age bracket of 20 to 34 years have the highest fertility rate with 135.0 births per 1,000 women. Women in the age bracket of 20 to 34 years acount for 100.0% of all women with births.
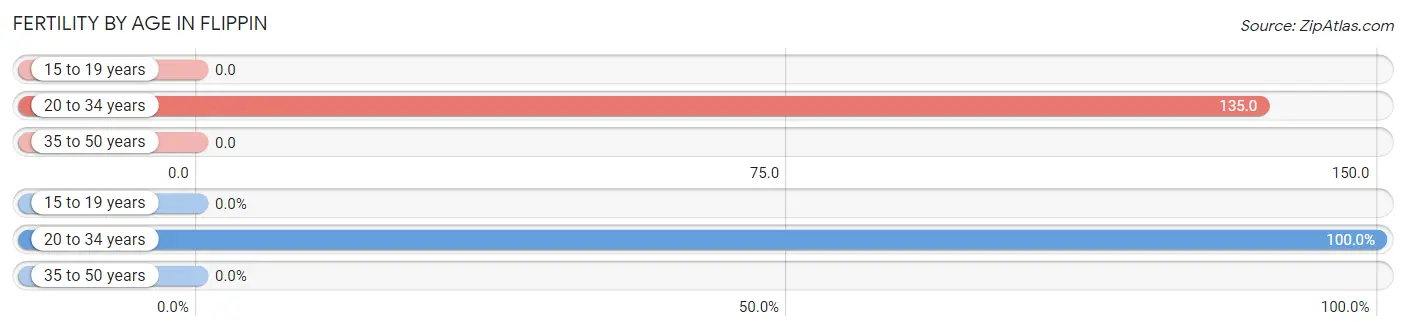
| Age Bracket | Women with Births | Births / 1,000 Women |
| 15 to 19 years | 0 (0.0%) | 0.0 |
| 20 to 34 years | 22 (100.0%) | 135.0 |
| 35 to 50 years | 0 (0.0%) | 0.0 |
| Total | 22 (100.0%) | 73.0 |
Fertility by Age by Marriage Status in Flippin
54.5% of women with births (22) in Flippin are married. The highest percentage of unmarried women with births falls into 20 to 34 years age bracket with 45.5% of them unmarried at the time of birth, while the lowest percentage of unmarried women with births belong to 20 to 34 years age bracket with 45.5% of them unmarried.
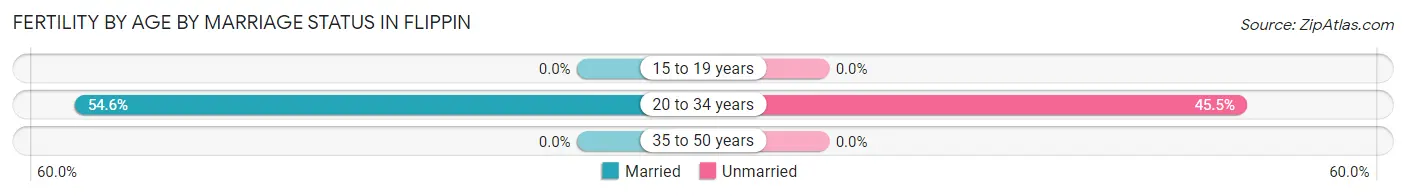
| Age Bracket | Married | Unmarried |
| 15 to 19 years | 0 (0.0%) | 0 (0.0%) |
| 20 to 34 years | 12 (54.5%) | 10 (45.5%) |
| 35 to 50 years | 0 (0.0%) | 0 (0.0%) |
| Total | 12 (54.5%) | 10 (45.5%) |
Fertility by Education in Flippin
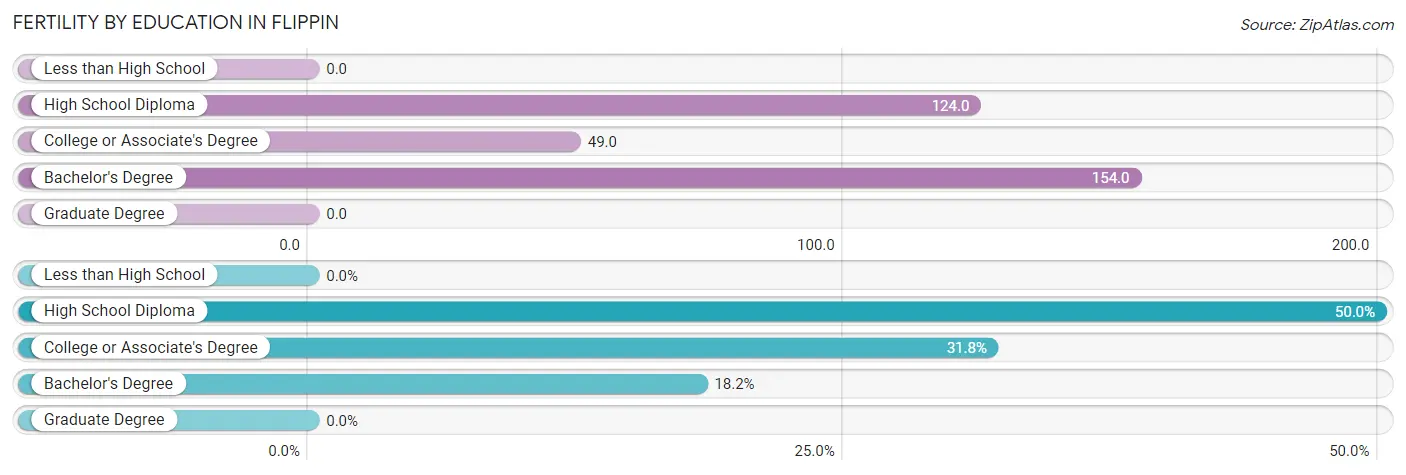
| Educational Attainment | Women with Births | Births / 1,000 Women |
| Less than High School | 0 (0.0%) | 0.0 |
| High School Diploma | 11 (50.0%) | 124.0 |
| College or Associate's Degree | 7 (31.8%) | 49.0 |
| Bachelor's Degree | 4 (18.2%) | 154.0 |
| Graduate Degree | 0 (0.0%) | 0.0 |
| Total | 22 (100.0%) | 73.0 |
Fertility by Education by Marriage Status in Flippin
45.5% of women with births in Flippin are unmarried. Women with the educational attainment of bachelor's degree are most likely to be married with 100.0% of them married at childbirth, while women with the educational attainment of college or associate's degree are least likely to be married with 100.0% of them unmarried at childbirth.
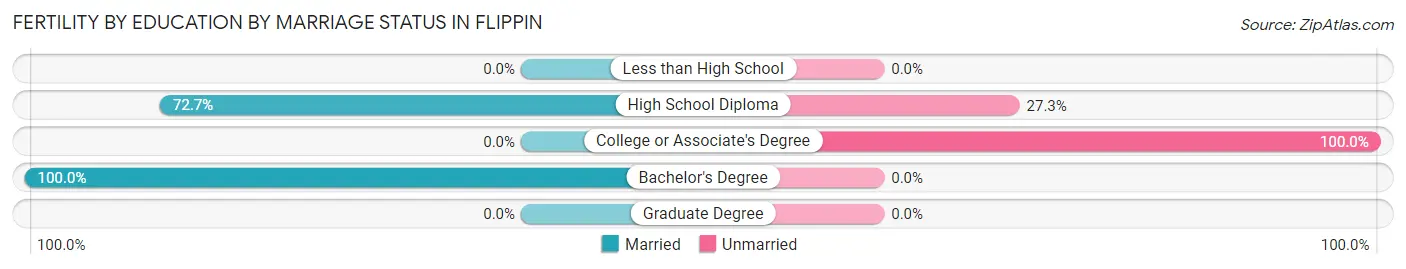
| Educational Attainment | Married | Unmarried |
| Less than High School | 0 (0.0%) | 0 (0.0%) |
| High School Diploma | 8 (72.7%) | 3 (27.3%) |
| College or Associate's Degree | 0 (0.0%) | 7 (100.0%) |
| Bachelor's Degree | 4 (100.0%) | 0 (0.0%) |
| Graduate Degree | 0 (0.0%) | 0 (0.0%) |
| Total | 12 (54.5%) | 10 (45.5%) |
Income in Flippin
Income Overview in Flippin
Per Capita Income in Flippin is $18,487, while median incomes of families and households are $48,125 and $38,686 respectively.
| Characteristic | Number | Measure |
| Per Capita Income | 1,366 | $18,487 |
| Median Family Income | 335 | $48,125 |
| Mean Family Income | 335 | $49,665 |
| Median Household Income | 539 | $38,686 |
| Mean Household Income | 539 | $45,742 |
| Income Deficit | 335 | $0 |
| Wage / Income Gap (%) | 1,366 | 41.34% |
| Wage / Income Gap ($) | 1,366 | 58.66¢ per $1 |
| Gini / Inequality Index | 1,366 | 0.40 |
Earnings by Sex in Flippin
Average Earnings in Flippin are $31,844, $41,250 for men and $24,196 for women, a difference of 41.3%.
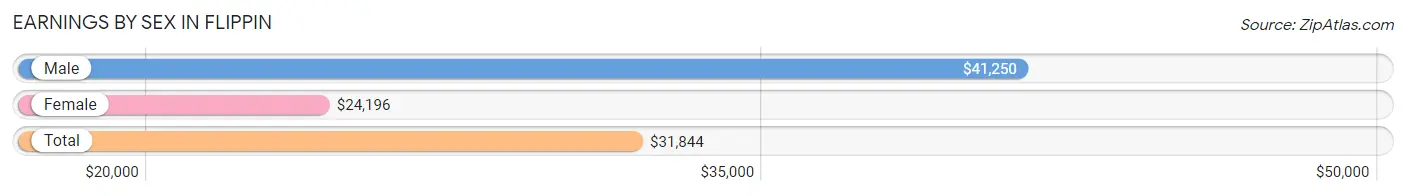
| Sex | Number | Average Earnings |
| Male | 269 (49.2%) | $41,250 |
| Female | 278 (50.8%) | $24,196 |
| Total | 547 (100.0%) | $31,844 |
Earnings by Sex by Income Bracket in Flippin
The most common earnings brackets in Flippin are $55,000 to $64,999 for men (44 | 16.4%) and $35,000 to $39,999 for women (40 | 14.4%).
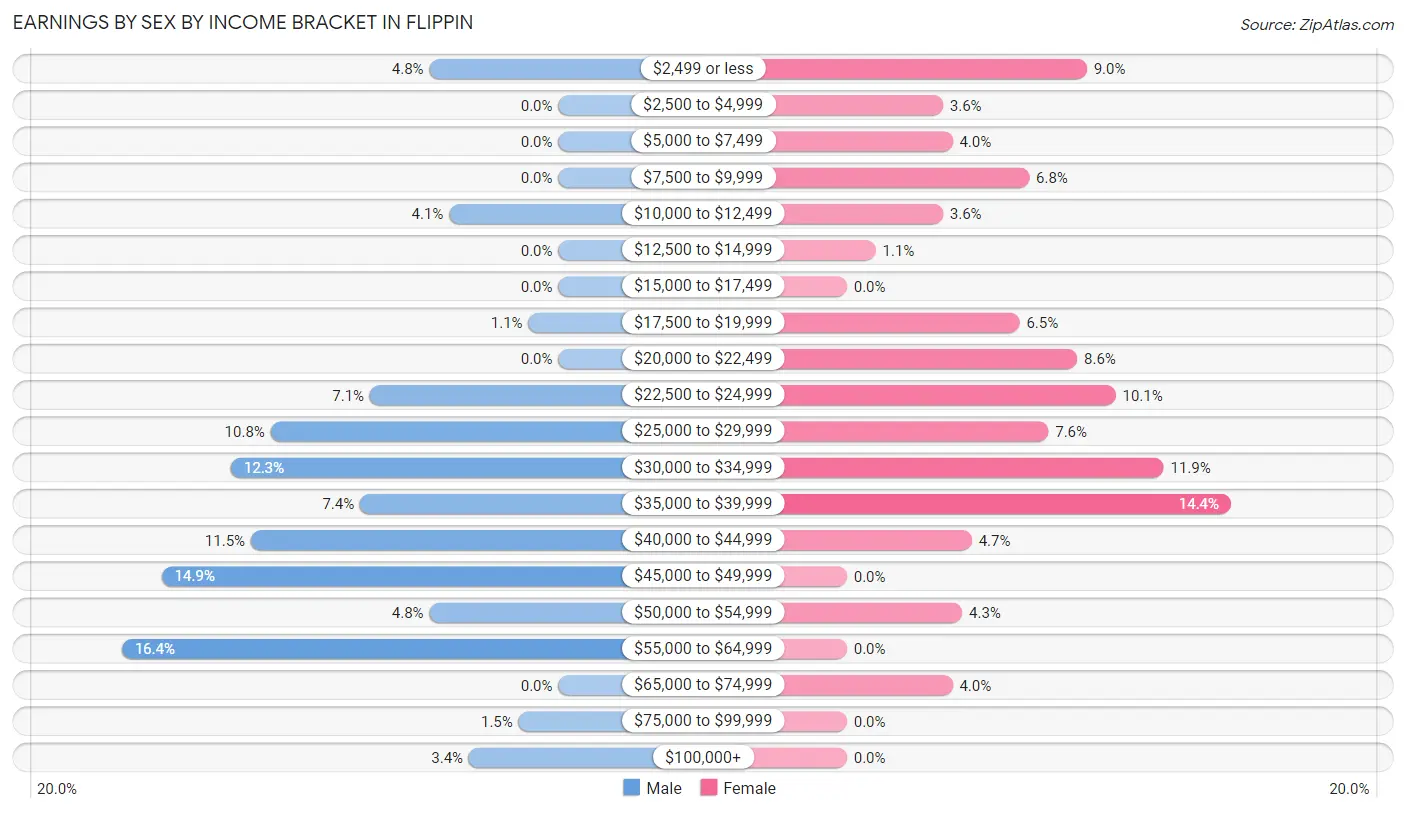
| Income | Male | Female |
| $2,499 or less | 13 (4.8%) | 25 (9.0%) |
| $2,500 to $4,999 | 0 (0.0%) | 10 (3.6%) |
| $5,000 to $7,499 | 0 (0.0%) | 11 (4.0%) |
| $7,500 to $9,999 | 0 (0.0%) | 19 (6.8%) |
| $10,000 to $12,499 | 11 (4.1%) | 10 (3.6%) |
| $12,500 to $14,999 | 0 (0.0%) | 3 (1.1%) |
| $15,000 to $17,499 | 0 (0.0%) | 0 (0.0%) |
| $17,500 to $19,999 | 3 (1.1%) | 18 (6.5%) |
| $20,000 to $22,499 | 0 (0.0%) | 24 (8.6%) |
| $22,500 to $24,999 | 19 (7.1%) | 28 (10.1%) |
| $25,000 to $29,999 | 29 (10.8%) | 21 (7.5%) |
| $30,000 to $34,999 | 33 (12.3%) | 33 (11.9%) |
| $35,000 to $39,999 | 20 (7.4%) | 40 (14.4%) |
| $40,000 to $44,999 | 31 (11.5%) | 13 (4.7%) |
| $45,000 to $49,999 | 40 (14.9%) | 0 (0.0%) |
| $50,000 to $54,999 | 13 (4.8%) | 12 (4.3%) |
| $55,000 to $64,999 | 44 (16.4%) | 0 (0.0%) |
| $65,000 to $74,999 | 0 (0.0%) | 11 (4.0%) |
| $75,000 to $99,999 | 4 (1.5%) | 0 (0.0%) |
| $100,000+ | 9 (3.4%) | 0 (0.0%) |
| Total | 269 (100.0%) | 278 (100.0%) |
Earnings by Sex by Educational Attainment in Flippin
Average earnings in Flippin are $41,964 for men and $25,521 for women, a difference of 39.2%. Men with an educational attainment of less than high school enjoy the highest average annual earnings of $44,250, while those with college or associate's degree education earn the least with $31,250. Women with an educational attainment of bachelor's degree earn the most with the average annual earnings of $33,929, while those with college or associate's degree education have the smallest earnings of $23,438.
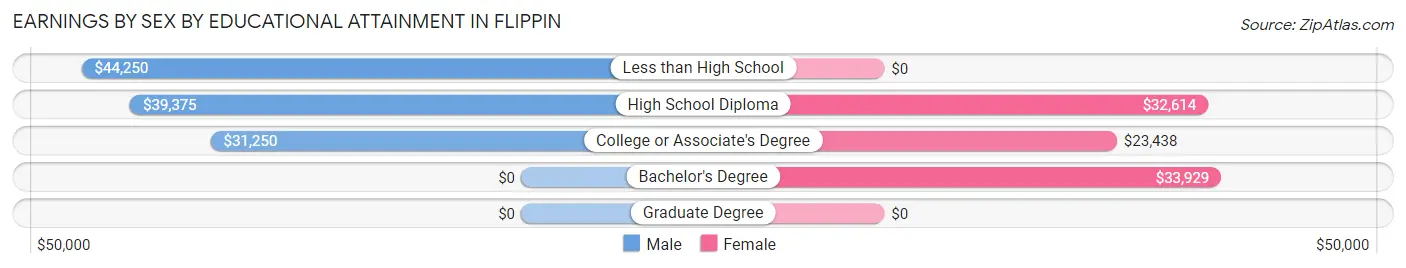
| Educational Attainment | Male Income | Female Income |
| Less than High School | $44,250 | $0 |
| High School Diploma | $39,375 | $32,614 |
| College or Associate's Degree | $31,250 | $23,438 |
| Bachelor's Degree | - | - |
| Graduate Degree | - | - |
| Total | $41,964 | $25,521 |
Family Income in Flippin
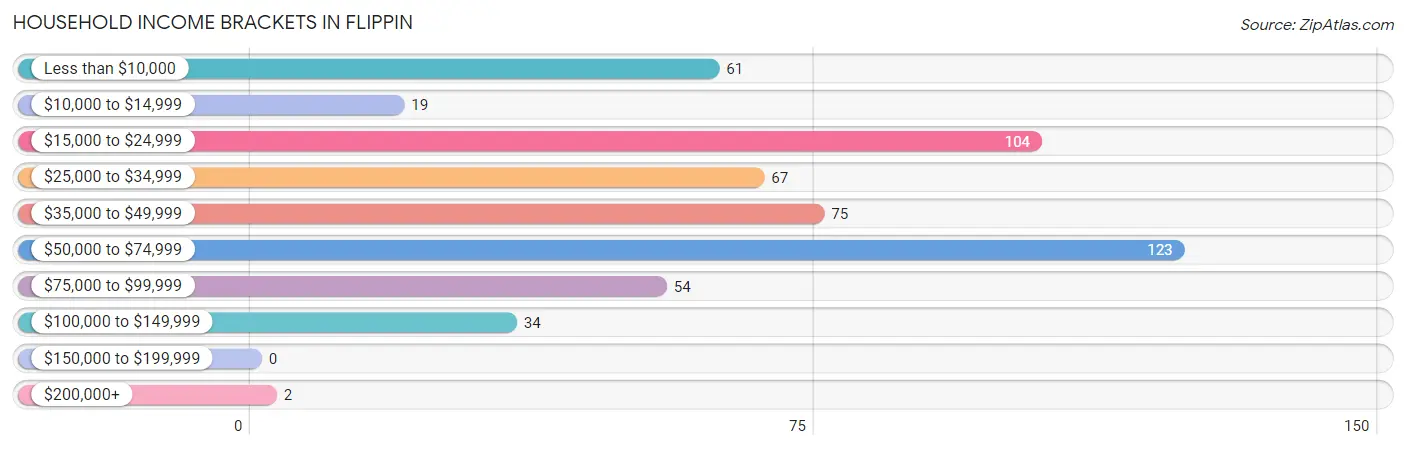
Family Income Brackets in Flippin
According to the Flippin family income data, there are 106 families falling into the $50,000 to $74,999 income range, which is the most common income bracket and makes up 31.6% of all families.
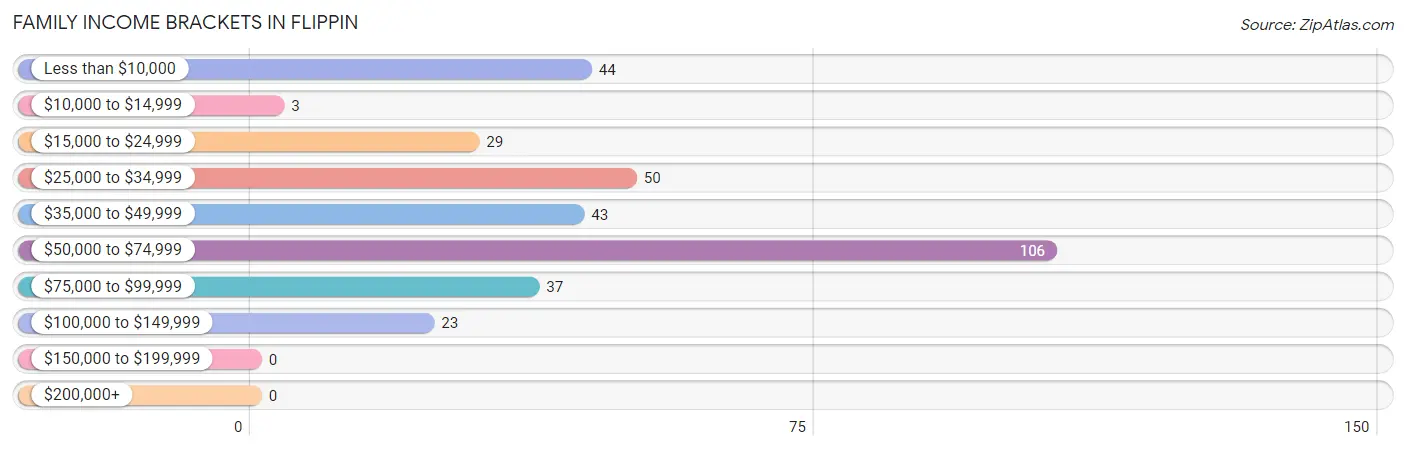
| Income Bracket | # Families | % Families |
| Less than $10,000 | 44 | 13.1% |
| $10,000 to $14,999 | 3 | 0.9% |
| $15,000 to $24,999 | 29 | 8.7% |
| $25,000 to $34,999 | 50 | 14.9% |
| $35,000 to $49,999 | 43 | 12.8% |
| $50,000 to $74,999 | 106 | 31.6% |
| $75,000 to $99,999 | 37 | 11.0% |
| $100,000 to $149,999 | 23 | 6.9% |
| $150,000 to $199,999 | 0 | 0.0% |
| $200,000+ | 0 | 0.0% |
Family Income by Famaliy Size in Flippin
5-person families (26 | 7.8%) account for the highest median family income in Flippin with $68,571 per family, while 2-person families (150 | 44.8%) have the highest median income of $27,438 per family member.
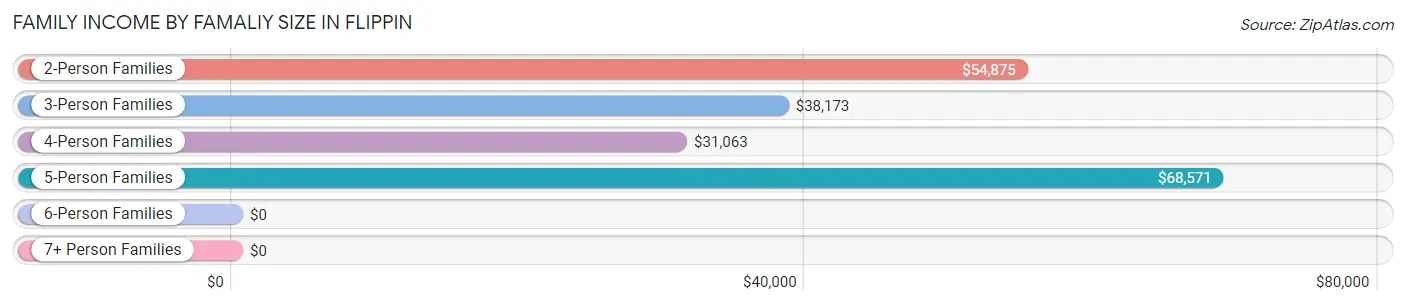
| Income Bracket | # Families | Median Income |
| 2-Person Families | 150 (44.8%) | $54,875 |
| 3-Person Families | 47 (14.0%) | $38,173 |
| 4-Person Families | 101 (30.1%) | $31,063 |
| 5-Person Families | 26 (7.8%) | $68,571 |
| 6-Person Families | 11 (3.3%) | $0 |
| 7+ Person Families | 0 (0.0%) | $0 |
| Total | 335 (100.0%) | $48,125 |
Family Income by Number of Earners in Flippin
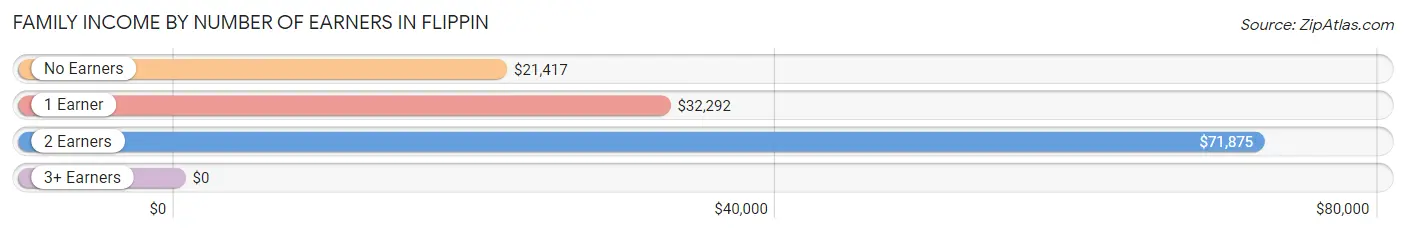
| Number of Earners | # Families | Median Income |
| No Earners | 53 (15.8%) | $21,417 |
| 1 Earner | 136 (40.6%) | $32,292 |
| 2 Earners | 140 (41.8%) | $71,875 |
| 3+ Earners | 6 (1.8%) | $0 |
| Total | 335 (100.0%) | $48,125 |
Household Income in Flippin
Household Income Brackets in Flippin
With 123 households falling in the category, the $50,000 to $74,999 income range is the most frequent in Flippin, accounting for 22.8% of all households.
| Income Bracket | # Households | % Households |
| Less than $10,000 | 61 | 11.3% |
| $10,000 to $14,999 | 19 | 3.5% |
| $15,000 to $24,999 | 104 | 19.3% |
| $25,000 to $34,999 | 67 | 12.4% |
| $35,000 to $49,999 | 75 | 13.9% |
| $50,000 to $74,999 | 123 | 22.8% |
| $75,000 to $99,999 | 54 | 10.0% |
| $100,000 to $149,999 | 34 | 6.3% |
| $150,000 to $199,999 | 0 | 0.0% |
| $200,000+ | 2 | 0.4% |
Household Income by Householder Age in Flippin
The median household income in Flippin is $38,686, with the highest median household income of $44,792 found in the 45 to 64 years age bracket for the primary householder. A total of 165 households (30.6%) fall into this category. Meanwhile, the 15 to 24 years age bracket for the primary householder has the lowest median household income of $0, with 25 households (4.6%) in this group.
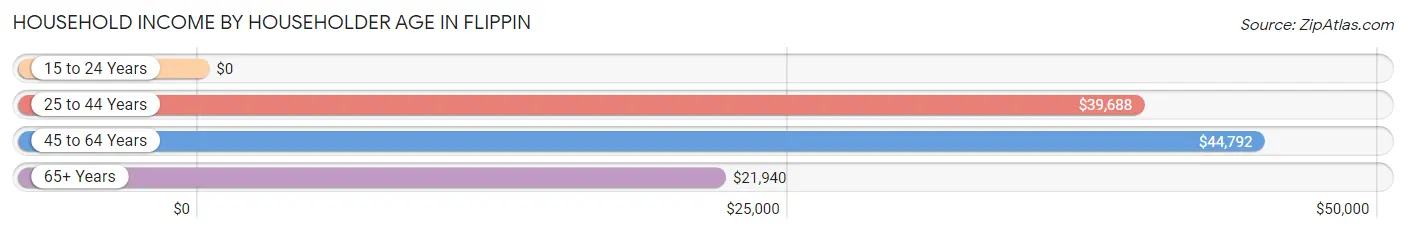
| Income Bracket | # Households | Median Income |
| 15 to 24 Years | 25 (4.6%) | $0 |
| 25 to 44 Years | 182 (33.8%) | $39,688 |
| 45 to 64 Years | 165 (30.6%) | $44,792 |
| 65+ Years | 167 (31.0%) | $21,940 |
| Total | 539 (100.0%) | $38,686 |
Poverty in Flippin
Income Below Poverty by Sex and Age in Flippin
With 11.7% poverty level for males and 29.2% for females among the residents of Flippin, 5 year old males and 5 year old females are the most vulnerable to poverty, with 10 males (55.6%) and 13 females (100.0%) in their respective age groups living below the poverty level.
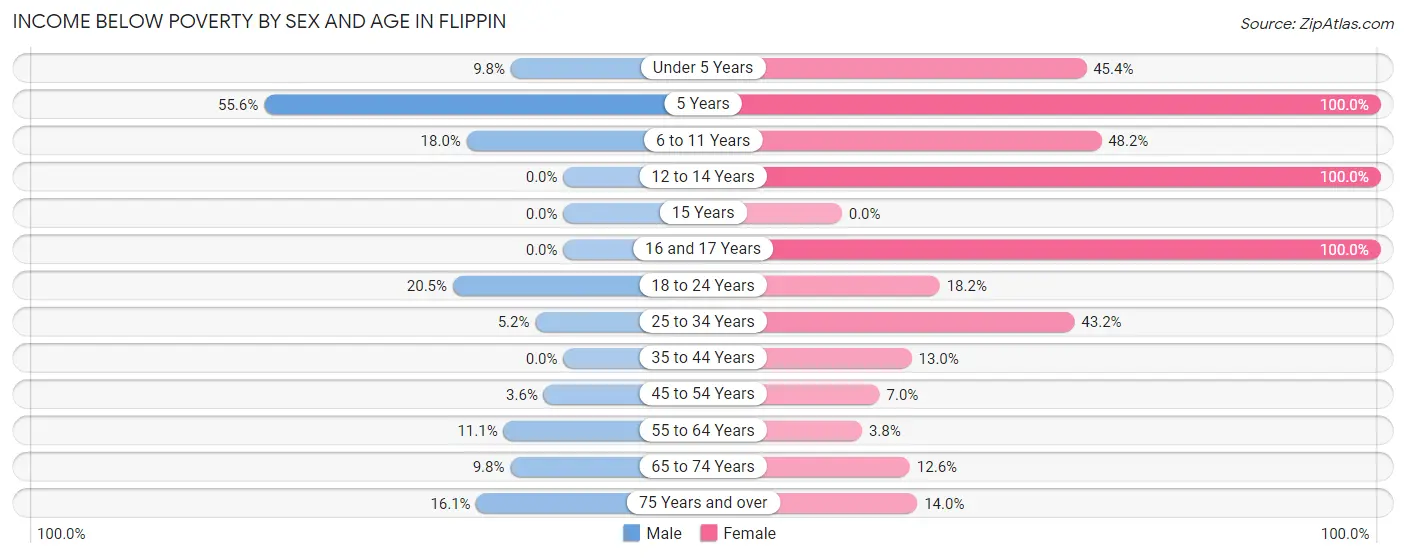
| Age Bracket | Male | Female |
| Under 5 Years | 4 (9.8%) | 49 (45.4%) |
| 5 Years | 10 (55.6%) | 13 (100.0%) |
| 6 to 11 Years | 14 (17.9%) | 39 (48.1%) |
| 12 to 14 Years | 0 (0.0%) | 11 (100.0%) |
| 15 Years | 0 (0.0%) | 0 (0.0%) |
| 16 and 17 Years | 0 (0.0%) | 9 (100.0%) |
| 18 to 24 Years | 16 (20.5%) | 10 (18.2%) |
| 25 to 34 Years | 5 (5.2%) | 57 (43.2%) |
| 35 to 44 Years | 0 (0.0%) | 7 (13.0%) |
| 45 to 54 Years | 2 (3.6%) | 4 (7.0%) |
| 55 to 64 Years | 9 (11.1%) | 3 (3.7%) |
| 65 to 74 Years | 6 (9.8%) | 11 (12.6%) |
| 75 Years and over | 5 (16.1%) | 7 (14.0%) |
| Total | 71 (11.7%) | 220 (29.2%) |
Income Above Poverty by Sex and Age in Flippin
According to the poverty statistics in Flippin, males aged 12 to 14 years and females aged 15 years are the age groups that are most secure financially, with 100.0% of males and 100.0% of females in these age groups living above the poverty line.
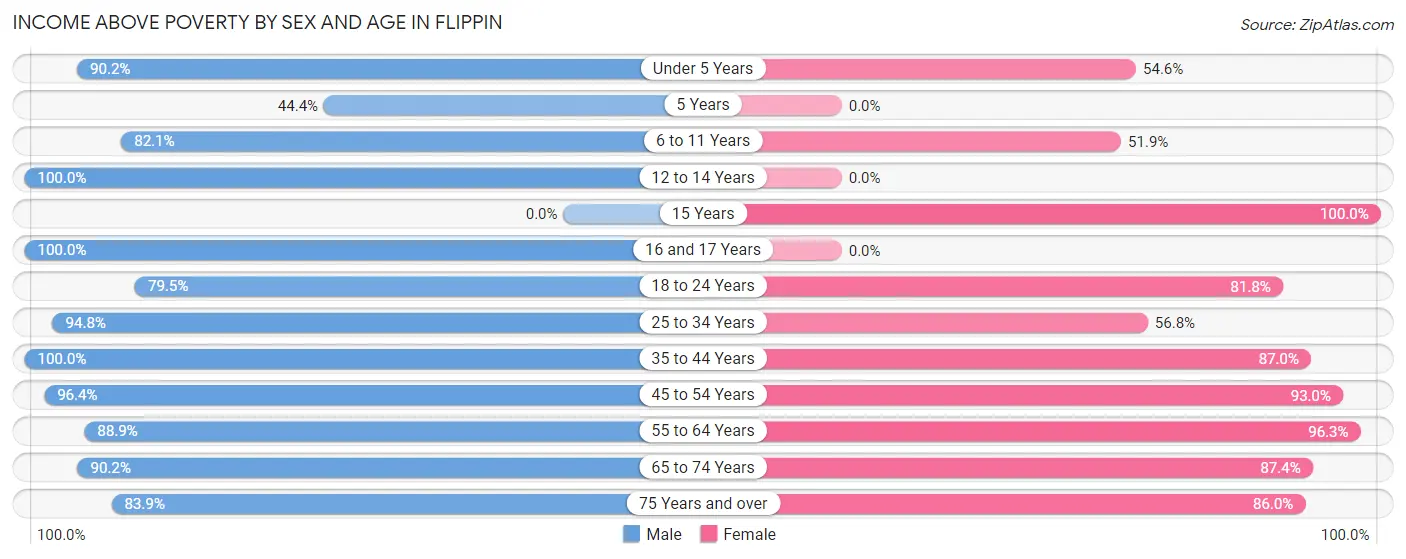
| Age Bracket | Male | Female |
| Under 5 Years | 37 (90.2%) | 59 (54.6%) |
| 5 Years | 8 (44.4%) | 0 (0.0%) |
| 6 to 11 Years | 64 (82.1%) | 42 (51.8%) |
| 12 to 14 Years | 25 (100.0%) | 0 (0.0%) |
| 15 Years | 0 (0.0%) | 16 (100.0%) |
| 16 and 17 Years | 5 (100.0%) | 0 (0.0%) |
| 18 to 24 Years | 62 (79.5%) | 45 (81.8%) |
| 25 to 34 Years | 91 (94.8%) | 75 (56.8%) |
| 35 to 44 Years | 38 (100.0%) | 47 (87.0%) |
| 45 to 54 Years | 53 (96.4%) | 53 (93.0%) |
| 55 to 64 Years | 72 (88.9%) | 77 (96.3%) |
| 65 to 74 Years | 55 (90.2%) | 76 (87.4%) |
| 75 Years and over | 26 (83.9%) | 43 (86.0%) |
| Total | 536 (88.3%) | 533 (70.8%) |
Income Below Poverty Among Married-Couple Families in Flippin
The poverty statistics for married-couple families in Flippin show that 3.8% or 8 of the total 210 families live below the poverty line. Families with 1 or 2 children have the highest poverty rate of 10.4%, comprising of 5 families. On the other hand, families with 3 or 4 children have the lowest poverty rate of 0.0%, which includes 0 families.
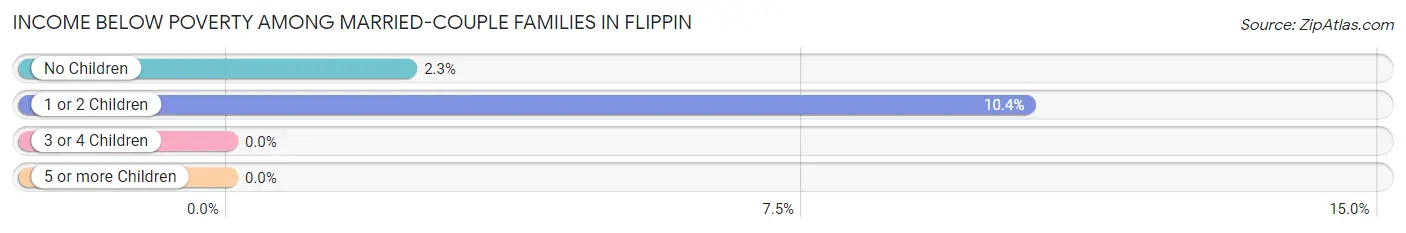
| Children | Above Poverty | Below Poverty |
| No Children | 125 (97.7%) | 3 (2.3%) |
| 1 or 2 Children | 43 (89.6%) | 5 (10.4%) |
| 3 or 4 Children | 34 (100.0%) | 0 (0.0%) |
| 5 or more Children | 0 (0.0%) | 0 (0.0%) |
| Total | 202 (96.2%) | 8 (3.8%) |
Income Below Poverty Among Single-Parent Households in Flippin
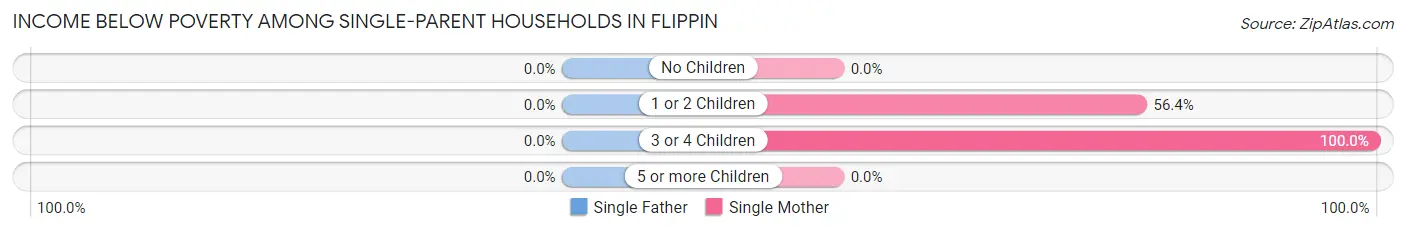
| Children | Single Father | Single Mother |
| No Children | 0 (0.0%) | 0 (0.0%) |
| 1 or 2 Children | 0 (0.0%) | 22 (56.4%) |
| 3 or 4 Children | 0 (0.0%) | 35 (100.0%) |
| 5 or more Children | 0 (0.0%) | 0 (0.0%) |
| Total | 0 (0.0%) | 57 (57.0%) |
Income Below Poverty Among Married-Couple vs Single-Parent Households in Flippin
The poverty data for Flippin shows that 8 of the married-couple family households (3.8%) and 57 of the single-parent households (45.6%) are living below the poverty level. Within the married-couple family households, those with 1 or 2 children have the highest poverty rate, with 5 households (10.4%) falling below the poverty line. Among the single-parent households, those with 3 or 4 children have the highest poverty rate, with 35 household (100.0%) living below poverty.
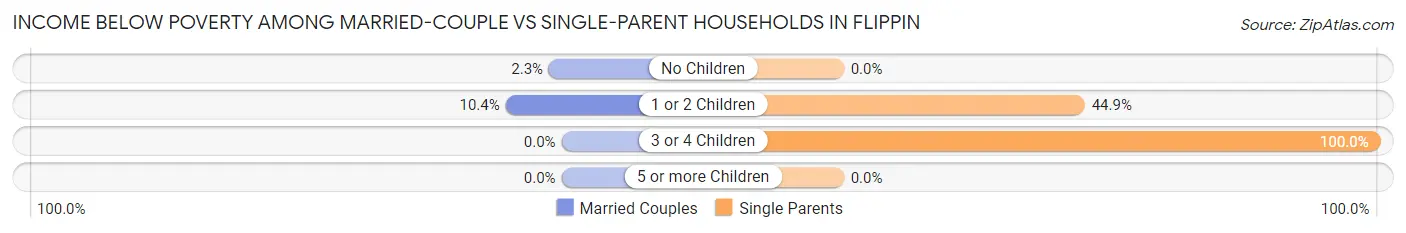
| Children | Married-Couple Families | Single-Parent Households |
| No Children | 3 (2.3%) | 0 (0.0%) |
| 1 or 2 Children | 5 (10.4%) | 22 (44.9%) |
| 3 or 4 Children | 0 (0.0%) | 35 (100.0%) |
| 5 or more Children | 0 (0.0%) | 0 (0.0%) |
| Total | 8 (3.8%) | 57 (45.6%) |
Employment Characteristics in Flippin
Employment by Class of Employer in Flippin
Among the 512 employed individuals in Flippin, private company employees (426 | 83.2%), self-employed (not incorporated) (42 | 8.2%), and self-employed (incorporated) (16 | 3.1%) make up the most common classes of employment.
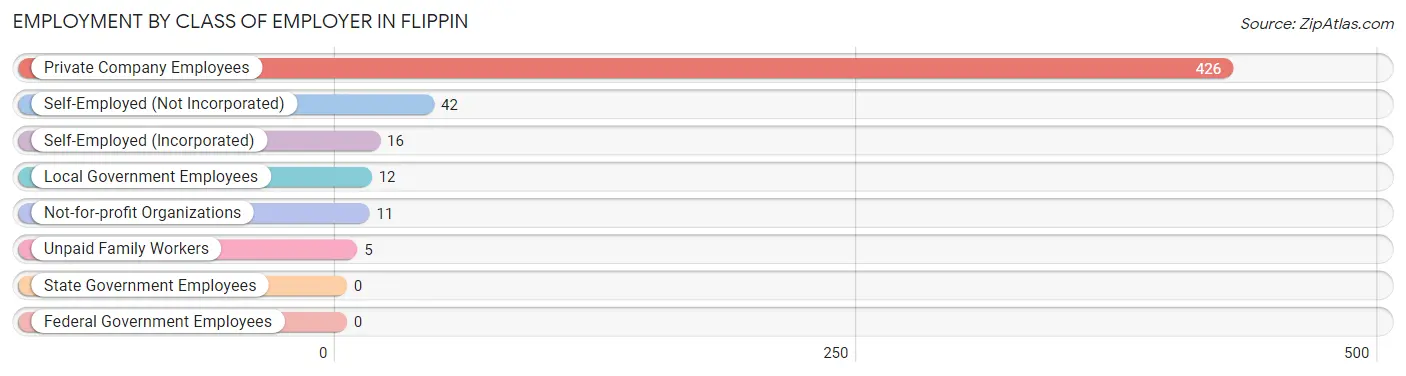
| Employer Class | # Employees | % Employees |
| Private Company Employees | 426 | 83.2% |
| Self-Employed (Incorporated) | 16 | 3.1% |
| Self-Employed (Not Incorporated) | 42 | 8.2% |
| Not-for-profit Organizations | 11 | 2.1% |
| Local Government Employees | 12 | 2.3% |
| State Government Employees | 0 | 0.0% |
| Federal Government Employees | 0 | 0.0% |
| Unpaid Family Workers | 5 | 1.0% |
| Total | 512 | 100.0% |
Employment Status by Age in Flippin
According to the labor force statistics for Flippin, out of the total population over 16 years of age (969), 58.3% or 565 individuals are in the labor force, with 9.4% or 53 of them unemployed. The age group with the highest labor force participation rate is 30 to 34 years, with 90.3% or 93 individuals in the labor force. Within the labor force, the 16 to 19 years age range has the highest percentage of unemployed individuals, with 80.0% or 32 of them being unemployed.
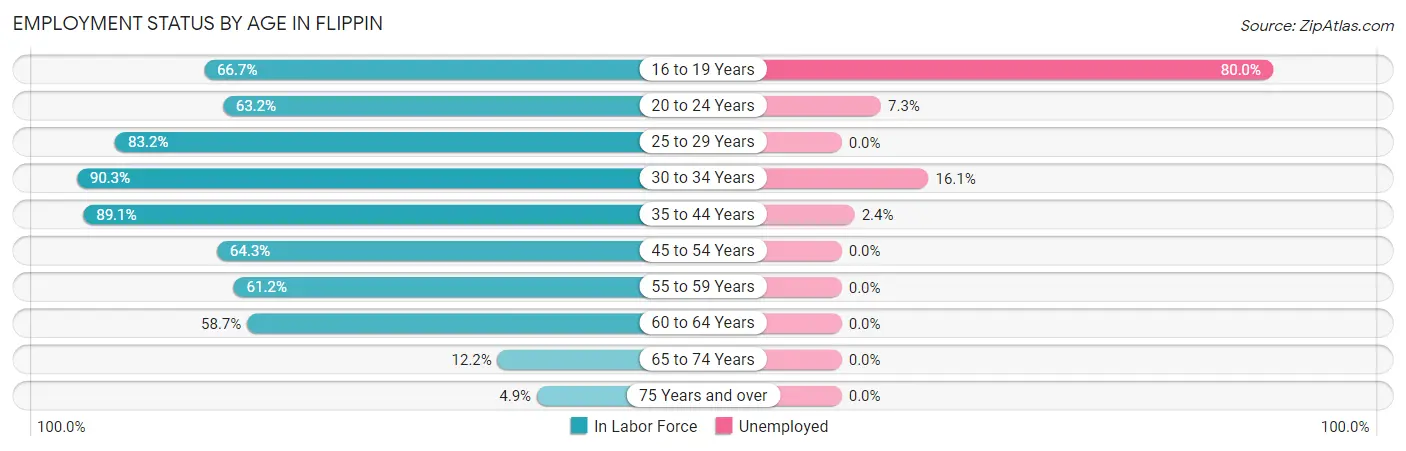
| Age Bracket | In Labor Force | Unemployed |
| 16 to 19 Years | 40 (66.7%) | 32 (80.0%) |
| 20 to 24 Years | 55 (63.2%) | 4 (7.3%) |
| 25 to 29 Years | 104 (83.2%) | 0 (0.0%) |
| 30 to 34 Years | 93 (90.3%) | 15 (16.1%) |
| 35 to 44 Years | 82 (89.1%) | 2 (2.4%) |
| 45 to 54 Years | 72 (64.3%) | 0 (0.0%) |
| 55 to 59 Years | 60 (61.2%) | 0 (0.0%) |
| 60 to 64 Years | 37 (58.7%) | 0 (0.0%) |
| 65 to 74 Years | 18 (12.2%) | 0 (0.0%) |
| 75 Years and over | 4 (4.9%) | 0 (0.0%) |
| Total | 565 (58.3%) | 53 (9.4%) |
Employment Status by Educational Attainment in Flippin
According to labor force statistics for Flippin, 75.5% of individuals (448) out of the total population between 25 and 64 years of age (593) are in the labor force, with 3.8% or 17 of them being unemployed. The group with the highest labor force participation rate are those with the educational attainment of bachelor's degree or higher, with 82.9% or 29 individuals in the labor force. Within the labor force, individuals with college / associate degree education have the highest percentage of unemployment, with 9.8% or 17 of them being unemployed.
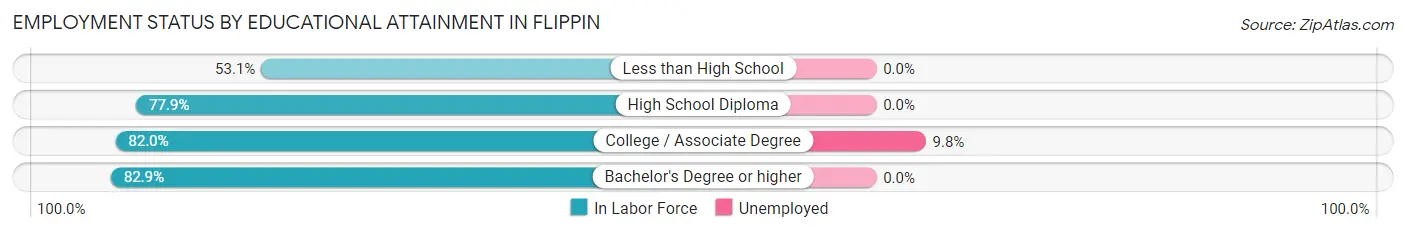
| Educational Attainment | In Labor Force | Unemployed |
| Less than High School | 52 (53.1%) | 0 (0.0%) |
| High School Diploma | 194 (77.9%) | 0 (0.0%) |
| College / Associate Degree | 173 (82.0%) | 21 (9.8%) |
| Bachelor's Degree or higher | 29 (82.9%) | 0 (0.0%) |
| Total | 448 (75.5%) | 23 (3.8%) |
Employment Occupations by Sex in Flippin
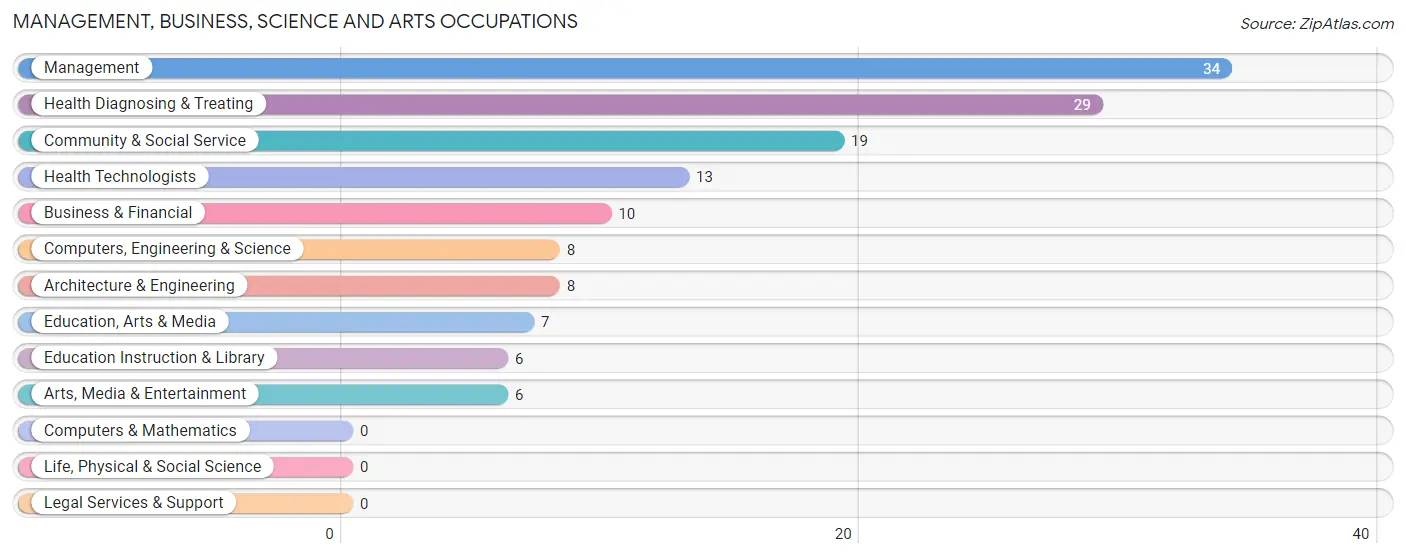
Management, Business, Science and Arts Occupations
The most common Management, Business, Science and Arts occupations in Flippin are Management (34 | 6.6%), Health Diagnosing & Treating (29 | 5.7%), Community & Social Service (19 | 3.7%), Health Technologists (13 | 2.5%), and Business & Financial (10 | 1.9%).
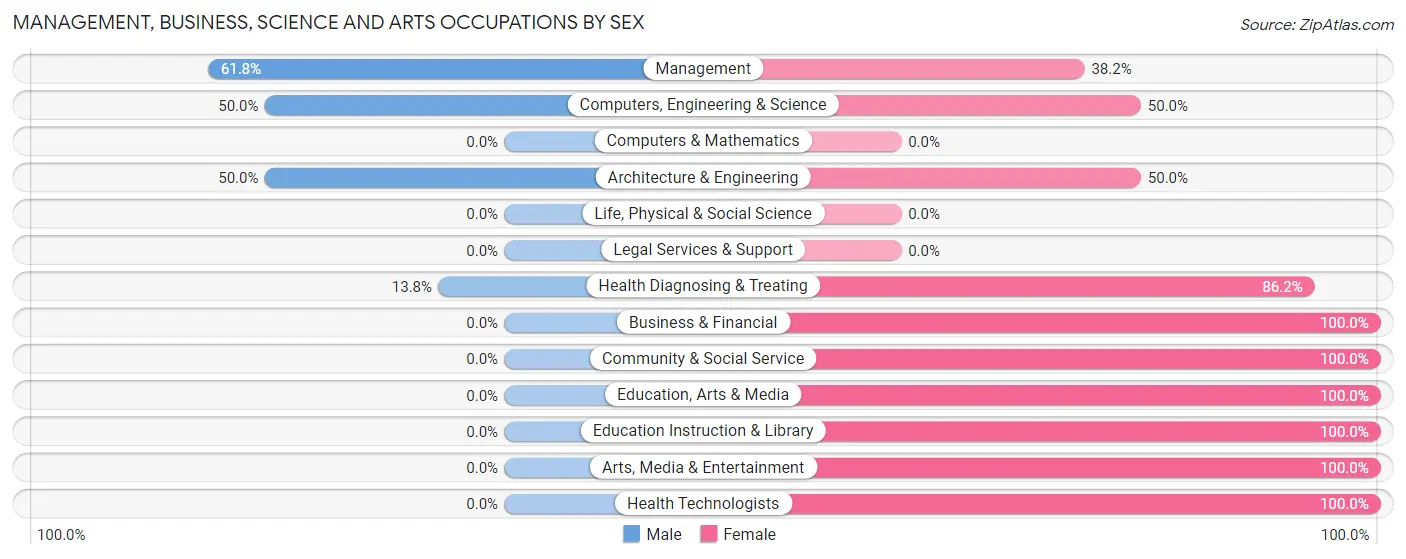
Management, Business, Science and Arts Occupations by Sex
Within the Management, Business, Science and Arts occupations in Flippin, the most male-oriented occupations are Management (61.8%), Computers, Engineering & Science (50.0%), and Architecture & Engineering (50.0%), while the most female-oriented occupations are Business & Financial (100.0%), Community & Social Service (100.0%), and Education, Arts & Media (100.0%).
| Occupation | Male | Female |
| Management | 21 (61.8%) | 13 (38.2%) |
| Business & Financial | 0 (0.0%) | 10 (100.0%) |
| Computers, Engineering & Science | 4 (50.0%) | 4 (50.0%) |
| Computers & Mathematics | 0 (0.0%) | 0 (0.0%) |
| Architecture & Engineering | 4 (50.0%) | 4 (50.0%) |
| Life, Physical & Social Science | 0 (0.0%) | 0 (0.0%) |
| Community & Social Service | 0 (0.0%) | 19 (100.0%) |
| Education, Arts & Media | 0 (0.0%) | 7 (100.0%) |
| Legal Services & Support | 0 (0.0%) | 0 (0.0%) |
| Education Instruction & Library | 0 (0.0%) | 6 (100.0%) |
| Arts, Media & Entertainment | 0 (0.0%) | 6 (100.0%) |
| Health Diagnosing & Treating | 4 (13.8%) | 25 (86.2%) |
| Health Technologists | 0 (0.0%) | 13 (100.0%) |
| Total (Category) | 29 (29.0%) | 71 (71.0%) |
| Total (Overall) | 264 (51.6%) | 248 (48.4%) |
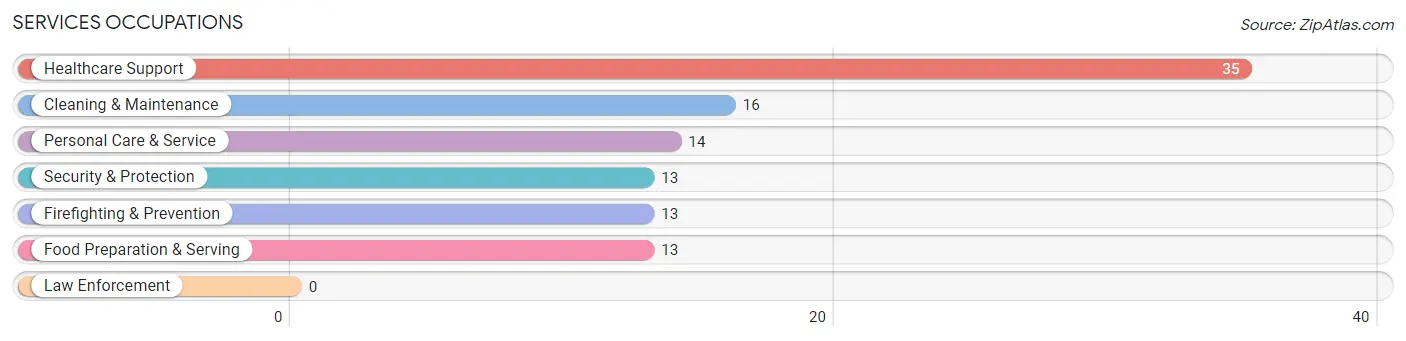
Services Occupations
The most common Services occupations in Flippin are Healthcare Support (35 | 6.8%), Cleaning & Maintenance (16 | 3.1%), Personal Care & Service (14 | 2.7%), Security & Protection (13 | 2.5%), and Firefighting & Prevention (13 | 2.5%).
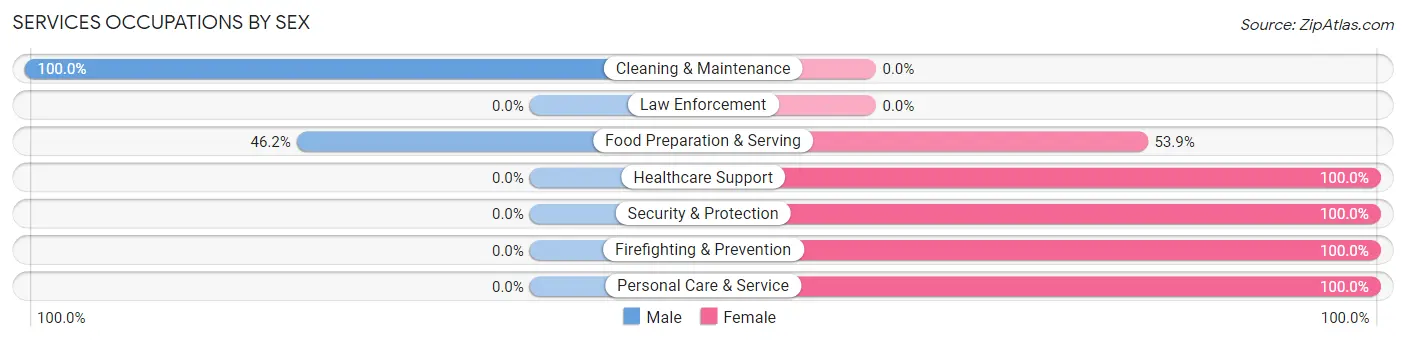
Services Occupations by Sex
Within the Services occupations in Flippin, the most male-oriented occupations are Cleaning & Maintenance (100.0%), and Food Preparation & Serving (46.2%), while the most female-oriented occupations are Healthcare Support (100.0%), Security & Protection (100.0%), and Firefighting & Prevention (100.0%).
| Occupation | Male | Female |
| Healthcare Support | 0 (0.0%) | 35 (100.0%) |
| Security & Protection | 0 (0.0%) | 13 (100.0%) |
| Firefighting & Prevention | 0 (0.0%) | 13 (100.0%) |
| Law Enforcement | 0 (0.0%) | 0 (0.0%) |
| Food Preparation & Serving | 6 (46.2%) | 7 (53.8%) |
| Cleaning & Maintenance | 16 (100.0%) | 0 (0.0%) |
| Personal Care & Service | 0 (0.0%) | 14 (100.0%) |
| Total (Category) | 22 (24.2%) | 69 (75.8%) |
| Total (Overall) | 264 (51.6%) | 248 (48.4%) |
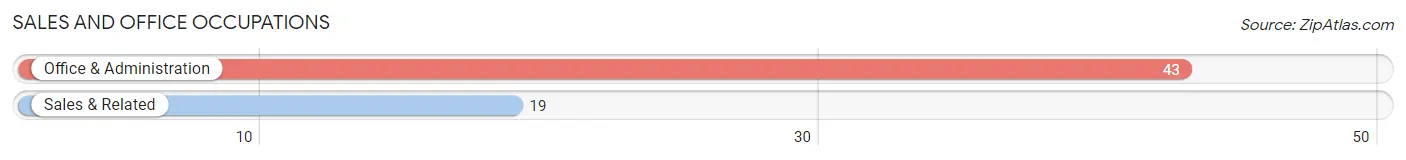
Sales and Office Occupations
The most common Sales and Office occupations in Flippin are Office & Administration (43 | 8.4%), and Sales & Related (19 | 3.7%).
Sales and Office Occupations by Sex
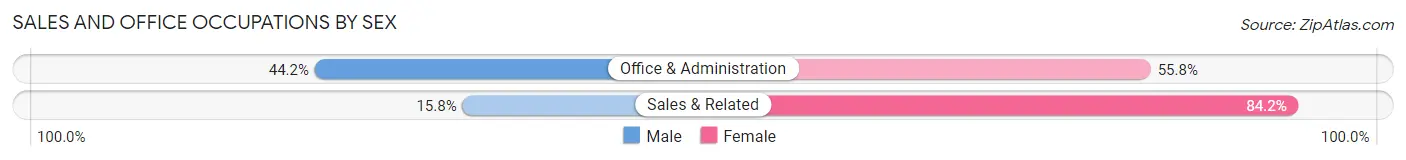
| Occupation | Male | Female |
| Sales & Related | 3 (15.8%) | 16 (84.2%) |
| Office & Administration | 19 (44.2%) | 24 (55.8%) |
| Total (Category) | 22 (35.5%) | 40 (64.5%) |
| Total (Overall) | 264 (51.6%) | 248 (48.4%) |
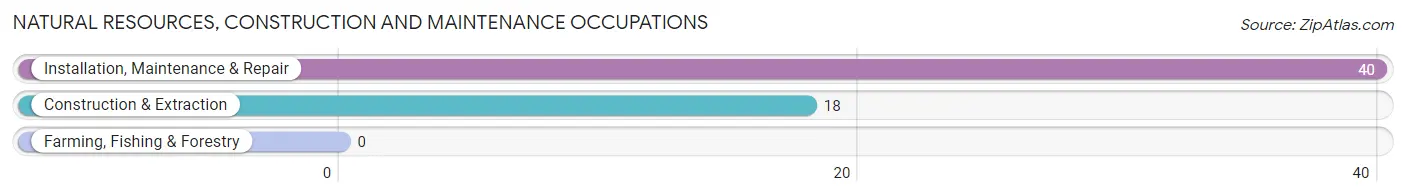
Natural Resources, Construction and Maintenance Occupations
The most common Natural Resources, Construction and Maintenance occupations in Flippin are Installation, Maintenance & Repair (40 | 7.8%), and Construction & Extraction (18 | 3.5%).
Natural Resources, Construction and Maintenance Occupations by Sex
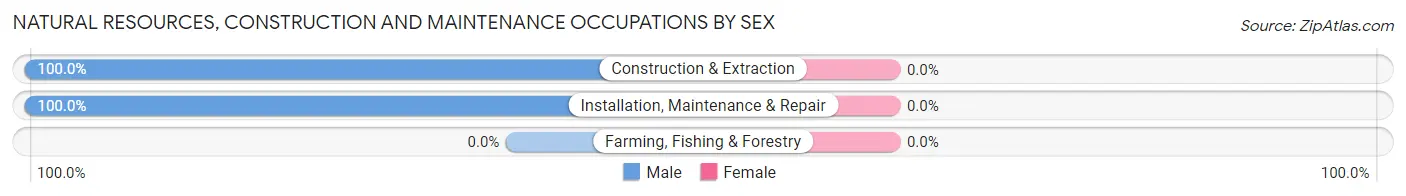
| Occupation | Male | Female |
| Farming, Fishing & Forestry | 0 (0.0%) | 0 (0.0%) |
| Construction & Extraction | 18 (100.0%) | 0 (0.0%) |
| Installation, Maintenance & Repair | 40 (100.0%) | 0 (0.0%) |
| Total (Category) | 58 (100.0%) | 0 (0.0%) |
| Total (Overall) | 264 (51.6%) | 248 (48.4%) |
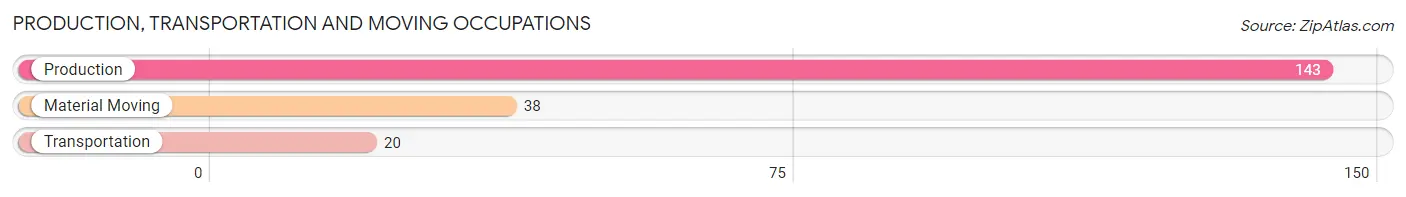
Production, Transportation and Moving Occupations
The most common Production, Transportation and Moving occupations in Flippin are Production (143 | 27.9%), Material Moving (38 | 7.4%), and Transportation (20 | 3.9%).
Production, Transportation and Moving Occupations by Sex
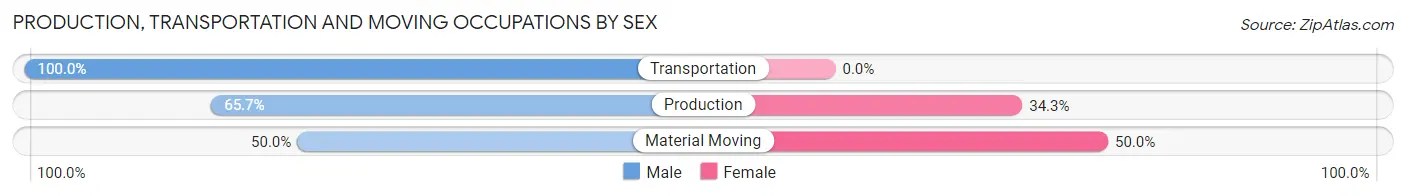
| Occupation | Male | Female |
| Production | 94 (65.7%) | 49 (34.3%) |
| Transportation | 20 (100.0%) | 0 (0.0%) |
| Material Moving | 19 (50.0%) | 19 (50.0%) |
| Total (Category) | 133 (66.2%) | 68 (33.8%) |
| Total (Overall) | 264 (51.6%) | 248 (48.4%) |
Employment Industries by Sex in Flippin
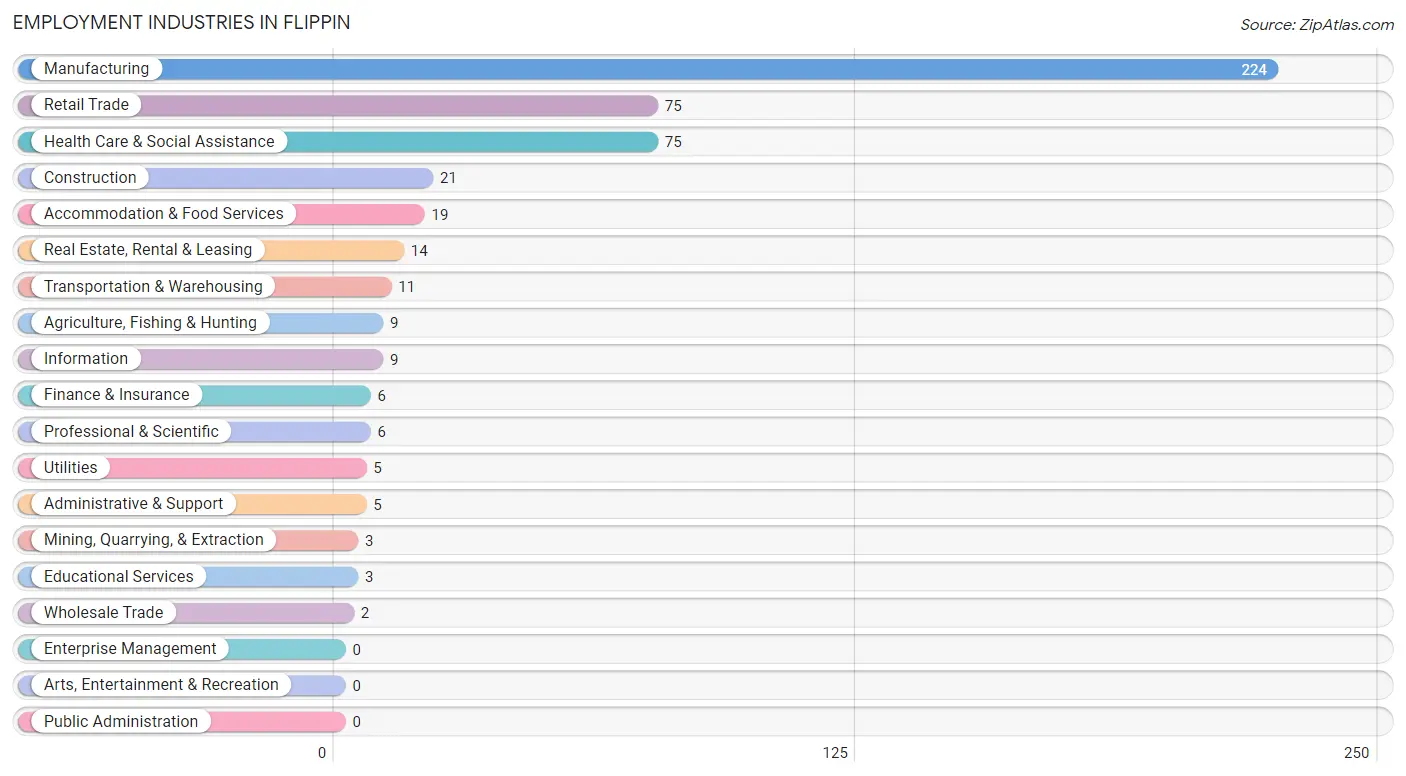
Employment Industries in Flippin
The major employment industries in Flippin include Manufacturing (224 | 43.8%), Retail Trade (75 | 14.6%), Health Care & Social Assistance (75 | 14.6%), Construction (21 | 4.1%), and Accommodation & Food Services (19 | 3.7%).
Employment Industries by Sex in Flippin
The Flippin industries that see more men than women are Agriculture, Fishing & Hunting (100.0%), Mining, Quarrying, & Extraction (100.0%), and Utilities (100.0%), whereas the industries that tend to have a higher number of women are Wholesale Trade (100.0%), Professional & Scientific (100.0%), and Educational Services (100.0%).
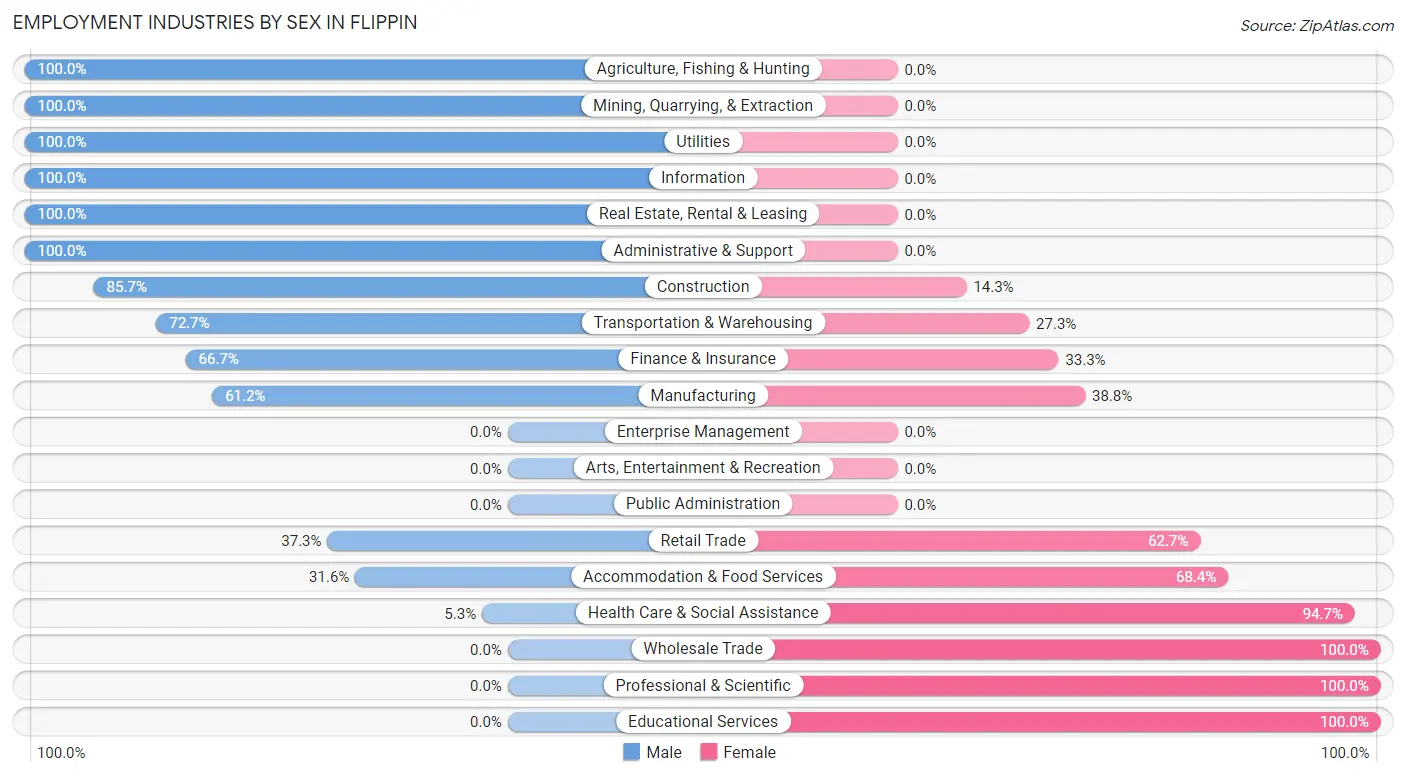
| Industry | Male | Female |
| Agriculture, Fishing & Hunting | 9 (100.0%) | 0 (0.0%) |
| Mining, Quarrying, & Extraction | 3 (100.0%) | 0 (0.0%) |
| Construction | 18 (85.7%) | 3 (14.3%) |
| Manufacturing | 137 (61.2%) | 87 (38.8%) |
| Wholesale Trade | 0 (0.0%) | 2 (100.0%) |
| Retail Trade | 28 (37.3%) | 47 (62.7%) |
| Transportation & Warehousing | 8 (72.7%) | 3 (27.3%) |
| Utilities | 5 (100.0%) | 0 (0.0%) |
| Information | 9 (100.0%) | 0 (0.0%) |
| Finance & Insurance | 4 (66.7%) | 2 (33.3%) |
| Real Estate, Rental & Leasing | 14 (100.0%) | 0 (0.0%) |
| Professional & Scientific | 0 (0.0%) | 6 (100.0%) |
| Enterprise Management | 0 (0.0%) | 0 (0.0%) |
| Administrative & Support | 5 (100.0%) | 0 (0.0%) |
| Educational Services | 0 (0.0%) | 3 (100.0%) |
| Health Care & Social Assistance | 4 (5.3%) | 71 (94.7%) |
| Arts, Entertainment & Recreation | 0 (0.0%) | 0 (0.0%) |
| Accommodation & Food Services | 6 (31.6%) | 13 (68.4%) |
| Public Administration | 0 (0.0%) | 0 (0.0%) |
| Total | 264 (51.6%) | 248 (48.4%) |
Education in Flippin
School Enrollment in Flippin
The most common levels of schooling among the 304 students in Flippin are elementary school (137 | 45.1%), high school (63 | 20.7%), and middle school (57 | 18.8%).
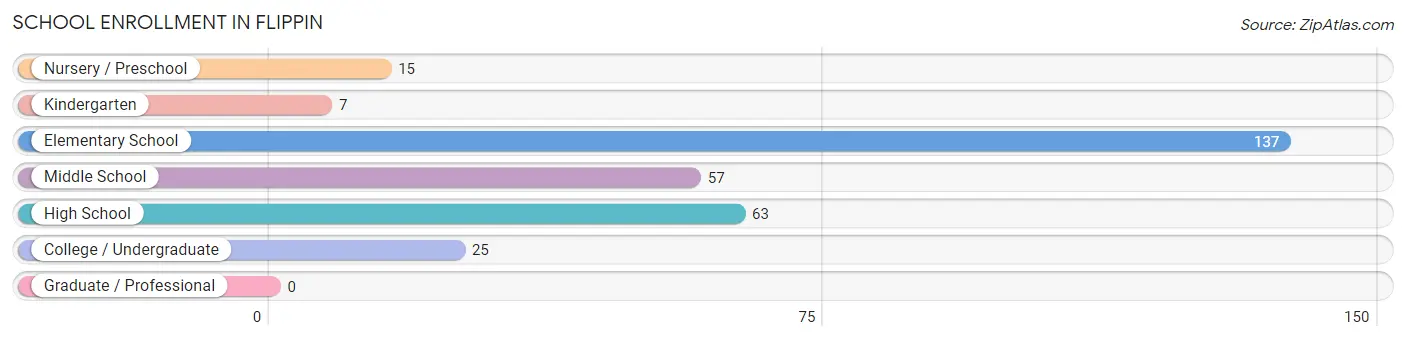
| School Level | # Students | % Students |
| Nursery / Preschool | 15 | 4.9% |
| Kindergarten | 7 | 2.3% |
| Elementary School | 137 | 45.1% |
| Middle School | 57 | 18.8% |
| High School | 63 | 20.7% |
| College / Undergraduate | 25 | 8.2% |
| Graduate / Professional | 0 | 0.0% |
| Total | 304 | 100.0% |
School Enrollment by Age by Funding Source in Flippin
Out of a total of 304 students who are enrolled in schools in Flippin, 15 (4.9%) attend a private institution, while the remaining 289 (95.1%) are enrolled in public schools. The age group of 10 to 14 year olds has the highest likelihood of being enrolled in private schools, with 6 (10.5% in the age bracket) enrolled. Conversely, the age group of 3 to 4 year olds has the lowest likelihood of being enrolled in a private school, with 12 (100.0% in the age bracket) attending a public institution.
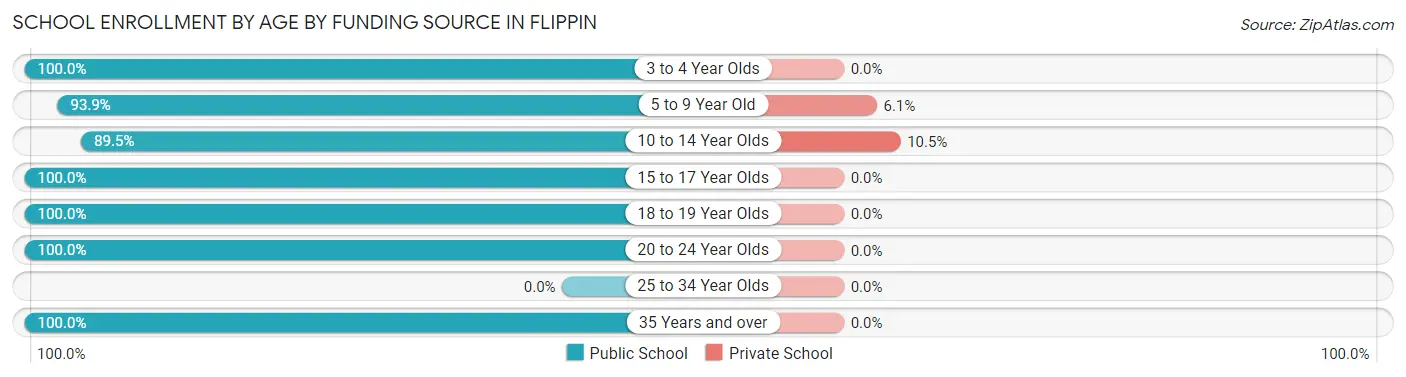
| Age Bracket | Public School | Private School |
| 3 to 4 Year Olds | 12 (100.0%) | 0 (0.0%) |
| 5 to 9 Year Old | 138 (93.9%) | 9 (6.1%) |
| 10 to 14 Year Olds | 51 (89.5%) | 6 (10.5%) |
| 15 to 17 Year Olds | 30 (100.0%) | 0 (0.0%) |
| 18 to 19 Year Olds | 33 (100.0%) | 0 (0.0%) |
| 20 to 24 Year Olds | 21 (100.0%) | 0 (0.0%) |
| 25 to 34 Year Olds | 0 (0.0%) | 0 (0.0%) |
| 35 Years and over | 4 (100.0%) | 0 (0.0%) |
| Total | 289 (95.1%) | 15 (4.9%) |
Educational Attainment by Field of Study in Flippin
Business (14 | 22.2%), physical & health sciences (11 | 17.5%), social sciences (11 | 17.5%), education (8 | 12.7%), and psychology (7 | 11.1%) are the most common fields of study among 63 individuals in Flippin who have obtained a bachelor's degree or higher.
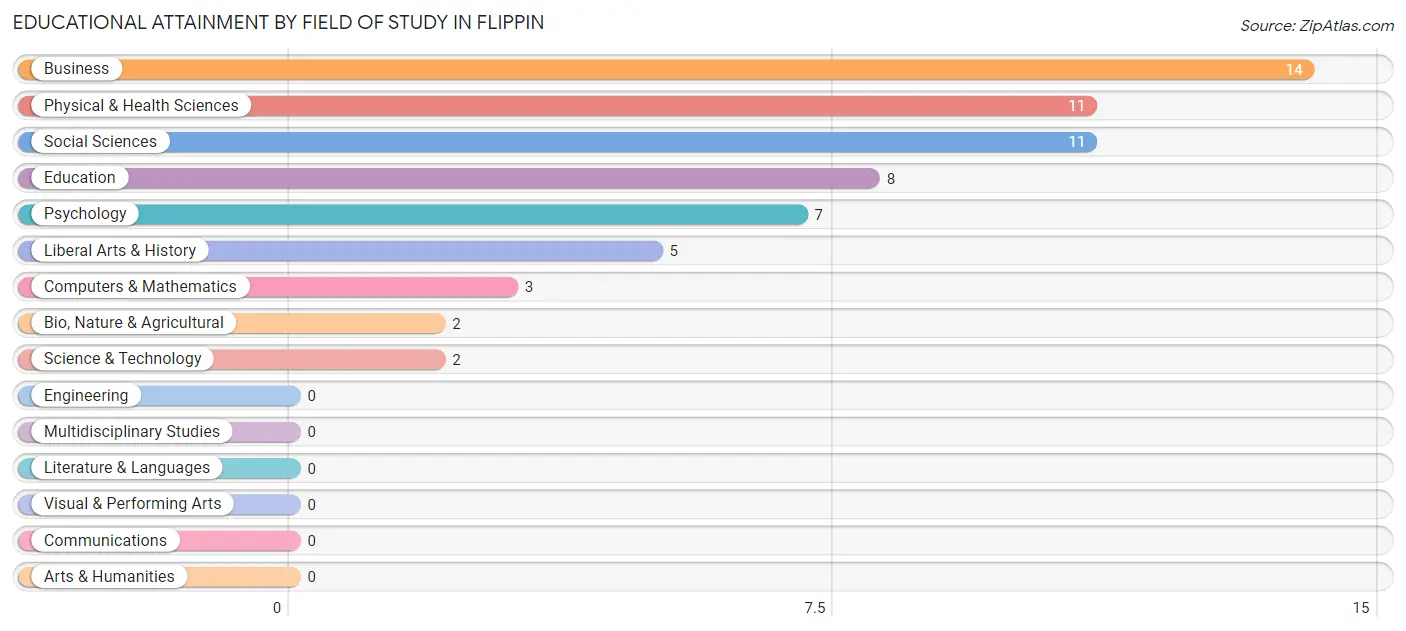
| Field of Study | # Graduates | % Graduates |
| Computers & Mathematics | 3 | 4.8% |
| Bio, Nature & Agricultural | 2 | 3.2% |
| Physical & Health Sciences | 11 | 17.5% |
| Psychology | 7 | 11.1% |
| Social Sciences | 11 | 17.5% |
| Engineering | 0 | 0.0% |
| Multidisciplinary Studies | 0 | 0.0% |
| Science & Technology | 2 | 3.2% |
| Business | 14 | 22.2% |
| Education | 8 | 12.7% |
| Literature & Languages | 0 | 0.0% |
| Liberal Arts & History | 5 | 7.9% |
| Visual & Performing Arts | 0 | 0.0% |
| Communications | 0 | 0.0% |
| Arts & Humanities | 0 | 0.0% |
| Total | 63 | 100.0% |
Transportation & Commute in Flippin
Vehicle Availability by Sex in Flippin
The most prevalent vehicle ownership categories in Flippin are males with 2 vehicles (157, accounting for 59.5%) and females with 2 vehicles (146, making up 63.3%).
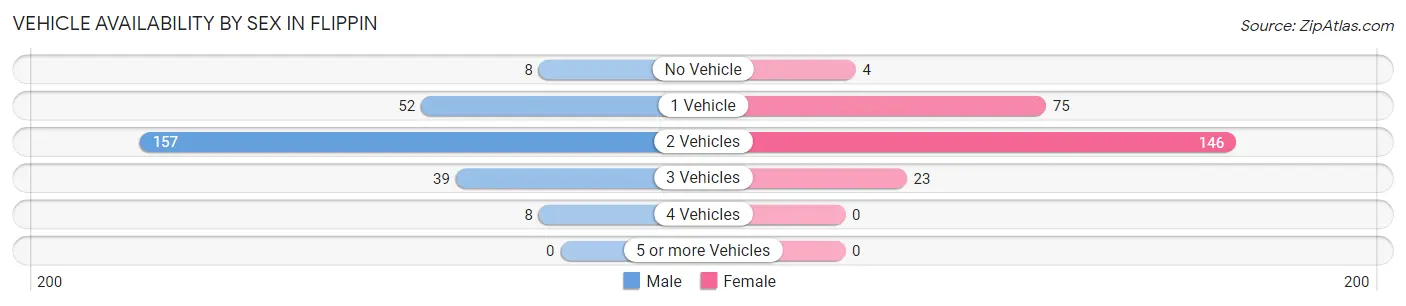
| Vehicles Available | Male | Female |
| No Vehicle | 8 (3.0%) | 4 (1.6%) |
| 1 Vehicle | 52 (19.7%) | 75 (30.2%) |
| 2 Vehicles | 157 (59.5%) | 146 (58.9%) |
| 3 Vehicles | 39 (14.8%) | 23 (9.3%) |
| 4 Vehicles | 8 (3.0%) | 0 (0.0%) |
| 5 or more Vehicles | 0 (0.0%) | 0 (0.0%) |
| Total | 264 (100.0%) | 248 (100.0%) |
Commute Time in Flippin
The most frequently occuring commute durations in Flippin are 5 to 9 minutes (154 commuters, 30.9%), less than 5 minutes (110 commuters, 22.1%), and 10 to 14 minutes (80 commuters, 16.1%).
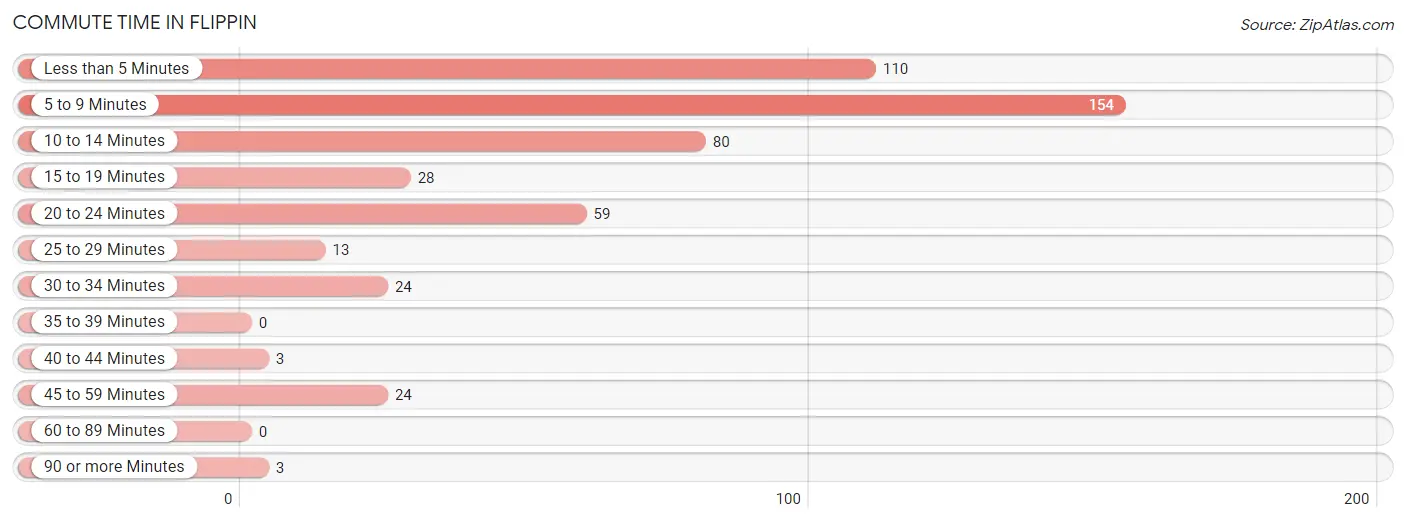
| Commute Time | # Commuters | % Commuters |
| Less than 5 Minutes | 110 | 22.1% |
| 5 to 9 Minutes | 154 | 30.9% |
| 10 to 14 Minutes | 80 | 16.1% |
| 15 to 19 Minutes | 28 | 5.6% |
| 20 to 24 Minutes | 59 | 11.8% |
| 25 to 29 Minutes | 13 | 2.6% |
| 30 to 34 Minutes | 24 | 4.8% |
| 35 to 39 Minutes | 0 | 0.0% |
| 40 to 44 Minutes | 3 | 0.6% |
| 45 to 59 Minutes | 24 | 4.8% |
| 60 to 89 Minutes | 0 | 0.0% |
| 90 or more Minutes | 3 | 0.6% |
Commute Time by Sex in Flippin
The most common commute times in Flippin are 5 to 9 minutes (78 commuters, 30.8%) for males and 5 to 9 minutes (76 commuters, 31.0%) for females.
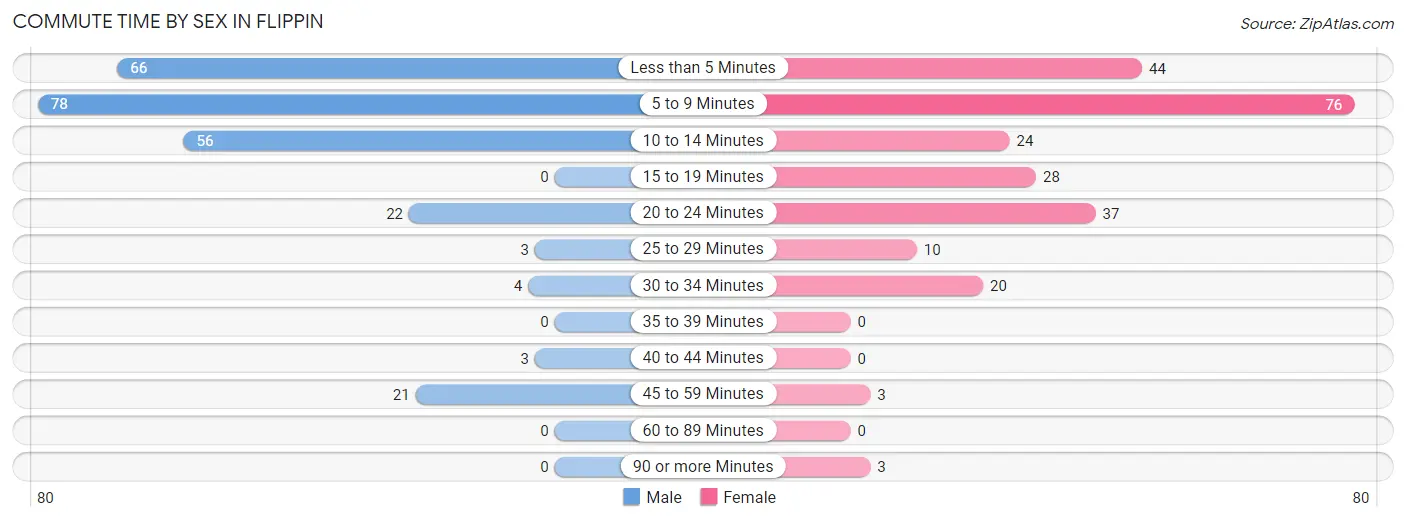
| Commute Time | Male | Female |
| Less than 5 Minutes | 66 (26.1%) | 44 (18.0%) |
| 5 to 9 Minutes | 78 (30.8%) | 76 (31.0%) |
| 10 to 14 Minutes | 56 (22.1%) | 24 (9.8%) |
| 15 to 19 Minutes | 0 (0.0%) | 28 (11.4%) |
| 20 to 24 Minutes | 22 (8.7%) | 37 (15.1%) |
| 25 to 29 Minutes | 3 (1.2%) | 10 (4.1%) |
| 30 to 34 Minutes | 4 (1.6%) | 20 (8.2%) |
| 35 to 39 Minutes | 0 (0.0%) | 0 (0.0%) |
| 40 to 44 Minutes | 3 (1.2%) | 0 (0.0%) |
| 45 to 59 Minutes | 21 (8.3%) | 3 (1.2%) |
| 60 to 89 Minutes | 0 (0.0%) | 0 (0.0%) |
| 90 or more Minutes | 0 (0.0%) | 3 (1.2%) |
Time of Departure to Work by Sex in Flippin
The most frequent times of departure to work in Flippin are 5:00 AM to 5:29 AM (45, 17.8%) for males and 7:30 AM to 7:59 AM (50, 20.4%) for females.
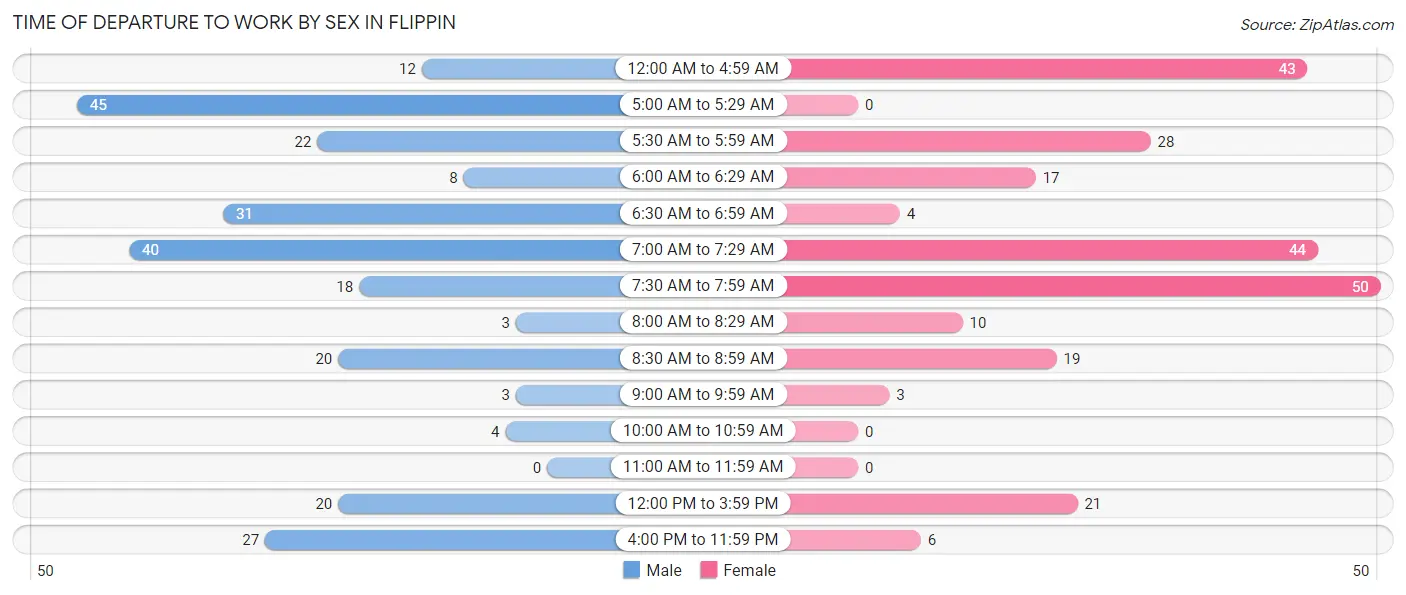
| Time of Departure | Male | Female |
| 12:00 AM to 4:59 AM | 12 (4.7%) | 43 (17.5%) |
| 5:00 AM to 5:29 AM | 45 (17.8%) | 0 (0.0%) |
| 5:30 AM to 5:59 AM | 22 (8.7%) | 28 (11.4%) |
| 6:00 AM to 6:29 AM | 8 (3.2%) | 17 (6.9%) |
| 6:30 AM to 6:59 AM | 31 (12.2%) | 4 (1.6%) |
| 7:00 AM to 7:29 AM | 40 (15.8%) | 44 (18.0%) |
| 7:30 AM to 7:59 AM | 18 (7.1%) | 50 (20.4%) |
| 8:00 AM to 8:29 AM | 3 (1.2%) | 10 (4.1%) |
| 8:30 AM to 8:59 AM | 20 (7.9%) | 19 (7.8%) |
| 9:00 AM to 9:59 AM | 3 (1.2%) | 3 (1.2%) |
| 10:00 AM to 10:59 AM | 4 (1.6%) | 0 (0.0%) |
| 11:00 AM to 11:59 AM | 0 (0.0%) | 0 (0.0%) |
| 12:00 PM to 3:59 PM | 20 (7.9%) | 21 (8.6%) |
| 4:00 PM to 11:59 PM | 27 (10.7%) | 6 (2.5%) |
| Total | 253 (100.0%) | 245 (100.0%) |
Housing Occupancy in Flippin
Occupancy by Ownership in Flippin
Of the total 539 dwellings in Flippin, owner-occupied units account for 250 (46.4%), while renter-occupied units make up 289 (53.6%).
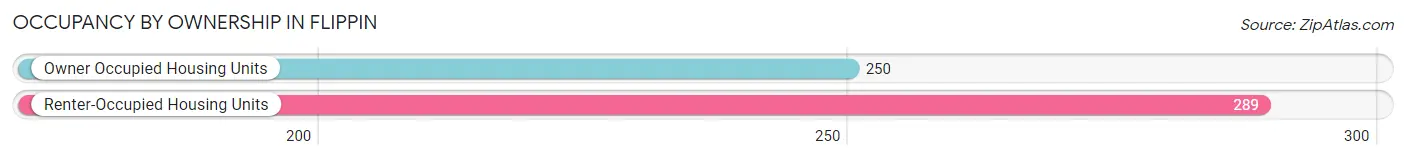
| Occupancy | # Housing Units | % Housing Units |
| Owner Occupied Housing Units | 250 | 46.4% |
| Renter-Occupied Housing Units | 289 | 53.6% |
| Total Occupied Housing Units | 539 | 100.0% |
Occupancy by Household Size in Flippin
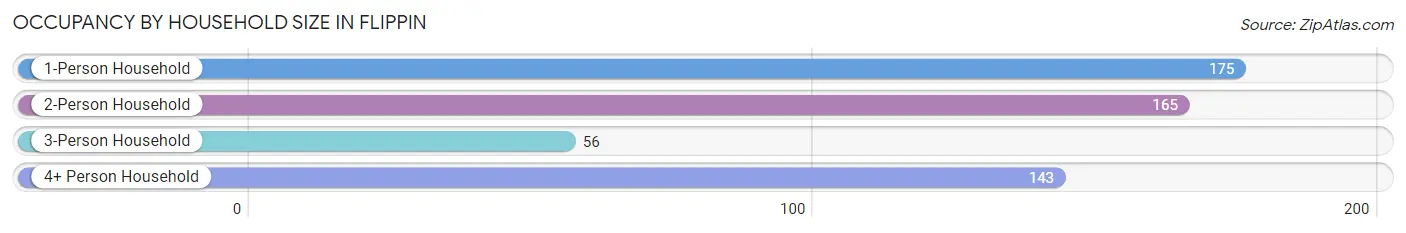
| Household Size | # Housing Units | % Housing Units |
| 1-Person Household | 175 | 32.5% |
| 2-Person Household | 165 | 30.6% |
| 3-Person Household | 56 | 10.4% |
| 4+ Person Household | 143 | 26.5% |
| Total Housing Units | 539 | 100.0% |
Occupancy by Ownership by Household Size in Flippin
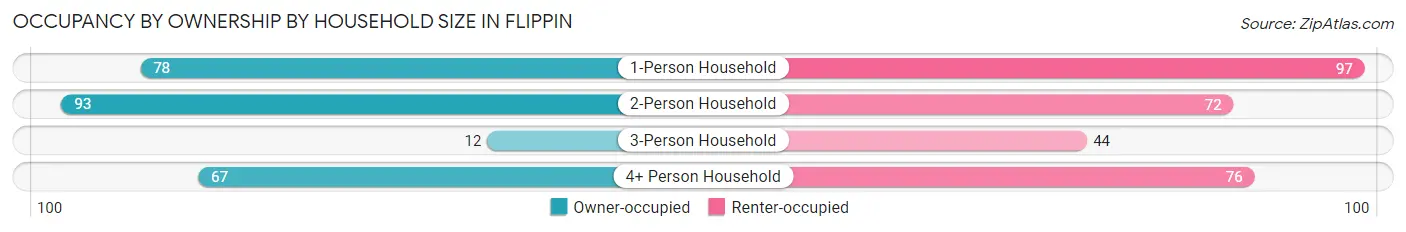
| Household Size | Owner-occupied | Renter-occupied |
| 1-Person Household | 78 (44.6%) | 97 (55.4%) |
| 2-Person Household | 93 (56.4%) | 72 (43.6%) |
| 3-Person Household | 12 (21.4%) | 44 (78.6%) |
| 4+ Person Household | 67 (46.9%) | 76 (53.1%) |
| Total Housing Units | 250 (46.4%) | 289 (53.6%) |
Occupancy by Educational Attainment in Flippin
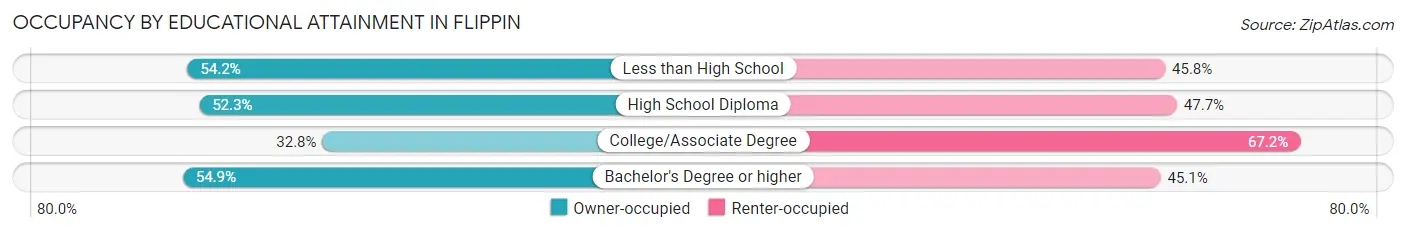
| Household Size | Owner-occupied | Renter-occupied |
| Less than High School | 39 (54.2%) | 33 (45.8%) |
| High School Diploma | 125 (52.3%) | 114 (47.7%) |
| College/Associate Degree | 58 (32.8%) | 119 (67.2%) |
| Bachelor's Degree or higher | 28 (54.9%) | 23 (45.1%) |
Occupancy by Age of Householder in Flippin
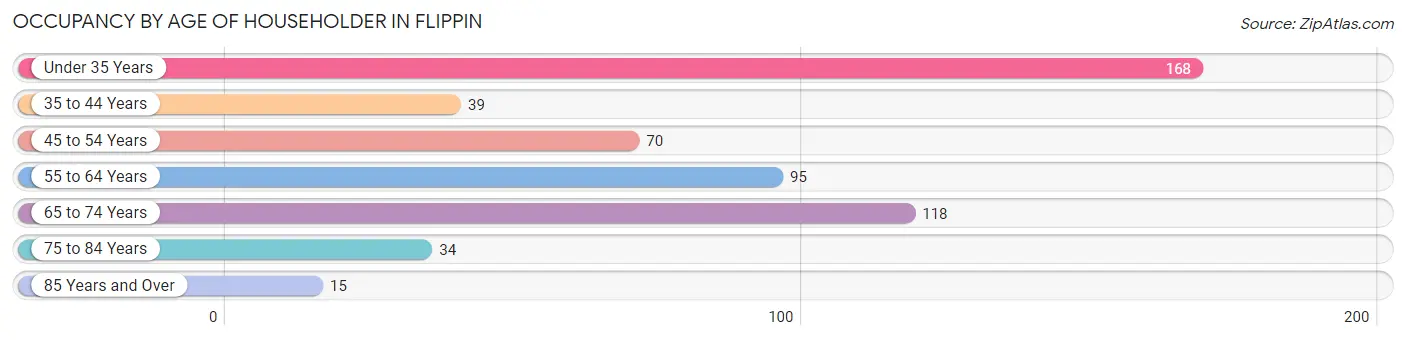
| Age Bracket | # Households | % Households |
| Under 35 Years | 168 | 31.2% |
| 35 to 44 Years | 39 | 7.2% |
| 45 to 54 Years | 70 | 13.0% |
| 55 to 64 Years | 95 | 17.6% |
| 65 to 74 Years | 118 | 21.9% |
| 75 to 84 Years | 34 | 6.3% |
| 85 Years and Over | 15 | 2.8% |
| Total | 539 | 100.0% |
Housing Finances in Flippin
Median Income by Occupancy in Flippin
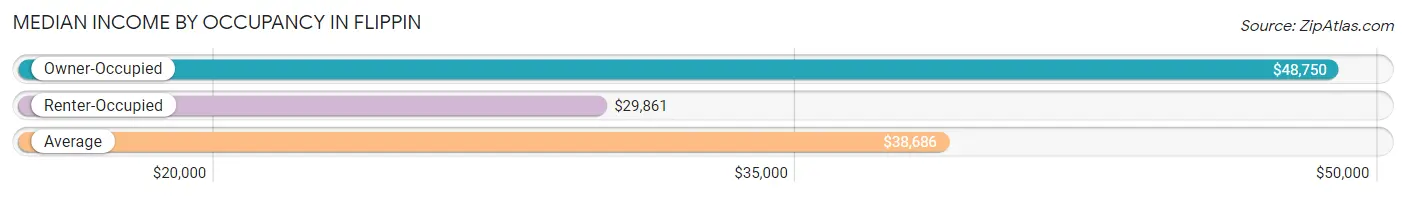
| Occupancy Type | # Households | Median Income |
| Owner-Occupied | 250 (46.4%) | $48,750 |
| Renter-Occupied | 289 (53.6%) | $29,861 |
| Average | 539 (100.0%) | $38,686 |
Occupancy by Householder Income Bracket in Flippin
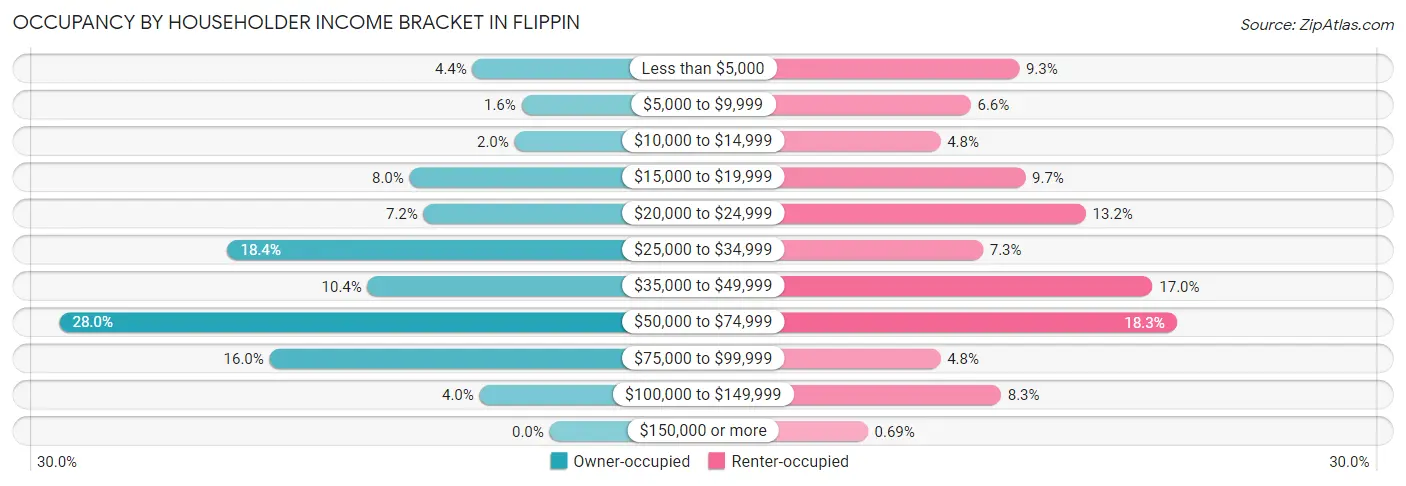
| Income Bracket | Owner-occupied | Renter-occupied |
| Less than $5,000 | 11 (4.4%) | 27 (9.3%) |
| $5,000 to $9,999 | 4 (1.6%) | 19 (6.6%) |
| $10,000 to $14,999 | 5 (2.0%) | 14 (4.8%) |
| $15,000 to $19,999 | 20 (8.0%) | 28 (9.7%) |
| $20,000 to $24,999 | 18 (7.2%) | 38 (13.2%) |
| $25,000 to $34,999 | 46 (18.4%) | 21 (7.3%) |
| $35,000 to $49,999 | 26 (10.4%) | 49 (17.0%) |
| $50,000 to $74,999 | 70 (28.0%) | 53 (18.3%) |
| $75,000 to $99,999 | 40 (16.0%) | 14 (4.8%) |
| $100,000 to $149,999 | 10 (4.0%) | 24 (8.3%) |
| $150,000 or more | 0 (0.0%) | 2 (0.7%) |
| Total | 250 (100.0%) | 289 (100.0%) |
Monthly Housing Cost Tiers in Flippin
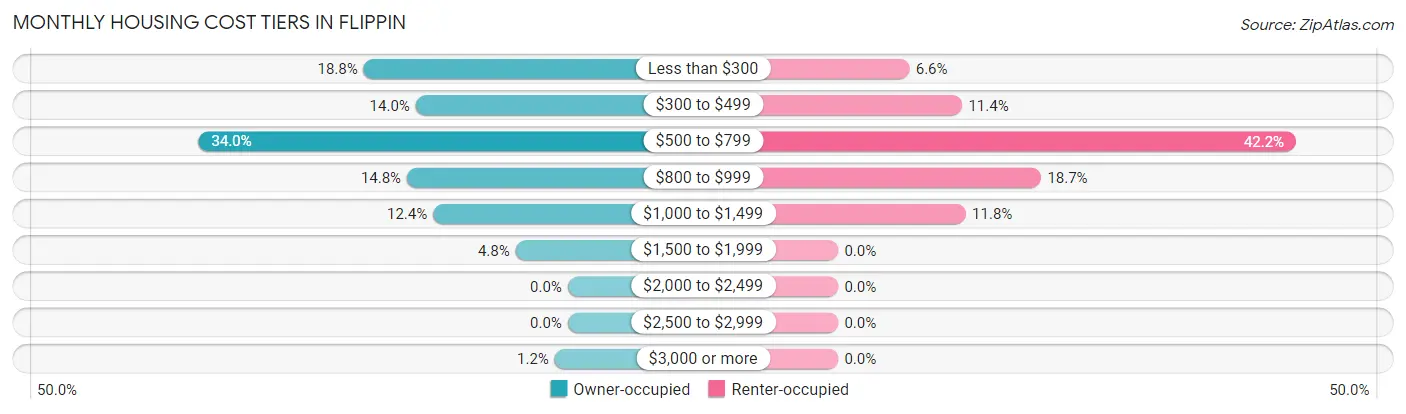
| Monthly Cost | Owner-occupied | Renter-occupied |
| Less than $300 | 47 (18.8%) | 19 (6.6%) |
| $300 to $499 | 35 (14.0%) | 33 (11.4%) |
| $500 to $799 | 85 (34.0%) | 122 (42.2%) |
| $800 to $999 | 37 (14.8%) | 54 (18.7%) |
| $1,000 to $1,499 | 31 (12.4%) | 34 (11.8%) |
| $1,500 to $1,999 | 12 (4.8%) | 0 (0.0%) |
| $2,000 to $2,499 | 0 (0.0%) | 0 (0.0%) |
| $2,500 to $2,999 | 0 (0.0%) | 0 (0.0%) |
| $3,000 or more | 3 (1.2%) | 0 (0.0%) |
| Total | 250 (100.0%) | 289 (100.0%) |
Physical Housing Characteristics in Flippin
Housing Structures in Flippin
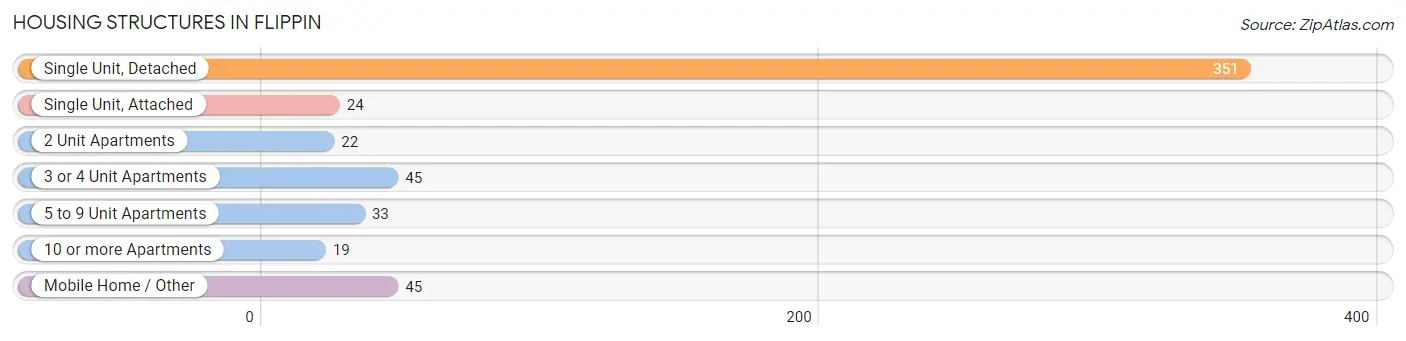
| Structure Type | # Housing Units | % Housing Units |
| Single Unit, Detached | 351 | 65.1% |
| Single Unit, Attached | 24 | 4.4% |
| 2 Unit Apartments | 22 | 4.1% |
| 3 or 4 Unit Apartments | 45 | 8.4% |
| 5 to 9 Unit Apartments | 33 | 6.1% |
| 10 or more Apartments | 19 | 3.5% |
| Mobile Home / Other | 45 | 8.4% |
| Total | 539 | 100.0% |
Housing Structures by Occupancy in Flippin
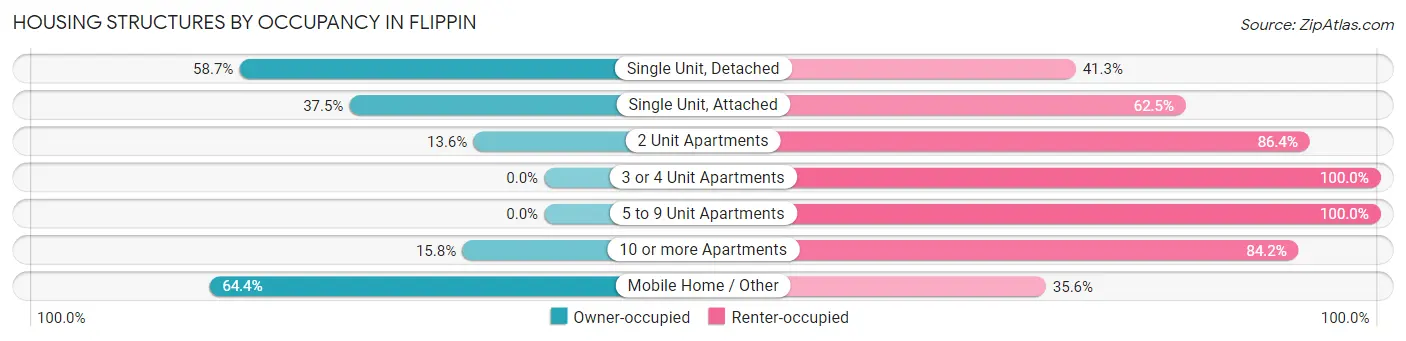
| Structure Type | Owner-occupied | Renter-occupied |
| Single Unit, Detached | 206 (58.7%) | 145 (41.3%) |
| Single Unit, Attached | 9 (37.5%) | 15 (62.5%) |
| 2 Unit Apartments | 3 (13.6%) | 19 (86.4%) |
| 3 or 4 Unit Apartments | 0 (0.0%) | 45 (100.0%) |
| 5 to 9 Unit Apartments | 0 (0.0%) | 33 (100.0%) |
| 10 or more Apartments | 3 (15.8%) | 16 (84.2%) |
| Mobile Home / Other | 29 (64.4%) | 16 (35.6%) |
| Total | 250 (46.4%) | 289 (53.6%) |
Housing Structures by Number of Rooms in Flippin
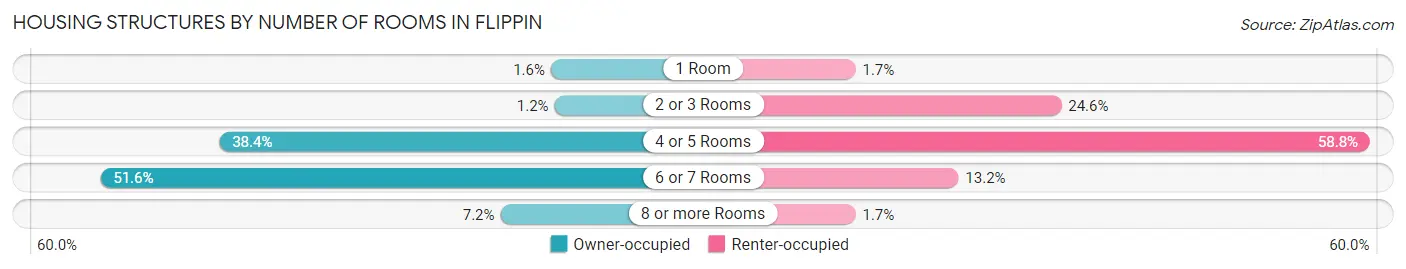
| Number of Rooms | Owner-occupied | Renter-occupied |
| 1 Room | 4 (1.6%) | 5 (1.7%) |
| 2 or 3 Rooms | 3 (1.2%) | 71 (24.6%) |
| 4 or 5 Rooms | 96 (38.4%) | 170 (58.8%) |
| 6 or 7 Rooms | 129 (51.6%) | 38 (13.2%) |
| 8 or more Rooms | 18 (7.2%) | 5 (1.7%) |
| Total | 250 (100.0%) | 289 (100.0%) |
Housing Structure by Heating Type in Flippin
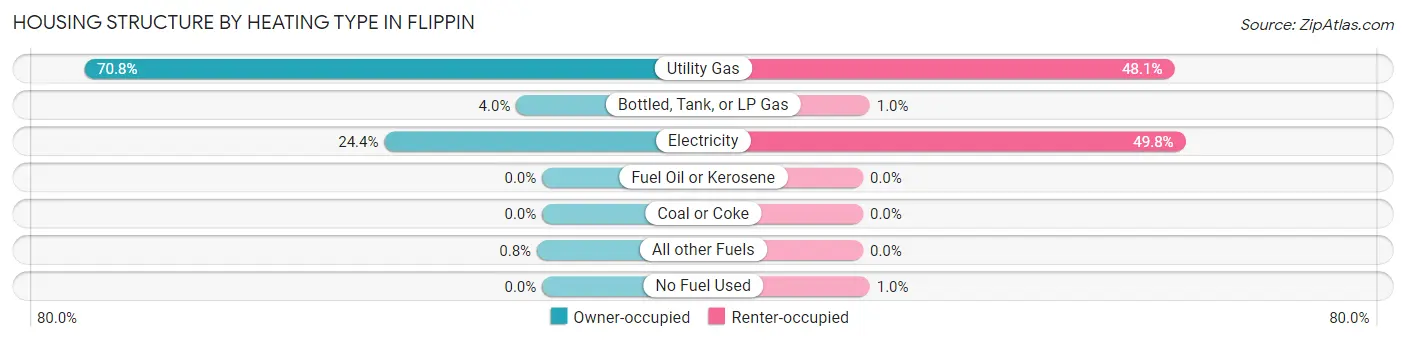
| Heating Type | Owner-occupied | Renter-occupied |
| Utility Gas | 177 (70.8%) | 139 (48.1%) |
| Bottled, Tank, or LP Gas | 10 (4.0%) | 3 (1.0%) |
| Electricity | 61 (24.4%) | 144 (49.8%) |
| Fuel Oil or Kerosene | 0 (0.0%) | 0 (0.0%) |
| Coal or Coke | 0 (0.0%) | 0 (0.0%) |
| All other Fuels | 2 (0.8%) | 0 (0.0%) |
| No Fuel Used | 0 (0.0%) | 3 (1.0%) |
| Total | 250 (100.0%) | 289 (100.0%) |
Household Vehicle Usage in Flippin
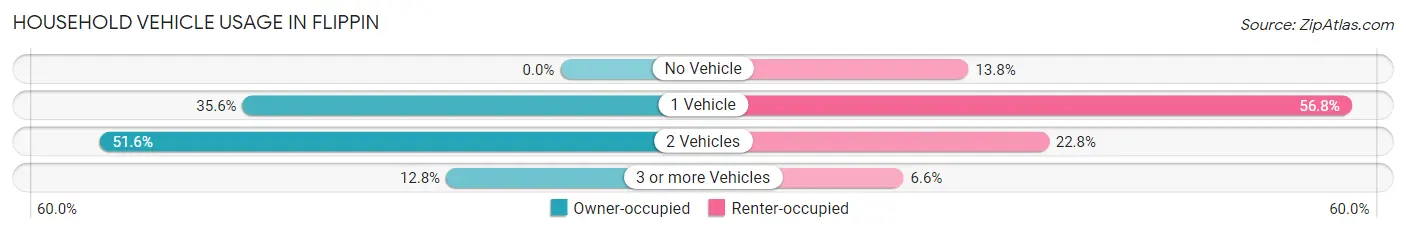
| Vehicles per Household | Owner-occupied | Renter-occupied |
| No Vehicle | 0 (0.0%) | 40 (13.8%) |
| 1 Vehicle | 89 (35.6%) | 164 (56.8%) |
| 2 Vehicles | 129 (51.6%) | 66 (22.8%) |
| 3 or more Vehicles | 32 (12.8%) | 19 (6.6%) |
| Total | 250 (100.0%) | 289 (100.0%) |
Real Estate & Mortgages in Flippin
Real Estate and Mortgage Overview in Flippin
| Characteristic | Without Mortgage | With Mortgage |
| Housing Units | 79 | 171 |
| Median Property Value | $121,300 | $102,300 |
| Median Household Income | $48,125 | $0 |
| Monthly Housing Costs | $281 | $3 |
| Real Estate Taxes | $565 | $12 |
Property Value by Mortgage Status in Flippin
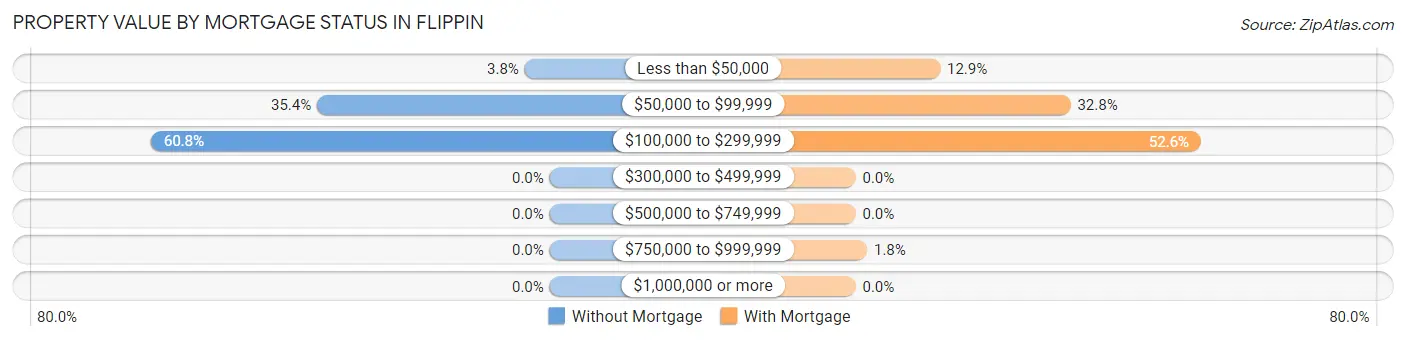
| Property Value | Without Mortgage | With Mortgage |
| Less than $50,000 | 3 (3.8%) | 22 (12.9%) |
| $50,000 to $99,999 | 28 (35.4%) | 56 (32.8%) |
| $100,000 to $299,999 | 48 (60.8%) | 90 (52.6%) |
| $300,000 to $499,999 | 0 (0.0%) | 0 (0.0%) |
| $500,000 to $749,999 | 0 (0.0%) | 0 (0.0%) |
| $750,000 to $999,999 | 0 (0.0%) | 3 (1.8%) |
| $1,000,000 or more | 0 (0.0%) | 0 (0.0%) |
| Total | 79 (100.0%) | 171 (100.0%) |
Household Income by Mortgage Status in Flippin
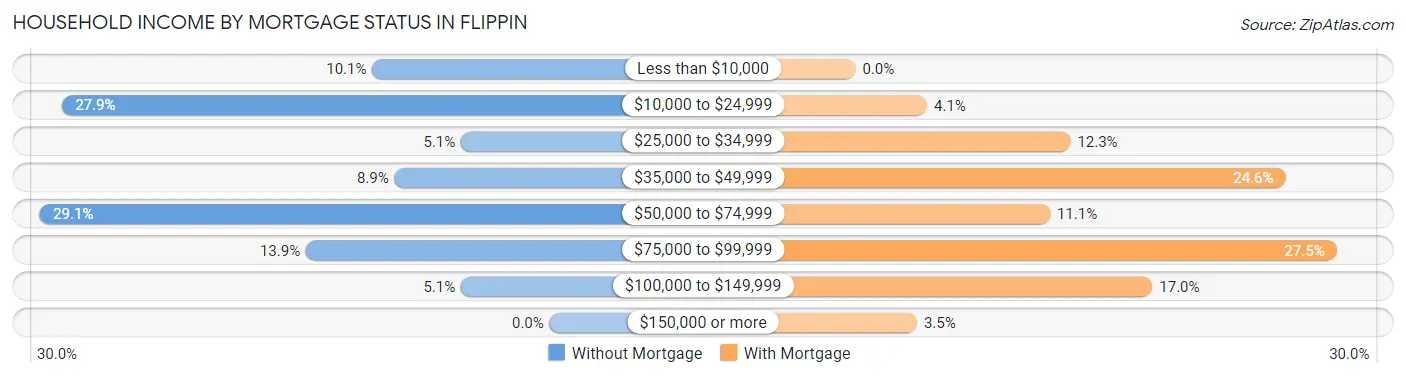
| Household Income | Without Mortgage | With Mortgage |
| Less than $10,000 | 8 (10.1%) | 0 (0.0%) |
| $10,000 to $24,999 | 22 (27.9%) | 7 (4.1%) |
| $25,000 to $34,999 | 4 (5.1%) | 21 (12.3%) |
| $35,000 to $49,999 | 7 (8.9%) | 42 (24.6%) |
| $50,000 to $74,999 | 23 (29.1%) | 19 (11.1%) |
| $75,000 to $99,999 | 11 (13.9%) | 47 (27.5%) |
| $100,000 to $149,999 | 4 (5.1%) | 29 (17.0%) |
| $150,000 or more | 0 (0.0%) | 6 (3.5%) |
| Total | 79 (100.0%) | 171 (100.0%) |
Property Value to Household Income Ratio in Flippin
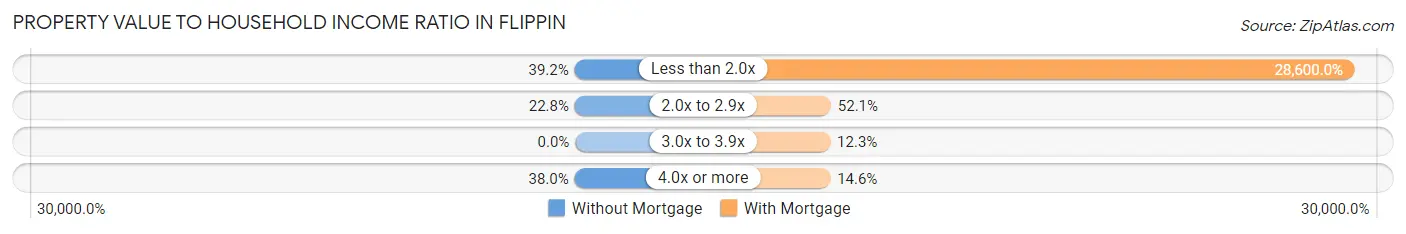
| Value-to-Income Ratio | Without Mortgage | With Mortgage |
| Less than 2.0x | 31 (39.2%) | 48,906 (28,600.0%) |
| 2.0x to 2.9x | 18 (22.8%) | 89 (52.0%) |
| 3.0x to 3.9x | 0 (0.0%) | 21 (12.3%) |
| 4.0x or more | 30 (38.0%) | 25 (14.6%) |
| Total | 79 (100.0%) | 171 (100.0%) |
Real Estate Taxes by Mortgage Status in Flippin
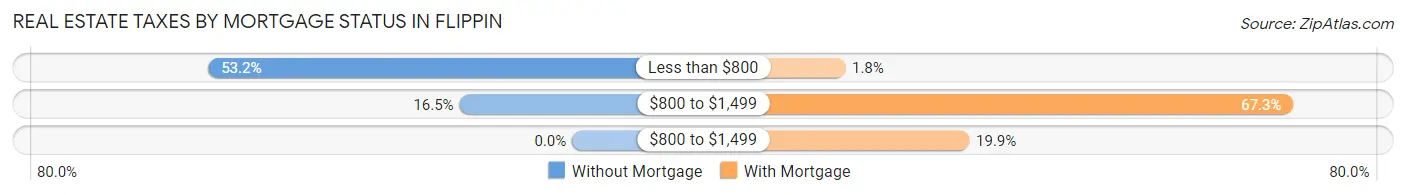
| Property Taxes | Without Mortgage | With Mortgage |
| Less than $800 | 42 (53.2%) | 3 (1.8%) |
| $800 to $1,499 | 13 (16.5%) | 115 (67.2%) |
| $800 to $1,499 | 0 (0.0%) | 34 (19.9%) |
| Total | 79 (100.0%) | 171 (100.0%) |
Health & Disability in Flippin
Health Insurance Coverage by Age in Flippin
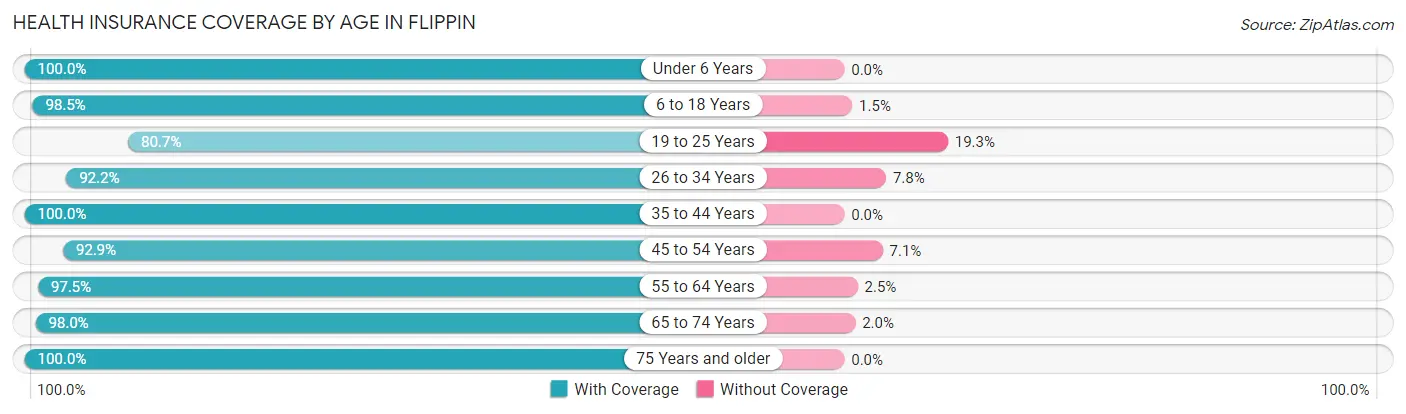
| Age Bracket | With Coverage | Without Coverage |
| Under 6 Years | 180 (100.0%) | 0 (0.0%) |
| 6 to 18 Years | 268 (98.5%) | 4 (1.5%) |
| 19 to 25 Years | 92 (80.7%) | 22 (19.3%) |
| 26 to 34 Years | 190 (92.2%) | 16 (7.8%) |
| 35 to 44 Years | 92 (100.0%) | 0 (0.0%) |
| 45 to 54 Years | 104 (92.9%) | 8 (7.1%) |
| 55 to 64 Years | 157 (97.5%) | 4 (2.5%) |
| 65 to 74 Years | 145 (98.0%) | 3 (2.0%) |
| 75 Years and older | 81 (100.0%) | 0 (0.0%) |
| Total | 1,309 (95.8%) | 57 (4.2%) |
Health Insurance Coverage by Citizenship Status in Flippin
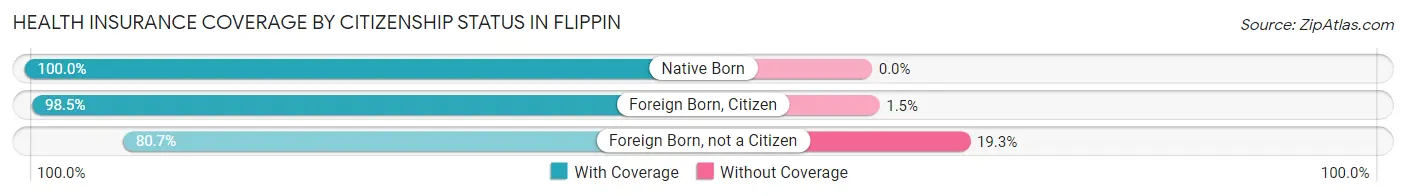
| Citizenship Status | With Coverage | Without Coverage |
| Native Born | 180 (100.0%) | 0 (0.0%) |
| Foreign Born, Citizen | 268 (98.5%) | 4 (1.5%) |
| Foreign Born, not a Citizen | 92 (80.7%) | 22 (19.3%) |
Health Insurance Coverage by Household Income in Flippin
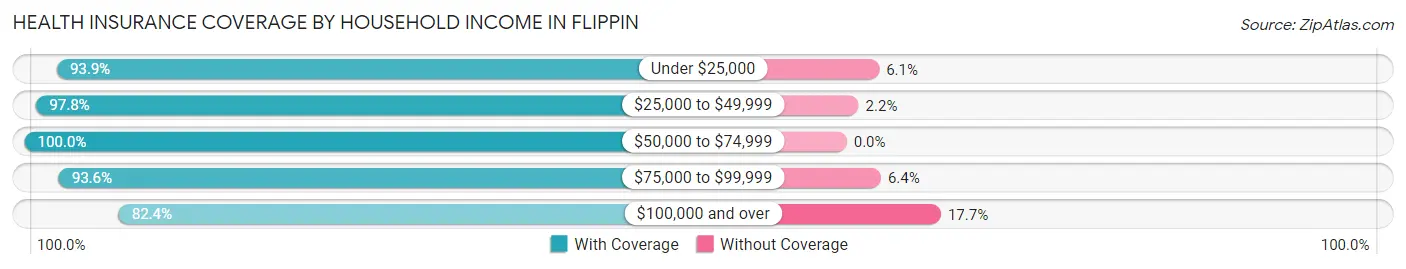
| Household Income | With Coverage | Without Coverage |
| Under $25,000 | 325 (93.9%) | 21 (6.1%) |
| $25,000 to $49,999 | 353 (97.8%) | 8 (2.2%) |
| $50,000 to $74,999 | 401 (100.0%) | 0 (0.0%) |
| $75,000 to $99,999 | 146 (93.6%) | 10 (6.4%) |
| $100,000 and over | 84 (82.4%) | 18 (17.6%) |
Public vs Private Health Insurance Coverage by Age in Flippin
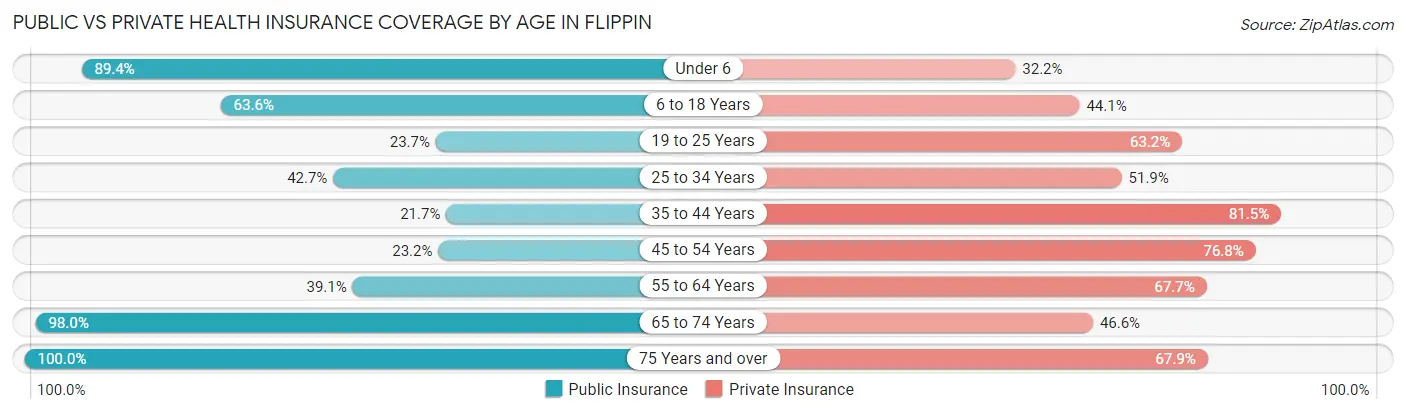
| Age Bracket | Public Insurance | Private Insurance |
| Under 6 | 161 (89.4%) | 58 (32.2%) |
| 6 to 18 Years | 173 (63.6%) | 120 (44.1%) |
| 19 to 25 Years | 27 (23.7%) | 72 (63.2%) |
| 25 to 34 Years | 88 (42.7%) | 107 (51.9%) |
| 35 to 44 Years | 20 (21.7%) | 75 (81.5%) |
| 45 to 54 Years | 26 (23.2%) | 86 (76.8%) |
| 55 to 64 Years | 63 (39.1%) | 109 (67.7%) |
| 65 to 74 Years | 145 (98.0%) | 69 (46.6%) |
| 75 Years and over | 81 (100.0%) | 55 (67.9%) |
| Total | 784 (57.4%) | 751 (55.0%) |
Disability Status by Sex by Age in Flippin
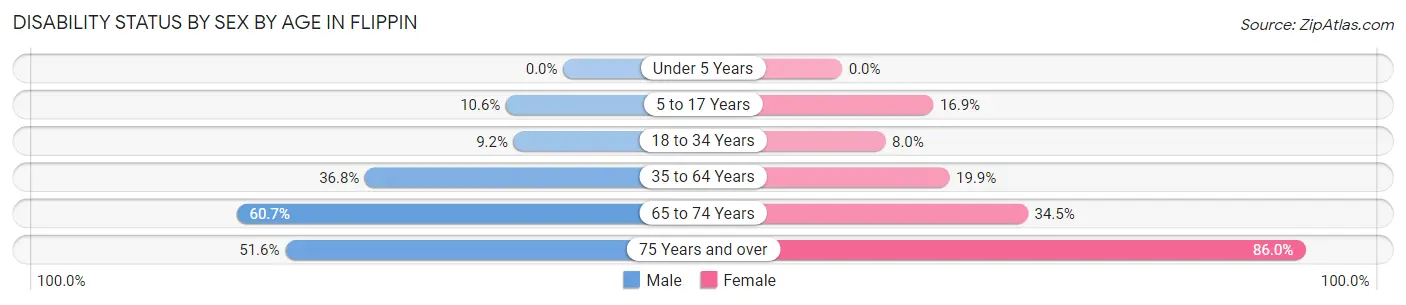
| Age Bracket | Male | Female |
| Under 5 Years | 0 (0.0%) | 0 (0.0%) |
| 5 to 17 Years | 14 (10.6%) | 22 (16.9%) |
| 18 to 34 Years | 16 (9.2%) | 15 (8.0%) |
| 35 to 64 Years | 64 (36.8%) | 38 (19.9%) |
| 65 to 74 Years | 37 (60.7%) | 30 (34.5%) |
| 75 Years and over | 16 (51.6%) | 43 (86.0%) |
Disability Class by Sex by Age in Flippin
Disability Class: Hearing Difficulty
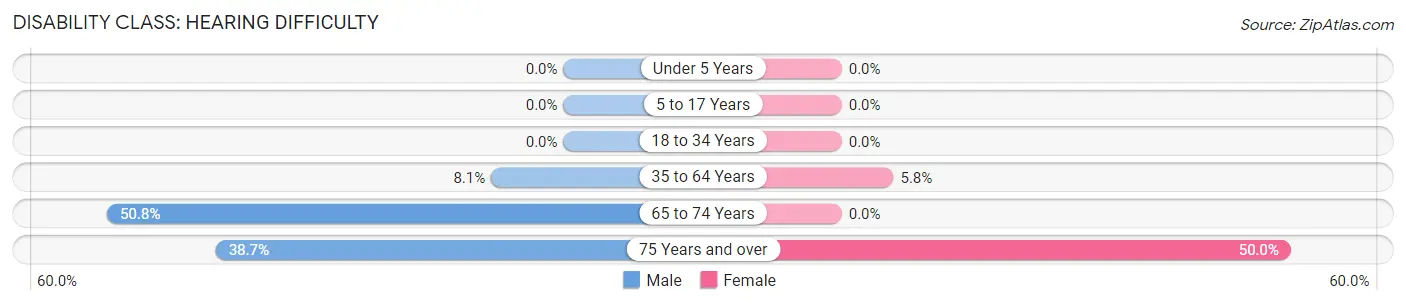
| Age Bracket | Male | Female |
| Under 5 Years | 0 (0.0%) | 0 (0.0%) |
| 5 to 17 Years | 0 (0.0%) | 0 (0.0%) |
| 18 to 34 Years | 0 (0.0%) | 0 (0.0%) |
| 35 to 64 Years | 14 (8.1%) | 11 (5.8%) |
| 65 to 74 Years | 31 (50.8%) | 0 (0.0%) |
| 75 Years and over | 12 (38.7%) | 25 (50.0%) |
Disability Class: Vision Difficulty
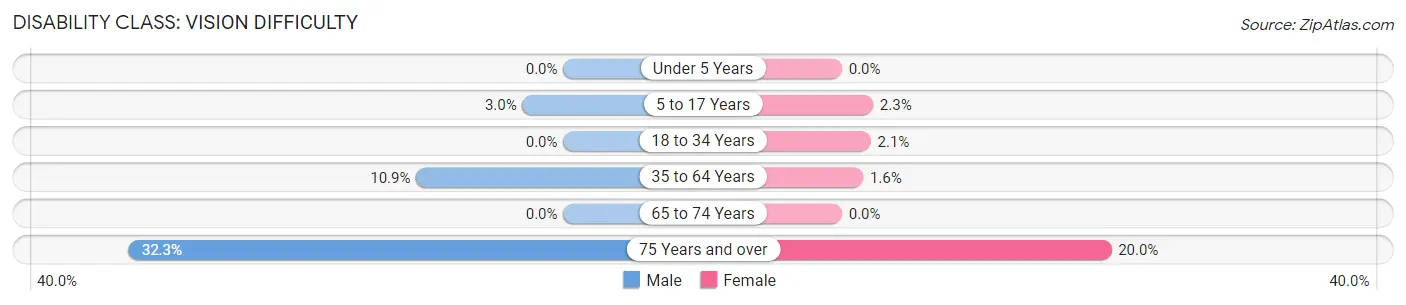
| Age Bracket | Male | Female |
| Under 5 Years | 0 (0.0%) | 0 (0.0%) |
| 5 to 17 Years | 4 (3.0%) | 3 (2.3%) |
| 18 to 34 Years | 0 (0.0%) | 4 (2.1%) |
| 35 to 64 Years | 19 (10.9%) | 3 (1.6%) |
| 65 to 74 Years | 0 (0.0%) | 0 (0.0%) |
| 75 Years and over | 10 (32.3%) | 10 (20.0%) |
Disability Class: Cognitive Difficulty
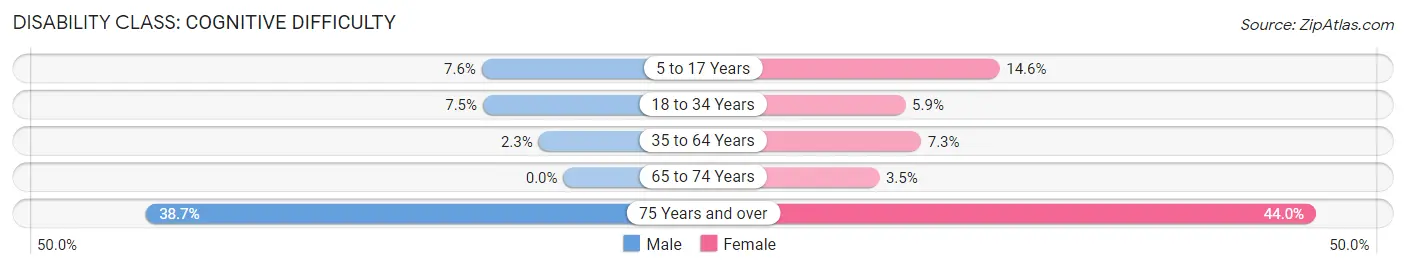
| Age Bracket | Male | Female |
| 5 to 17 Years | 10 (7.6%) | 19 (14.6%) |
| 18 to 34 Years | 13 (7.5%) | 11 (5.9%) |
| 35 to 64 Years | 4 (2.3%) | 14 (7.3%) |
| 65 to 74 Years | 0 (0.0%) | 3 (3.5%) |
| 75 Years and over | 12 (38.7%) | 22 (44.0%) |
Disability Class: Ambulatory Difficulty
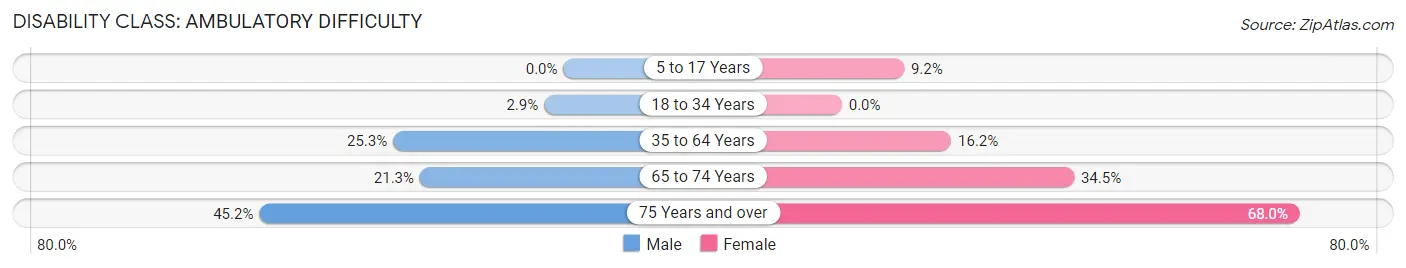
| Age Bracket | Male | Female |
| 5 to 17 Years | 0 (0.0%) | 12 (9.2%) |
| 18 to 34 Years | 5 (2.9%) | 0 (0.0%) |
| 35 to 64 Years | 44 (25.3%) | 31 (16.2%) |
| 65 to 74 Years | 13 (21.3%) | 30 (34.5%) |
| 75 Years and over | 14 (45.2%) | 34 (68.0%) |
Disability Class: Self-Care Difficulty
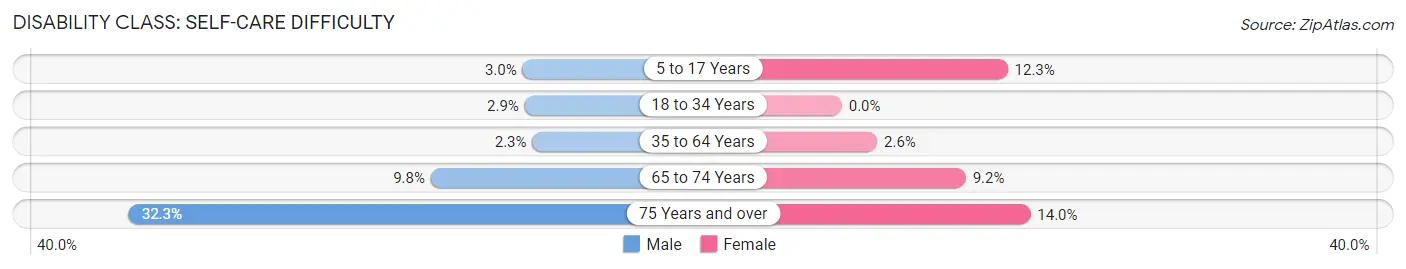
| Age Bracket | Male | Female |
| 5 to 17 Years | 4 (3.0%) | 16 (12.3%) |
| 18 to 34 Years | 5 (2.9%) | 0 (0.0%) |
| 35 to 64 Years | 4 (2.3%) | 5 (2.6%) |
| 65 to 74 Years | 6 (9.8%) | 8 (9.2%) |
| 75 Years and over | 10 (32.3%) | 7 (14.0%) |
Technology Access in Flippin
Computing Device Access in Flippin
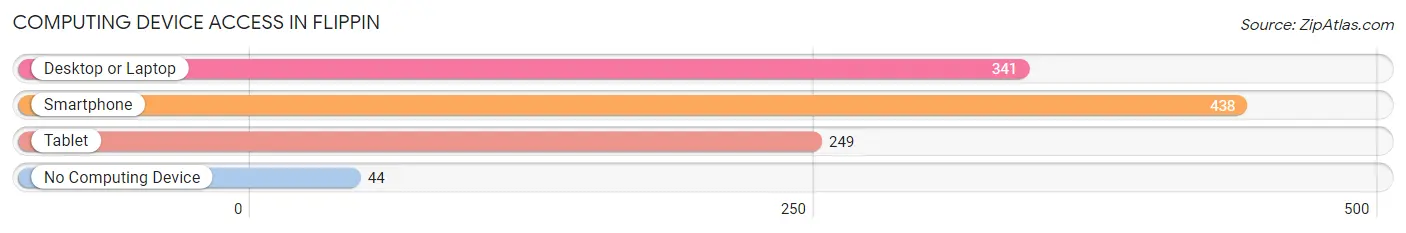
| Device Type | # Households | % Households |
| Desktop or Laptop | 341 | 63.3% |
| Smartphone | 438 | 81.3% |
| Tablet | 249 | 46.2% |
| No Computing Device | 44 | 8.2% |
| Total | 539 | 100.0% |
Internet Access in Flippin
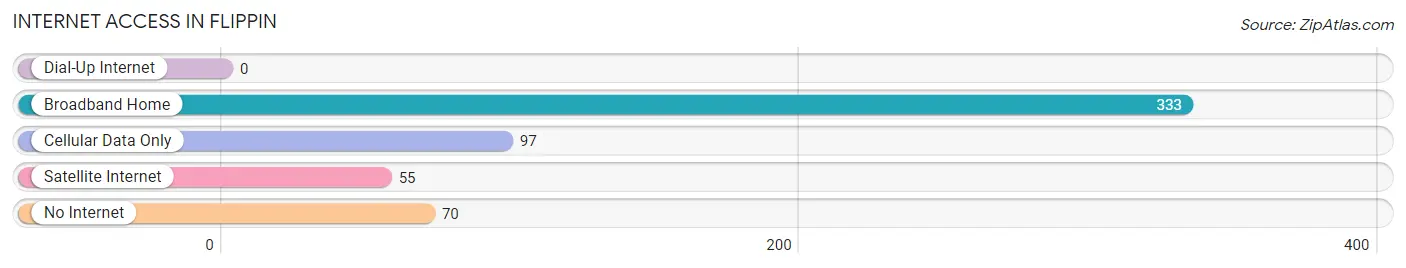
| Internet Type | # Households | % Households |
| Dial-Up Internet | 0 | 0.0% |
| Broadband Home | 333 | 61.8% |
| Cellular Data Only | 97 | 18.0% |
| Satellite Internet | 55 | 10.2% |
| No Internet | 70 | 13.0% |
| Total | 539 | 100.0% |
Flippin Summary
Flippin, Arkansas is a small town located in Marion County in the northern part of the state. It is situated on the banks of the White River and is home to a population of approximately 1,500 people. The town was founded in 1883 and has a rich history of logging, farming, and manufacturing.
Geography
Flippin is located in the Ozark Mountains of northern Arkansas. It is situated on the banks of the White River, which is a major tributary of the Arkansas River. The town is surrounded by the Ozark National Forest, which provides a variety of outdoor activities such as camping, fishing, and hiking. The town is also located near Bull Shoals Lake, which is a popular destination for boating and fishing.
The climate in Flippin is humid subtropical, with hot summers and mild winters. The average annual temperature is around 64°F (18°C). The average annual precipitation is around 48 inches (122 cm).
Economy
Flippin’s economy is largely based on agriculture and manufacturing. The town is home to several large poultry farms, which provide jobs for many of the town’s residents. The town is also home to several manufacturing companies, including a furniture factory and a plastics factory.
The town is also home to several small businesses, including restaurants, shops, and other services. The town is also home to a number of tourist attractions, including the Ozark National Forest and Bull Shoals Lake.
Demographics
As of the 2010 census, the population of Flippin was 1,521. The racial makeup of the town was 97.3% White, 0.7% African American, 0.2% Native American, 0.2% Asian, 0.1% Pacific Islander, 0.3% from other races, and 1.4% from two or more races. Hispanic or Latino of any race were 1.2% of the population.
The median income for a household in Flippin was $30,938, and the median income for a family was $37,500. The per capita income for the town was $17,845. About 15.2% of families and 18.2% of the population were below the poverty line, including 25.2% of those under age 18 and 11.2% of those age 65 or over.
Flippin is a small town with a rich history and a diverse economy. It is home to a variety of businesses and attractions, and its residents enjoy a high quality of life. The town is a great place to live, work, and play, and it is sure to continue to grow and thrive in the years to come.
Common Questions
What is the Total Population of Flippin?
Total Population of Flippin is 1,366.
What is the Total Male Population of Flippin?
Total Male Population of Flippin is 613.
What is the Total Female Population of Flippin?
Total Female Population of Flippin is 753.
What is the Ratio of Males per 100 Females in Flippin?
There are 81.41 Males per 100 Females in Flippin.
What is the Ratio of Females per 100 Males in Flippin?
There are 122.84 Females per 100 Males in Flippin.
What is the Median Population Age in Flippin?
Median Population Age in Flippin is 31.1 Years.
What is the Average Family Size in Flippin
Average Family Size in Flippin is 3.3 People.
What is the Average Household Size in Flippin
Average Household Size in Flippin is 2.5 People.
What is Per Capita Income in Flippin?
Per Capita income in Flippin is $18,487.
What is the Median Family Income in Flippin?
Median Family Income in Flippin is $48,125.
What is the Median Household income in Flippin?
Median Household Income in Flippin is $38,686.
What is Income or Wage Gap in Flippin?
Income or Wage Gap in Flippin is 41.3%.
Women in Flippin earn 58.7 cents for every dollar earned by a man.
What is Inequality or Gini Index in Flippin?
Inequality or Gini Index in Flippin is 0.40.
How Large is the Labor Force in Flippin?
There are 565 People in the Labor Forcein in Flippin.
What is the Percentage of People in the Labor Force in Flippin?
58.3% of People are in the Labor Force in Flippin.
What is the Unemployment Rate in Flippin?
Unemployment Rate in Flippin is 9.4%.