West Fork, AR Map & Demographics
West Fork Map
West Fork Overview
$32,191
PER CAPITA INCOME
$77,344
AVG FAMILY INCOME
$68,108
AVG HOUSEHOLD INCOME
3.9%
WAGE / INCOME GAP [ % ]
96.1¢/ $1
WAGE / INCOME GAP [ $ ]
0.36
INEQUALITY / GINI INDEX
3,054
TOTAL POPULATION
1,569
MALE POPULATION
1,485
FEMALE POPULATION
105.66
MALES / 100 FEMALES
94.65
FEMALES / 100 MALES
38.8
MEDIAN AGE
3.1
AVG FAMILY SIZE
2.7
AVG HOUSEHOLD SIZE
1,599
LABOR FORCE [ PEOPLE ]
65.9%
PERCENT IN LABOR FORCE
2.9%
UNEMPLOYMENT RATE
West Fork Zip Codes
West Fork Area Codes
Income in West Fork
Income Overview in West Fork
Per Capita Income in West Fork is $32,191, while median incomes of families and households are $77,344 and $68,108 respectively.
| Characteristic | Number | Measure |
| Per Capita Income | 3,054 | $32,191 |
| Median Family Income | 815 | $77,344 |
| Mean Family Income | 815 | $91,367 |
| Median Household Income | 1,142 | $68,108 |
| Mean Household Income | 1,142 | $82,245 |
| Income Deficit | 815 | $0 |
| Wage / Income Gap (%) | 3,054 | 3.88% |
| Wage / Income Gap ($) | 3,054 | 96.12¢ per $1 |
| Gini / Inequality Index | 3,054 | 0.36 |
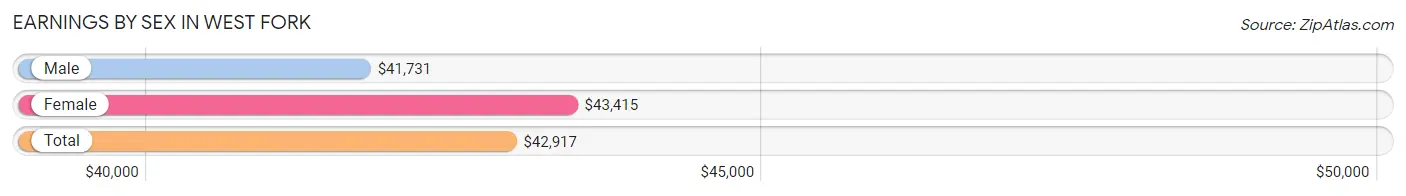
Earnings by Sex in West Fork
Average Earnings in West Fork are $42,917, $41,731 for men and $43,415 for women, a difference of 3.9%.
| Sex | Number | Average Earnings |
| Male | 840 (52.7%) | $41,731 |
| Female | 753 (47.3%) | $43,415 |
| Total | 1,593 (100.0%) | $42,917 |
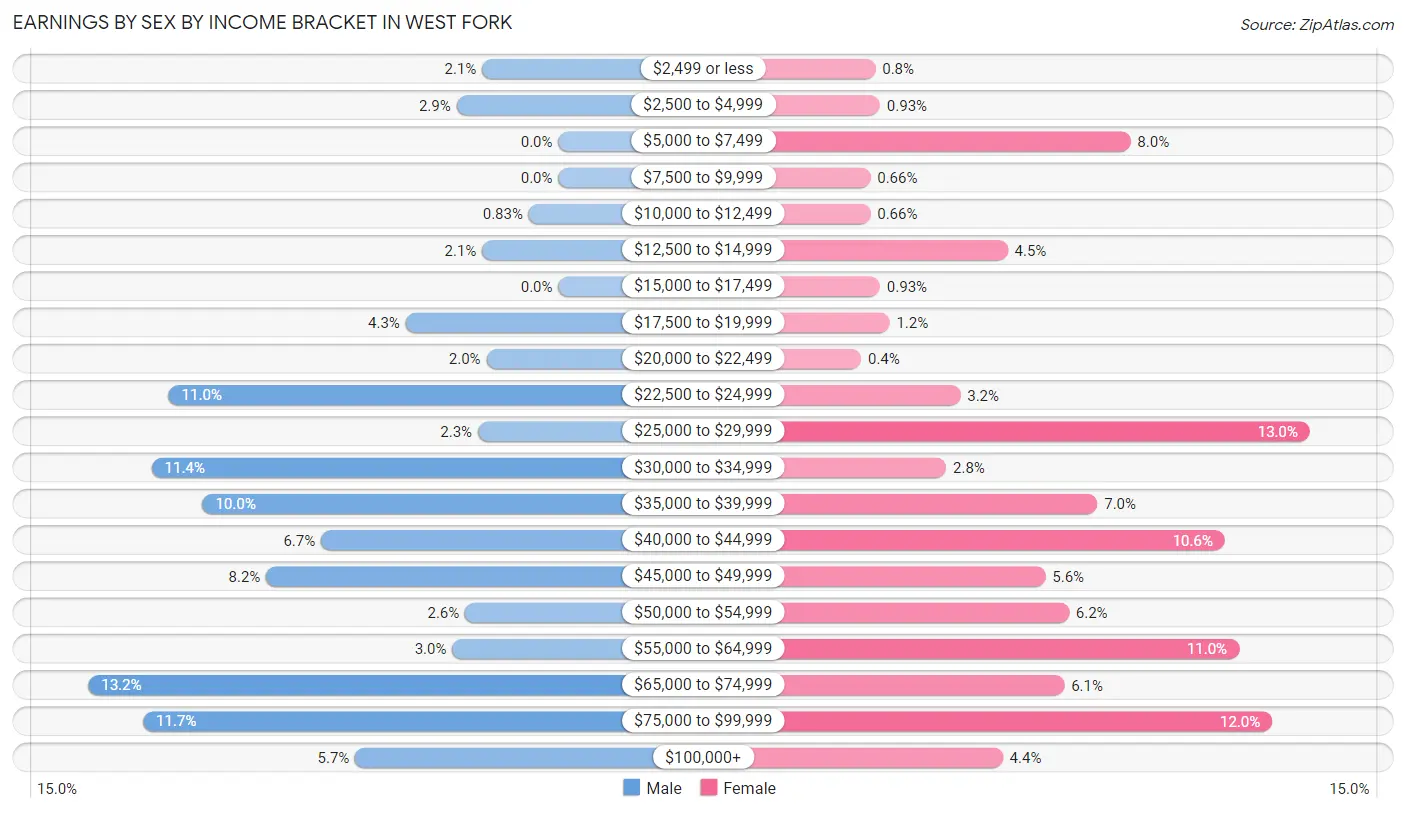
Earnings by Sex by Income Bracket in West Fork
The most common earnings brackets in West Fork are $65,000 to $74,999 for men (111 | 13.2%) and $25,000 to $29,999 for women (98 | 13.0%).
| Income | Male | Female |
| $2,499 or less | 18 (2.1%) | 6 (0.8%) |
| $2,500 to $4,999 | 24 (2.9%) | 7 (0.9%) |
| $5,000 to $7,499 | 0 (0.0%) | 60 (8.0%) |
| $7,500 to $9,999 | 0 (0.0%) | 5 (0.7%) |
| $10,000 to $12,499 | 7 (0.8%) | 5 (0.7%) |
| $12,500 to $14,999 | 18 (2.1%) | 34 (4.5%) |
| $15,000 to $17,499 | 0 (0.0%) | 7 (0.9%) |
| $17,500 to $19,999 | 36 (4.3%) | 9 (1.2%) |
| $20,000 to $22,499 | 17 (2.0%) | 3 (0.4%) |
| $22,500 to $24,999 | 92 (11.0%) | 24 (3.2%) |
| $25,000 to $29,999 | 19 (2.3%) | 98 (13.0%) |
| $30,000 to $34,999 | 96 (11.4%) | 21 (2.8%) |
| $35,000 to $39,999 | 84 (10.0%) | 53 (7.0%) |
| $40,000 to $44,999 | 56 (6.7%) | 80 (10.6%) |
| $45,000 to $49,999 | 69 (8.2%) | 42 (5.6%) |
| $50,000 to $54,999 | 22 (2.6%) | 47 (6.2%) |
| $55,000 to $64,999 | 25 (3.0%) | 83 (11.0%) |
| $65,000 to $74,999 | 111 (13.2%) | 46 (6.1%) |
| $75,000 to $99,999 | 98 (11.7%) | 90 (11.9%) |
| $100,000+ | 48 (5.7%) | 33 (4.4%) |
| Total | 840 (100.0%) | 753 (100.0%) |
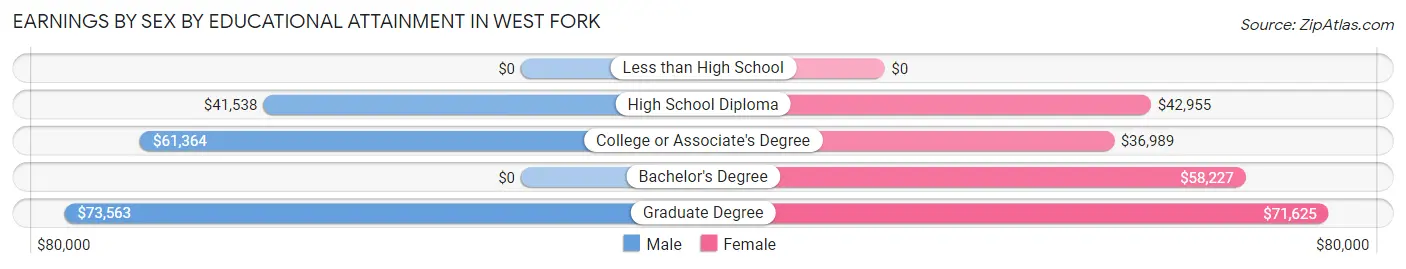
Earnings by Sex by Educational Attainment in West Fork
Average earnings in West Fork are $45,147 for men and $45,536 for women, a difference of 0.9%. Men with an educational attainment of graduate degree enjoy the highest average annual earnings of $73,563, while those with high school diploma education earn the least with $41,538. Women with an educational attainment of graduate degree earn the most with the average annual earnings of $71,625, while those with college or associate's degree education have the smallest earnings of $36,989.
| Educational Attainment | Male Income | Female Income |
| Less than High School | - | - |
| High School Diploma | $41,538 | $42,955 |
| College or Associate's Degree | $61,364 | $36,989 |
| Bachelor's Degree | - | - |
| Graduate Degree | $73,563 | $71,625 |
| Total | $45,147 | $45,536 |
Family Income in West Fork
Family Income Brackets in West Fork
According to the West Fork family income data, there are 207 families falling into the $50,000 to $74,999 income range, which is the most common income bracket and makes up 25.4% of all families.
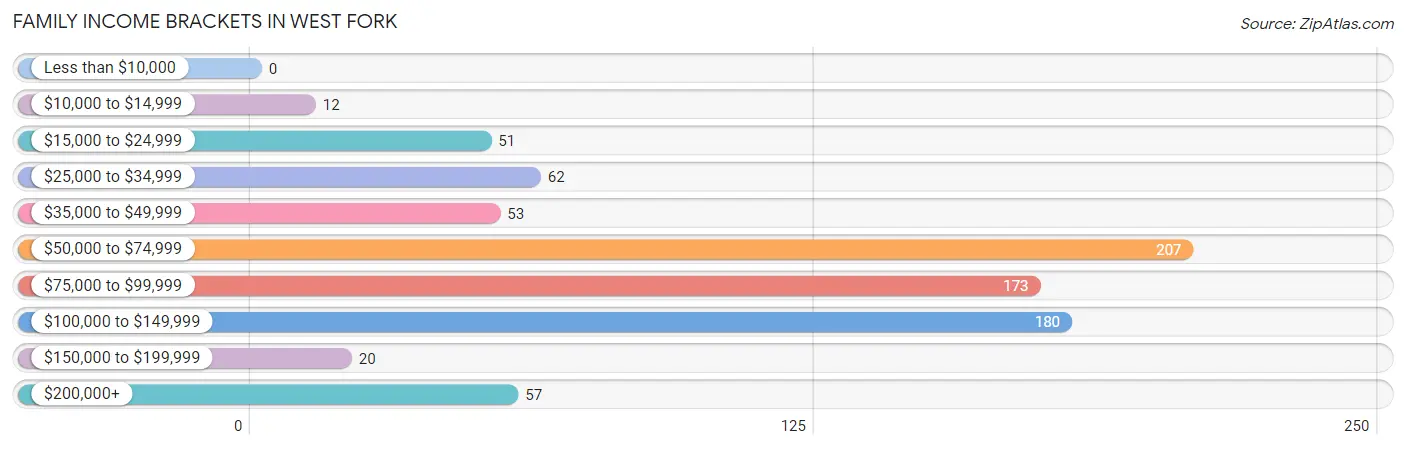
| Income Bracket | # Families | % Families |
| Less than $10,000 | 0 | 0.0% |
| $10,000 to $14,999 | 12 | 1.5% |
| $15,000 to $24,999 | 51 | 6.3% |
| $25,000 to $34,999 | 62 | 7.6% |
| $35,000 to $49,999 | 53 | 6.5% |
| $50,000 to $74,999 | 207 | 25.4% |
| $75,000 to $99,999 | 173 | 21.2% |
| $100,000 to $149,999 | 180 | 22.1% |
| $150,000 to $199,999 | 20 | 2.5% |
| $200,000+ | 57 | 7.0% |
Family Income by Famaliy Size in West Fork
4-person families (144 | 17.7%) account for the highest median family income in West Fork with $112,727 per family, while 2-person families (333 | 40.9%) have the highest median income of $37,578 per family member.
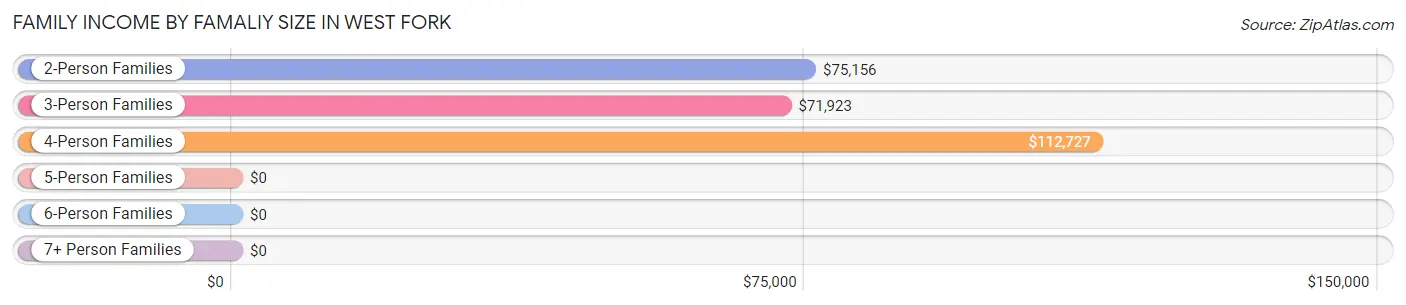
| Income Bracket | # Families | Median Income |
| 2-Person Families | 333 (40.9%) | $75,156 |
| 3-Person Families | 274 (33.6%) | $71,923 |
| 4-Person Families | 144 (17.7%) | $112,727 |
| 5-Person Families | 42 (5.1%) | $0 |
| 6-Person Families | 22 (2.7%) | $0 |
| 7+ Person Families | 0 (0.0%) | $0 |
| Total | 815 (100.0%) | $77,344 |
Family Income by Number of Earners in West Fork
The median family income in West Fork is $77,344, with families comprising 2 earners (305) having the highest median family income of $108,487, while families with no earners (131) have the lowest median family income of $48,403, accounting for 37.4% and 16.1% of families, respectively.
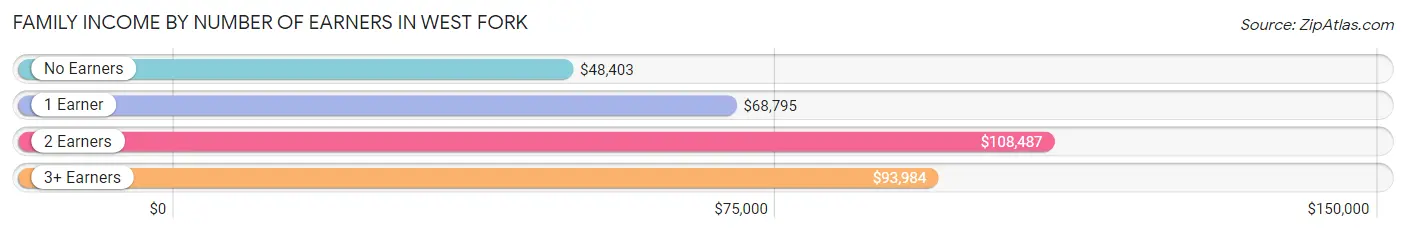
| Number of Earners | # Families | Median Income |
| No Earners | 131 (16.1%) | $48,403 |
| 1 Earner | 287 (35.2%) | $68,795 |
| 2 Earners | 305 (37.4%) | $108,487 |
| 3+ Earners | 92 (11.3%) | $93,984 |
| Total | 815 (100.0%) | $77,344 |
Household Income in West Fork
Household Income Brackets in West Fork
With 307 households falling in the category, the $50,000 to $74,999 income range is the most frequent in West Fork, accounting for 26.9% of all households. In contrast, only 21 households (1.8%) fall into the less than $10,000 income bracket, making it the least populous group.
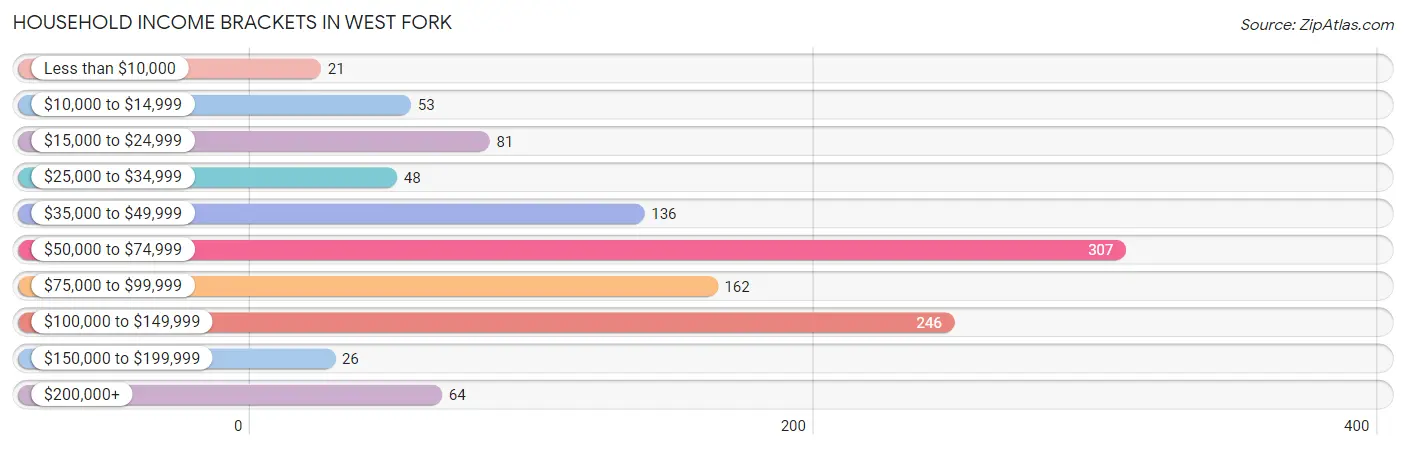
| Income Bracket | # Households | % Households |
| Less than $10,000 | 21 | 1.8% |
| $10,000 to $14,999 | 53 | 4.6% |
| $15,000 to $24,999 | 81 | 7.1% |
| $25,000 to $34,999 | 48 | 4.2% |
| $35,000 to $49,999 | 136 | 11.9% |
| $50,000 to $74,999 | 307 | 26.9% |
| $75,000 to $99,999 | 162 | 14.2% |
| $100,000 to $149,999 | 246 | 21.5% |
| $150,000 to $199,999 | 26 | 2.3% |
| $200,000+ | 64 | 5.6% |
Household Income by Householder Age in West Fork
The median household income in West Fork is $68,108, with the highest median household income of $115,586 found in the 15 to 24 years age bracket for the primary householder. A total of 49 households (4.3%) fall into this category. Meanwhile, the 65+ years age bracket for the primary householder has the lowest median household income of $45,625, with 315 households (27.6%) in this group.
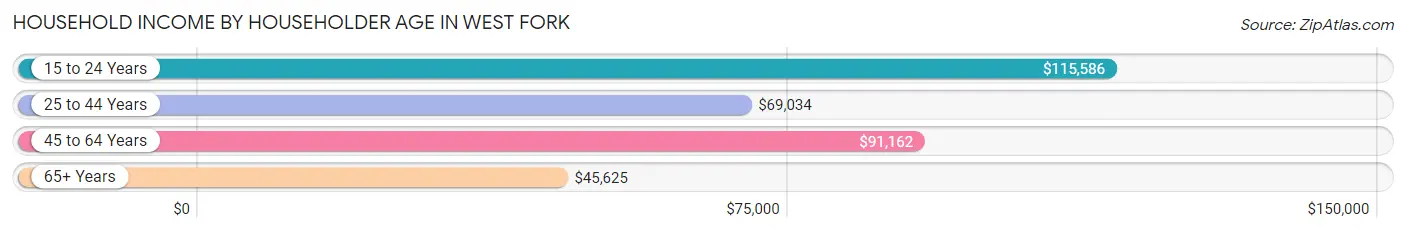
| Income Bracket | # Households | Median Income |
| 15 to 24 Years | 49 (4.3%) | $115,586 |
| 25 to 44 Years | 339 (29.7%) | $69,034 |
| 45 to 64 Years | 439 (38.4%) | $91,162 |
| 65+ Years | 315 (27.6%) | $45,625 |
| Total | 1,142 (100.0%) | $68,108 |
Poverty in West Fork
Income Below Poverty by Sex and Age in West Fork
With 2.9% poverty level for males and 5.1% for females among the residents of West Fork, 18 to 24 year old males and 16 and 17 year old females are the most vulnerable to poverty, with 20 males (13.3%) and 7 females (22.6%) in their respective age groups living below the poverty level.
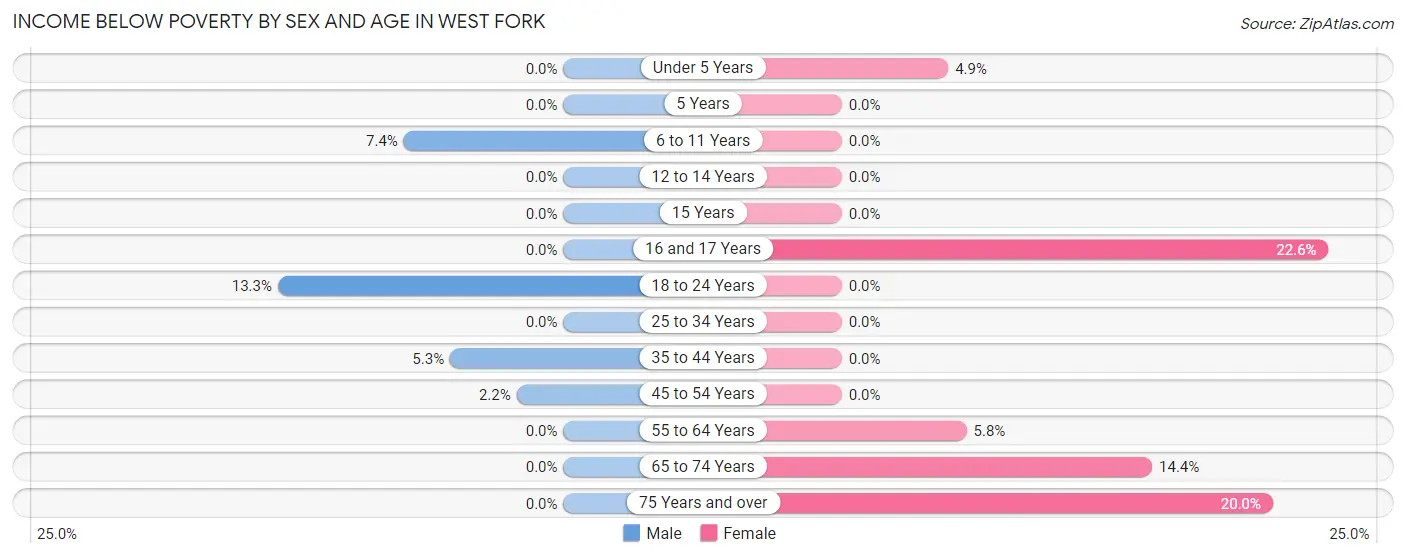
| Age Bracket | Male | Female |
| Under 5 Years | 0 (0.0%) | 4 (4.9%) |
| 5 Years | 0 (0.0%) | 0 (0.0%) |
| 6 to 11 Years | 10 (7.4%) | 0 (0.0%) |
| 12 to 14 Years | 0 (0.0%) | 0 (0.0%) |
| 15 Years | 0 (0.0%) | 0 (0.0%) |
| 16 and 17 Years | 0 (0.0%) | 7 (22.6%) |
| 18 to 24 Years | 20 (13.3%) | 0 (0.0%) |
| 25 to 34 Years | 0 (0.0%) | 0 (0.0%) |
| 35 to 44 Years | 12 (5.3%) | 0 (0.0%) |
| 45 to 54 Years | 4 (2.2%) | 0 (0.0%) |
| 55 to 64 Years | 0 (0.0%) | 11 (5.8%) |
| 65 to 74 Years | 0 (0.0%) | 35 (14.4%) |
| 75 Years and over | 0 (0.0%) | 18 (20.0%) |
| Total | 46 (2.9%) | 75 (5.1%) |
Income Above Poverty by Sex and Age in West Fork
According to the poverty statistics in West Fork, males aged under 5 years and females aged 6 to 11 years are the age groups that are most secure financially, with 100.0% of males and 100.0% of females in these age groups living above the poverty line.
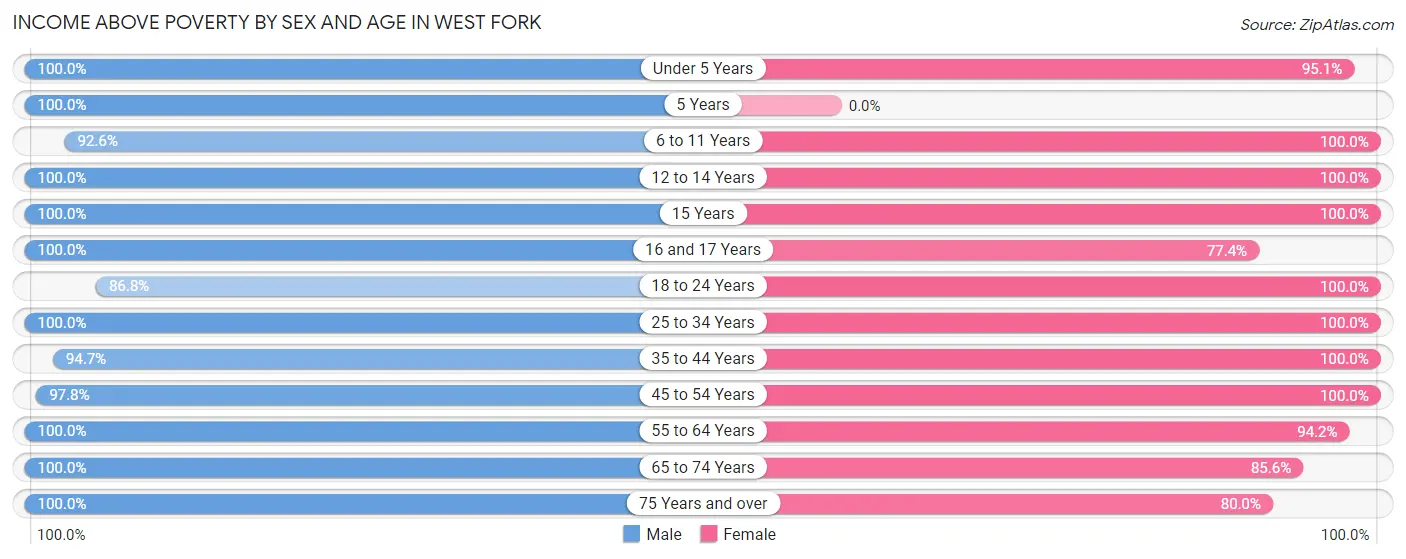
| Age Bracket | Male | Female |
| Under 5 Years | 104 (100.0%) | 77 (95.1%) |
| 5 Years | 13 (100.0%) | 0 (0.0%) |
| 6 to 11 Years | 125 (92.6%) | 86 (100.0%) |
| 12 to 14 Years | 86 (100.0%) | 38 (100.0%) |
| 15 Years | 57 (100.0%) | 28 (100.0%) |
| 16 and 17 Years | 66 (100.0%) | 24 (77.4%) |
| 18 to 24 Years | 131 (86.8%) | 104 (100.0%) |
| 25 to 34 Years | 247 (100.0%) | 216 (100.0%) |
| 35 to 44 Years | 216 (94.7%) | 144 (100.0%) |
| 45 to 54 Years | 180 (97.8%) | 234 (100.0%) |
| 55 to 64 Years | 160 (100.0%) | 179 (94.2%) |
| 65 to 74 Years | 89 (100.0%) | 208 (85.6%) |
| 75 Years and over | 49 (100.0%) | 72 (80.0%) |
| Total | 1,523 (97.1%) | 1,410 (95.0%) |
Income Below Poverty Among Married-Couple Families in West Fork
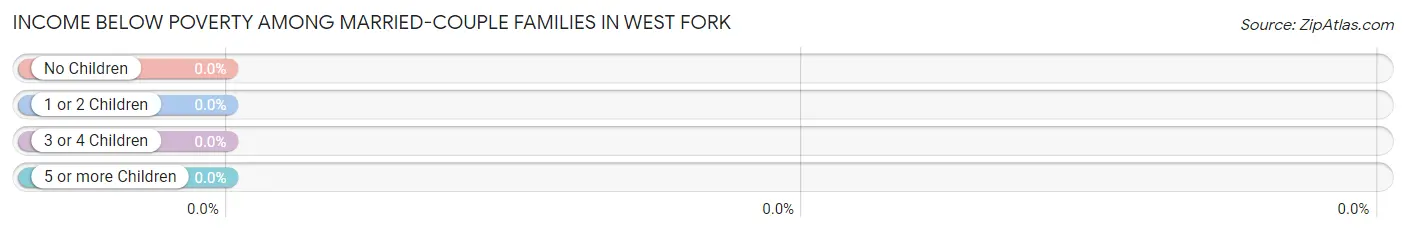
| Children | Above Poverty | Below Poverty |
| No Children | 344 (100.0%) | 0 (0.0%) |
| 1 or 2 Children | 225 (100.0%) | 0 (0.0%) |
| 3 or 4 Children | 24 (100.0%) | 0 (0.0%) |
| 5 or more Children | 0 (0.0%) | 0 (0.0%) |
| Total | 593 (100.0%) | 0 (0.0%) |
Income Below Poverty Among Single-Parent Households in West Fork
According to the poverty data in West Fork, 21.4% or 6 single-father households and 3.1% or 6 single-mother households are living below the poverty line. Among single-father households, those with 3 or 4 children have the highest poverty rate, with 6 households (100.0%) experiencing poverty. Likewise, among single-mother households, those with no children have the highest poverty rate, with 6 households (7.4%) falling below the poverty line.
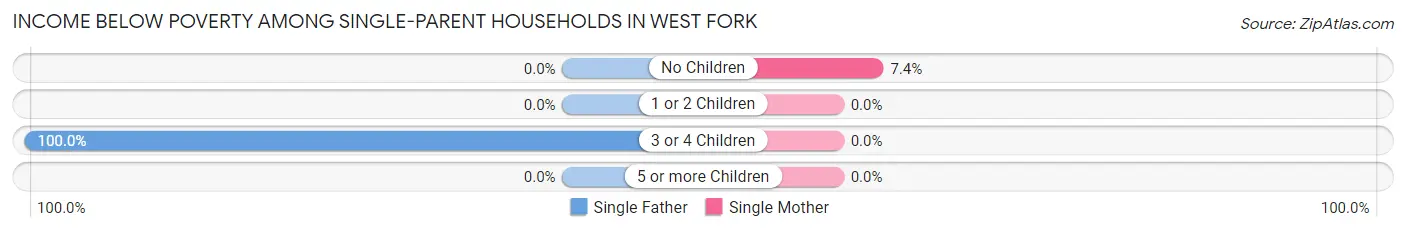
| Children | Single Father | Single Mother |
| No Children | 0 (0.0%) | 6 (7.4%) |
| 1 or 2 Children | 0 (0.0%) | 0 (0.0%) |
| 3 or 4 Children | 6 (100.0%) | 0 (0.0%) |
| 5 or more Children | 0 (0.0%) | 0 (0.0%) |
| Total | 6 (21.4%) | 6 (3.1%) |
Income Below Poverty Among Married-Couple vs Single-Parent Households in West Fork
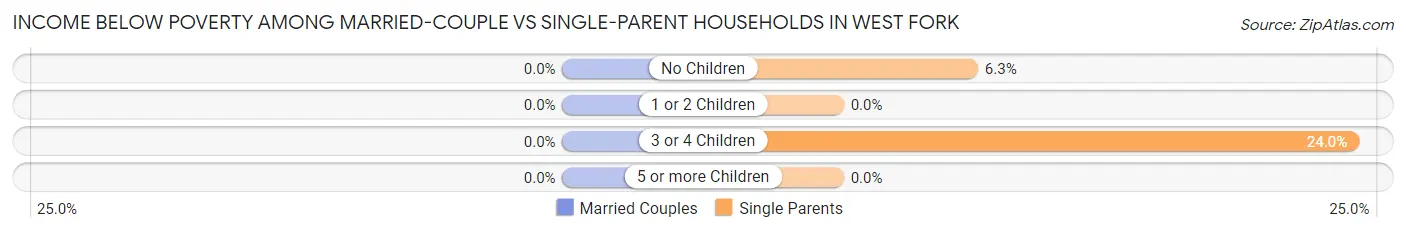
| Children | Married-Couple Families | Single-Parent Households |
| No Children | 0 (0.0%) | 6 (6.2%) |
| 1 or 2 Children | 0 (0.0%) | 0 (0.0%) |
| 3 or 4 Children | 0 (0.0%) | 6 (24.0%) |
| 5 or more Children | 0 (0.0%) | 0 (0.0%) |
| Total | 0 (0.0%) | 12 (5.4%) |
Race in West Fork
The most populous races in West Fork are White / Caucasian (2,565 | 84.0%), Two or more Races (400 | 13.1%), and Hispanic or Latino (92 | 3.0%).
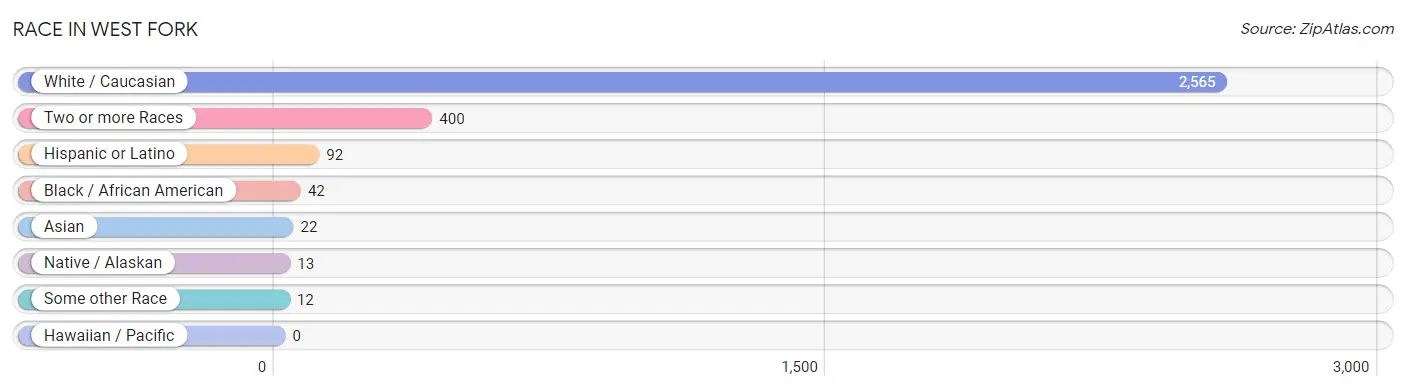
| Race | # Population | % Population |
| Asian | 22 | 0.7% |
| Black / African American | 42 | 1.4% |
| Hawaiian / Pacific | 0 | 0.0% |
| Hispanic or Latino | 92 | 3.0% |
| Native / Alaskan | 13 | 0.4% |
| White / Caucasian | 2,565 | 84.0% |
| Two or more Races | 400 | 13.1% |
| Some other Race | 12 | 0.4% |
| Total | 3,054 | 100.0% |
Ancestry in West Fork
The most populous ancestries reported in West Fork are American (325 | 10.6%), English (303 | 9.9%), Irish (226 | 7.4%), European (204 | 6.7%), and German (193 | 6.3%), together accounting for 41.0% of all West Fork residents.
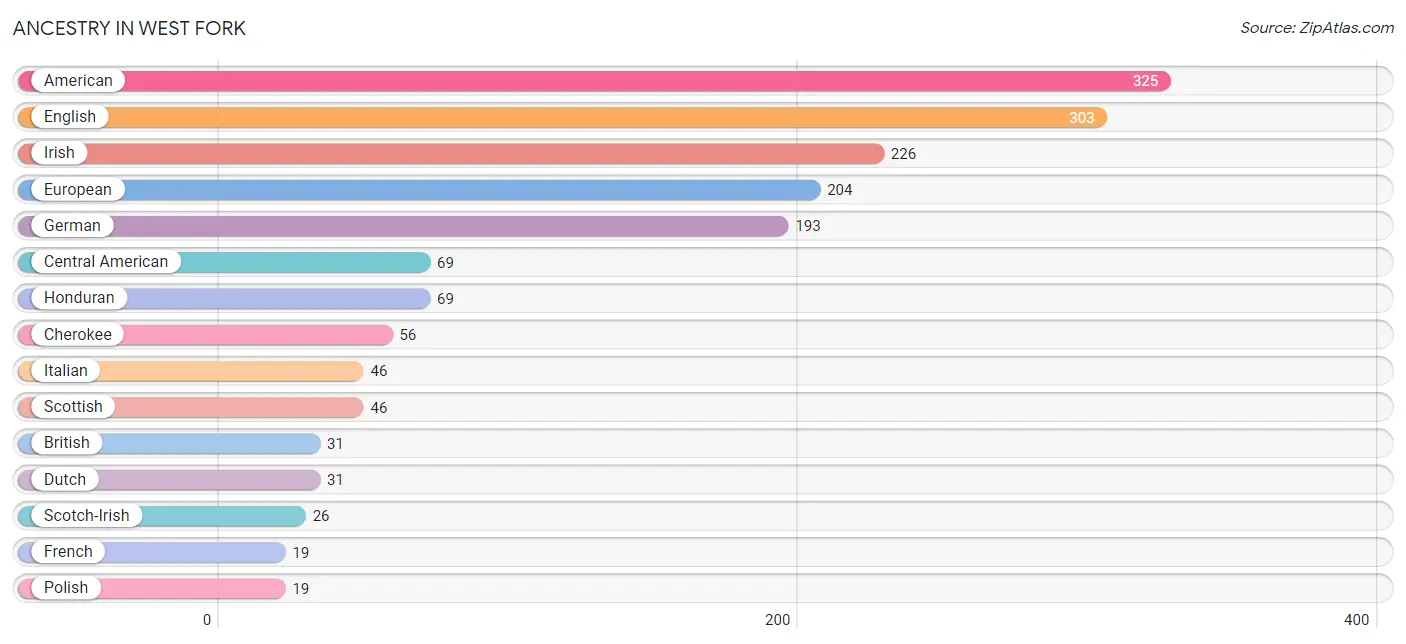
| Ancestry | # Population | % Population |
| American | 325 | 10.6% |
| British | 31 | 1.0% |
| Central American | 69 | 2.3% |
| Cherokee | 56 | 1.8% |
| Czech | 5 | 0.2% |
| Czechoslovakian | 5 | 0.2% |
| Danish | 4 | 0.1% |
| Dutch | 31 | 1.0% |
| English | 303 | 9.9% |
| European | 204 | 6.7% |
| Finnish | 4 | 0.1% |
| French | 19 | 0.6% |
| German | 193 | 6.3% |
| Honduran | 69 | 2.3% |
| Irish | 226 | 7.4% |
| Italian | 46 | 1.5% |
| Korean | 9 | 0.3% |
| Maltese | 7 | 0.2% |
| Mexican | 14 | 0.5% |
| Native Hawaiian | 16 | 0.5% |
| Osage | 6 | 0.2% |
| Polish | 19 | 0.6% |
| Portuguese | 16 | 0.5% |
| Scotch-Irish | 26 | 0.9% |
| Scottish | 46 | 1.5% |
| Shoshone | 3 | 0.1% |
| Slovak | 10 | 0.3% |
| Sri Lankan | 13 | 0.4% |
| Swedish | 6 | 0.2% |
| Welsh | 5 | 0.2% | View All 30 Rows |
Immigrants in West Fork
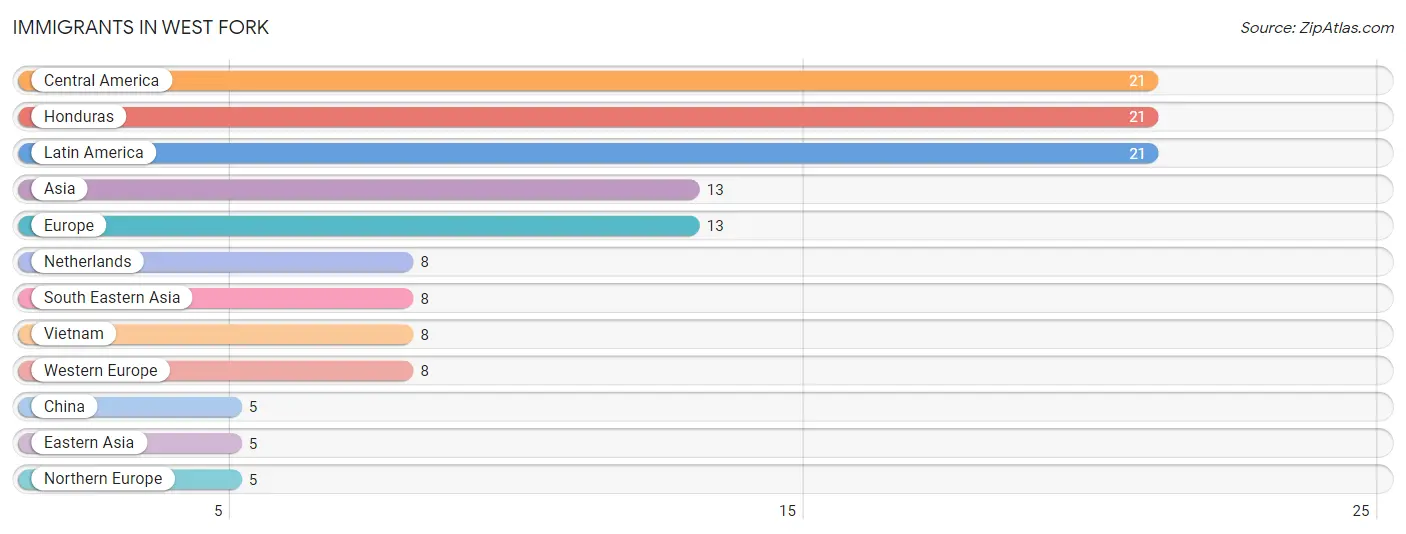
The most numerous immigrant groups reported in West Fork came from Central America (21 | 0.7%), Honduras (21 | 0.7%), Latin America (21 | 0.7%), Asia (13 | 0.4%), and Europe (13 | 0.4%), together accounting for 2.9% of all West Fork residents.
| Immigration Origin | # Population | % Population |
| Asia | 13 | 0.4% |
| Central America | 21 | 0.7% |
| China | 5 | 0.2% |
| Eastern Asia | 5 | 0.2% |
| Europe | 13 | 0.4% |
| Honduras | 21 | 0.7% |
| Latin America | 21 | 0.7% |
| Netherlands | 8 | 0.3% |
| Northern Europe | 5 | 0.2% |
| South Eastern Asia | 8 | 0.3% |
| Vietnam | 8 | 0.3% |
| Western Europe | 8 | 0.3% | View All 12 Rows |
Sex and Age in West Fork
Sex and Age in West Fork
The most populous age groups in West Fork are 15 to 19 Years (182 | 11.6%) for men and 30 to 34 Years (158 | 10.6%) for women.
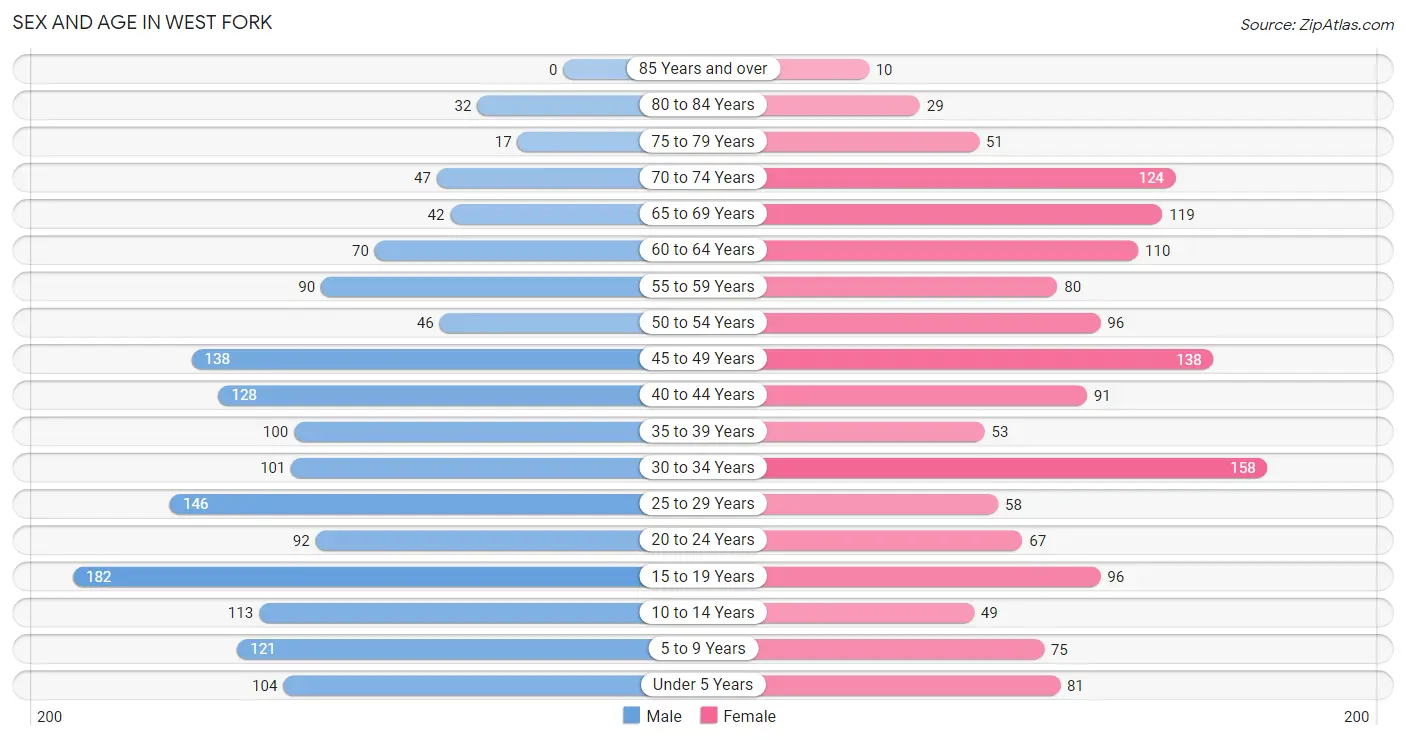
| Age Bracket | Male | Female |
| Under 5 Years | 104 (6.6%) | 81 (5.4%) |
| 5 to 9 Years | 121 (7.7%) | 75 (5.1%) |
| 10 to 14 Years | 113 (7.2%) | 49 (3.3%) |
| 15 to 19 Years | 182 (11.6%) | 96 (6.5%) |
| 20 to 24 Years | 92 (5.9%) | 67 (4.5%) |
| 25 to 29 Years | 146 (9.3%) | 58 (3.9%) |
| 30 to 34 Years | 101 (6.4%) | 158 (10.6%) |
| 35 to 39 Years | 100 (6.4%) | 53 (3.6%) |
| 40 to 44 Years | 128 (8.2%) | 91 (6.1%) |
| 45 to 49 Years | 138 (8.8%) | 138 (9.3%) |
| 50 to 54 Years | 46 (2.9%) | 96 (6.5%) |
| 55 to 59 Years | 90 (5.7%) | 80 (5.4%) |
| 60 to 64 Years | 70 (4.5%) | 110 (7.4%) |
| 65 to 69 Years | 42 (2.7%) | 119 (8.0%) |
| 70 to 74 Years | 47 (3.0%) | 124 (8.4%) |
| 75 to 79 Years | 17 (1.1%) | 51 (3.4%) |
| 80 to 84 Years | 32 (2.0%) | 29 (1.9%) |
| 85 Years and over | 0 (0.0%) | 10 (0.7%) |
| Total | 1,569 (100.0%) | 1,485 (100.0%) |
Families and Households in West Fork
Median Family Size in West Fork
The median family size in West Fork is 3.10 persons per family, with married-couple families (593 | 72.8%) accounting for the largest median family size of 3.13 persons per family. On the other hand, single male/father families (28 | 3.4%) represent the smallest median family size with 2.68 persons per family.
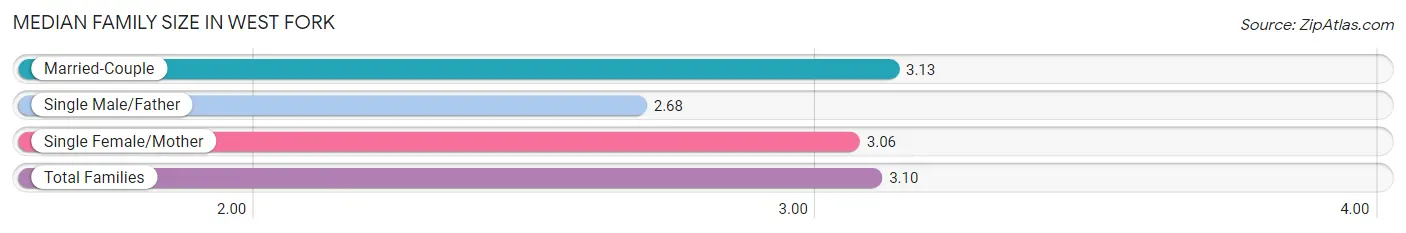
| Family Type | # Families | Family Size |
| Married-Couple | 593 (72.8%) | 3.13 |
| Single Male/Father | 28 (3.4%) | 2.68 |
| Single Female/Mother | 194 (23.8%) | 3.06 |
| Total Families | 815 (100.0%) | 3.10 |
Median Household Size in West Fork
The median household size in West Fork is 2.67 persons per household, with single male/father households (28 | 2.5%) accounting for the largest median household size of 3.5 persons per household. non-family households (327 | 28.6%) represent the smallest median household size with 1.17 persons per household.
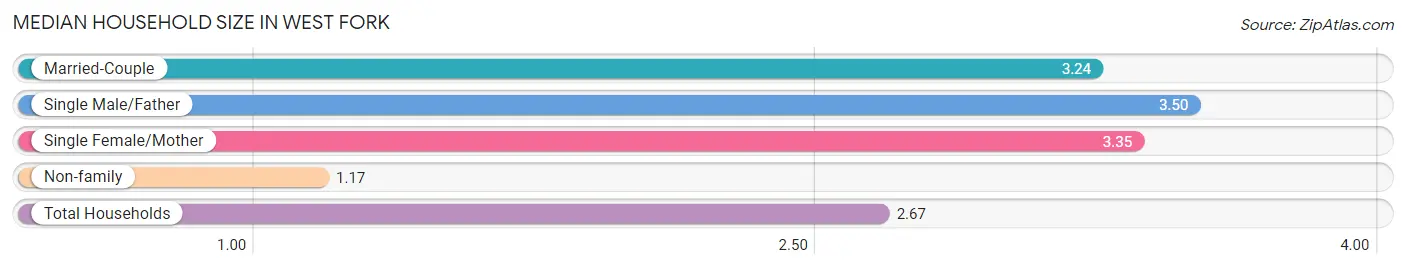
| Household Type | # Households | Household Size |
| Married-Couple | 593 (51.9%) | 3.24 |
| Single Male/Father | 28 (2.5%) | 3.50 |
| Single Female/Mother | 194 (17.0%) | 3.35 |
| Non-family | 327 (28.6%) | 1.17 |
| Total Households | 1,142 (100.0%) | 2.67 |
Household Size by Marriage Status in West Fork
Out of a total of 1,142 households in West Fork, 815 (71.4%) are family households, while 327 (28.6%) are nonfamily households. The most numerous type of family households are 2-person households, comprising 303, and the most common type of nonfamily households are 1-person households, comprising 285.
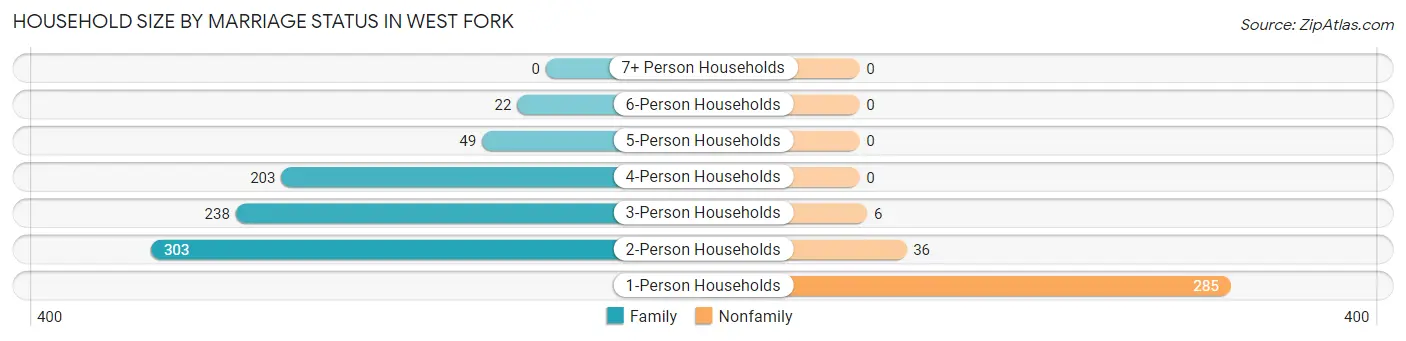
| Household Size | Family Households | Nonfamily Households |
| 1-Person Households | - | 285 (25.0%) |
| 2-Person Households | 303 (26.5%) | 36 (3.2%) |
| 3-Person Households | 238 (20.8%) | 6 (0.5%) |
| 4-Person Households | 203 (17.8%) | 0 (0.0%) |
| 5-Person Households | 49 (4.3%) | 0 (0.0%) |
| 6-Person Households | 22 (1.9%) | 0 (0.0%) |
| 7+ Person Households | 0 (0.0%) | 0 (0.0%) |
| Total | 815 (71.4%) | 327 (28.6%) |
Female Fertility in West Fork
Fertility by Age in West Fork
Average fertility rate in West Fork is 54.0 births per 1,000 women. Women in the age bracket of 20 to 34 years have the highest fertility rate with 110.0 births per 1,000 women. Women in the age bracket of 20 to 34 years acount for 83.8% of all women with births.
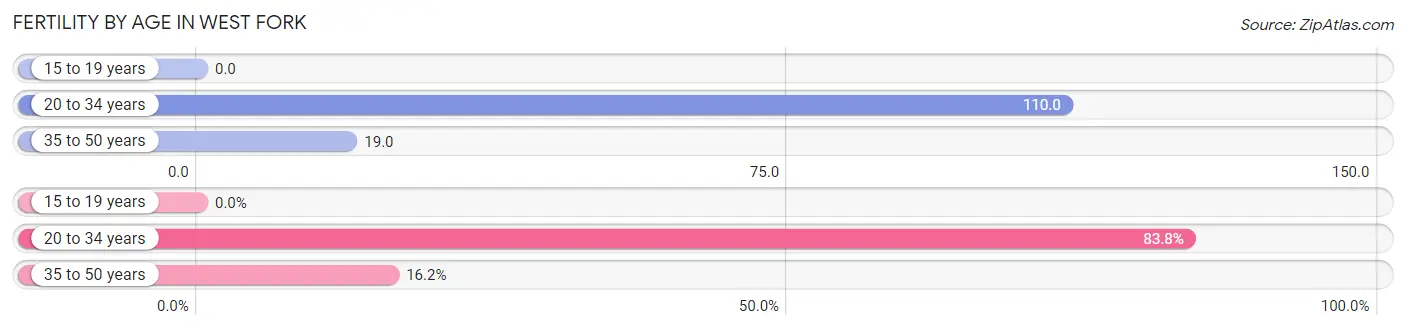
| Age Bracket | Women with Births | Births / 1,000 Women |
| 15 to 19 years | 0 (0.0%) | 0.0 |
| 20 to 34 years | 31 (83.8%) | 110.0 |
| 35 to 50 years | 6 (16.2%) | 19.0 |
| Total | 37 (100.0%) | 54.0 |
Fertility by Age by Marriage Status in West Fork
35.1% of women with births (37) in West Fork are married. The highest percentage of unmarried women with births falls into 35 to 50 years age bracket with 100.0% of them unmarried at the time of birth, while the lowest percentage of unmarried women with births belong to 20 to 34 years age bracket with 58.1% of them unmarried.
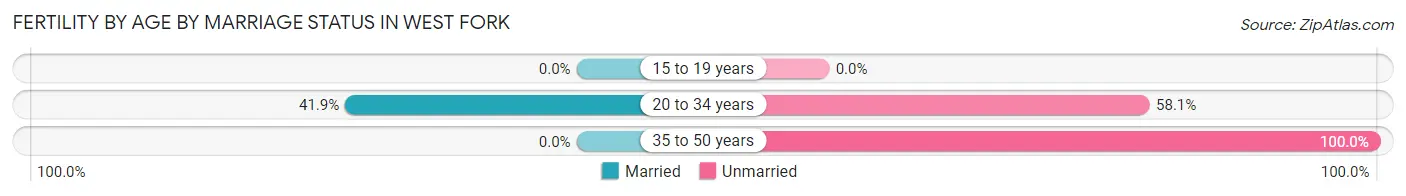
| Age Bracket | Married | Unmarried |
| 15 to 19 years | 0 (0.0%) | 0 (0.0%) |
| 20 to 34 years | 13 (41.9%) | 18 (58.1%) |
| 35 to 50 years | 0 (0.0%) | 6 (100.0%) |
| Total | 13 (35.1%) | 24 (64.9%) |
Fertility by Education in West Fork
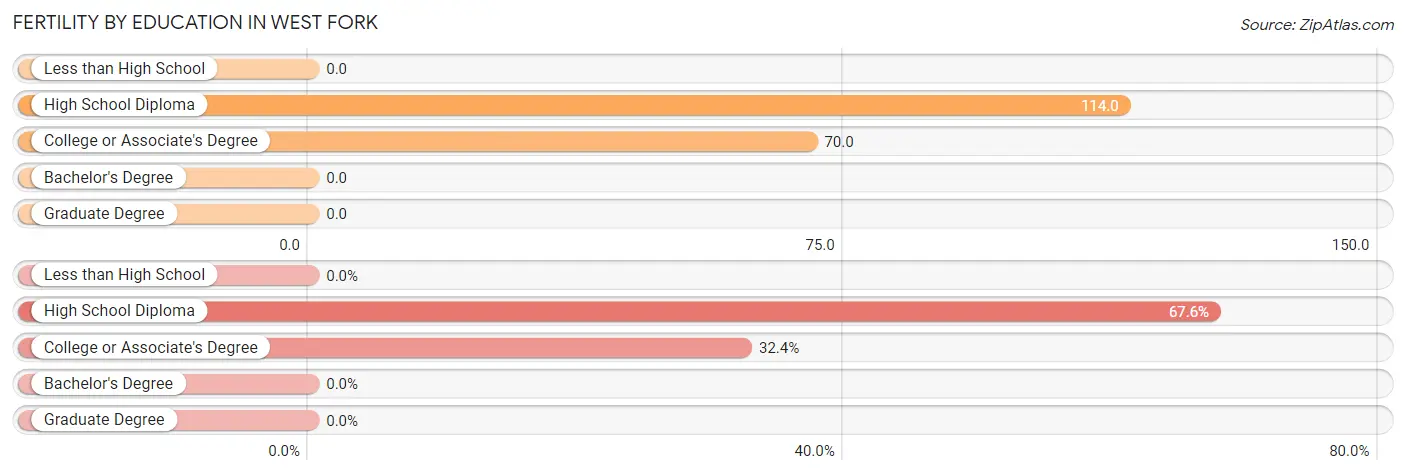
| Educational Attainment | Women with Births | Births / 1,000 Women |
| Less than High School | 0 (0.0%) | 0.0 |
| High School Diploma | 25 (67.6%) | 114.0 |
| College or Associate's Degree | 12 (32.4%) | 70.0 |
| Bachelor's Degree | 0 (0.0%) | 0.0 |
| Graduate Degree | 0 (0.0%) | 0.0 |
| Total | 37 (100.0%) | 54.0 |
Fertility by Education by Marriage Status in West Fork
64.9% of women with births in West Fork are unmarried. Women with the educational attainment of college or associate's degree are most likely to be married with 50.0% of them married at childbirth, while women with the educational attainment of high school diploma are least likely to be married with 72.0% of them unmarried at childbirth.
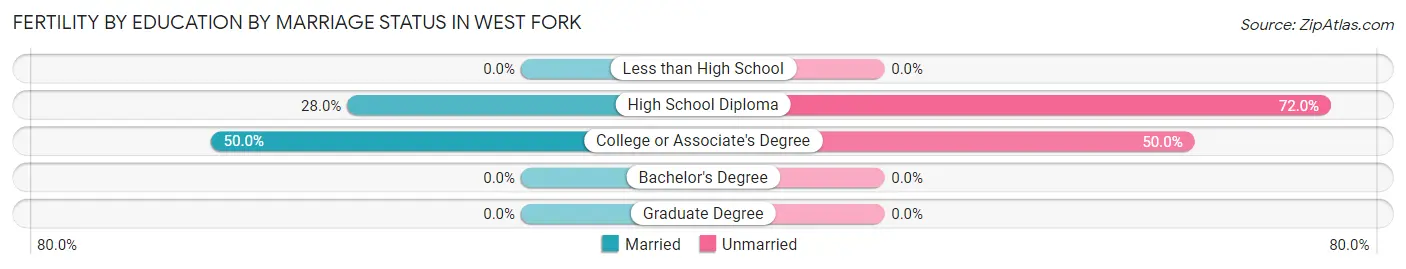
| Educational Attainment | Married | Unmarried |
| Less than High School | 0 (0.0%) | 0 (0.0%) |
| High School Diploma | 7 (28.0%) | 18 (72.0%) |
| College or Associate's Degree | 6 (50.0%) | 6 (50.0%) |
| Bachelor's Degree | 0 (0.0%) | 0 (0.0%) |
| Graduate Degree | 0 (0.0%) | 0 (0.0%) |
| Total | 13 (35.1%) | 24 (64.9%) |
Employment Characteristics in West Fork
Employment by Class of Employer in West Fork
Among the 1,546 employed individuals in West Fork, private company employees (1,009 | 65.3%), local government employees (191 | 12.3%), and self-employed (not incorporated) (119 | 7.7%) make up the most common classes of employment.
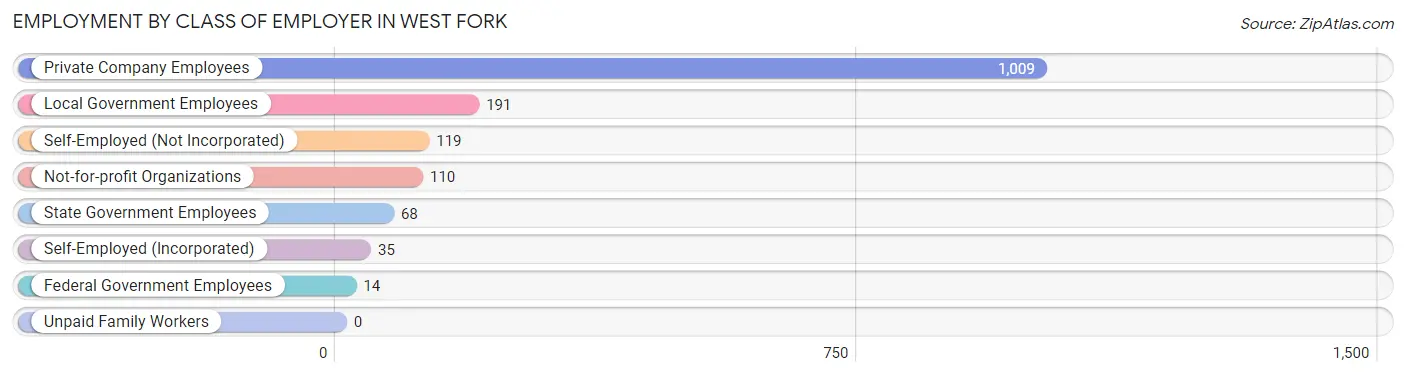
| Employer Class | # Employees | % Employees |
| Private Company Employees | 1,009 | 65.3% |
| Self-Employed (Incorporated) | 35 | 2.3% |
| Self-Employed (Not Incorporated) | 119 | 7.7% |
| Not-for-profit Organizations | 110 | 7.1% |
| Local Government Employees | 191 | 12.3% |
| State Government Employees | 68 | 4.4% |
| Federal Government Employees | 14 | 0.9% |
| Unpaid Family Workers | 0 | 0.0% |
| Total | 1,546 | 100.0% |
Employment Status by Age in West Fork
According to the labor force statistics for West Fork, out of the total population over 16 years of age (2,426), 65.9% or 1,599 individuals are in the labor force, with 2.9% or 46 of them unemployed. The age group with the highest labor force participation rate is 20 to 24 years, with 95.0% or 151 individuals in the labor force. Within the labor force, the 25 to 29 years age range has the highest percentage of unemployed individuals, with 17.7% or 34 of them being unemployed.
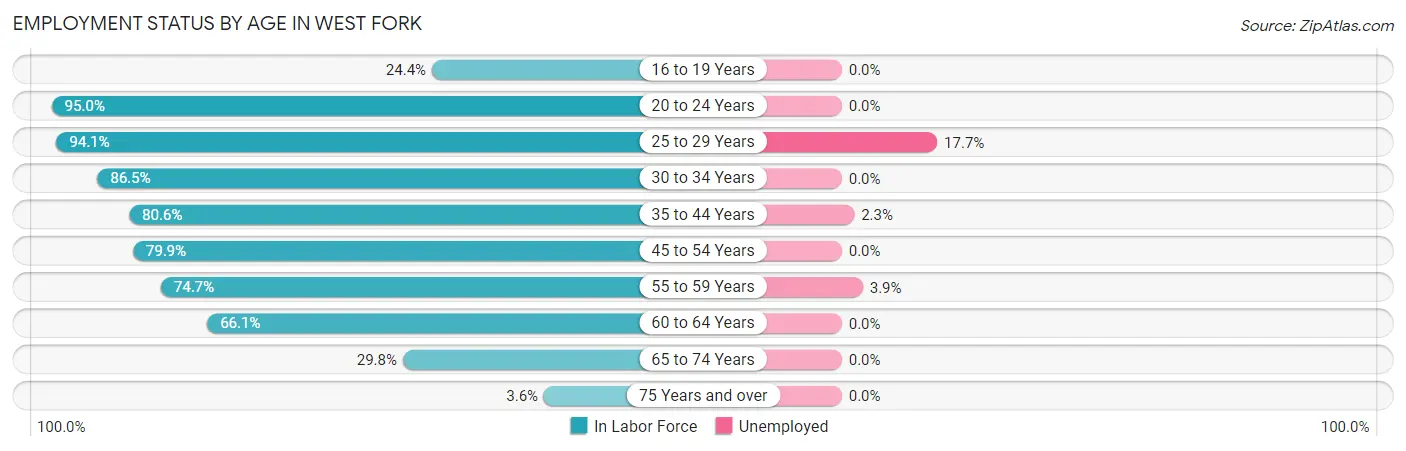
| Age Bracket | In Labor Force | Unemployed |
| 16 to 19 Years | 47 (24.4%) | 0 (0.0%) |
| 20 to 24 Years | 151 (95.0%) | 0 (0.0%) |
| 25 to 29 Years | 192 (94.1%) | 34 (17.7%) |
| 30 to 34 Years | 224 (86.5%) | 0 (0.0%) |
| 35 to 44 Years | 300 (80.6%) | 7 (2.3%) |
| 45 to 54 Years | 334 (79.9%) | 0 (0.0%) |
| 55 to 59 Years | 127 (74.7%) | 5 (3.9%) |
| 60 to 64 Years | 119 (66.1%) | 0 (0.0%) |
| 65 to 74 Years | 99 (29.8%) | 0 (0.0%) |
| 75 Years and over | 5 (3.6%) | 0 (0.0%) |
| Total | 1,599 (65.9%) | 46 (2.9%) |
Employment Status by Educational Attainment in West Fork
According to labor force statistics for West Fork, 80.8% of individuals (1,295) out of the total population between 25 and 64 years of age (1,603) are in the labor force, with 3.5% or 45 of them being unemployed. The group with the highest labor force participation rate are those with the educational attainment of bachelor's degree or higher, with 85.3% or 332 individuals in the labor force. Within the labor force, individuals with college / associate degree education have the highest percentage of unemployment, with 7.7% or 34 of them being unemployed.
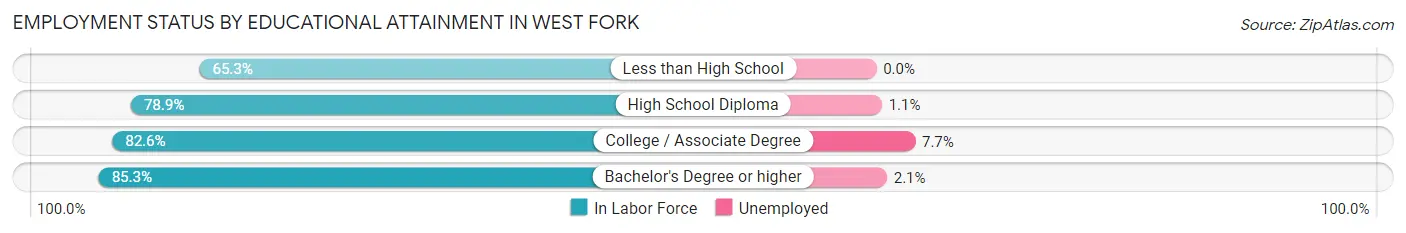
| Educational Attainment | In Labor Force | Unemployed |
| Less than High School | 64 (65.3%) | 0 (0.0%) |
| High School Diploma | 459 (78.9%) | 6 (1.1%) |
| College / Associate Degree | 441 (82.6%) | 41 (7.7%) |
| Bachelor's Degree or higher | 332 (85.3%) | 8 (2.1%) |
| Total | 1,295 (80.8%) | 56 (3.5%) |
Employment Occupations by Sex in West Fork
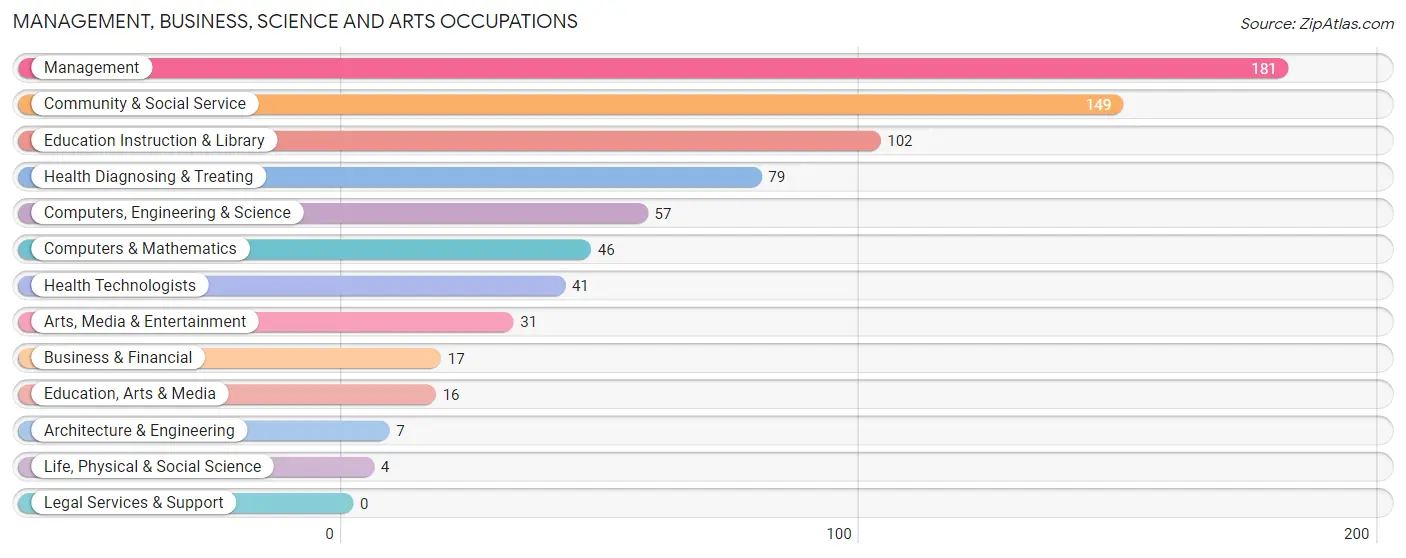
Management, Business, Science and Arts Occupations
The most common Management, Business, Science and Arts occupations in West Fork are Management (181 | 11.7%), Community & Social Service (149 | 9.6%), Education Instruction & Library (102 | 6.6%), Health Diagnosing & Treating (79 | 5.1%), and Computers, Engineering & Science (57 | 3.7%).
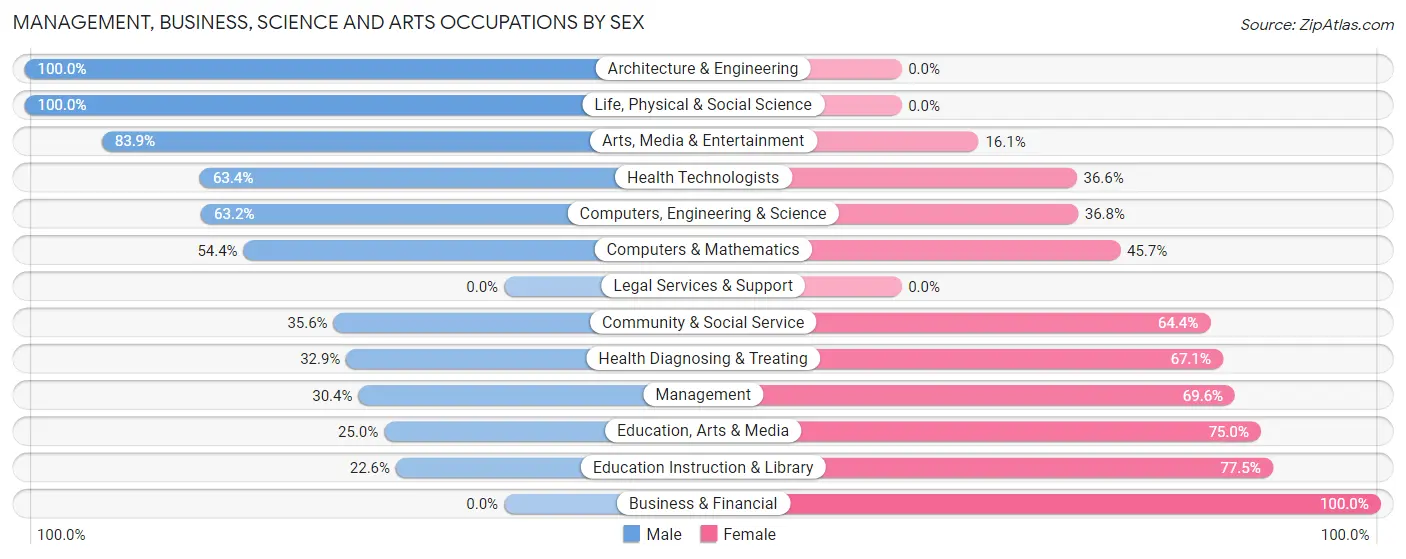
Management, Business, Science and Arts Occupations by Sex
Within the Management, Business, Science and Arts occupations in West Fork, the most male-oriented occupations are Architecture & Engineering (100.0%), Life, Physical & Social Science (100.0%), and Arts, Media & Entertainment (83.9%), while the most female-oriented occupations are Business & Financial (100.0%), Education Instruction & Library (77.4%), and Education, Arts & Media (75.0%).
| Occupation | Male | Female |
| Management | 55 (30.4%) | 126 (69.6%) |
| Business & Financial | 0 (0.0%) | 17 (100.0%) |
| Computers, Engineering & Science | 36 (63.2%) | 21 (36.8%) |
| Computers & Mathematics | 25 (54.3%) | 21 (45.7%) |
| Architecture & Engineering | 7 (100.0%) | 0 (0.0%) |
| Life, Physical & Social Science | 4 (100.0%) | 0 (0.0%) |
| Community & Social Service | 53 (35.6%) | 96 (64.4%) |
| Education, Arts & Media | 4 (25.0%) | 12 (75.0%) |
| Legal Services & Support | 0 (0.0%) | 0 (0.0%) |
| Education Instruction & Library | 23 (22.6%) | 79 (77.4%) |
| Arts, Media & Entertainment | 26 (83.9%) | 5 (16.1%) |
| Health Diagnosing & Treating | 26 (32.9%) | 53 (67.1%) |
| Health Technologists | 26 (63.4%) | 15 (36.6%) |
| Total (Category) | 170 (35.2%) | 313 (64.8%) |
| Total (Overall) | 833 (53.7%) | 719 (46.3%) |
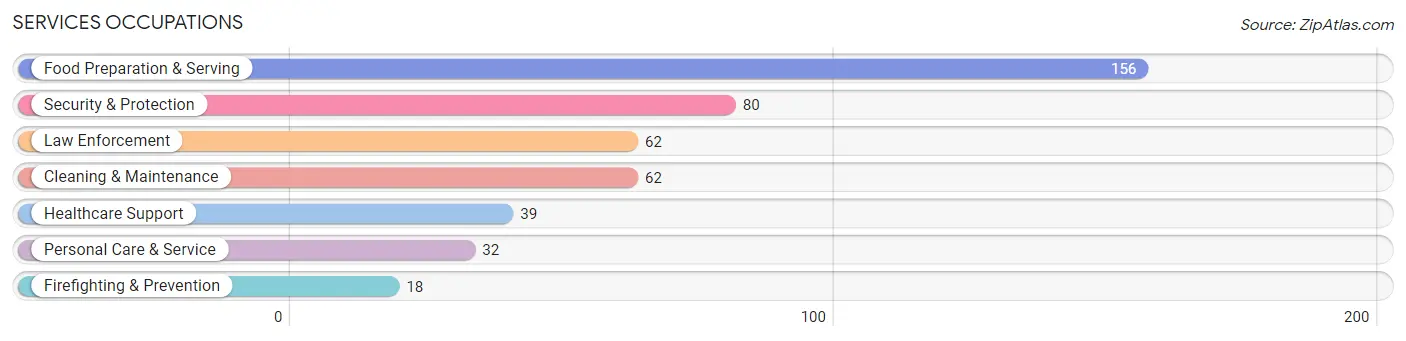
Services Occupations
The most common Services occupations in West Fork are Food Preparation & Serving (156 | 10.1%), Security & Protection (80 | 5.1%), Law Enforcement (62 | 4.0%), Cleaning & Maintenance (62 | 4.0%), and Healthcare Support (39 | 2.5%).
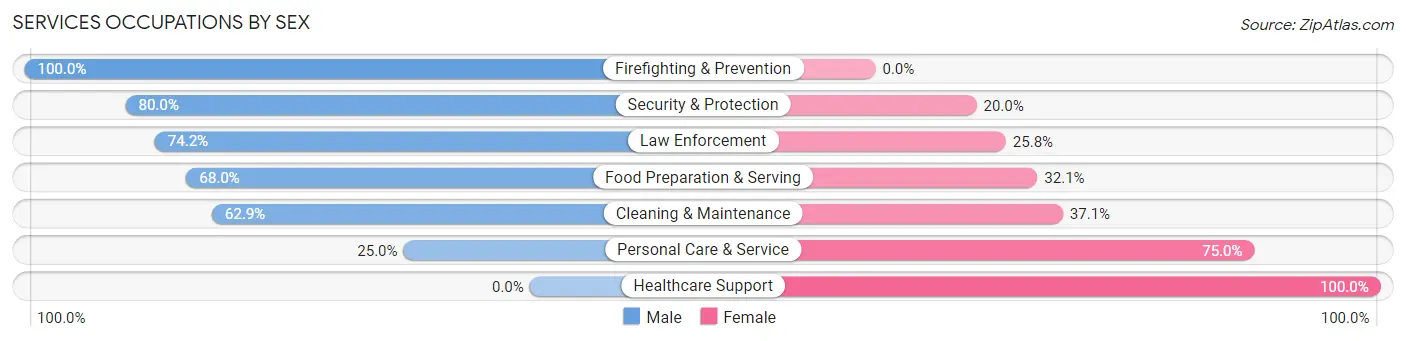
Services Occupations by Sex
Within the Services occupations in West Fork, the most male-oriented occupations are Firefighting & Prevention (100.0%), Security & Protection (80.0%), and Law Enforcement (74.2%), while the most female-oriented occupations are Healthcare Support (100.0%), Personal Care & Service (75.0%), and Cleaning & Maintenance (37.1%).
| Occupation | Male | Female |
| Healthcare Support | 0 (0.0%) | 39 (100.0%) |
| Security & Protection | 64 (80.0%) | 16 (20.0%) |
| Firefighting & Prevention | 18 (100.0%) | 0 (0.0%) |
| Law Enforcement | 46 (74.2%) | 16 (25.8%) |
| Food Preparation & Serving | 106 (67.9%) | 50 (32.1%) |
| Cleaning & Maintenance | 39 (62.9%) | 23 (37.1%) |
| Personal Care & Service | 8 (25.0%) | 24 (75.0%) |
| Total (Category) | 217 (58.8%) | 152 (41.2%) |
| Total (Overall) | 833 (53.7%) | 719 (46.3%) |
Sales and Office Occupations
The most common Sales and Office occupations in West Fork are Office & Administration (162 | 10.4%), and Sales & Related (100 | 6.4%).
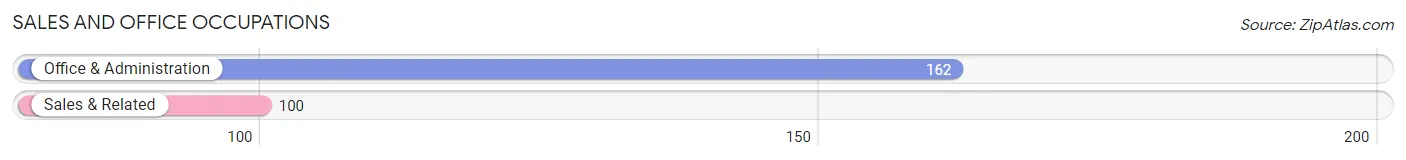
Sales and Office Occupations by Sex
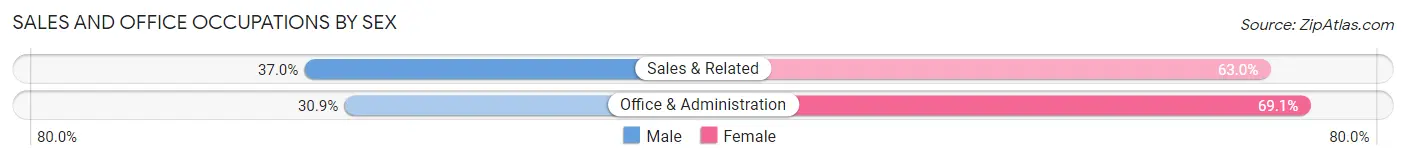
| Occupation | Male | Female |
| Sales & Related | 37 (37.0%) | 63 (63.0%) |
| Office & Administration | 50 (30.9%) | 112 (69.1%) |
| Total (Category) | 87 (33.2%) | 175 (66.8%) |
| Total (Overall) | 833 (53.7%) | 719 (46.3%) |
Natural Resources, Construction and Maintenance Occupations
The most common Natural Resources, Construction and Maintenance occupations in West Fork are Construction & Extraction (133 | 8.6%), and Installation, Maintenance & Repair (63 | 4.1%).
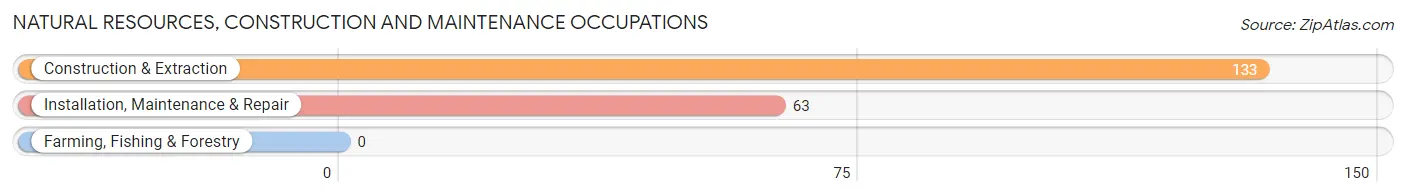
Natural Resources, Construction and Maintenance Occupations by Sex
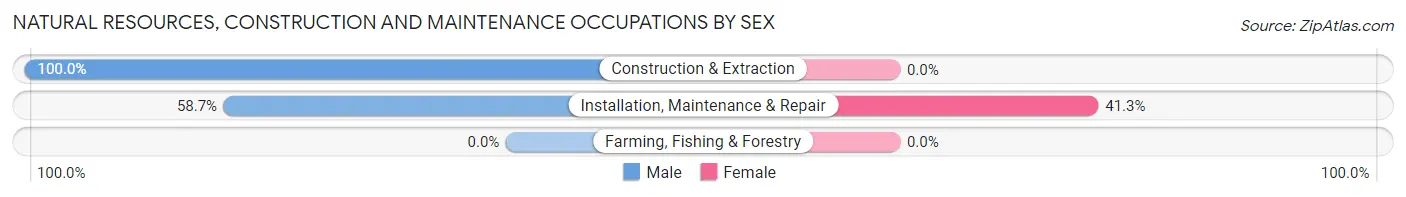
| Occupation | Male | Female |
| Farming, Fishing & Forestry | 0 (0.0%) | 0 (0.0%) |
| Construction & Extraction | 133 (100.0%) | 0 (0.0%) |
| Installation, Maintenance & Repair | 37 (58.7%) | 26 (41.3%) |
| Total (Category) | 170 (86.7%) | 26 (13.3%) |
| Total (Overall) | 833 (53.7%) | 719 (46.3%) |
Production, Transportation and Moving Occupations
The most common Production, Transportation and Moving occupations in West Fork are Transportation (103 | 6.6%), Production (93 | 6.0%), and Material Moving (46 | 3.0%).
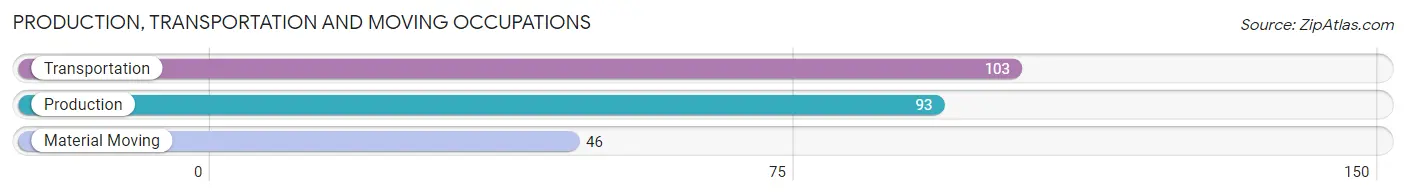
Production, Transportation and Moving Occupations by Sex
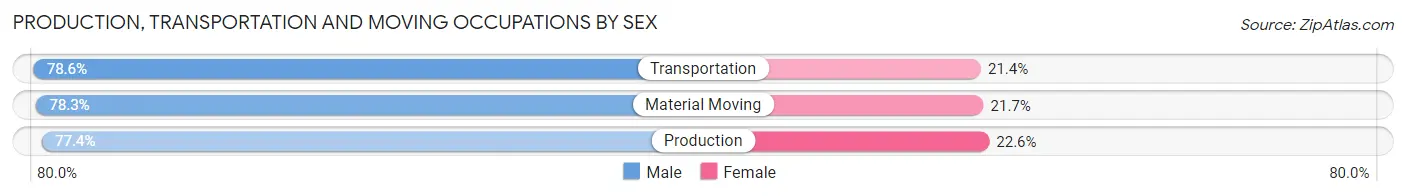
| Occupation | Male | Female |
| Production | 72 (77.4%) | 21 (22.6%) |
| Transportation | 81 (78.6%) | 22 (21.4%) |
| Material Moving | 36 (78.3%) | 10 (21.7%) |
| Total (Category) | 189 (78.1%) | 53 (21.9%) |
| Total (Overall) | 833 (53.7%) | 719 (46.3%) |
Employment Industries by Sex in West Fork
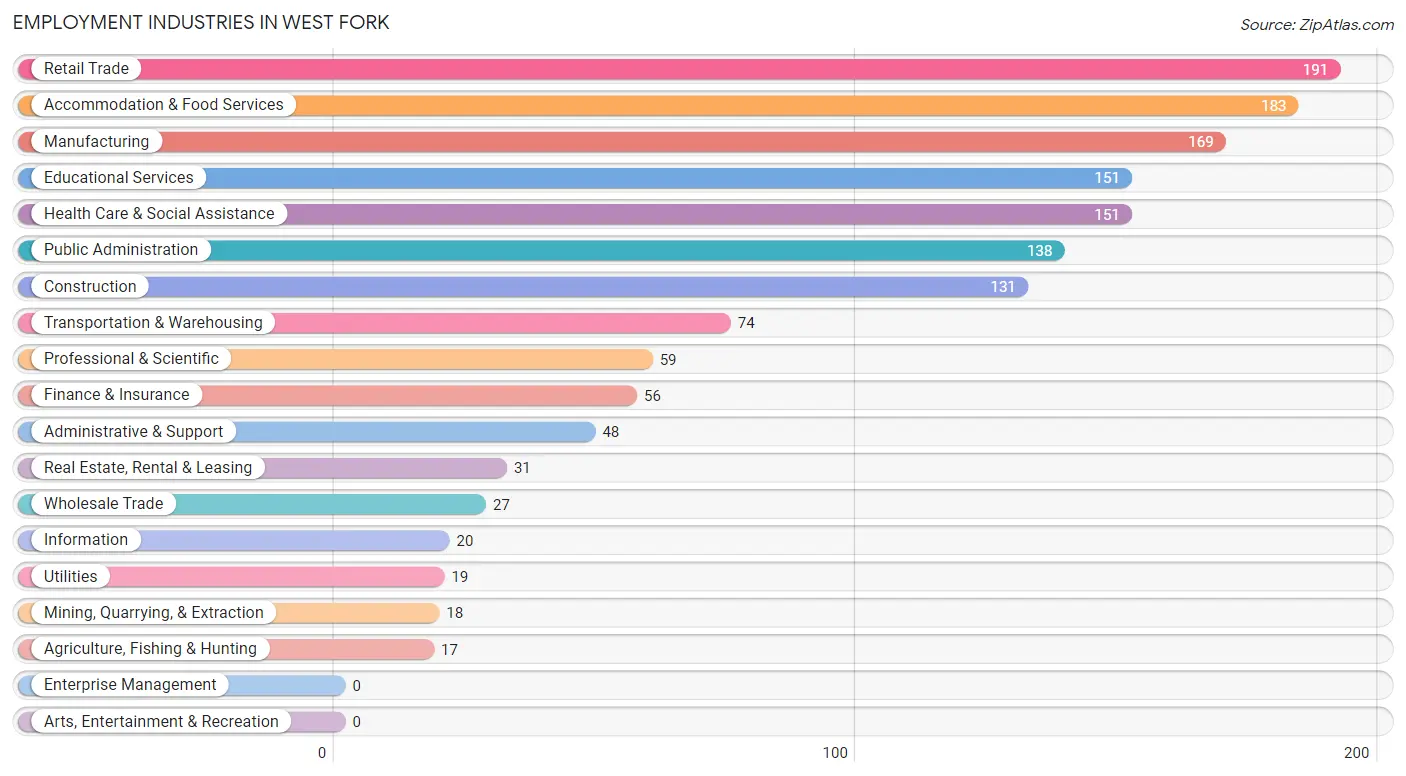
Employment Industries in West Fork
The major employment industries in West Fork include Retail Trade (191 | 12.3%), Accommodation & Food Services (183 | 11.8%), Manufacturing (169 | 10.9%), Educational Services (151 | 9.7%), and Health Care & Social Assistance (151 | 9.7%).
Employment Industries by Sex in West Fork
The West Fork industries that see more men than women are Agriculture, Fishing & Hunting (100.0%), Mining, Quarrying, & Extraction (100.0%), and Wholesale Trade (100.0%), whereas the industries that tend to have a higher number of women are Finance & Insurance (100.0%), Real Estate, Rental & Leasing (100.0%), and Health Care & Social Assistance (90.1%).
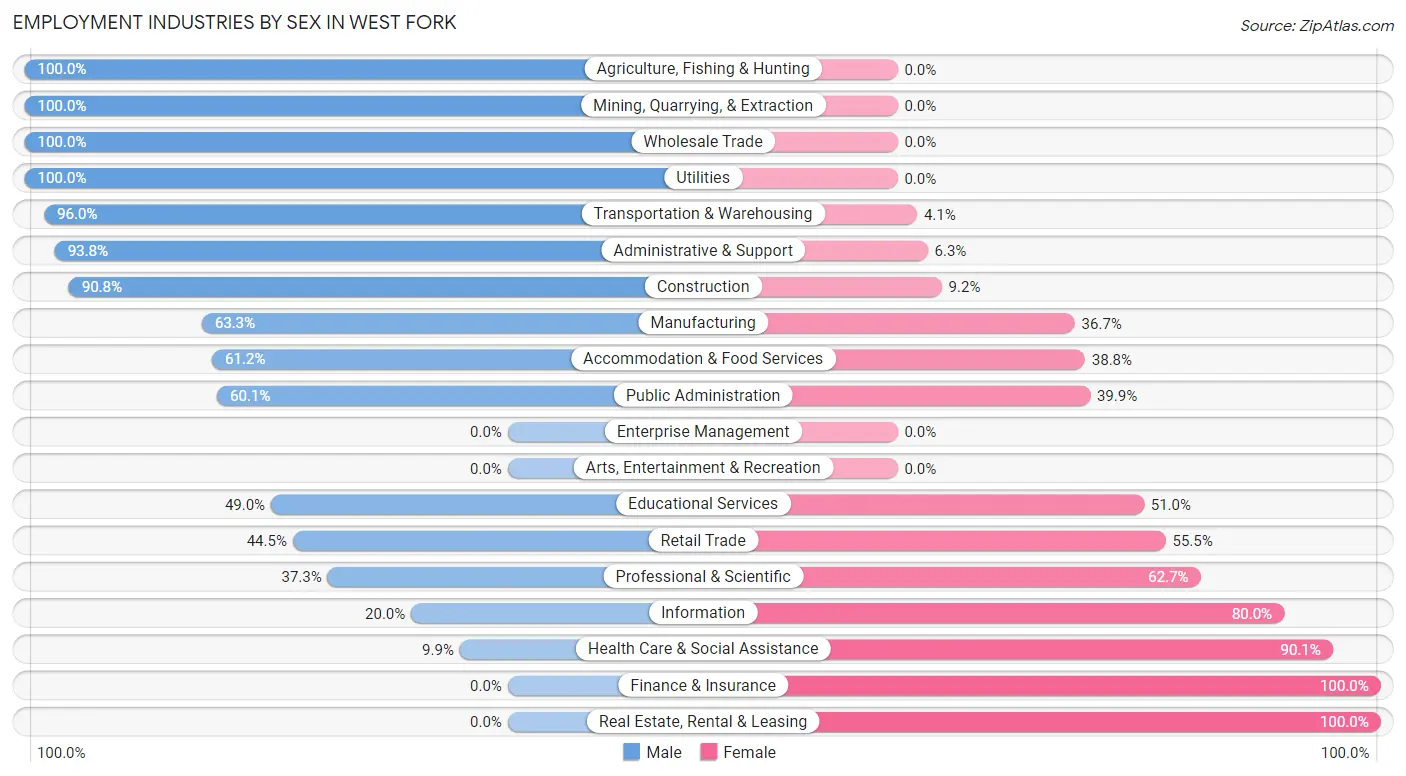
| Industry | Male | Female |
| Agriculture, Fishing & Hunting | 17 (100.0%) | 0 (0.0%) |
| Mining, Quarrying, & Extraction | 18 (100.0%) | 0 (0.0%) |
| Construction | 119 (90.8%) | 12 (9.2%) |
| Manufacturing | 107 (63.3%) | 62 (36.7%) |
| Wholesale Trade | 27 (100.0%) | 0 (0.0%) |
| Retail Trade | 85 (44.5%) | 106 (55.5%) |
| Transportation & Warehousing | 71 (96.0%) | 3 (4.1%) |
| Utilities | 19 (100.0%) | 0 (0.0%) |
| Information | 4 (20.0%) | 16 (80.0%) |
| Finance & Insurance | 0 (0.0%) | 56 (100.0%) |
| Real Estate, Rental & Leasing | 0 (0.0%) | 31 (100.0%) |
| Professional & Scientific | 22 (37.3%) | 37 (62.7%) |
| Enterprise Management | 0 (0.0%) | 0 (0.0%) |
| Administrative & Support | 45 (93.8%) | 3 (6.2%) |
| Educational Services | 74 (49.0%) | 77 (51.0%) |
| Health Care & Social Assistance | 15 (9.9%) | 136 (90.1%) |
| Arts, Entertainment & Recreation | 0 (0.0%) | 0 (0.0%) |
| Accommodation & Food Services | 112 (61.2%) | 71 (38.8%) |
| Public Administration | 83 (60.1%) | 55 (39.9%) |
| Total | 833 (53.7%) | 719 (46.3%) |
Education in West Fork
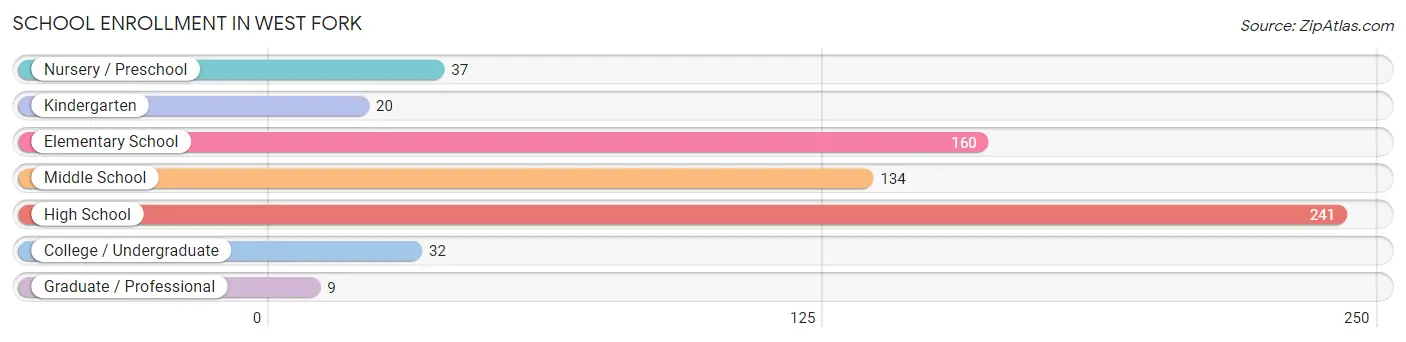
School Enrollment in West Fork
The most common levels of schooling among the 633 students in West Fork are high school (241 | 38.1%), elementary school (160 | 25.3%), and middle school (134 | 21.2%).
| School Level | # Students | % Students |
| Nursery / Preschool | 37 | 5.9% |
| Kindergarten | 20 | 3.2% |
| Elementary School | 160 | 25.3% |
| Middle School | 134 | 21.2% |
| High School | 241 | 38.1% |
| College / Undergraduate | 32 | 5.1% |
| Graduate / Professional | 9 | 1.4% |
| Total | 633 | 100.0% |
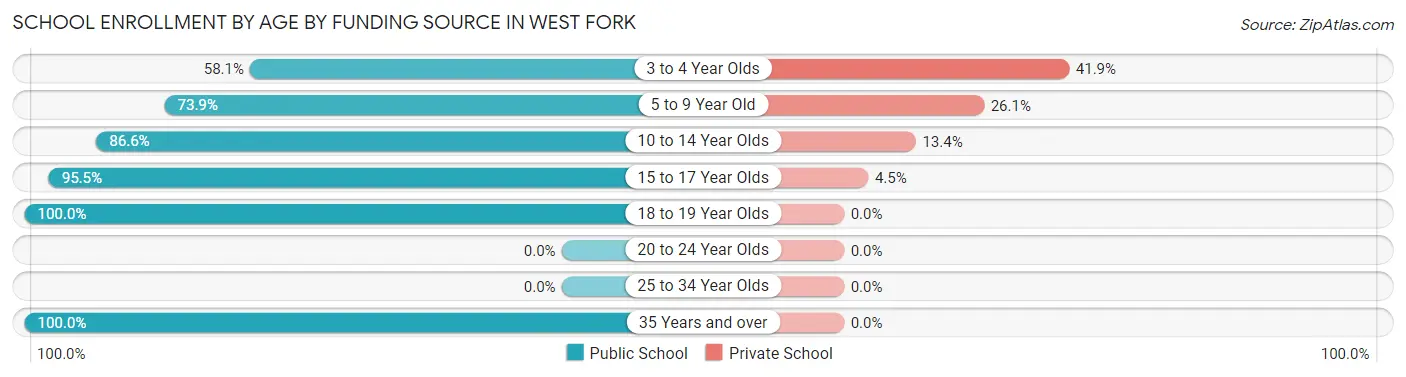
School Enrollment by Age by Funding Source in West Fork
Out of a total of 633 students who are enrolled in schools in West Fork, 90 (14.2%) attend a private institution, while the remaining 543 (85.8%) are enrolled in public schools. The age group of 3 to 4 year olds has the highest likelihood of being enrolled in private schools, with 13 (41.9% in the age bracket) enrolled. Conversely, the age group of 18 to 19 year olds has the lowest likelihood of being enrolled in a private school, with 75 (100.0% in the age bracket) attending a public institution.
| Age Bracket | Public School | Private School |
| 3 to 4 Year Olds | 18 (58.1%) | 13 (41.9%) |
| 5 to 9 Year Old | 136 (73.9%) | 48 (26.1%) |
| 10 to 14 Year Olds | 136 (86.6%) | 21 (13.4%) |
| 15 to 17 Year Olds | 169 (95.5%) | 8 (4.5%) |
| 18 to 19 Year Olds | 75 (100.0%) | 0 (0.0%) |
| 20 to 24 Year Olds | 0 (0.0%) | 0 (0.0%) |
| 25 to 34 Year Olds | 0 (0.0%) | 0 (0.0%) |
| 35 Years and over | 9 (100.0%) | 0 (0.0%) |
| Total | 543 (85.8%) | 90 (14.2%) |
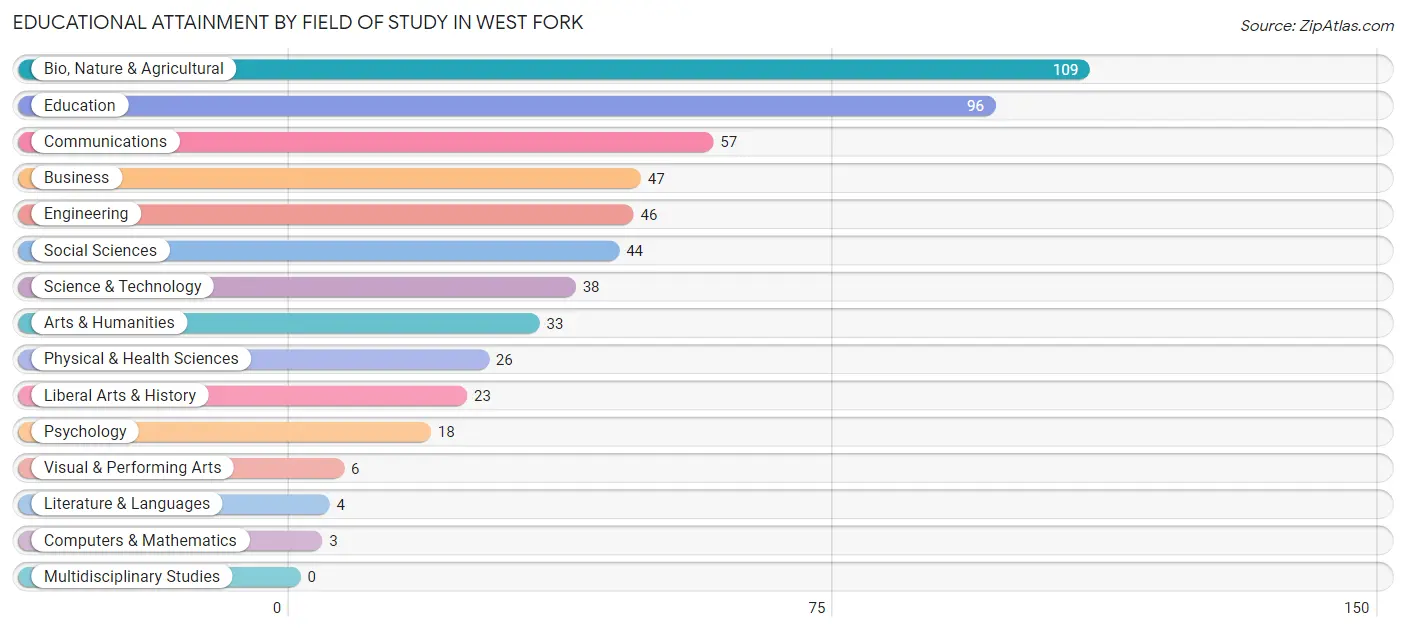
Educational Attainment by Field of Study in West Fork
Bio, nature & agricultural (109 | 19.8%), education (96 | 17.4%), communications (57 | 10.4%), business (47 | 8.6%), and engineering (46 | 8.4%) are the most common fields of study among 550 individuals in West Fork who have obtained a bachelor's degree or higher.
| Field of Study | # Graduates | % Graduates |
| Computers & Mathematics | 3 | 0.5% |
| Bio, Nature & Agricultural | 109 | 19.8% |
| Physical & Health Sciences | 26 | 4.7% |
| Psychology | 18 | 3.3% |
| Social Sciences | 44 | 8.0% |
| Engineering | 46 | 8.4% |
| Multidisciplinary Studies | 0 | 0.0% |
| Science & Technology | 38 | 6.9% |
| Business | 47 | 8.6% |
| Education | 96 | 17.4% |
| Literature & Languages | 4 | 0.7% |
| Liberal Arts & History | 23 | 4.2% |
| Visual & Performing Arts | 6 | 1.1% |
| Communications | 57 | 10.4% |
| Arts & Humanities | 33 | 6.0% |
| Total | 550 | 100.0% |
Transportation & Commute in West Fork
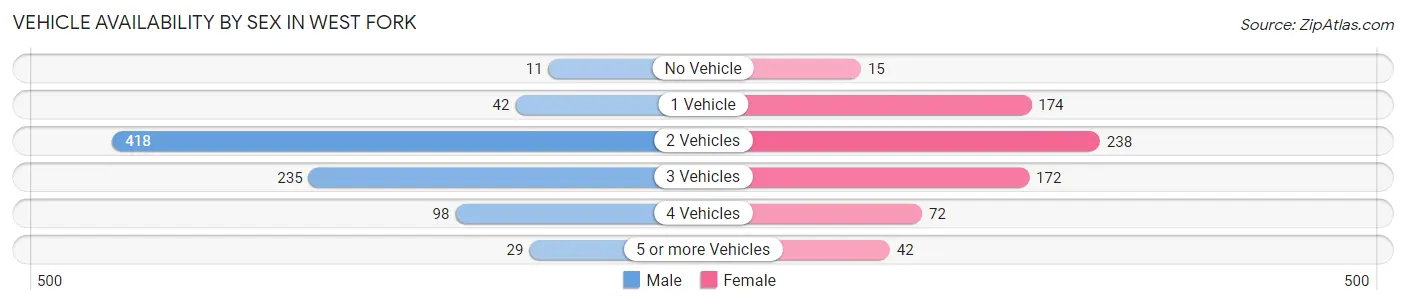
Vehicle Availability by Sex in West Fork
The most prevalent vehicle ownership categories in West Fork are males with 2 vehicles (418, accounting for 50.2%) and females with 2 vehicles (238, making up 58.6%).
| Vehicles Available | Male | Female |
| No Vehicle | 11 (1.3%) | 15 (2.1%) |
| 1 Vehicle | 42 (5.0%) | 174 (24.4%) |
| 2 Vehicles | 418 (50.2%) | 238 (33.4%) |
| 3 Vehicles | 235 (28.2%) | 172 (24.1%) |
| 4 Vehicles | 98 (11.8%) | 72 (10.1%) |
| 5 or more Vehicles | 29 (3.5%) | 42 (5.9%) |
| Total | 833 (100.0%) | 713 (100.0%) |
Commute Time in West Fork
The most frequently occuring commute durations in West Fork are 20 to 24 minutes (333 commuters, 22.6%), 15 to 19 minutes (265 commuters, 18.0%), and 30 to 34 minutes (157 commuters, 10.6%).
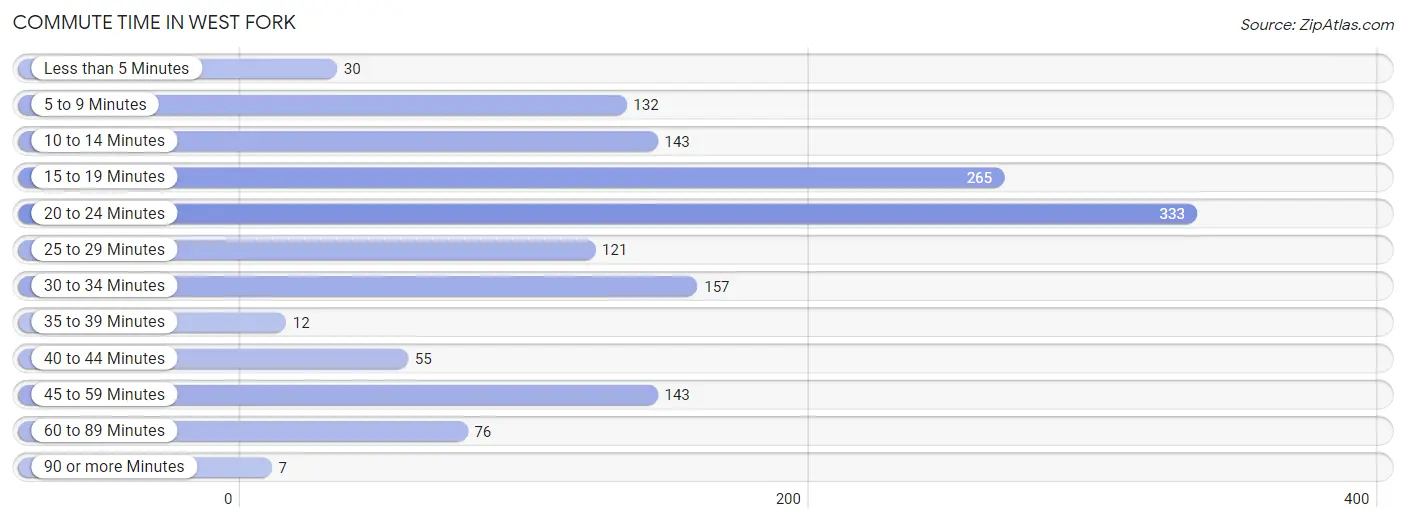
| Commute Time | # Commuters | % Commuters |
| Less than 5 Minutes | 30 | 2.0% |
| 5 to 9 Minutes | 132 | 9.0% |
| 10 to 14 Minutes | 143 | 9.7% |
| 15 to 19 Minutes | 265 | 18.0% |
| 20 to 24 Minutes | 333 | 22.6% |
| 25 to 29 Minutes | 121 | 8.2% |
| 30 to 34 Minutes | 157 | 10.6% |
| 35 to 39 Minutes | 12 | 0.8% |
| 40 to 44 Minutes | 55 | 3.7% |
| 45 to 59 Minutes | 143 | 9.7% |
| 60 to 89 Minutes | 76 | 5.2% |
| 90 or more Minutes | 7 | 0.5% |
Commute Time by Sex in West Fork
The most common commute times in West Fork are 15 to 19 minutes (152 commuters, 18.8%) for males and 20 to 24 minutes (187 commuters, 28.2%) for females.
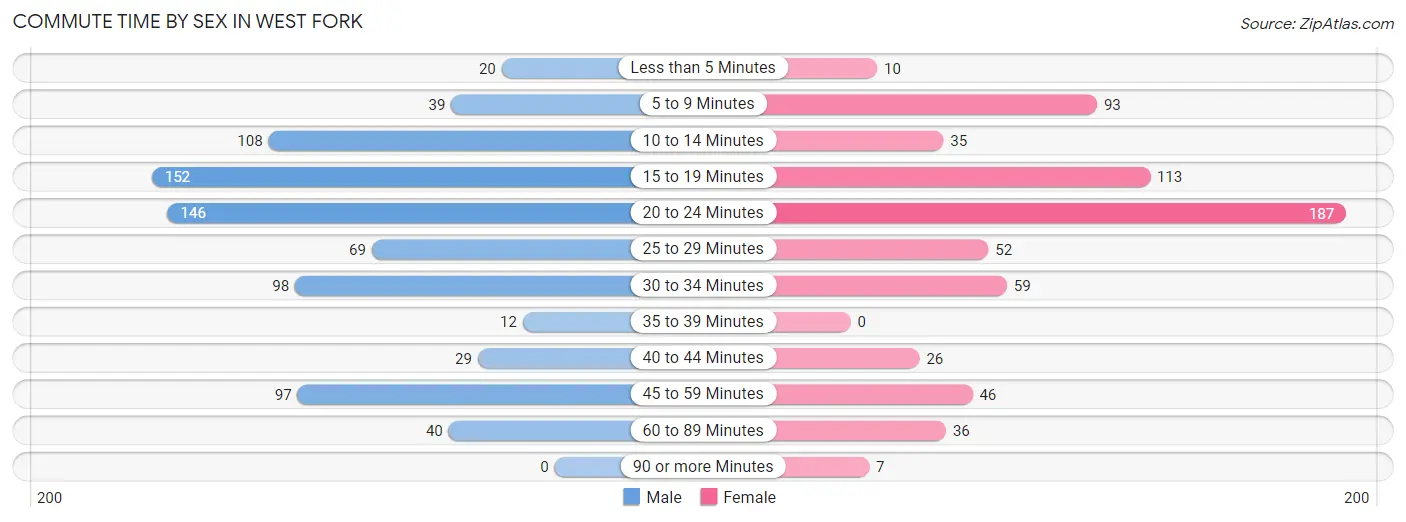
| Commute Time | Male | Female |
| Less than 5 Minutes | 20 (2.5%) | 10 (1.5%) |
| 5 to 9 Minutes | 39 (4.8%) | 93 (14.0%) |
| 10 to 14 Minutes | 108 (13.3%) | 35 (5.3%) |
| 15 to 19 Minutes | 152 (18.8%) | 113 (17.0%) |
| 20 to 24 Minutes | 146 (18.0%) | 187 (28.2%) |
| 25 to 29 Minutes | 69 (8.5%) | 52 (7.8%) |
| 30 to 34 Minutes | 98 (12.1%) | 59 (8.9%) |
| 35 to 39 Minutes | 12 (1.5%) | 0 (0.0%) |
| 40 to 44 Minutes | 29 (3.6%) | 26 (3.9%) |
| 45 to 59 Minutes | 97 (12.0%) | 46 (6.9%) |
| 60 to 89 Minutes | 40 (4.9%) | 36 (5.4%) |
| 90 or more Minutes | 0 (0.0%) | 7 (1.1%) |
Time of Departure to Work by Sex in West Fork
The most frequent times of departure to work in West Fork are 8:00 AM to 8:29 AM (132, 16.3%) for males and 7:00 AM to 7:29 AM (155, 23.3%) for females.
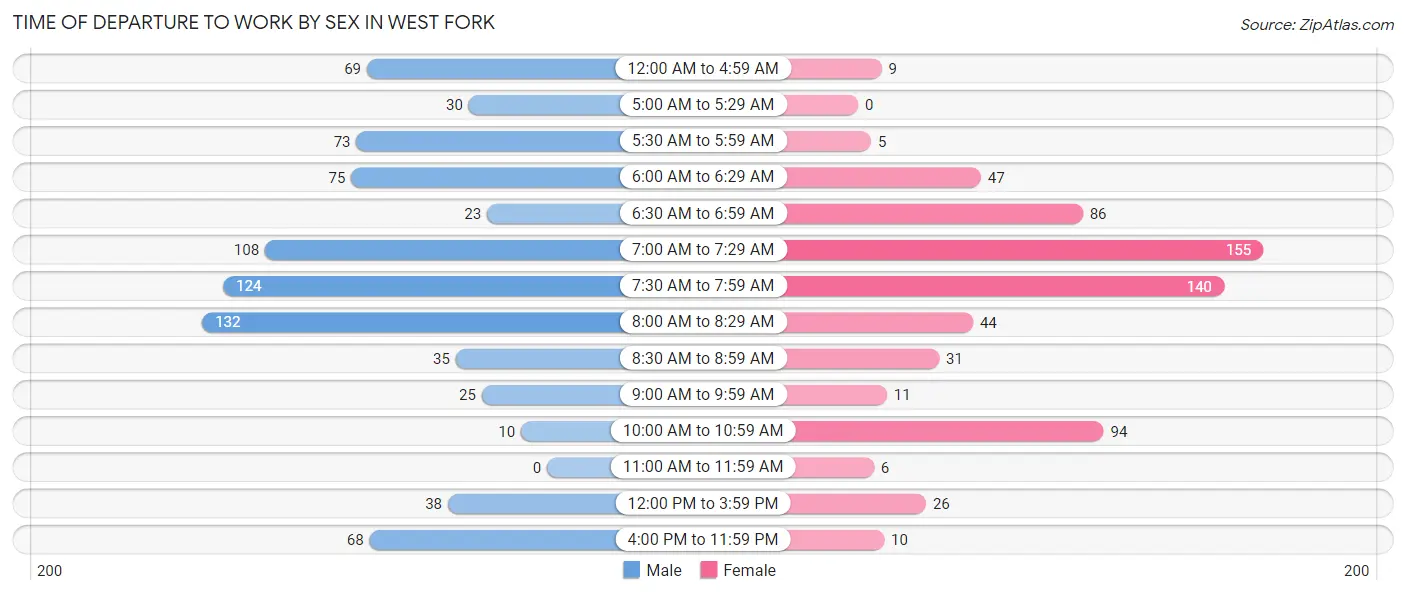
| Time of Departure | Male | Female |
| 12:00 AM to 4:59 AM | 69 (8.5%) | 9 (1.4%) |
| 5:00 AM to 5:29 AM | 30 (3.7%) | 0 (0.0%) |
| 5:30 AM to 5:59 AM | 73 (9.0%) | 5 (0.7%) |
| 6:00 AM to 6:29 AM | 75 (9.3%) | 47 (7.1%) |
| 6:30 AM to 6:59 AM | 23 (2.8%) | 86 (13.0%) |
| 7:00 AM to 7:29 AM | 108 (13.3%) | 155 (23.3%) |
| 7:30 AM to 7:59 AM | 124 (15.3%) | 140 (21.1%) |
| 8:00 AM to 8:29 AM | 132 (16.3%) | 44 (6.6%) |
| 8:30 AM to 8:59 AM | 35 (4.3%) | 31 (4.7%) |
| 9:00 AM to 9:59 AM | 25 (3.1%) | 11 (1.7%) |
| 10:00 AM to 10:59 AM | 10 (1.2%) | 94 (14.2%) |
| 11:00 AM to 11:59 AM | 0 (0.0%) | 6 (0.9%) |
| 12:00 PM to 3:59 PM | 38 (4.7%) | 26 (3.9%) |
| 4:00 PM to 11:59 PM | 68 (8.4%) | 10 (1.5%) |
| Total | 810 (100.0%) | 664 (100.0%) |
Housing Occupancy in West Fork
Occupancy by Ownership in West Fork
Of the total 1,142 dwellings in West Fork, owner-occupied units account for 913 (79.9%), while renter-occupied units make up 229 (20.1%).
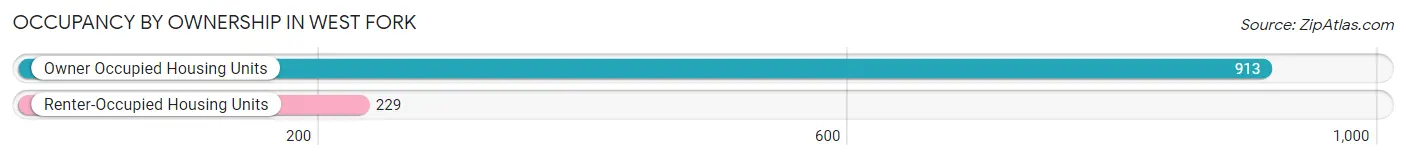
| Occupancy | # Housing Units | % Housing Units |
| Owner Occupied Housing Units | 913 | 79.9% |
| Renter-Occupied Housing Units | 229 | 20.1% |
| Total Occupied Housing Units | 1,142 | 100.0% |
Occupancy by Household Size in West Fork
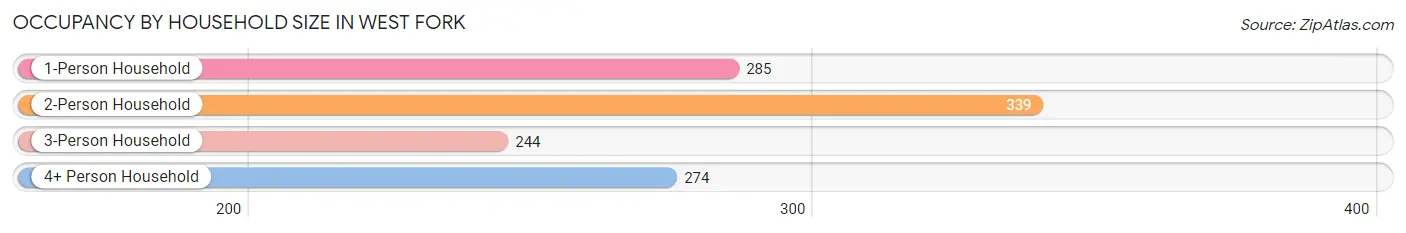
| Household Size | # Housing Units | % Housing Units |
| 1-Person Household | 285 | 25.0% |
| 2-Person Household | 339 | 29.7% |
| 3-Person Household | 244 | 21.4% |
| 4+ Person Household | 274 | 24.0% |
| Total Housing Units | 1,142 | 100.0% |
Occupancy by Ownership by Household Size in West Fork
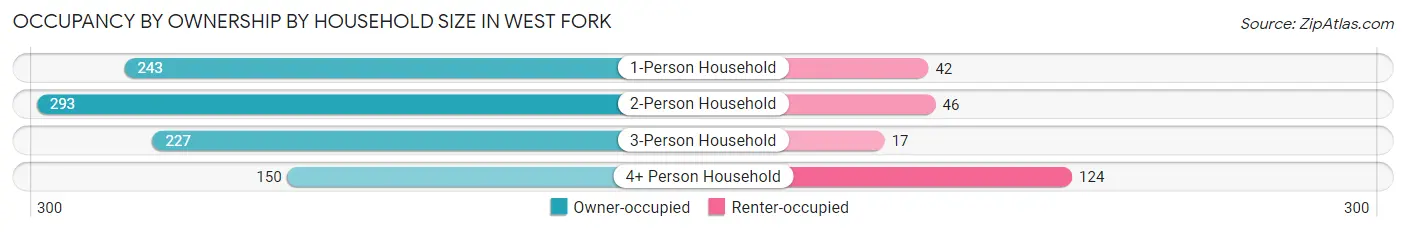
| Household Size | Owner-occupied | Renter-occupied |
| 1-Person Household | 243 (85.3%) | 42 (14.7%) |
| 2-Person Household | 293 (86.4%) | 46 (13.6%) |
| 3-Person Household | 227 (93.0%) | 17 (7.0%) |
| 4+ Person Household | 150 (54.7%) | 124 (45.3%) |
| Total Housing Units | 913 (79.9%) | 229 (20.1%) |
Occupancy by Educational Attainment in West Fork
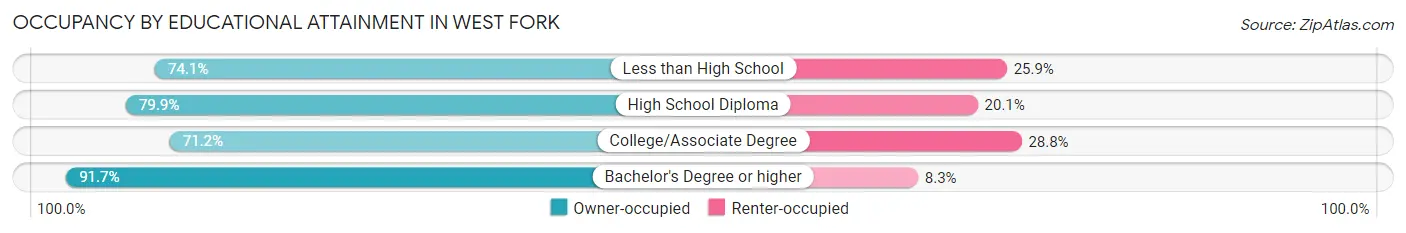
| Household Size | Owner-occupied | Renter-occupied |
| Less than High School | 63 (74.1%) | 22 (25.9%) |
| High School Diploma | 278 (79.9%) | 70 (20.1%) |
| College/Associate Degree | 272 (71.2%) | 110 (28.8%) |
| Bachelor's Degree or higher | 300 (91.7%) | 27 (8.3%) |
Occupancy by Age of Householder in West Fork
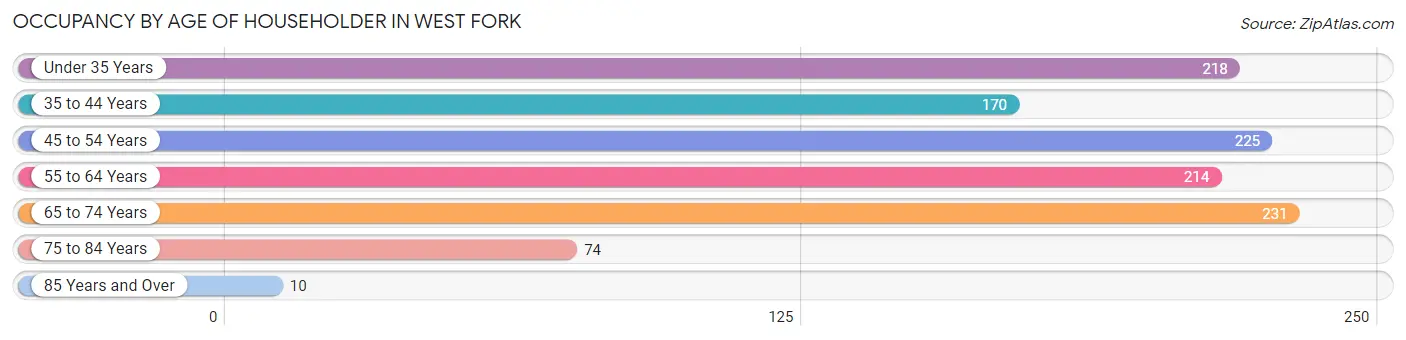
| Age Bracket | # Households | % Households |
| Under 35 Years | 218 | 19.1% |
| 35 to 44 Years | 170 | 14.9% |
| 45 to 54 Years | 225 | 19.7% |
| 55 to 64 Years | 214 | 18.7% |
| 65 to 74 Years | 231 | 20.2% |
| 75 to 84 Years | 74 | 6.5% |
| 85 Years and Over | 10 | 0.9% |
| Total | 1,142 | 100.0% |
Housing Finances in West Fork
Median Income by Occupancy in West Fork
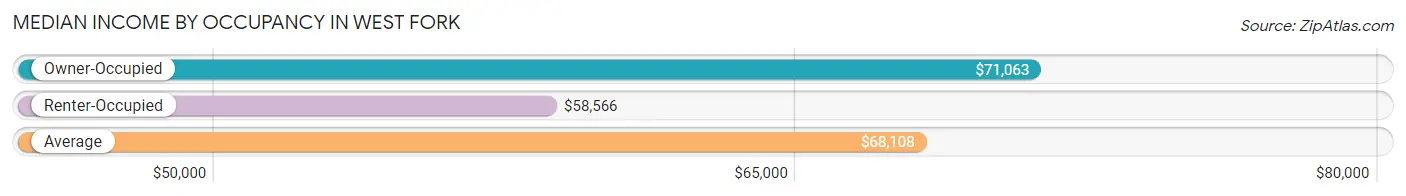
| Occupancy Type | # Households | Median Income |
| Owner-Occupied | 913 (79.9%) | $71,063 |
| Renter-Occupied | 229 (20.1%) | $58,566 |
| Average | 1,142 (100.0%) | $68,108 |
Occupancy by Householder Income Bracket in West Fork
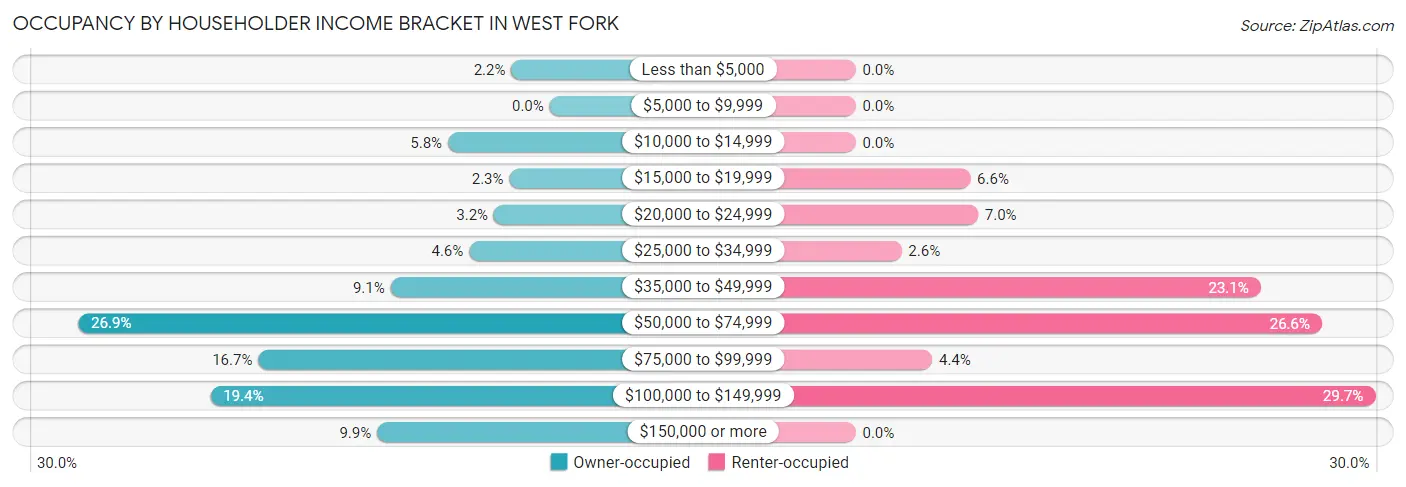
| Income Bracket | Owner-occupied | Renter-occupied |
| Less than $5,000 | 20 (2.2%) | 0 (0.0%) |
| $5,000 to $9,999 | 0 (0.0%) | 0 (0.0%) |
| $10,000 to $14,999 | 53 (5.8%) | 0 (0.0%) |
| $15,000 to $19,999 | 21 (2.3%) | 15 (6.6%) |
| $20,000 to $24,999 | 29 (3.2%) | 16 (7.0%) |
| $25,000 to $34,999 | 42 (4.6%) | 6 (2.6%) |
| $35,000 to $49,999 | 83 (9.1%) | 53 (23.1%) |
| $50,000 to $74,999 | 246 (26.9%) | 61 (26.6%) |
| $75,000 to $99,999 | 152 (16.7%) | 10 (4.4%) |
| $100,000 to $149,999 | 177 (19.4%) | 68 (29.7%) |
| $150,000 or more | 90 (9.9%) | 0 (0.0%) |
| Total | 913 (100.0%) | 229 (100.0%) |
Monthly Housing Cost Tiers in West Fork
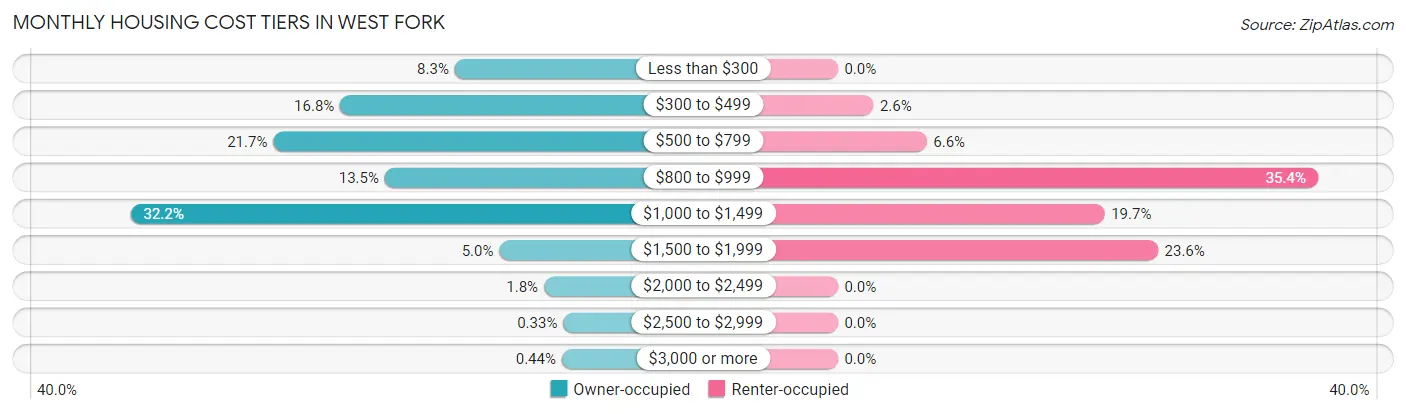
| Monthly Cost | Owner-occupied | Renter-occupied |
| Less than $300 | 76 (8.3%) | 0 (0.0%) |
| $300 to $499 | 153 (16.8%) | 6 (2.6%) |
| $500 to $799 | 198 (21.7%) | 15 (6.6%) |
| $800 to $999 | 123 (13.5%) | 81 (35.4%) |
| $1,000 to $1,499 | 294 (32.2%) | 45 (19.7%) |
| $1,500 to $1,999 | 46 (5.0%) | 54 (23.6%) |
| $2,000 to $2,499 | 16 (1.8%) | 0 (0.0%) |
| $2,500 to $2,999 | 3 (0.3%) | 0 (0.0%) |
| $3,000 or more | 4 (0.4%) | 0 (0.0%) |
| Total | 913 (100.0%) | 229 (100.0%) |
Physical Housing Characteristics in West Fork
Housing Structures in West Fork
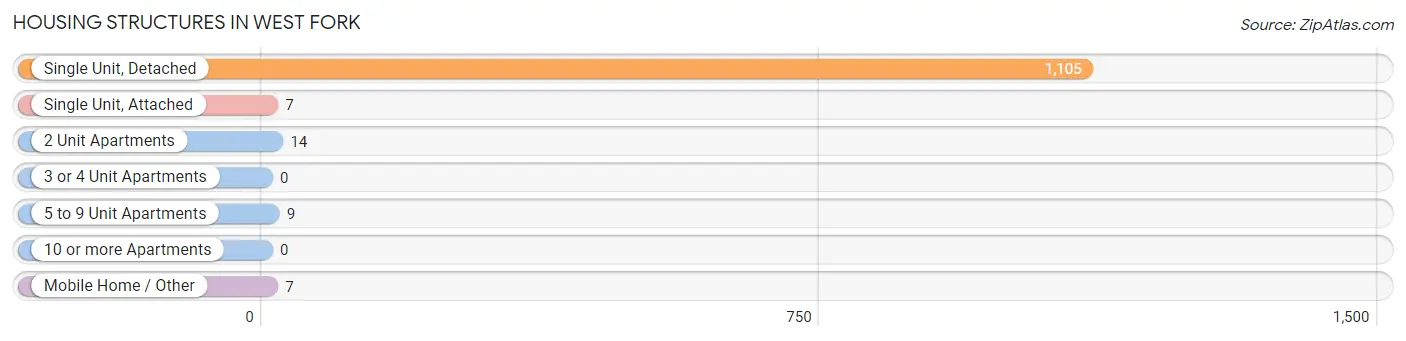
| Structure Type | # Housing Units | % Housing Units |
| Single Unit, Detached | 1,105 | 96.8% |
| Single Unit, Attached | 7 | 0.6% |
| 2 Unit Apartments | 14 | 1.2% |
| 3 or 4 Unit Apartments | 0 | 0.0% |
| 5 to 9 Unit Apartments | 9 | 0.8% |
| 10 or more Apartments | 0 | 0.0% |
| Mobile Home / Other | 7 | 0.6% |
| Total | 1,142 | 100.0% |
Housing Structures by Occupancy in West Fork
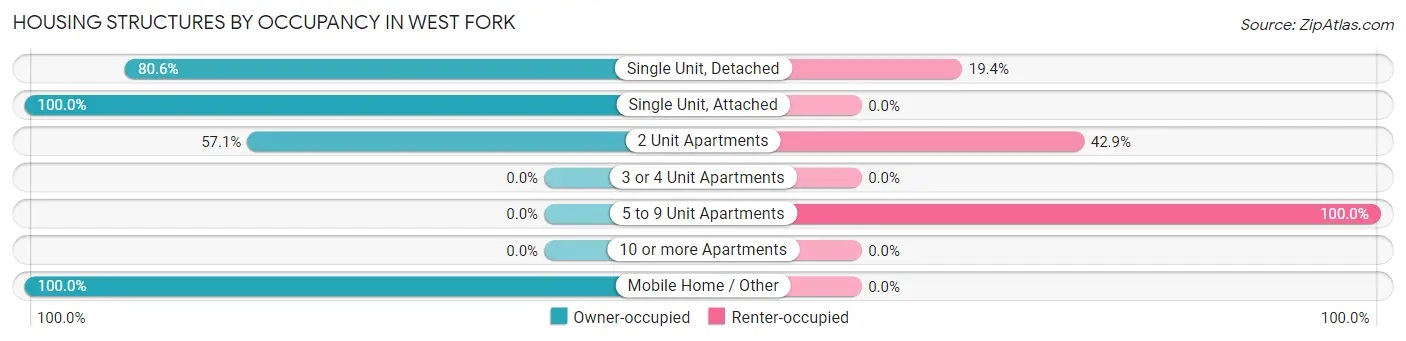
| Structure Type | Owner-occupied | Renter-occupied |
| Single Unit, Detached | 891 (80.6%) | 214 (19.4%) |
| Single Unit, Attached | 7 (100.0%) | 0 (0.0%) |
| 2 Unit Apartments | 8 (57.1%) | 6 (42.9%) |
| 3 or 4 Unit Apartments | 0 (0.0%) | 0 (0.0%) |
| 5 to 9 Unit Apartments | 0 (0.0%) | 9 (100.0%) |
| 10 or more Apartments | 0 (0.0%) | 0 (0.0%) |
| Mobile Home / Other | 7 (100.0%) | 0 (0.0%) |
| Total | 913 (79.9%) | 229 (20.1%) |
Housing Structures by Number of Rooms in West Fork
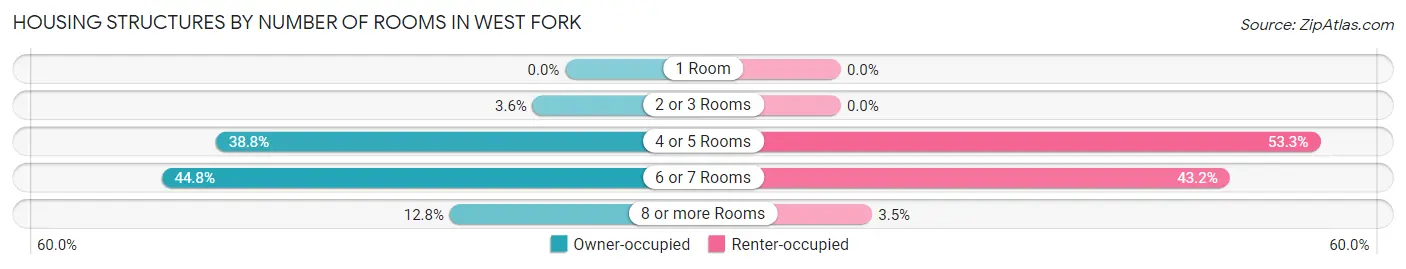
| Number of Rooms | Owner-occupied | Renter-occupied |
| 1 Room | 0 (0.0%) | 0 (0.0%) |
| 2 or 3 Rooms | 33 (3.6%) | 0 (0.0%) |
| 4 or 5 Rooms | 354 (38.8%) | 122 (53.3%) |
| 6 or 7 Rooms | 409 (44.8%) | 99 (43.2%) |
| 8 or more Rooms | 117 (12.8%) | 8 (3.5%) |
| Total | 913 (100.0%) | 229 (100.0%) |
Housing Structure by Heating Type in West Fork
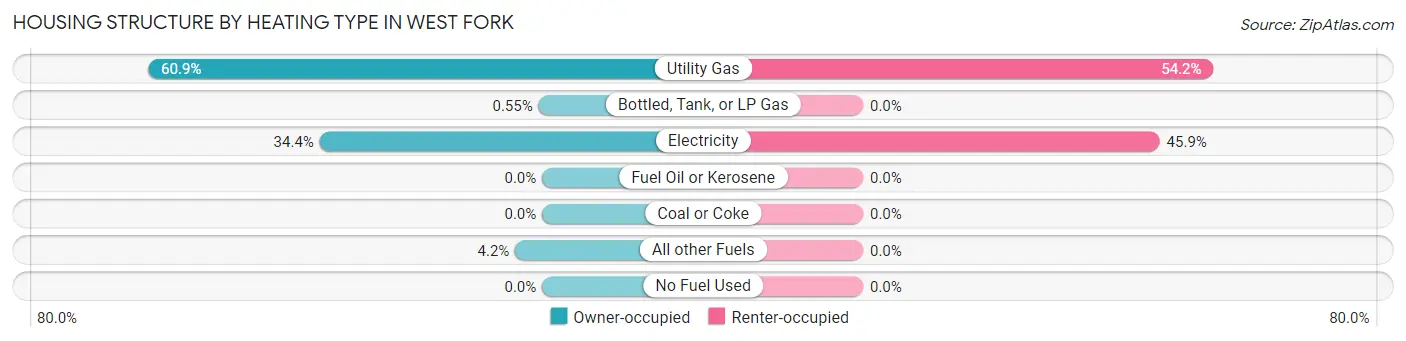
| Heating Type | Owner-occupied | Renter-occupied |
| Utility Gas | 556 (60.9%) | 124 (54.1%) |
| Bottled, Tank, or LP Gas | 5 (0.5%) | 0 (0.0%) |
| Electricity | 314 (34.4%) | 105 (45.9%) |
| Fuel Oil or Kerosene | 0 (0.0%) | 0 (0.0%) |
| Coal or Coke | 0 (0.0%) | 0 (0.0%) |
| All other Fuels | 38 (4.2%) | 0 (0.0%) |
| No Fuel Used | 0 (0.0%) | 0 (0.0%) |
| Total | 913 (100.0%) | 229 (100.0%) |
Household Vehicle Usage in West Fork
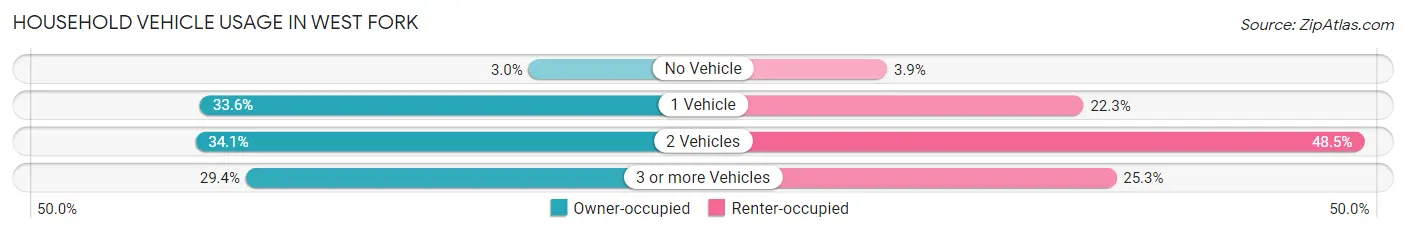
| Vehicles per Household | Owner-occupied | Renter-occupied |
| No Vehicle | 27 (3.0%) | 9 (3.9%) |
| 1 Vehicle | 307 (33.6%) | 51 (22.3%) |
| 2 Vehicles | 311 (34.1%) | 111 (48.5%) |
| 3 or more Vehicles | 268 (29.3%) | 58 (25.3%) |
| Total | 913 (100.0%) | 229 (100.0%) |
Real Estate & Mortgages in West Fork
Real Estate and Mortgage Overview in West Fork
| Characteristic | Without Mortgage | With Mortgage |
| Housing Units | 344 | 569 |
| Median Property Value | $136,400 | $157,900 |
| Median Household Income | $66,875 | $46 |
| Monthly Housing Costs | $396 | $4 |
| Real Estate Taxes | $716 | $78 |
Property Value by Mortgage Status in West Fork
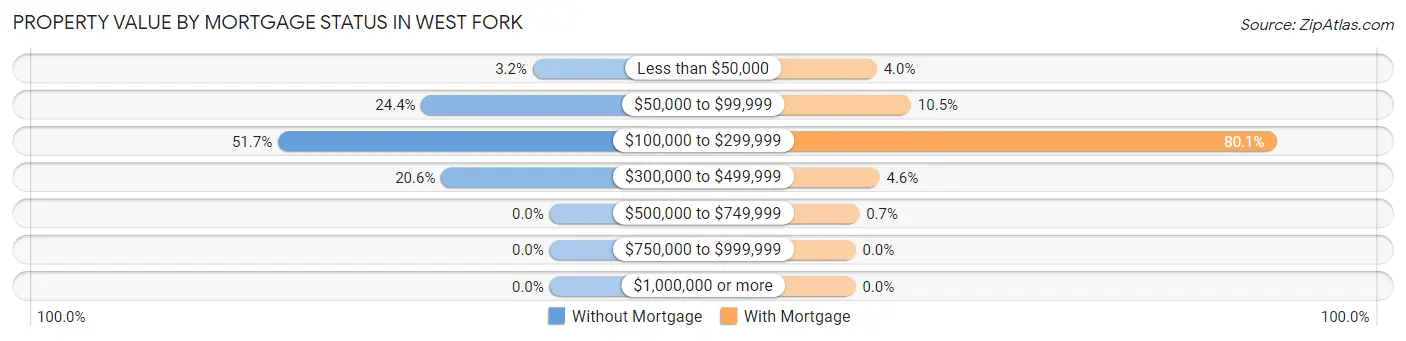
| Property Value | Without Mortgage | With Mortgage |
| Less than $50,000 | 11 (3.2%) | 23 (4.0%) |
| $50,000 to $99,999 | 84 (24.4%) | 60 (10.5%) |
| $100,000 to $299,999 | 178 (51.7%) | 456 (80.1%) |
| $300,000 to $499,999 | 71 (20.6%) | 26 (4.6%) |
| $500,000 to $749,999 | 0 (0.0%) | 4 (0.7%) |
| $750,000 to $999,999 | 0 (0.0%) | 0 (0.0%) |
| $1,000,000 or more | 0 (0.0%) | 0 (0.0%) |
| Total | 344 (100.0%) | 569 (100.0%) |
Household Income by Mortgage Status in West Fork
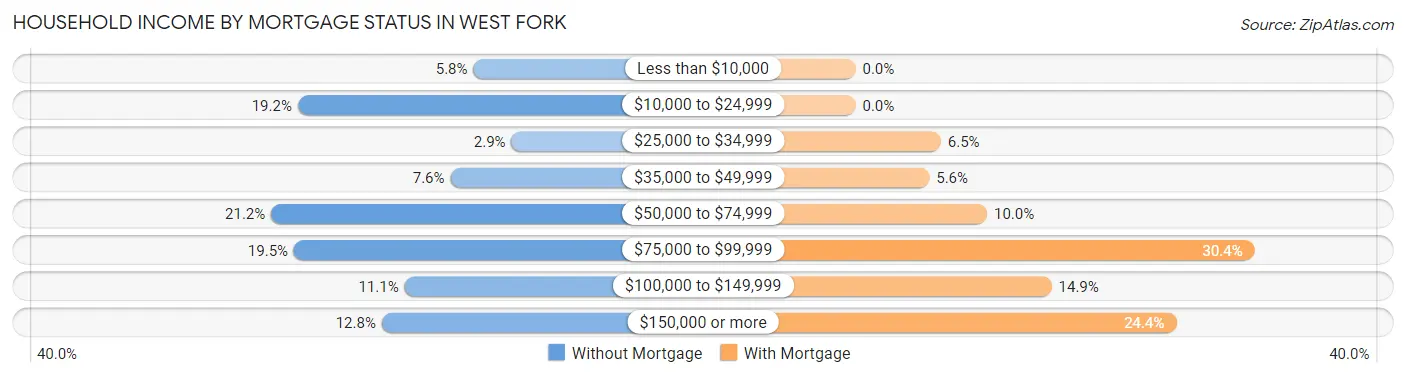
| Household Income | Without Mortgage | With Mortgage |
| Less than $10,000 | 20 (5.8%) | 0 (0.0%) |
| $10,000 to $24,999 | 66 (19.2%) | 0 (0.0%) |
| $25,000 to $34,999 | 10 (2.9%) | 37 (6.5%) |
| $35,000 to $49,999 | 26 (7.6%) | 32 (5.6%) |
| $50,000 to $74,999 | 73 (21.2%) | 57 (10.0%) |
| $75,000 to $99,999 | 67 (19.5%) | 173 (30.4%) |
| $100,000 to $149,999 | 38 (11.1%) | 85 (14.9%) |
| $150,000 or more | 44 (12.8%) | 139 (24.4%) |
| Total | 344 (100.0%) | 569 (100.0%) |
Property Value to Household Income Ratio in West Fork
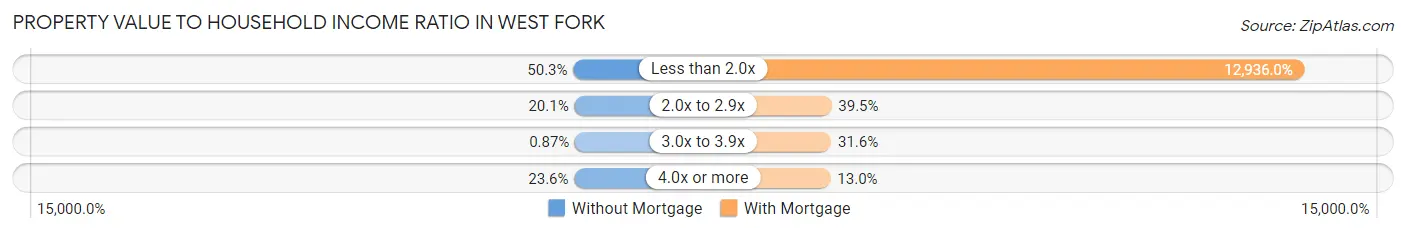
| Value-to-Income Ratio | Without Mortgage | With Mortgage |
| Less than 2.0x | 173 (50.3%) | 73,606 (12,936.0%) |
| 2.0x to 2.9x | 69 (20.1%) | 225 (39.5%) |
| 3.0x to 3.9x | 3 (0.9%) | 180 (31.6%) |
| 4.0x or more | 81 (23.5%) | 74 (13.0%) |
| Total | 344 (100.0%) | 569 (100.0%) |
Real Estate Taxes by Mortgage Status in West Fork
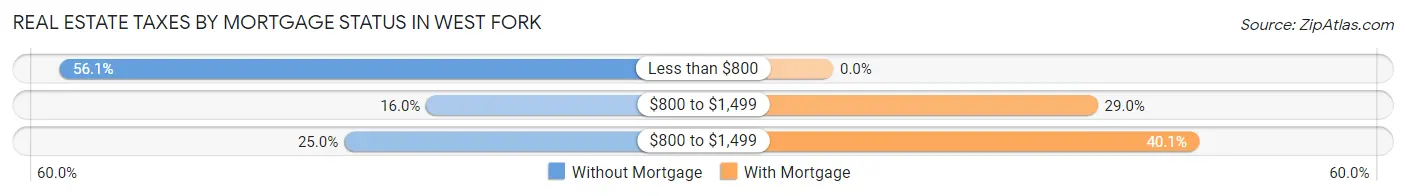
| Property Taxes | Without Mortgage | With Mortgage |
| Less than $800 | 193 (56.1%) | 0 (0.0%) |
| $800 to $1,499 | 55 (16.0%) | 165 (29.0%) |
| $800 to $1,499 | 86 (25.0%) | 228 (40.1%) |
| Total | 344 (100.0%) | 569 (100.0%) |
Health & Disability in West Fork
Health Insurance Coverage by Age in West Fork
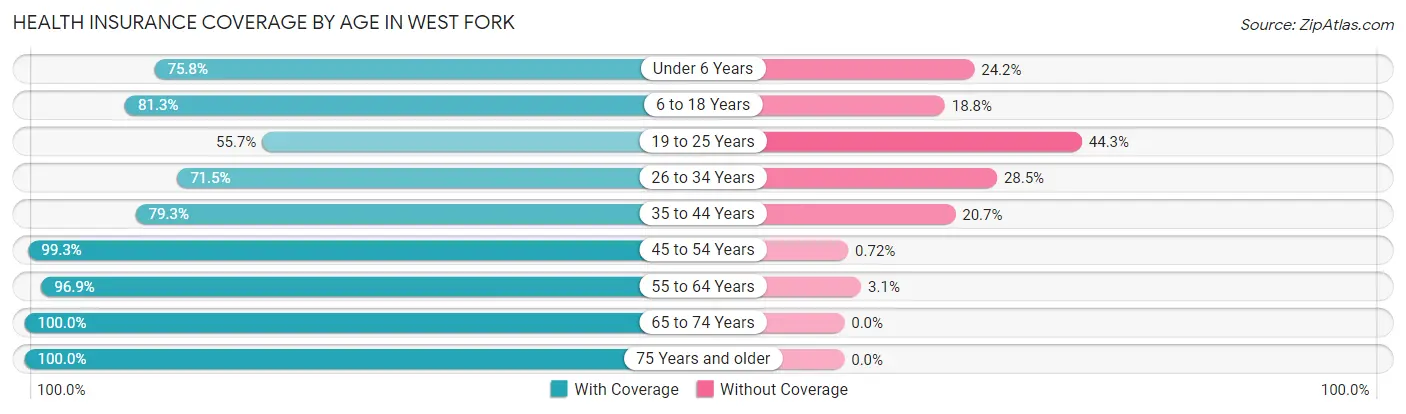
| Age Bracket | With Coverage | Without Coverage |
| Under 6 Years | 150 (75.8%) | 48 (24.2%) |
| 6 to 18 Years | 468 (81.2%) | 108 (18.8%) |
| 19 to 25 Years | 132 (55.7%) | 105 (44.3%) |
| 26 to 34 Years | 309 (71.5%) | 123 (28.5%) |
| 35 to 44 Years | 295 (79.3%) | 77 (20.7%) |
| 45 to 54 Years | 415 (99.3%) | 3 (0.7%) |
| 55 to 64 Years | 339 (96.9%) | 11 (3.1%) |
| 65 to 74 Years | 332 (100.0%) | 0 (0.0%) |
| 75 Years and older | 139 (100.0%) | 0 (0.0%) |
| Total | 2,579 (84.5%) | 475 (15.5%) |
Health Insurance Coverage by Citizenship Status in West Fork
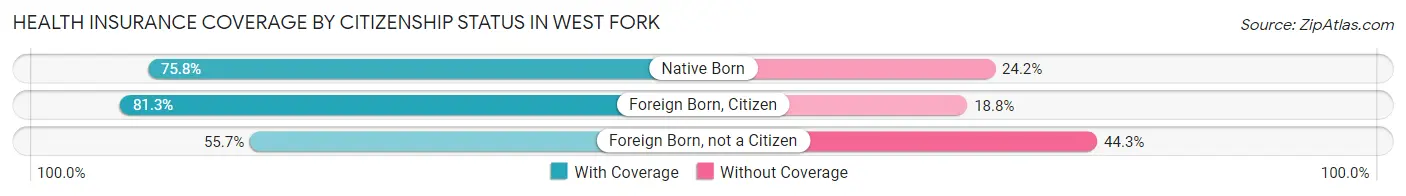
| Citizenship Status | With Coverage | Without Coverage |
| Native Born | 150 (75.8%) | 48 (24.2%) |
| Foreign Born, Citizen | 468 (81.2%) | 108 (18.8%) |
| Foreign Born, not a Citizen | 132 (55.7%) | 105 (44.3%) |
Health Insurance Coverage by Household Income in West Fork
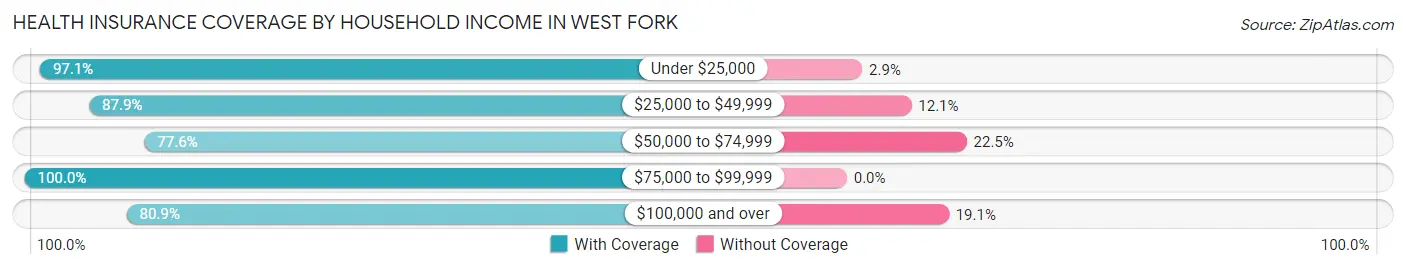
| Household Income | With Coverage | Without Coverage |
| Under $25,000 | 202 (97.1%) | 6 (2.9%) |
| $25,000 to $49,999 | 305 (87.9%) | 42 (12.1%) |
| $50,000 to $74,999 | 729 (77.5%) | 211 (22.5%) |
| $75,000 to $99,999 | 428 (100.0%) | 0 (0.0%) |
| $100,000 and over | 915 (80.9%) | 216 (19.1%) |
Public vs Private Health Insurance Coverage by Age in West Fork
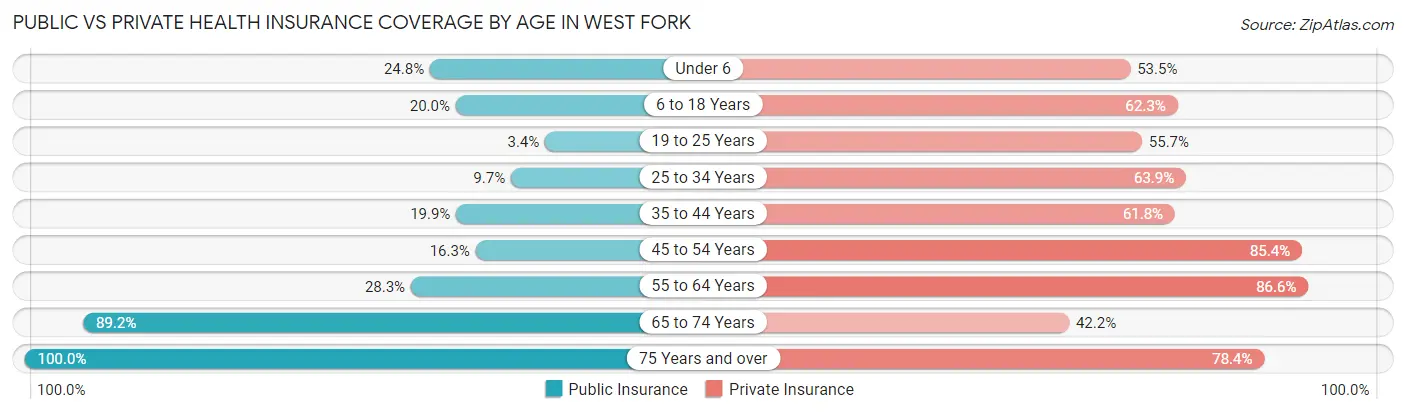
| Age Bracket | Public Insurance | Private Insurance |
| Under 6 | 49 (24.7%) | 106 (53.5%) |
| 6 to 18 Years | 115 (20.0%) | 359 (62.3%) |
| 19 to 25 Years | 8 (3.4%) | 132 (55.7%) |
| 25 to 34 Years | 42 (9.7%) | 276 (63.9%) |
| 35 to 44 Years | 74 (19.9%) | 230 (61.8%) |
| 45 to 54 Years | 68 (16.3%) | 357 (85.4%) |
| 55 to 64 Years | 99 (28.3%) | 303 (86.6%) |
| 65 to 74 Years | 296 (89.2%) | 140 (42.2%) |
| 75 Years and over | 139 (100.0%) | 109 (78.4%) |
| Total | 890 (29.1%) | 2,012 (65.9%) |
Disability Status by Sex by Age in West Fork
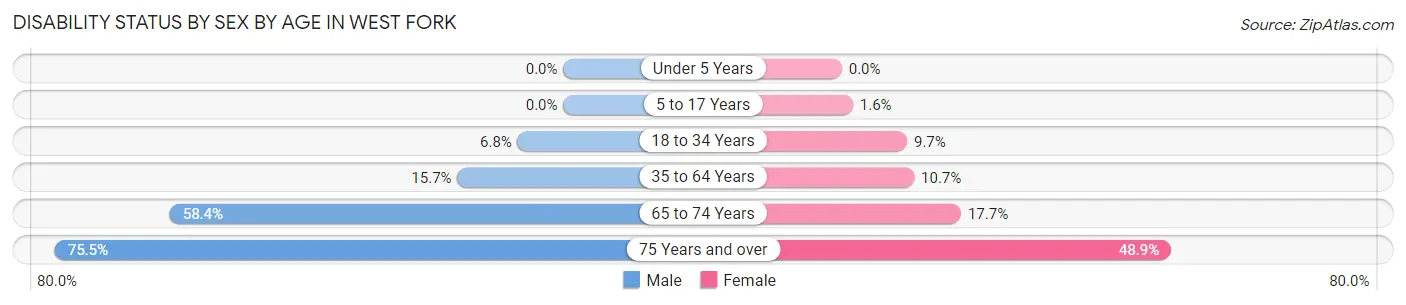
| Age Bracket | Male | Female |
| Under 5 Years | 0 (0.0%) | 0 (0.0%) |
| 5 to 17 Years | 0 (0.0%) | 3 (1.6%) |
| 18 to 34 Years | 27 (6.8%) | 31 (9.7%) |
| 35 to 64 Years | 90 (15.7%) | 61 (10.7%) |
| 65 to 74 Years | 52 (58.4%) | 43 (17.7%) |
| 75 Years and over | 37 (75.5%) | 44 (48.9%) |
Disability Class by Sex by Age in West Fork
Disability Class: Hearing Difficulty
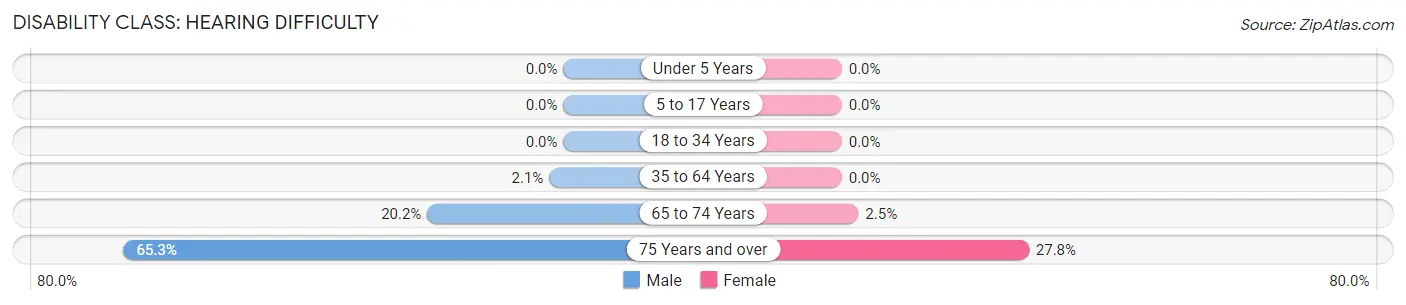
| Age Bracket | Male | Female |
| Under 5 Years | 0 (0.0%) | 0 (0.0%) |
| 5 to 17 Years | 0 (0.0%) | 0 (0.0%) |
| 18 to 34 Years | 0 (0.0%) | 0 (0.0%) |
| 35 to 64 Years | 12 (2.1%) | 0 (0.0%) |
| 65 to 74 Years | 18 (20.2%) | 6 (2.5%) |
| 75 Years and over | 32 (65.3%) | 25 (27.8%) |
Disability Class: Vision Difficulty
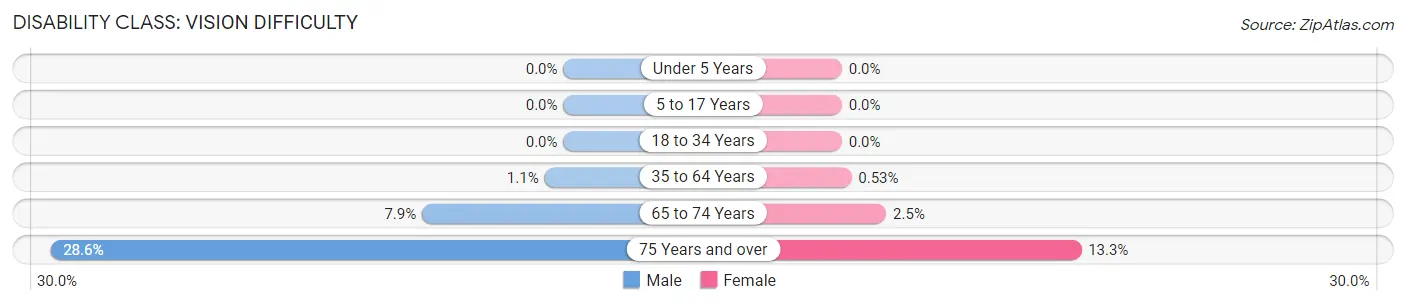
| Age Bracket | Male | Female |
| Under 5 Years | 0 (0.0%) | 0 (0.0%) |
| 5 to 17 Years | 0 (0.0%) | 0 (0.0%) |
| 18 to 34 Years | 0 (0.0%) | 0 (0.0%) |
| 35 to 64 Years | 6 (1.1%) | 3 (0.5%) |
| 65 to 74 Years | 7 (7.9%) | 6 (2.5%) |
| 75 Years and over | 14 (28.6%) | 12 (13.3%) |
Disability Class: Cognitive Difficulty
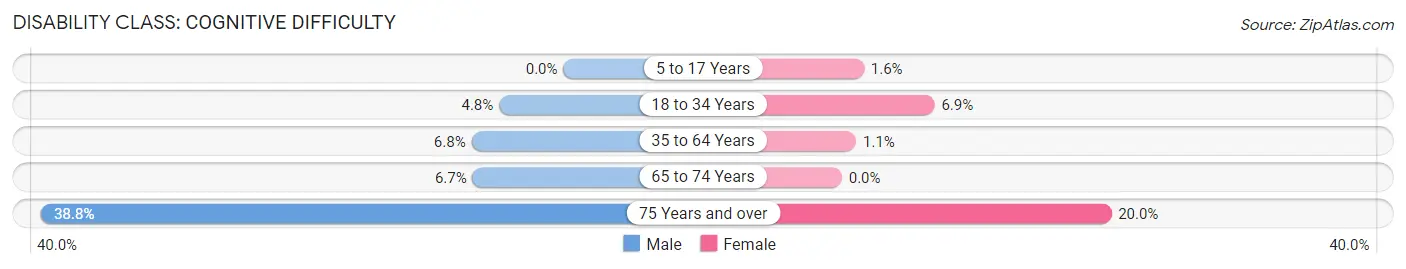
| Age Bracket | Male | Female |
| 5 to 17 Years | 0 (0.0%) | 3 (1.6%) |
| 18 to 34 Years | 19 (4.8%) | 22 (6.9%) |
| 35 to 64 Years | 39 (6.8%) | 6 (1.1%) |
| 65 to 74 Years | 6 (6.7%) | 0 (0.0%) |
| 75 Years and over | 19 (38.8%) | 18 (20.0%) |
Disability Class: Ambulatory Difficulty
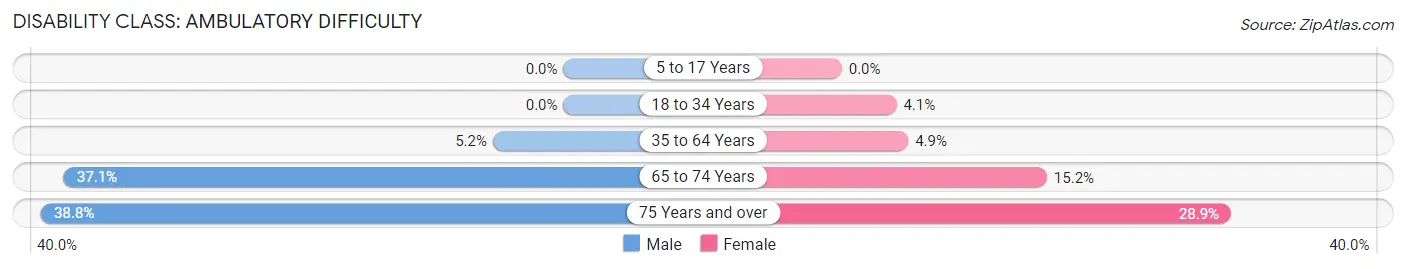
| Age Bracket | Male | Female |
| 5 to 17 Years | 0 (0.0%) | 0 (0.0%) |
| 18 to 34 Years | 0 (0.0%) | 13 (4.1%) |
| 35 to 64 Years | 30 (5.2%) | 28 (4.9%) |
| 65 to 74 Years | 33 (37.1%) | 37 (15.2%) |
| 75 Years and over | 19 (38.8%) | 26 (28.9%) |
Disability Class: Self-Care Difficulty
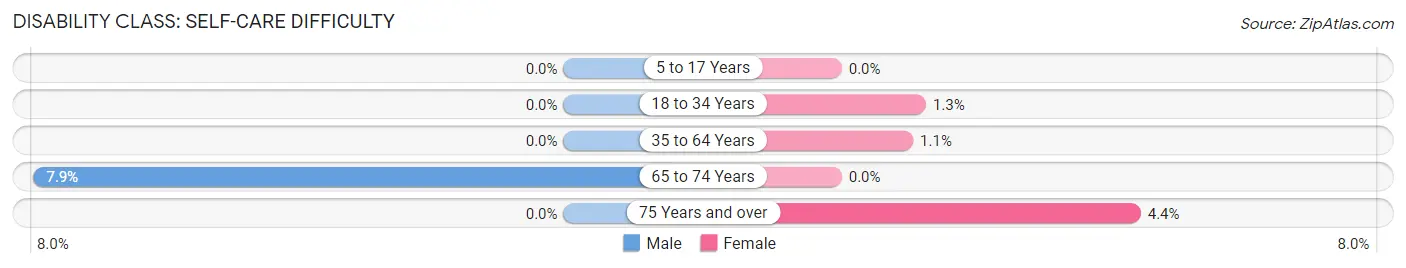
| Age Bracket | Male | Female |
| 5 to 17 Years | 0 (0.0%) | 0 (0.0%) |
| 18 to 34 Years | 0 (0.0%) | 4 (1.3%) |
| 35 to 64 Years | 0 (0.0%) | 6 (1.1%) |
| 65 to 74 Years | 7 (7.9%) | 0 (0.0%) |
| 75 Years and over | 0 (0.0%) | 4 (4.4%) |
Technology Access in West Fork
Computing Device Access in West Fork
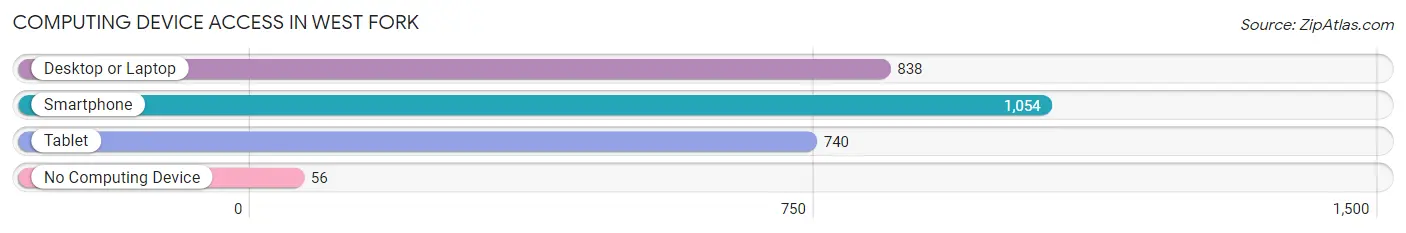
| Device Type | # Households | % Households |
| Desktop or Laptop | 838 | 73.4% |
| Smartphone | 1,054 | 92.3% |
| Tablet | 740 | 64.8% |
| No Computing Device | 56 | 4.9% |
| Total | 1,142 | 100.0% |
Internet Access in West Fork
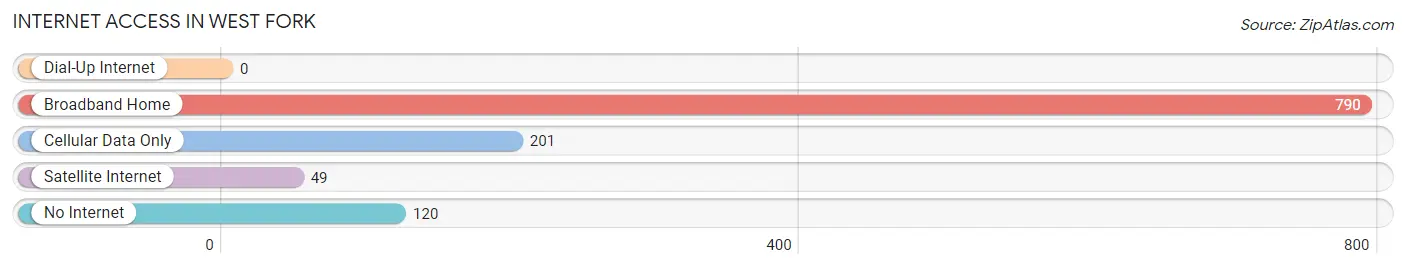
| Internet Type | # Households | % Households |
| Dial-Up Internet | 0 | 0.0% |
| Broadband Home | 790 | 69.2% |
| Cellular Data Only | 201 | 17.6% |
| Satellite Internet | 49 | 4.3% |
| No Internet | 120 | 10.5% |
| Total | 1,142 | 100.0% |
West Fork Summary
History
West Fork is a city located in Washington County, Arkansas. It is part of the Fayetteville–Springdale–Rogers Metropolitan Statistical Area. The city was founded in 1871 and incorporated in 1887. It was named after the nearby West Fork of the White River.
West Fork was originally a small farming community, but it began to grow in the late 19th century when the St. Louis–San Francisco Railway (Frisco) built a line through the area. The railroad brought new businesses and industries to the area, and the population began to grow.
In the early 20th century, West Fork was a thriving community with a variety of businesses, including a bank, a hotel, a lumberyard, a cotton gin, and a flour mill. The city also had a school, a post office, and a newspaper.
Geography
West Fork is located in the Ozark Mountains of northwest Arkansas. It is situated in the foothills of the Boston Mountains, which are part of the Ozark Plateau. The city is located at the intersection of Interstate 49 and U.S. Route 71.
The city has a total area of 4.2 square miles, all of which is land. The elevation of West Fork is 1,072 feet above sea level.
The climate in West Fork is humid subtropical, with hot, humid summers and mild winters. The average annual temperature is 63°F, and the average annual precipitation is 45 inches.
Economy
West Fork’s economy is largely based on agriculture and manufacturing. The city is home to several large poultry processing plants, as well as a variety of other manufacturing businesses.
The city also has a thriving retail sector, with several stores and restaurants located in the downtown area.
Demographics
As of the 2010 census, West Fork had a population of 3,364. The racial makeup of the city was 87.3% White, 8.2% Black or African American, 0.4% Native American, 0.7% Asian, 0.1% Pacific Islander, 1.2% from other races, and 2.1% from two or more races. Hispanic or Latino of any race were 3.2% of the population.
The median household income in West Fork was $37,917, and the median family income was $45,938. The per capita income was $19,945. About 11.3% of families and 14.2% of the population were below the poverty line, including 19.2% of those under age 18 and 8.2% of those age 65 or over.
West Fork is served by the West Fork School District, which includes West Fork Elementary School, West Fork Middle School, and West Fork High School. The city is also home to the University of Arkansas Community College at Morrilton.
Common Questions
What is Per Capita Income in West Fork?
Per Capita income in West Fork is $32,191.
What is the Median Family Income in West Fork?
Median Family Income in West Fork is $77,344.
What is the Median Household income in West Fork?
Median Household Income in West Fork is $68,108.
What is Income or Wage Gap in West Fork?
Income or Wage Gap in West Fork is 3.9%.
Women in West Fork earn 96.1 cents for every dollar earned by a man.
What is Inequality or Gini Index in West Fork?
Inequality or Gini Index in West Fork is 0.36.
What is the Total Population of West Fork?
Total Population of West Fork is 3,054.
What is the Total Male Population of West Fork?
Total Male Population of West Fork is 1,569.
What is the Total Female Population of West Fork?
Total Female Population of West Fork is 1,485.
What is the Ratio of Males per 100 Females in West Fork?
There are 105.66 Males per 100 Females in West Fork.
What is the Ratio of Females per 100 Males in West Fork?
There are 94.65 Females per 100 Males in West Fork.
What is the Median Population Age in West Fork?
Median Population Age in West Fork is 38.8 Years.
What is the Average Family Size in West Fork
Average Family Size in West Fork is 3.1 People.
What is the Average Household Size in West Fork
Average Household Size in West Fork is 2.7 People.
How Large is the Labor Force in West Fork?
There are 1,599 People in the Labor Forcein in West Fork.
What is the Percentage of People in the Labor Force in West Fork?
65.9% of People are in the Labor Force in West Fork.
What is the Unemployment Rate in West Fork?
Unemployment Rate in West Fork is 2.9%.