Lake Village, AR Map & Demographics
Lake Village Map
Lake Village Overview
$22,914
PER CAPITA INCOME
$55,714
AVG FAMILY INCOME
$42,143
AVG HOUSEHOLD INCOME
8.7%
WAGE / INCOME GAP [ % ]
91.3¢/ $1
WAGE / INCOME GAP [ $ ]
0.45
INEQUALITY / GINI INDEX
2,084
TOTAL POPULATION
1,077
MALE POPULATION
1,007
FEMALE POPULATION
106.95
MALES / 100 FEMALES
93.50
FEMALES / 100 MALES
38.6
MEDIAN AGE
3.1
AVG FAMILY SIZE
2.2
AVG HOUSEHOLD SIZE
876
LABOR FORCE [ PEOPLE ]
52.1%
PERCENT IN LABOR FORCE
5.5%
UNEMPLOYMENT RATE
Lake Village Zip Codes
Lake Village Area Codes
Income in Lake Village
Income Overview in Lake Village
Per Capita Income in Lake Village is $22,914, while median incomes of families and households are $55,714 and $42,143 respectively.
| Characteristic | Number | Measure |
| Per Capita Income | 2,084 | $22,914 |
| Median Family Income | 498 | $55,714 |
| Mean Family Income | 498 | $65,364 |
| Median Household Income | 890 | $42,143 |
| Mean Household Income | 890 | $50,756 |
| Income Deficit | 498 | $0 |
| Wage / Income Gap (%) | 2,084 | 8.67% |
| Wage / Income Gap ($) | 2,084 | 91.33¢ per $1 |
| Gini / Inequality Index | 2,084 | 0.45 |
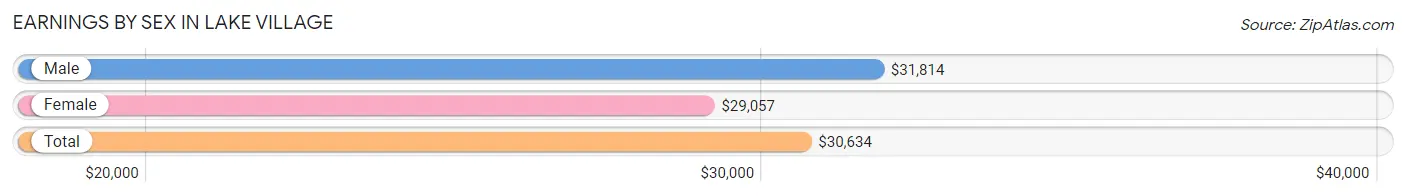
Earnings by Sex in Lake Village
Average Earnings in Lake Village are $30,634, $31,814 for men and $29,057 for women, a difference of 8.7%.
| Sex | Number | Average Earnings |
| Male | 522 (56.7%) | $31,814 |
| Female | 398 (43.3%) | $29,057 |
| Total | 920 (100.0%) | $30,634 |
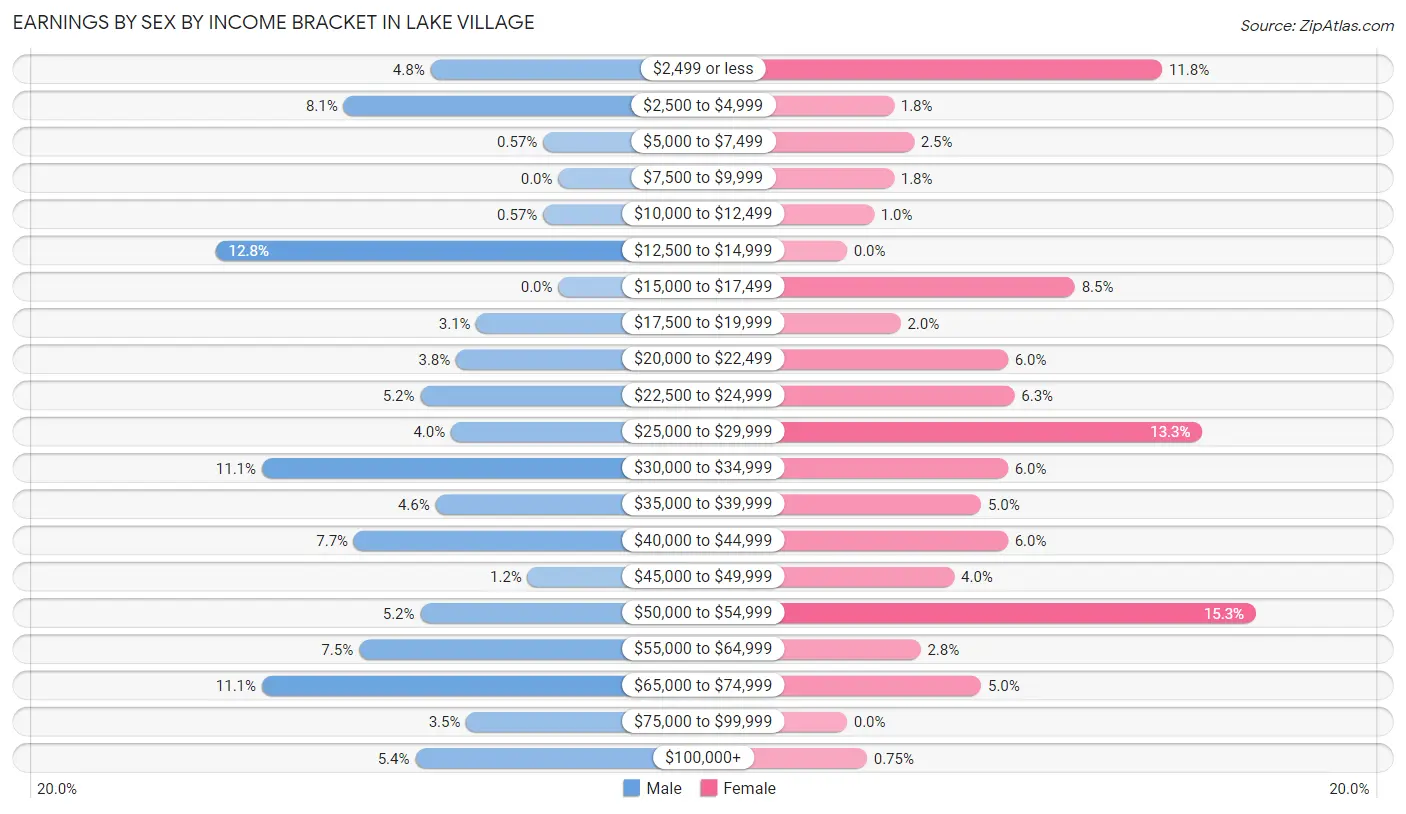
Earnings by Sex by Income Bracket in Lake Village
The most common earnings brackets in Lake Village are $12,500 to $14,999 for men (67 | 12.8%) and $50,000 to $54,999 for women (61 | 15.3%).
| Income | Male | Female |
| $2,499 or less | 25 (4.8%) | 47 (11.8%) |
| $2,500 to $4,999 | 42 (8.1%) | 7 (1.8%) |
| $5,000 to $7,499 | 3 (0.6%) | 10 (2.5%) |
| $7,500 to $9,999 | 0 (0.0%) | 7 (1.8%) |
| $10,000 to $12,499 | 3 (0.6%) | 4 (1.0%) |
| $12,500 to $14,999 | 67 (12.8%) | 0 (0.0%) |
| $15,000 to $17,499 | 0 (0.0%) | 34 (8.5%) |
| $17,500 to $19,999 | 16 (3.1%) | 8 (2.0%) |
| $20,000 to $22,499 | 20 (3.8%) | 24 (6.0%) |
| $22,500 to $24,999 | 27 (5.2%) | 25 (6.3%) |
| $25,000 to $29,999 | 21 (4.0%) | 53 (13.3%) |
| $30,000 to $34,999 | 58 (11.1%) | 24 (6.0%) |
| $35,000 to $39,999 | 24 (4.6%) | 20 (5.0%) |
| $40,000 to $44,999 | 40 (7.7%) | 24 (6.0%) |
| $45,000 to $49,999 | 6 (1.1%) | 16 (4.0%) |
| $50,000 to $54,999 | 27 (5.2%) | 61 (15.3%) |
| $55,000 to $64,999 | 39 (7.5%) | 11 (2.8%) |
| $65,000 to $74,999 | 58 (11.1%) | 20 (5.0%) |
| $75,000 to $99,999 | 18 (3.5%) | 0 (0.0%) |
| $100,000+ | 28 (5.4%) | 3 (0.7%) |
| Total | 522 (100.0%) | 398 (100.0%) |
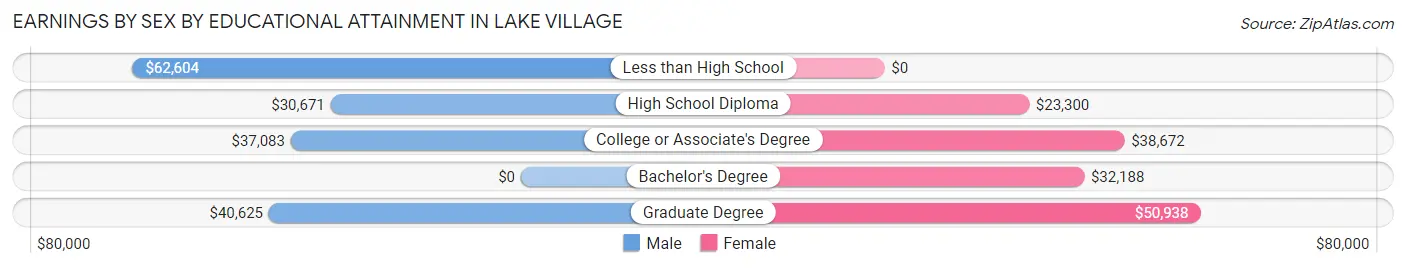
Earnings by Sex by Educational Attainment in Lake Village
Average earnings in Lake Village are $35,893 for men and $31,016 for women, a difference of 13.6%. Men with an educational attainment of less than high school enjoy the highest average annual earnings of $62,604, while those with high school diploma education earn the least with $30,671. Women with an educational attainment of graduate degree earn the most with the average annual earnings of $50,938, while those with high school diploma education have the smallest earnings of $23,300.
| Educational Attainment | Male Income | Female Income |
| Less than High School | $62,604 | $0 |
| High School Diploma | $30,671 | $23,300 |
| College or Associate's Degree | $37,083 | $38,672 |
| Bachelor's Degree | - | - |
| Graduate Degree | $40,625 | $50,938 |
| Total | $35,893 | $31,016 |
Family Income in Lake Village
Family Income Brackets in Lake Village
According to the Lake Village family income data, there are 151 families falling into the $50,000 to $74,999 income range, which is the most common income bracket and makes up 30.3% of all families.
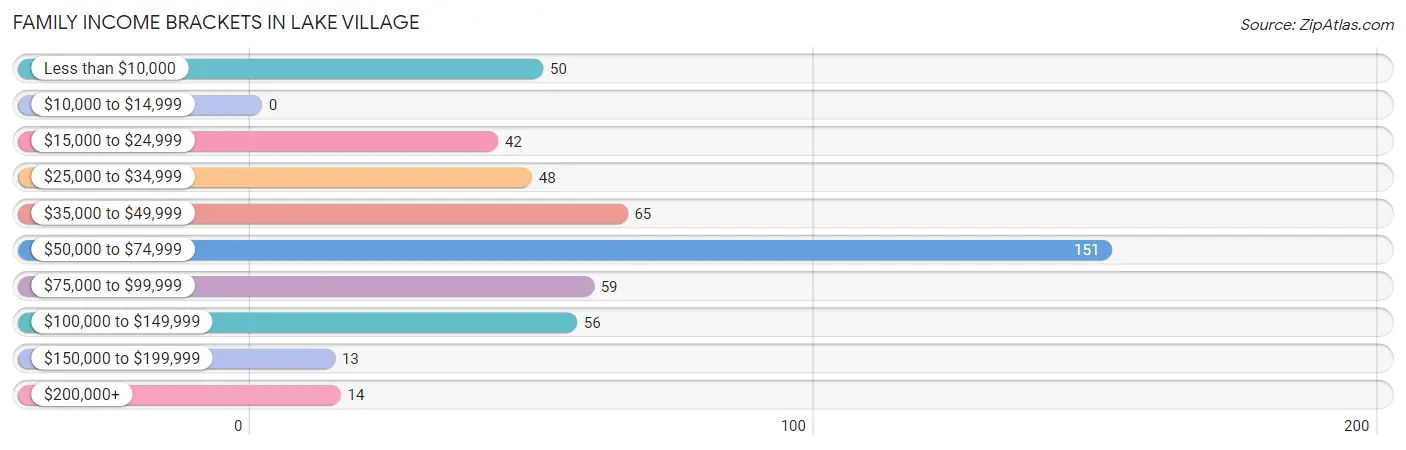
| Income Bracket | # Families | % Families |
| Less than $10,000 | 50 | 10.0% |
| $10,000 to $14,999 | 0 | 0.0% |
| $15,000 to $24,999 | 42 | 8.4% |
| $25,000 to $34,999 | 48 | 9.6% |
| $35,000 to $49,999 | 65 | 13.1% |
| $50,000 to $74,999 | 151 | 30.3% |
| $75,000 to $99,999 | 59 | 11.8% |
| $100,000 to $149,999 | 56 | 11.2% |
| $150,000 to $199,999 | 13 | 2.6% |
| $200,000+ | 14 | 2.8% |
Family Income by Famaliy Size in Lake Village
4-person families (84 | 16.9%) account for the highest median family income in Lake Village with $108,690 per family, while 4-person families (84 | 16.9%) have the highest median income of $27,172 per family member.
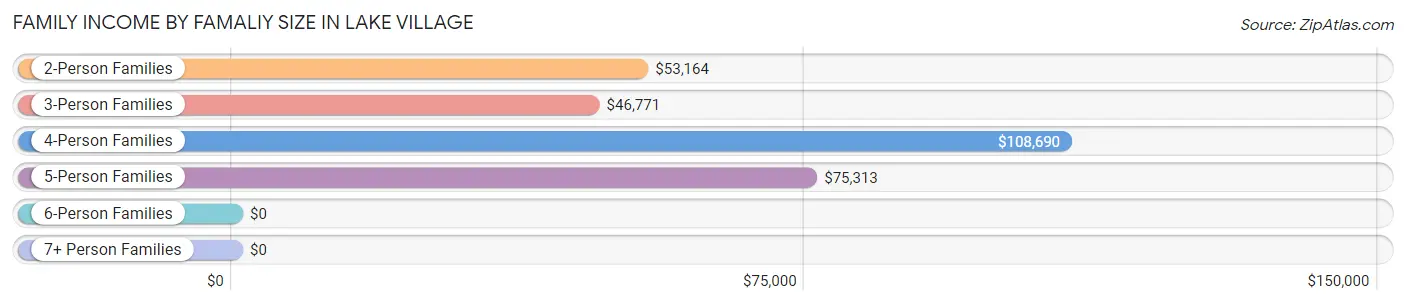
| Income Bracket | # Families | Median Income |
| 2-Person Families | 247 (49.6%) | $53,164 |
| 3-Person Families | 125 (25.1%) | $46,771 |
| 4-Person Families | 84 (16.9%) | $108,690 |
| 5-Person Families | 32 (6.4%) | $75,313 |
| 6-Person Families | 10 (2.0%) | $0 |
| 7+ Person Families | 0 (0.0%) | $0 |
| Total | 498 (100.0%) | $55,714 |
Family Income by Number of Earners in Lake Village
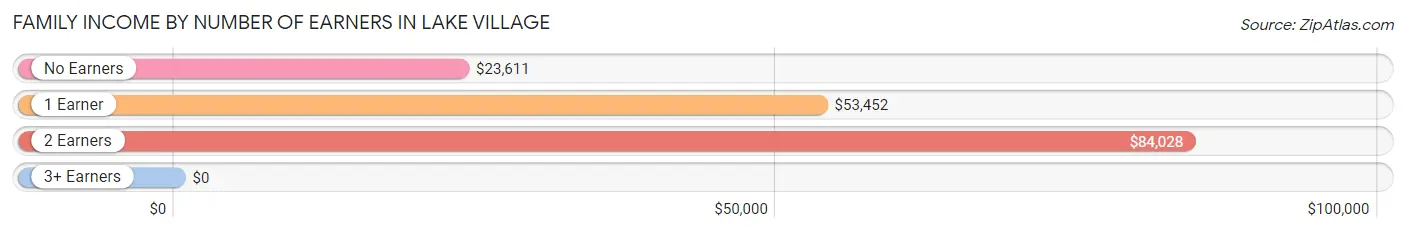
| Number of Earners | # Families | Median Income |
| No Earners | 130 (26.1%) | $23,611 |
| 1 Earner | 194 (39.0%) | $53,452 |
| 2 Earners | 157 (31.5%) | $84,028 |
| 3+ Earners | 17 (3.4%) | $0 |
| Total | 498 (100.0%) | $55,714 |
Household Income in Lake Village
Household Income Brackets in Lake Village
With 164 households falling in the category, the $50,000 to $74,999 income range is the most frequent in Lake Village, accounting for 18.4% of all households. In contrast, only 13 households (1.5%) fall into the $150,000 to $199,999 income bracket, making it the least populous group.
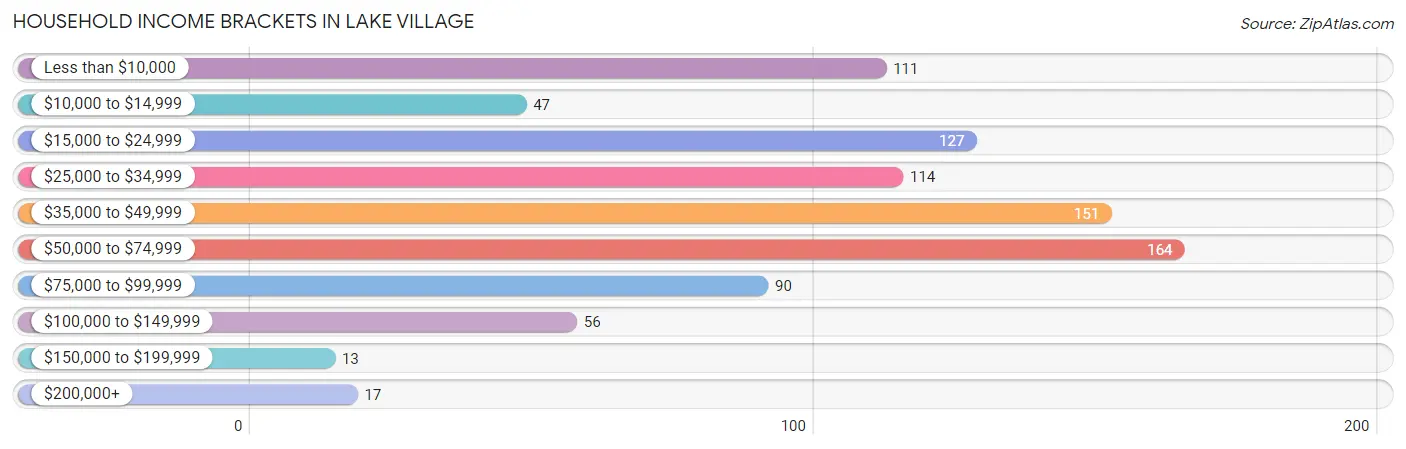
| Income Bracket | # Households | % Households |
| Less than $10,000 | 111 | 12.5% |
| $10,000 to $14,999 | 47 | 5.3% |
| $15,000 to $24,999 | 127 | 14.3% |
| $25,000 to $34,999 | 114 | 12.8% |
| $35,000 to $49,999 | 151 | 17.0% |
| $50,000 to $74,999 | 164 | 18.4% |
| $75,000 to $99,999 | 90 | 10.1% |
| $100,000 to $149,999 | 56 | 6.3% |
| $150,000 to $199,999 | 13 | 1.5% |
| $200,000+ | 17 | 1.9% |
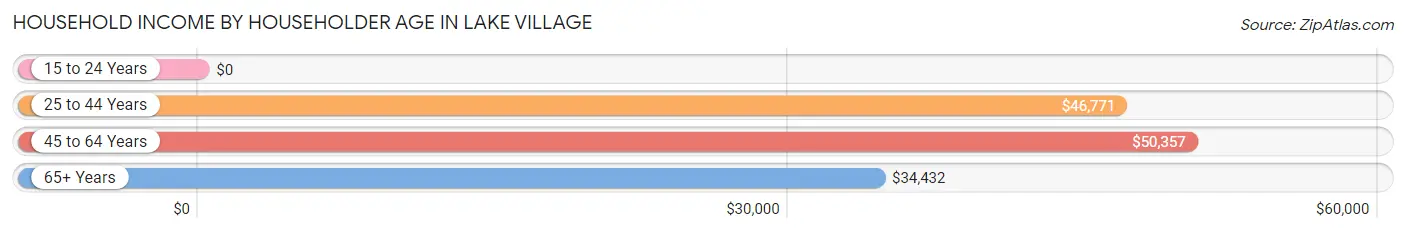
Household Income by Householder Age in Lake Village
The median household income in Lake Village is $42,143, with the highest median household income of $50,357 found in the 45 to 64 years age bracket for the primary householder. A total of 278 households (31.2%) fall into this category. Meanwhile, the 15 to 24 years age bracket for the primary householder has the lowest median household income of $0, with 4 households (0.4%) in this group.
| Income Bracket | # Households | Median Income |
| 15 to 24 Years | 4 (0.4%) | $0 |
| 25 to 44 Years | 313 (35.2%) | $46,771 |
| 45 to 64 Years | 278 (31.2%) | $50,357 |
| 65+ Years | 295 (33.2%) | $34,432 |
| Total | 890 (100.0%) | $42,143 |
Poverty in Lake Village
Income Below Poverty by Sex and Age in Lake Village
With 17.2% poverty level for males and 16.4% for females among the residents of Lake Village, 12 to 14 year old males and 6 to 11 year old females are the most vulnerable to poverty, with 38 males (77.5%) and 15 females (44.1%) in their respective age groups living below the poverty level.
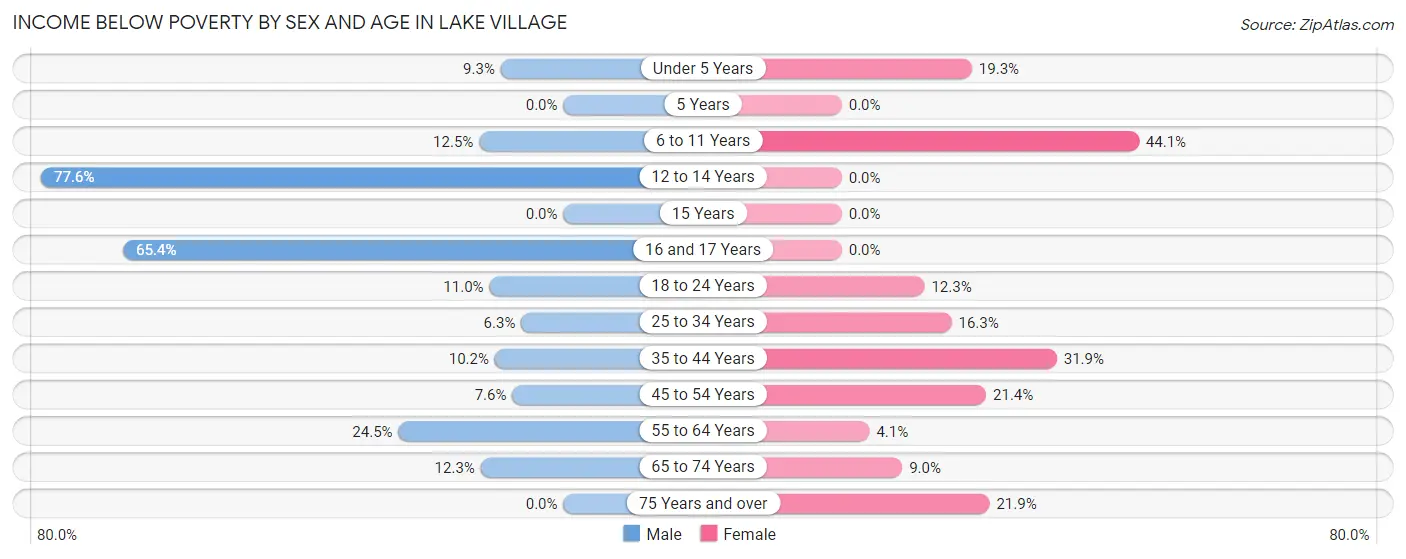
| Age Bracket | Male | Female |
| Under 5 Years | 8 (9.3%) | 17 (19.3%) |
| 5 Years | 0 (0.0%) | 0 (0.0%) |
| 6 to 11 Years | 12 (12.5%) | 15 (44.1%) |
| 12 to 14 Years | 38 (77.5%) | 0 (0.0%) |
| 15 Years | 0 (0.0%) | 0 (0.0%) |
| 16 and 17 Years | 34 (65.4%) | 0 (0.0%) |
| 18 to 24 Years | 9 (11.0%) | 7 (12.3%) |
| 25 to 34 Years | 10 (6.2%) | 22 (16.3%) |
| 35 to 44 Years | 17 (10.2%) | 38 (31.9%) |
| 45 to 54 Years | 5 (7.6%) | 15 (21.4%) |
| 55 to 64 Years | 36 (24.5%) | 6 (4.1%) |
| 65 to 74 Years | 14 (12.3%) | 14 (9.0%) |
| 75 Years and over | 0 (0.0%) | 25 (21.9%) |
| Total | 183 (17.2%) | 159 (16.4%) |
Income Above Poverty by Sex and Age in Lake Village
According to the poverty statistics in Lake Village, males aged 75 years and over and females aged 5 years are the age groups that are most secure financially, with 100.0% of males and 100.0% of females in these age groups living above the poverty line.
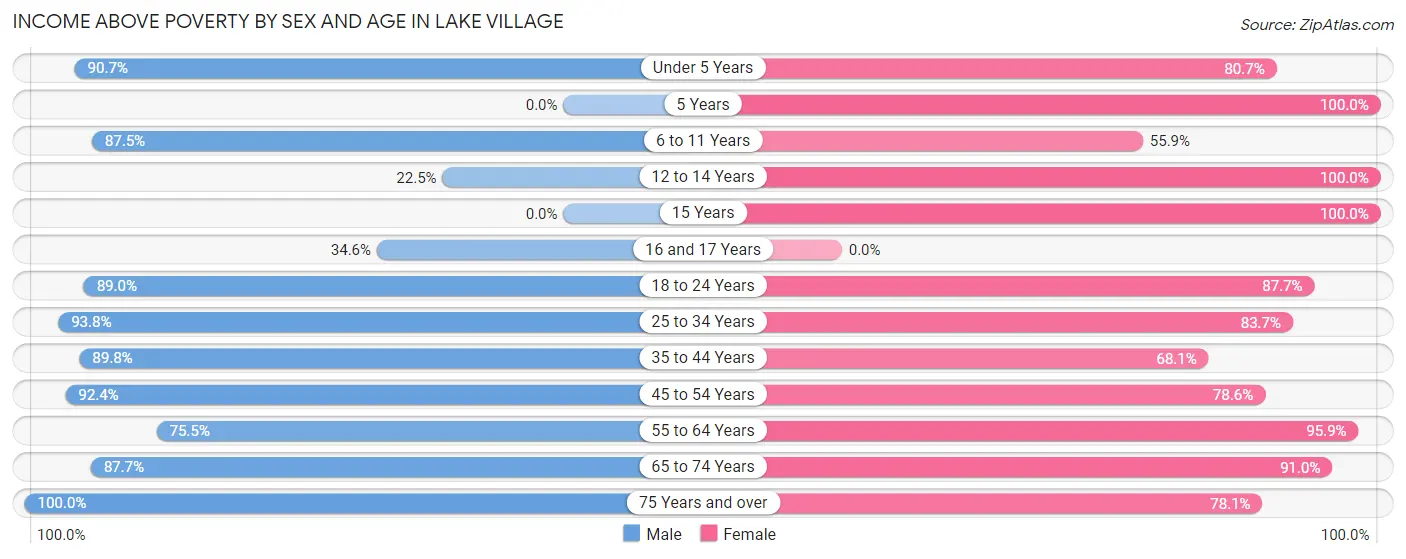
| Age Bracket | Male | Female |
| Under 5 Years | 78 (90.7%) | 71 (80.7%) |
| 5 Years | 0 (0.0%) | 7 (100.0%) |
| 6 to 11 Years | 84 (87.5%) | 19 (55.9%) |
| 12 to 14 Years | 11 (22.5%) | 26 (100.0%) |
| 15 Years | 0 (0.0%) | 17 (100.0%) |
| 16 and 17 Years | 18 (34.6%) | 0 (0.0%) |
| 18 to 24 Years | 73 (89.0%) | 50 (87.7%) |
| 25 to 34 Years | 150 (93.8%) | 113 (83.7%) |
| 35 to 44 Years | 150 (89.8%) | 81 (68.1%) |
| 45 to 54 Years | 61 (92.4%) | 55 (78.6%) |
| 55 to 64 Years | 111 (75.5%) | 140 (95.9%) |
| 65 to 74 Years | 100 (87.7%) | 142 (91.0%) |
| 75 Years and over | 46 (100.0%) | 89 (78.1%) |
| Total | 882 (82.8%) | 810 (83.6%) |
Income Below Poverty Among Married-Couple Families in Lake Village
The poverty statistics for married-couple families in Lake Village show that 5.2% or 18 of the total 343 families live below the poverty line. Families with 3 or 4 children have the highest poverty rate of 100.0%, comprising of 10 families. On the other hand, families with no children have the lowest poverty rate of 0.0%, which includes 0 families.
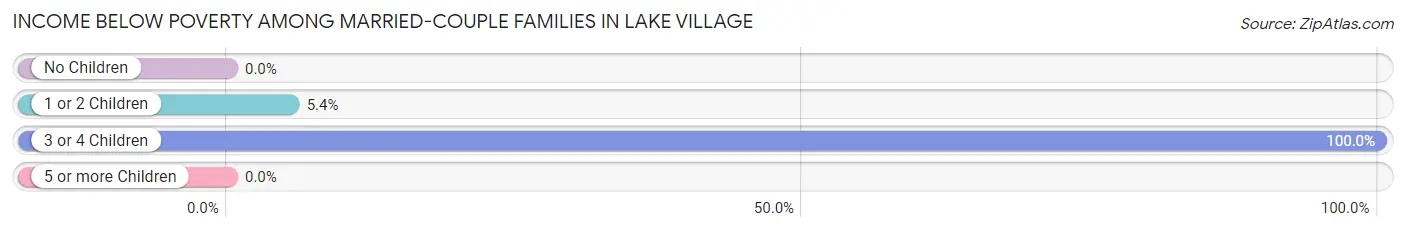
| Children | Above Poverty | Below Poverty |
| No Children | 184 (100.0%) | 0 (0.0%) |
| 1 or 2 Children | 141 (94.6%) | 8 (5.4%) |
| 3 or 4 Children | 0 (0.0%) | 10 (100.0%) |
| 5 or more Children | 0 (0.0%) | 0 (0.0%) |
| Total | 325 (94.8%) | 18 (5.2%) |
Income Below Poverty Among Single-Parent Households in Lake Village
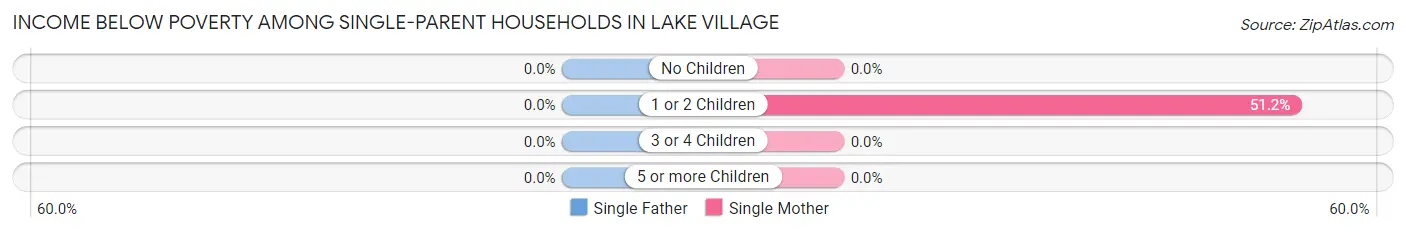
| Children | Single Father | Single Mother |
| No Children | 0 (0.0%) | 0 (0.0%) |
| 1 or 2 Children | 0 (0.0%) | 42 (51.2%) |
| 3 or 4 Children | 0 (0.0%) | 0 (0.0%) |
| 5 or more Children | 0 (0.0%) | 0 (0.0%) |
| Total | 0 (0.0%) | 42 (36.5%) |
Income Below Poverty Among Married-Couple vs Single-Parent Households in Lake Village
The poverty data for Lake Village shows that 18 of the married-couple family households (5.2%) and 42 of the single-parent households (27.1%) are living below the poverty level. Within the married-couple family households, those with 3 or 4 children have the highest poverty rate, with 10 households (100.0%) falling below the poverty line. Among the single-parent households, those with 1 or 2 children have the highest poverty rate, with 42 household (34.4%) living below poverty.
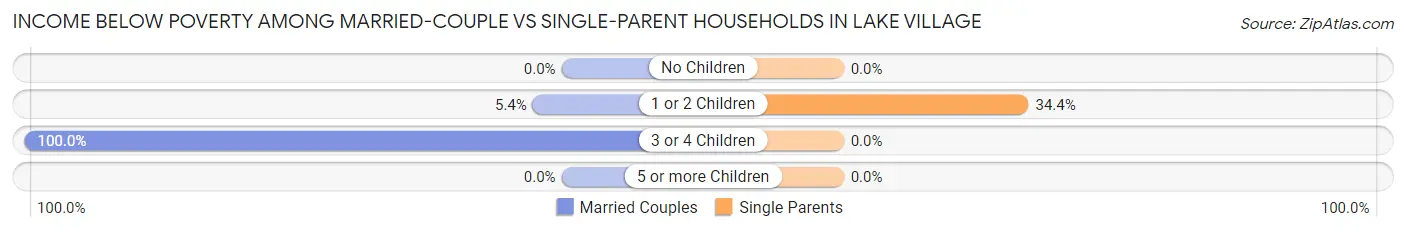
| Children | Married-Couple Families | Single-Parent Households |
| No Children | 0 (0.0%) | 0 (0.0%) |
| 1 or 2 Children | 8 (5.4%) | 42 (34.4%) |
| 3 or 4 Children | 10 (100.0%) | 0 (0.0%) |
| 5 or more Children | 0 (0.0%) | 0 (0.0%) |
| Total | 18 (5.2%) | 42 (27.1%) |
Race in Lake Village
The most populous races in Lake Village are Black / African American (1,145 | 54.9%), White / Caucasian (769 | 36.9%), and Hispanic or Latino (239 | 11.5%).
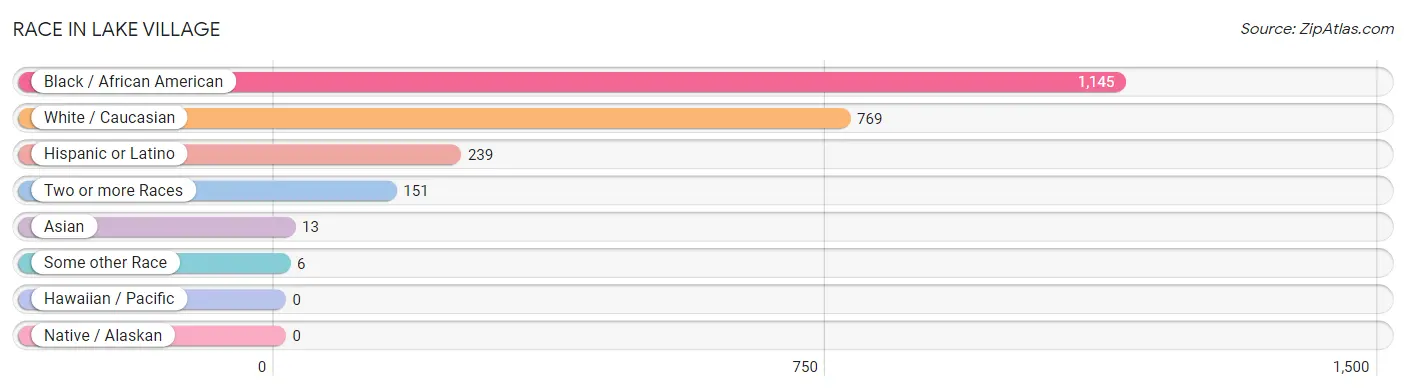
| Race | # Population | % Population |
| Asian | 13 | 0.6% |
| Black / African American | 1,145 | 54.9% |
| Hawaiian / Pacific | 0 | 0.0% |
| Hispanic or Latino | 239 | 11.5% |
| Native / Alaskan | 0 | 0.0% |
| White / Caucasian | 769 | 36.9% |
| Two or more Races | 151 | 7.2% |
| Some other Race | 6 | 0.3% |
| Total | 2,084 | 100.0% |
Ancestry in Lake Village
The most populous ancestries reported in Lake Village are Mexican (234 | 11.2%), Irish (106 | 5.1%), English (89 | 4.3%), Italian (79 | 3.8%), and German (49 | 2.4%), together accounting for 26.7% of all Lake Village residents.
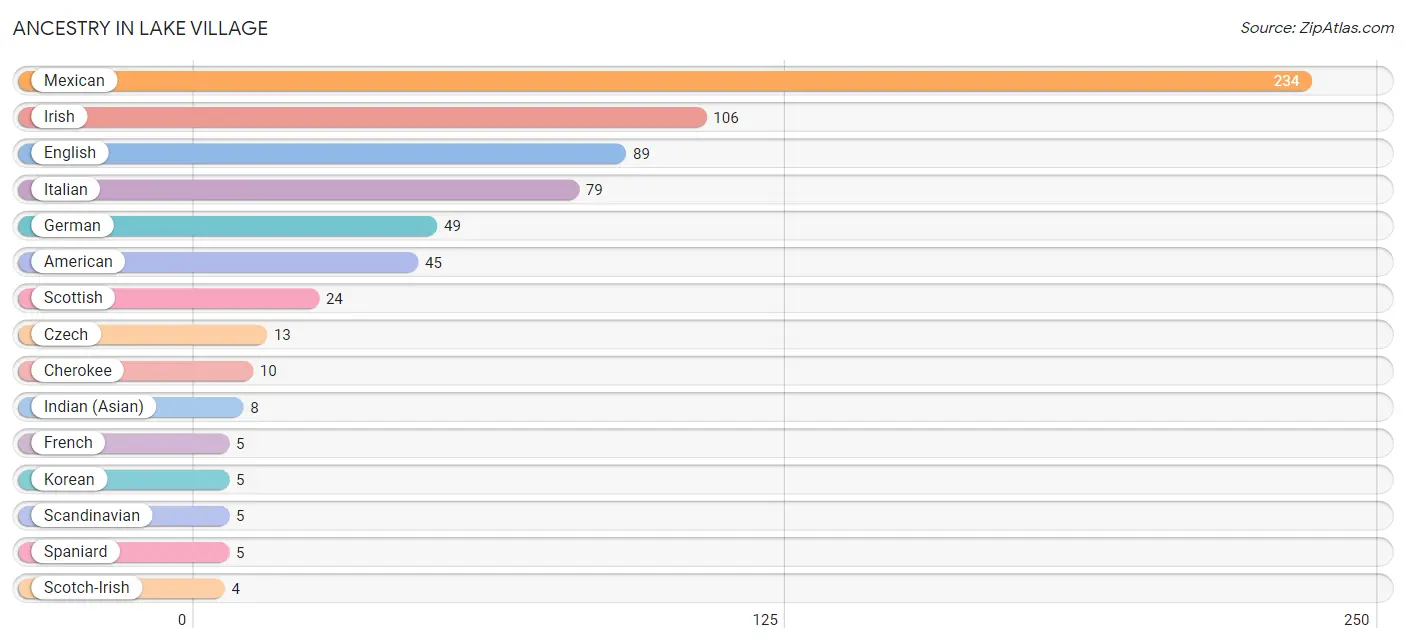
| Ancestry | # Population | % Population |
| American | 45 | 2.2% |
| Cherokee | 10 | 0.5% |
| Czech | 13 | 0.6% |
| English | 89 | 4.3% |
| French | 5 | 0.2% |
| German | 49 | 2.4% |
| Indian (Asian) | 8 | 0.4% |
| Irish | 106 | 5.1% |
| Italian | 79 | 3.8% |
| Korean | 5 | 0.2% |
| Mexican | 234 | 11.2% |
| Scandinavian | 5 | 0.2% |
| Scotch-Irish | 4 | 0.2% |
| Scottish | 24 | 1.1% |
| Spaniard | 5 | 0.2% |
| Swiss | 4 | 0.2% |
| Welsh | 4 | 0.2% | View All 17 Rows |
Immigrants in Lake Village
The most numerous immigrant groups reported in Lake Village came from Central America (117 | 5.6%), Latin America (117 | 5.6%), Mexico (117 | 5.6%), Asia (5 | 0.2%), and Philippines (5 | 0.2%), together accounting for 17.3% of all Lake Village residents.
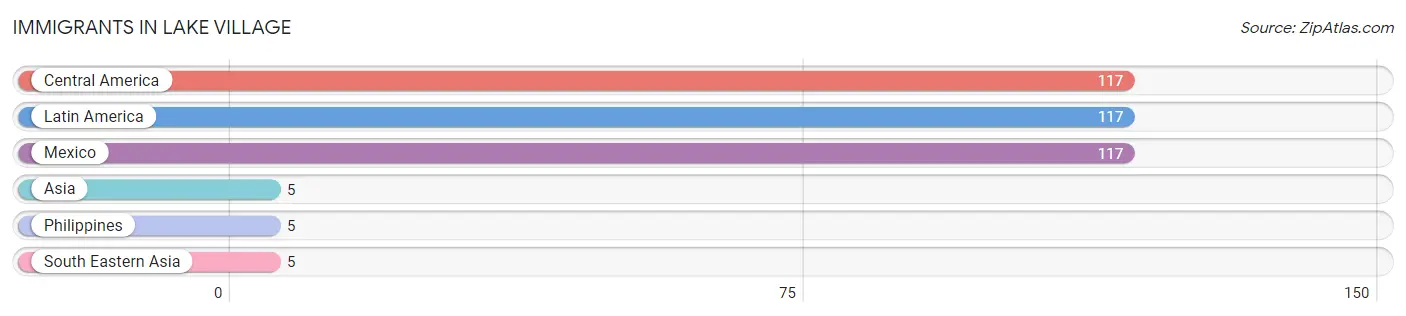
| Immigration Origin | # Population | % Population |
| Asia | 5 | 0.2% |
| Central America | 117 | 5.6% |
| Latin America | 117 | 5.6% |
| Mexico | 117 | 5.6% |
| Philippines | 5 | 0.2% |
| South Eastern Asia | 5 | 0.2% | View All 6 Rows |
Sex and Age in Lake Village
Sex and Age in Lake Village
The most populous age groups in Lake Village are 10 to 14 Years (104 | 9.7%) for men and 65 to 69 Years (109 | 10.8%) for women.
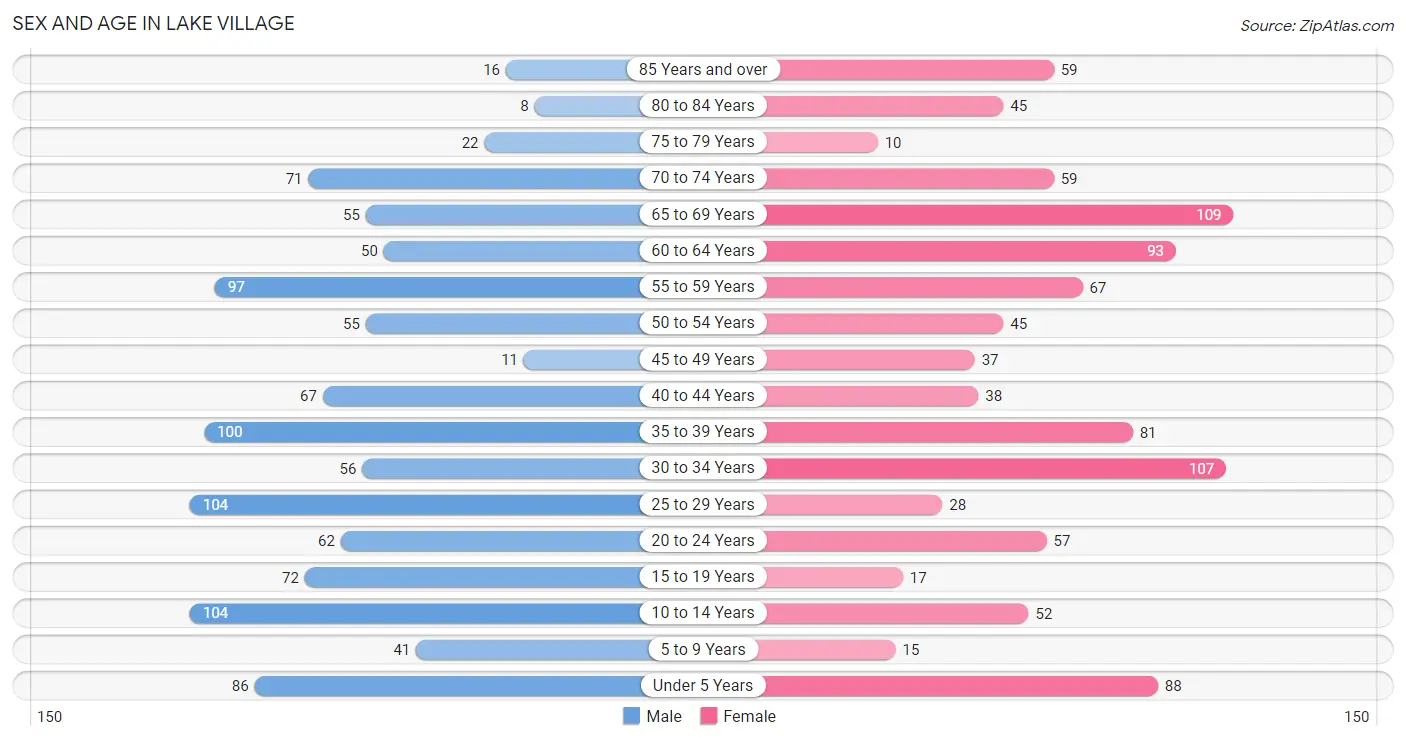
| Age Bracket | Male | Female |
| Under 5 Years | 86 (8.0%) | 88 (8.7%) |
| 5 to 9 Years | 41 (3.8%) | 15 (1.5%) |
| 10 to 14 Years | 104 (9.7%) | 52 (5.2%) |
| 15 to 19 Years | 72 (6.7%) | 17 (1.7%) |
| 20 to 24 Years | 62 (5.8%) | 57 (5.7%) |
| 25 to 29 Years | 104 (9.7%) | 28 (2.8%) |
| 30 to 34 Years | 56 (5.2%) | 107 (10.6%) |
| 35 to 39 Years | 100 (9.3%) | 81 (8.0%) |
| 40 to 44 Years | 67 (6.2%) | 38 (3.8%) |
| 45 to 49 Years | 11 (1.0%) | 37 (3.7%) |
| 50 to 54 Years | 55 (5.1%) | 45 (4.5%) |
| 55 to 59 Years | 97 (9.0%) | 67 (6.7%) |
| 60 to 64 Years | 50 (4.6%) | 93 (9.2%) |
| 65 to 69 Years | 55 (5.1%) | 109 (10.8%) |
| 70 to 74 Years | 71 (6.6%) | 59 (5.9%) |
| 75 to 79 Years | 22 (2.0%) | 10 (1.0%) |
| 80 to 84 Years | 8 (0.7%) | 45 (4.5%) |
| 85 Years and over | 16 (1.5%) | 59 (5.9%) |
| Total | 1,077 (100.0%) | 1,007 (100.0%) |
Families and Households in Lake Village
Median Family Size in Lake Village
The median family size in Lake Village is 3.15 persons per family, with married-couple families (343 | 68.9%) accounting for the largest median family size of 3.26 persons per family. On the other hand, single male/father families (40 | 8.0%) represent the smallest median family size with 2.13 persons per family.
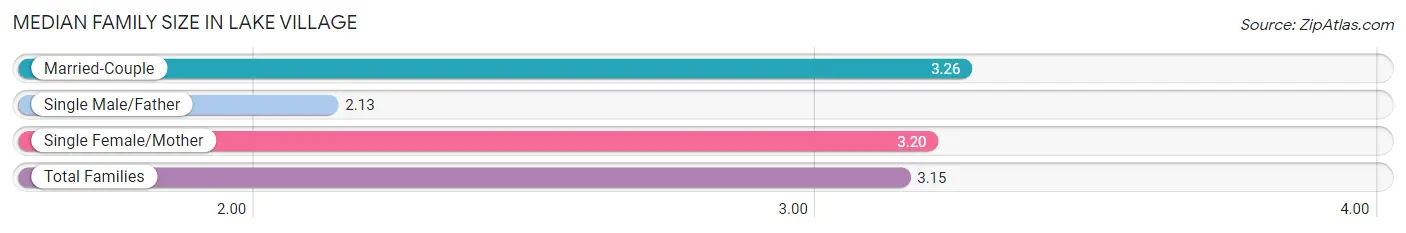
| Family Type | # Families | Family Size |
| Married-Couple | 343 (68.9%) | 3.26 |
| Single Male/Father | 40 (8.0%) | 2.13 |
| Single Female/Mother | 115 (23.1%) | 3.20 |
| Total Families | 498 (100.0%) | 3.15 |
Median Household Size in Lake Village
The median household size in Lake Village is 2.23 persons per household, with married-couple households (343 | 38.5%) accounting for the largest median household size of 3.26 persons per household. non-family households (392 | 44.0%) represent the smallest median household size with 1.02 persons per household.
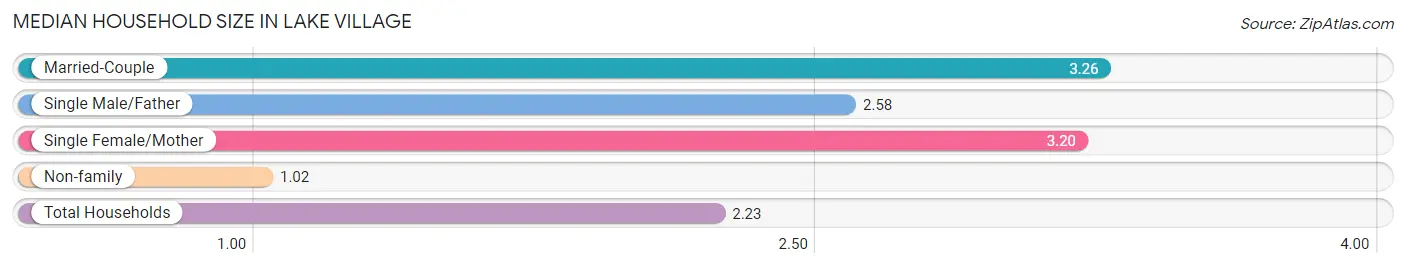
| Household Type | # Households | Household Size |
| Married-Couple | 343 (38.5%) | 3.26 |
| Single Male/Father | 40 (4.5%) | 2.58 |
| Single Female/Mother | 115 (12.9%) | 3.20 |
| Non-family | 392 (44.0%) | 1.02 |
| Total Households | 890 (100.0%) | 2.23 |
Household Size by Marriage Status in Lake Village
Out of a total of 890 households in Lake Village, 498 (56.0%) are family households, while 392 (44.0%) are nonfamily households. The most numerous type of family households are 2-person households, comprising 229, and the most common type of nonfamily households are 1-person households, comprising 386.
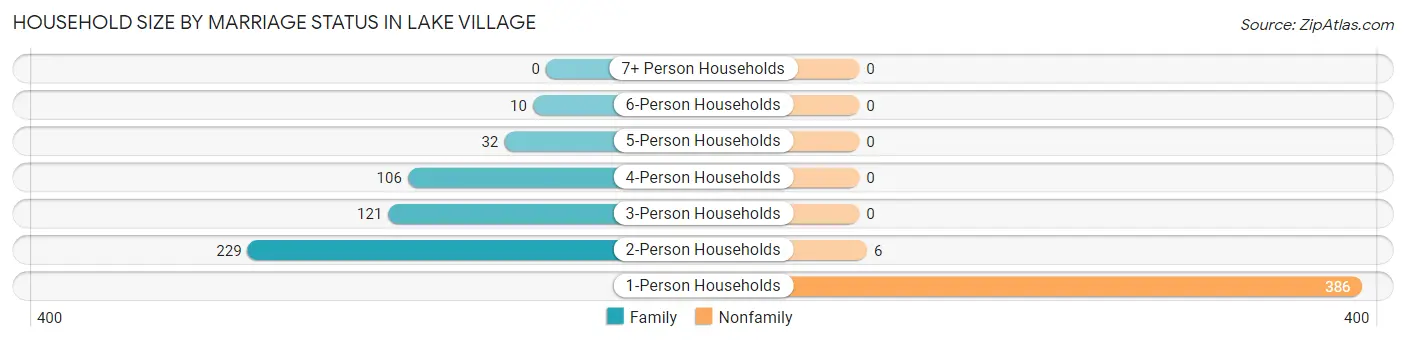
| Household Size | Family Households | Nonfamily Households |
| 1-Person Households | - | 386 (43.4%) |
| 2-Person Households | 229 (25.7%) | 6 (0.7%) |
| 3-Person Households | 121 (13.6%) | 0 (0.0%) |
| 4-Person Households | 106 (11.9%) | 0 (0.0%) |
| 5-Person Households | 32 (3.6%) | 0 (0.0%) |
| 6-Person Households | 10 (1.1%) | 0 (0.0%) |
| 7+ Person Households | 0 (0.0%) | 0 (0.0%) |
| Total | 498 (56.0%) | 392 (44.0%) |
Female Fertility in Lake Village
Fertility by Age in Lake Village
Average fertility rate in Lake Village is 123.0 births per 1,000 women. Women in the age bracket of 20 to 34 years have the highest fertility rate with 234.0 births per 1,000 women. Women in the age bracket of 20 to 34 years acount for 100.0% of all women with births.
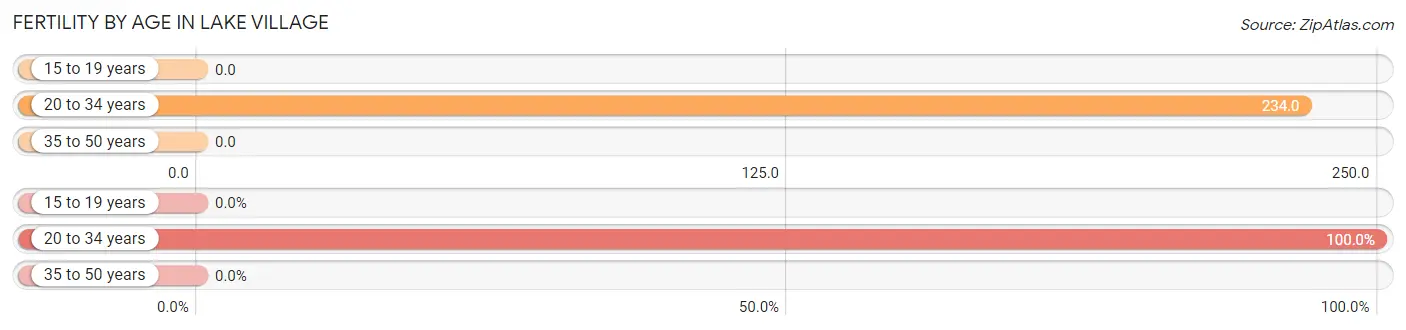
| Age Bracket | Women with Births | Births / 1,000 Women |
| 15 to 19 years | 0 (0.0%) | 0.0 |
| 20 to 34 years | 45 (100.0%) | 234.0 |
| 35 to 50 years | 0 (0.0%) | 0.0 |
| Total | 45 (100.0%) | 123.0 |
Fertility by Age by Marriage Status in Lake Village
93.3% of women with births (45) in Lake Village are married. The highest percentage of unmarried women with births falls into 20 to 34 years age bracket with 6.7% of them unmarried at the time of birth, while the lowest percentage of unmarried women with births belong to 20 to 34 years age bracket with 6.7% of them unmarried.
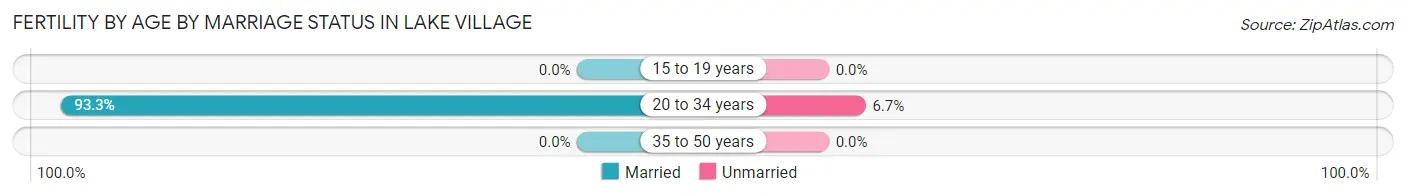
| Age Bracket | Married | Unmarried |
| 15 to 19 years | 0 (0.0%) | 0 (0.0%) |
| 20 to 34 years | 42 (93.3%) | 3 (6.7%) |
| 35 to 50 years | 0 (0.0%) | 0 (0.0%) |
| Total | 42 (93.3%) | 3 (6.7%) |
Fertility by Education in Lake Village
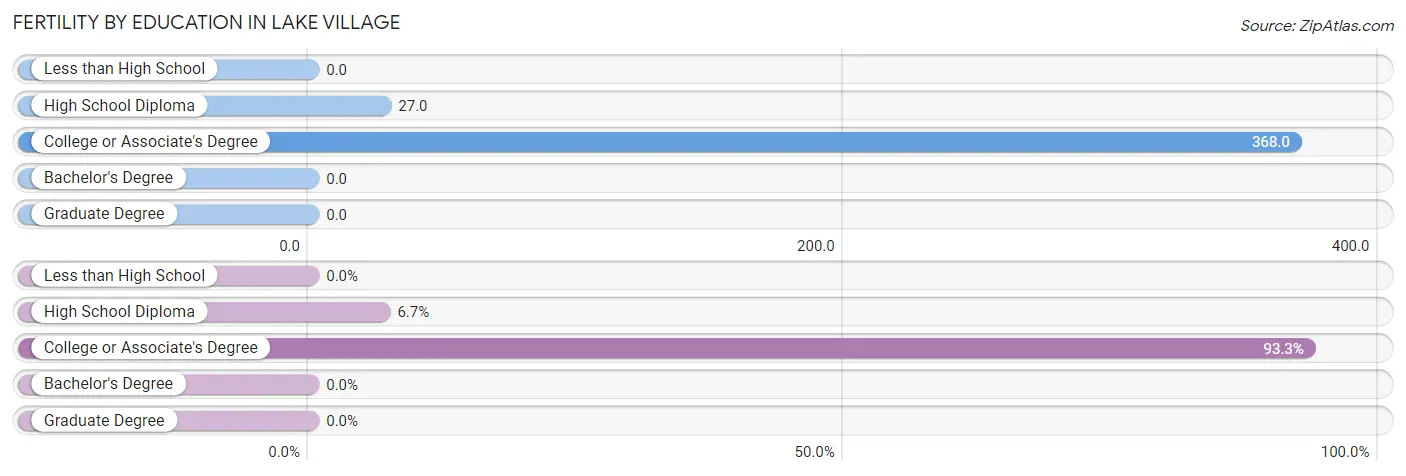
| Educational Attainment | Women with Births | Births / 1,000 Women |
| Less than High School | 0 (0.0%) | 0.0 |
| High School Diploma | 3 (6.7%) | 27.0 |
| College or Associate's Degree | 42 (93.3%) | 368.0 |
| Bachelor's Degree | 0 (0.0%) | 0.0 |
| Graduate Degree | 0 (0.0%) | 0.0 |
| Total | 45 (100.0%) | 123.0 |
Fertility by Education by Marriage Status in Lake Village
6.7% of women with births in Lake Village are unmarried. Women with the educational attainment of college or associate's degree are most likely to be married with 100.0% of them married at childbirth, while women with the educational attainment of high school diploma are least likely to be married with 100.0% of them unmarried at childbirth.
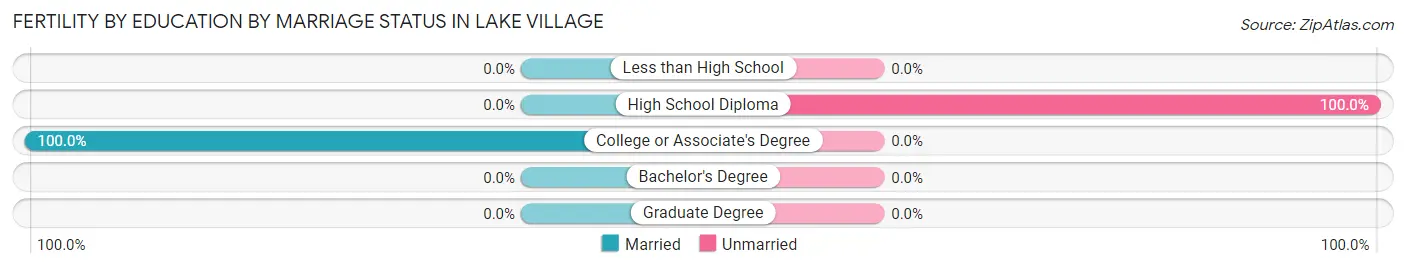
| Educational Attainment | Married | Unmarried |
| Less than High School | 0 (0.0%) | 0 (0.0%) |
| High School Diploma | 0 (0.0%) | 3 (100.0%) |
| College or Associate's Degree | 42 (100.0%) | 0 (0.0%) |
| Bachelor's Degree | 0 (0.0%) | 0 (0.0%) |
| Graduate Degree | 0 (0.0%) | 0 (0.0%) |
| Total | 42 (93.3%) | 3 (6.7%) |
Employment Characteristics in Lake Village
Employment by Class of Employer in Lake Village
Among the 828 employed individuals in Lake Village, private company employees (499 | 60.3%), state government employees (108 | 13.0%), and local government employees (80 | 9.7%) make up the most common classes of employment.
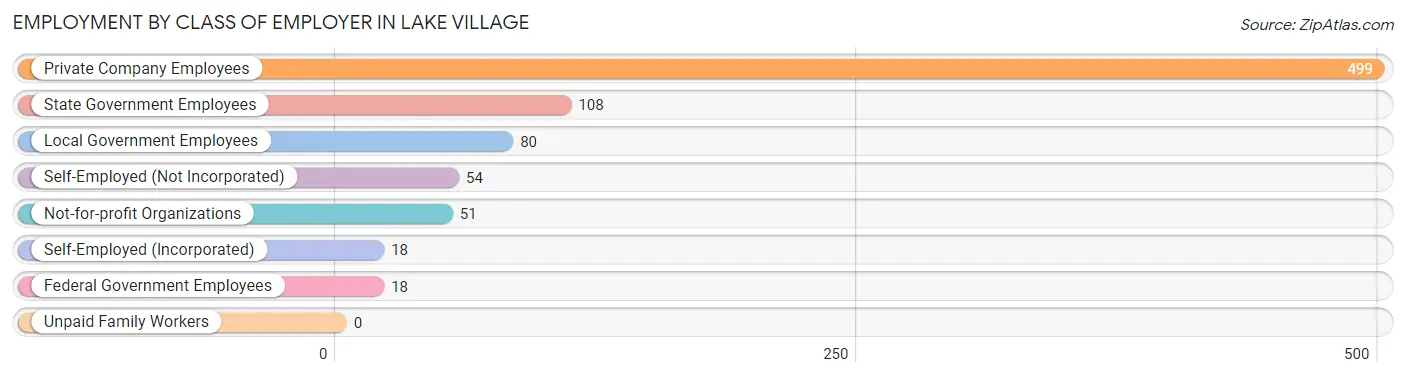
| Employer Class | # Employees | % Employees |
| Private Company Employees | 499 | 60.3% |
| Self-Employed (Incorporated) | 18 | 2.2% |
| Self-Employed (Not Incorporated) | 54 | 6.5% |
| Not-for-profit Organizations | 51 | 6.2% |
| Local Government Employees | 80 | 9.7% |
| State Government Employees | 108 | 13.0% |
| Federal Government Employees | 18 | 2.2% |
| Unpaid Family Workers | 0 | 0.0% |
| Total | 828 | 100.0% |
Employment Status by Age in Lake Village
According to the labor force statistics for Lake Village, out of the total population over 16 years of age (1,681), 52.1% or 876 individuals are in the labor force, with 5.5% or 48 of them unemployed. The age group with the highest labor force participation rate is 25 to 29 years, with 92.4% or 122 individuals in the labor force. Within the labor force, the 20 to 24 years age range has the highest percentage of unemployed individuals, with 18.1% or 13 of them being unemployed.
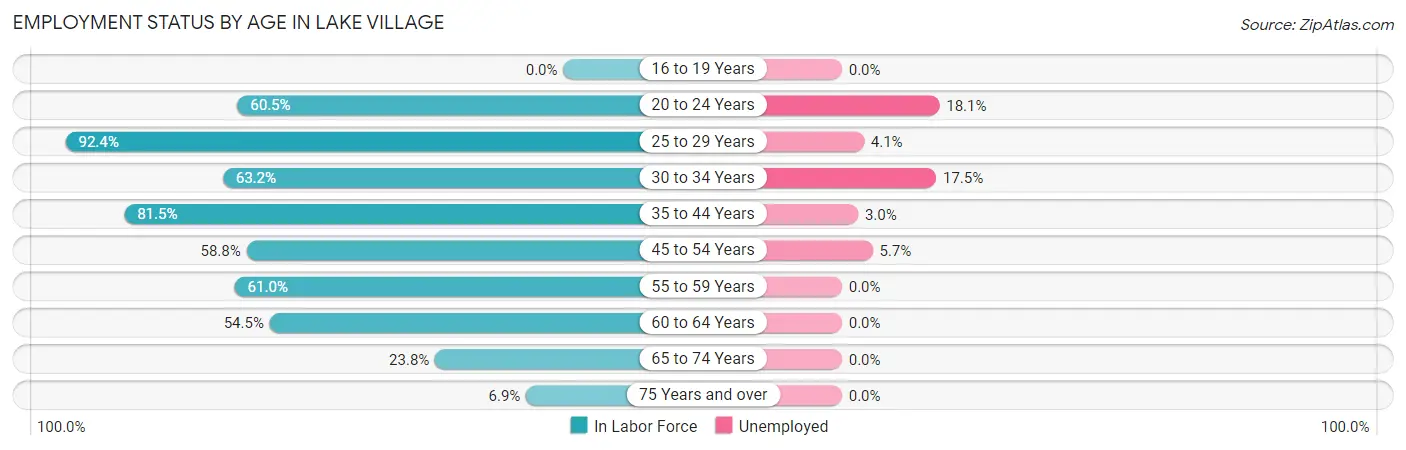
| Age Bracket | In Labor Force | Unemployed |
| 16 to 19 Years | 0 (0.0%) | 0 (0.0%) |
| 20 to 24 Years | 72 (60.5%) | 13 (18.1%) |
| 25 to 29 Years | 122 (92.4%) | 5 (4.1%) |
| 30 to 34 Years | 103 (63.2%) | 18 (17.5%) |
| 35 to 44 Years | 233 (81.5%) | 7 (3.0%) |
| 45 to 54 Years | 87 (58.8%) | 5 (5.7%) |
| 55 to 59 Years | 100 (61.0%) | 0 (0.0%) |
| 60 to 64 Years | 78 (54.5%) | 0 (0.0%) |
| 65 to 74 Years | 70 (23.8%) | 0 (0.0%) |
| 75 Years and over | 11 (6.9%) | 0 (0.0%) |
| Total | 876 (52.1%) | 48 (5.5%) |
Employment Status by Educational Attainment in Lake Village
According to labor force statistics for Lake Village, 69.8% of individuals (723) out of the total population between 25 and 64 years of age (1,036) are in the labor force, with 4.8% or 35 of them being unemployed. The group with the highest labor force participation rate are those with the educational attainment of bachelor's degree or higher, with 80.5% or 161 individuals in the labor force. Within the labor force, individuals with college / associate degree education have the highest percentage of unemployment, with 14.8% or 30 of them being unemployed.
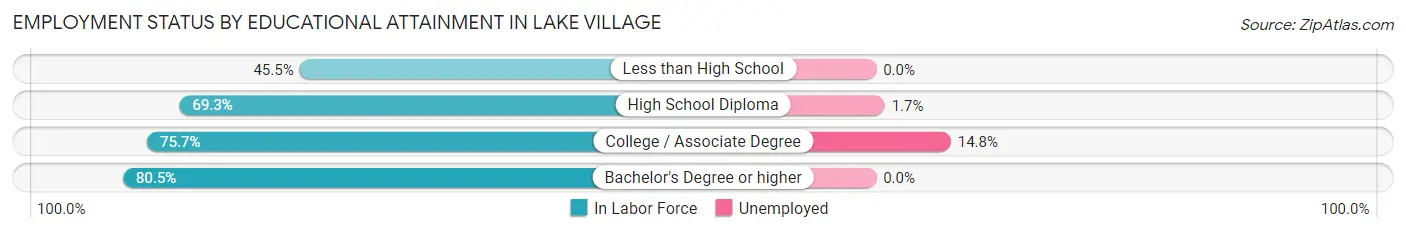
| Educational Attainment | In Labor Force | Unemployed |
| Less than High School | 66 (45.5%) | 0 (0.0%) |
| High School Diploma | 293 (69.3%) | 7 (1.7%) |
| College / Associate Degree | 203 (75.7%) | 40 (14.8%) |
| Bachelor's Degree or higher | 161 (80.5%) | 0 (0.0%) |
| Total | 723 (69.8%) | 50 (4.8%) |
Employment Occupations by Sex in Lake Village
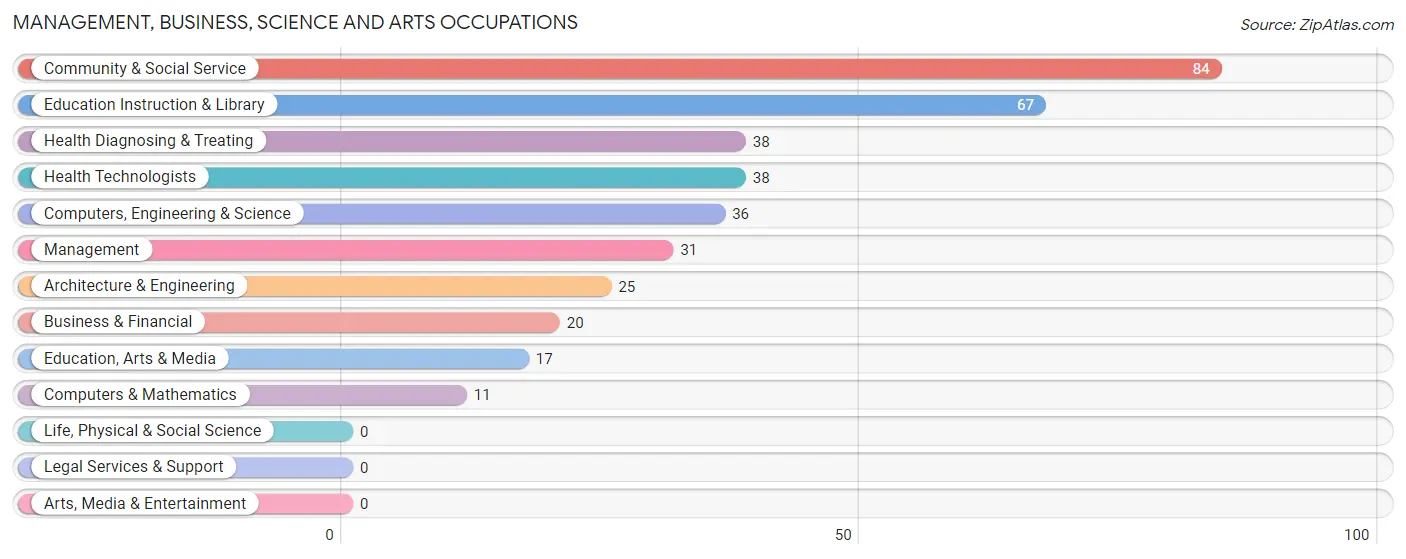
Management, Business, Science and Arts Occupations
The most common Management, Business, Science and Arts occupations in Lake Village are Community & Social Service (84 | 10.1%), Education Instruction & Library (67 | 8.1%), Health Diagnosing & Treating (38 | 4.6%), Health Technologists (38 | 4.6%), and Computers, Engineering & Science (36 | 4.3%).
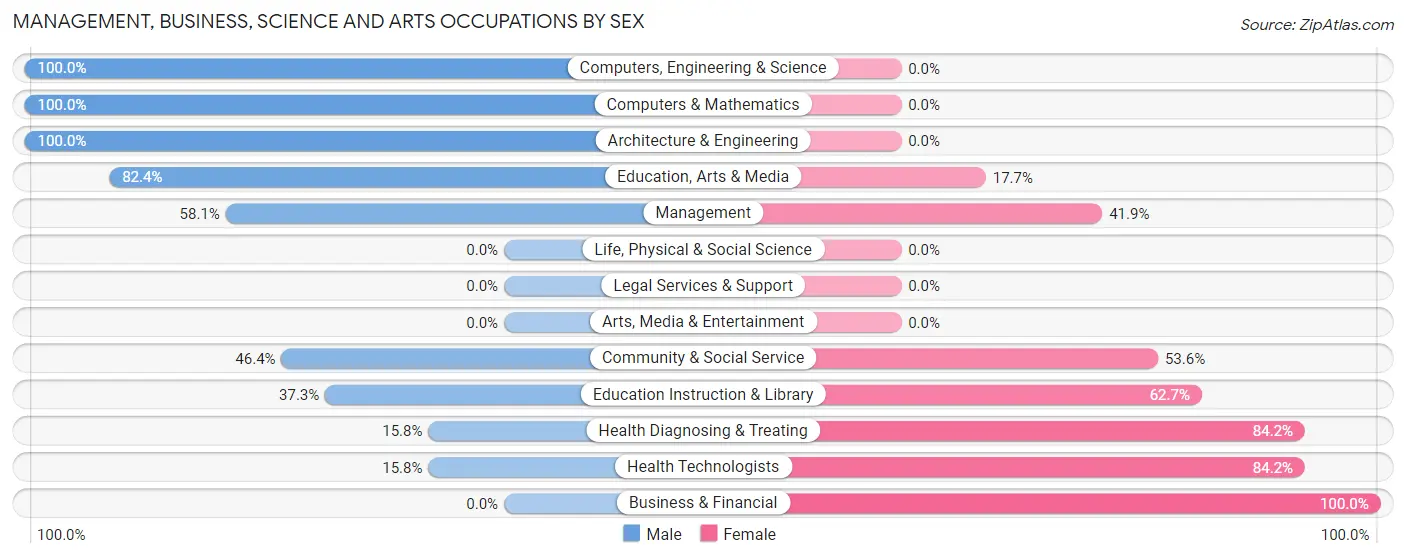
Management, Business, Science and Arts Occupations by Sex
Within the Management, Business, Science and Arts occupations in Lake Village, the most male-oriented occupations are Computers, Engineering & Science (100.0%), Computers & Mathematics (100.0%), and Architecture & Engineering (100.0%), while the most female-oriented occupations are Business & Financial (100.0%), Health Diagnosing & Treating (84.2%), and Health Technologists (84.2%).
| Occupation | Male | Female |
| Management | 18 (58.1%) | 13 (41.9%) |
| Business & Financial | 0 (0.0%) | 20 (100.0%) |
| Computers, Engineering & Science | 36 (100.0%) | 0 (0.0%) |
| Computers & Mathematics | 11 (100.0%) | 0 (0.0%) |
| Architecture & Engineering | 25 (100.0%) | 0 (0.0%) |
| Life, Physical & Social Science | 0 (0.0%) | 0 (0.0%) |
| Community & Social Service | 39 (46.4%) | 45 (53.6%) |
| Education, Arts & Media | 14 (82.4%) | 3 (17.6%) |
| Legal Services & Support | 0 (0.0%) | 0 (0.0%) |
| Education Instruction & Library | 25 (37.3%) | 42 (62.7%) |
| Arts, Media & Entertainment | 0 (0.0%) | 0 (0.0%) |
| Health Diagnosing & Treating | 6 (15.8%) | 32 (84.2%) |
| Health Technologists | 6 (15.8%) | 32 (84.2%) |
| Total (Category) | 99 (47.4%) | 110 (52.6%) |
| Total (Overall) | 451 (54.5%) | 377 (45.5%) |
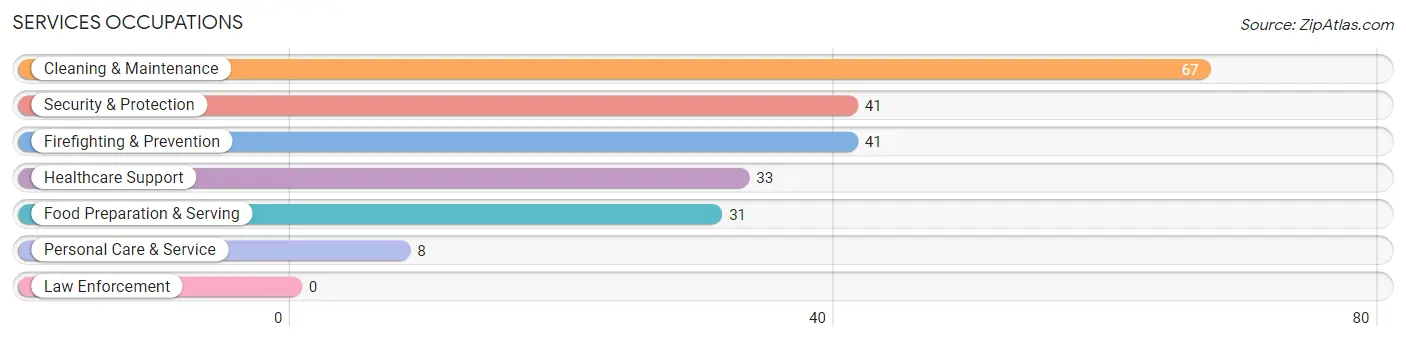
Services Occupations
The most common Services occupations in Lake Village are Cleaning & Maintenance (67 | 8.1%), Security & Protection (41 | 5.0%), Firefighting & Prevention (41 | 5.0%), Healthcare Support (33 | 4.0%), and Food Preparation & Serving (31 | 3.7%).
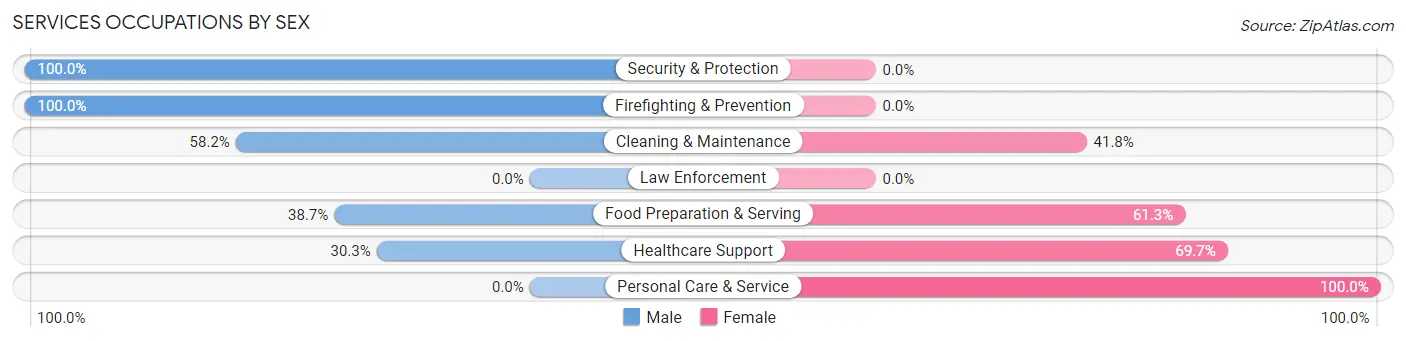
Services Occupations by Sex
Within the Services occupations in Lake Village, the most male-oriented occupations are Security & Protection (100.0%), Firefighting & Prevention (100.0%), and Cleaning & Maintenance (58.2%), while the most female-oriented occupations are Personal Care & Service (100.0%), Healthcare Support (69.7%), and Food Preparation & Serving (61.3%).
| Occupation | Male | Female |
| Healthcare Support | 10 (30.3%) | 23 (69.7%) |
| Security & Protection | 41 (100.0%) | 0 (0.0%) |
| Firefighting & Prevention | 41 (100.0%) | 0 (0.0%) |
| Law Enforcement | 0 (0.0%) | 0 (0.0%) |
| Food Preparation & Serving | 12 (38.7%) | 19 (61.3%) |
| Cleaning & Maintenance | 39 (58.2%) | 28 (41.8%) |
| Personal Care & Service | 0 (0.0%) | 8 (100.0%) |
| Total (Category) | 102 (56.7%) | 78 (43.3%) |
| Total (Overall) | 451 (54.5%) | 377 (45.5%) |
Sales and Office Occupations
The most common Sales and Office occupations in Lake Village are Sales & Related (79 | 9.5%), and Office & Administration (75 | 9.1%).
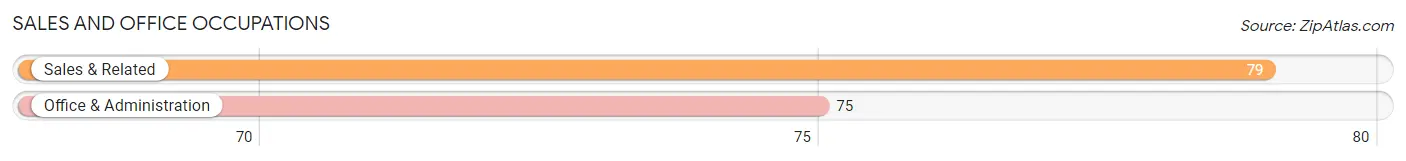
Sales and Office Occupations by Sex
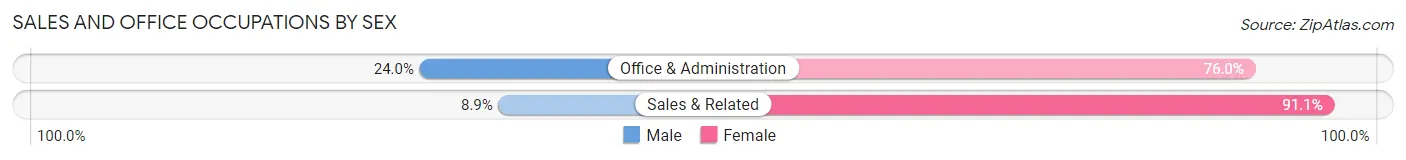
| Occupation | Male | Female |
| Sales & Related | 7 (8.9%) | 72 (91.1%) |
| Office & Administration | 18 (24.0%) | 57 (76.0%) |
| Total (Category) | 25 (16.2%) | 129 (83.8%) |
| Total (Overall) | 451 (54.5%) | 377 (45.5%) |
Natural Resources, Construction and Maintenance Occupations
The most common Natural Resources, Construction and Maintenance occupations in Lake Village are Construction & Extraction (69 | 8.3%), Installation, Maintenance & Repair (40 | 4.8%), and Farming, Fishing & Forestry (22 | 2.7%).
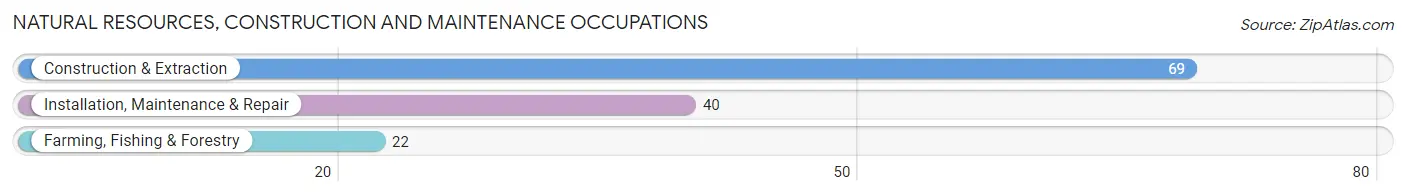
Natural Resources, Construction and Maintenance Occupations by Sex
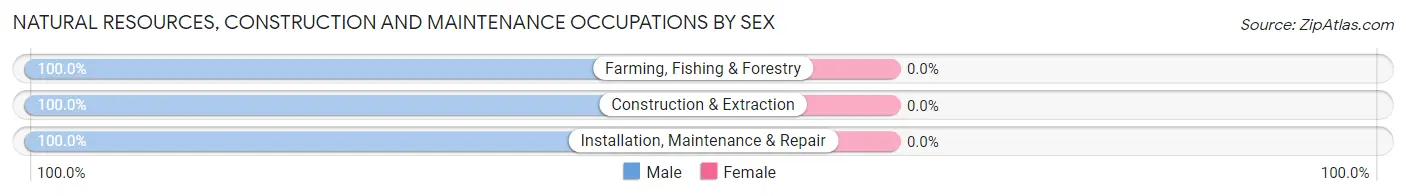
| Occupation | Male | Female |
| Farming, Fishing & Forestry | 22 (100.0%) | 0 (0.0%) |
| Construction & Extraction | 69 (100.0%) | 0 (0.0%) |
| Installation, Maintenance & Repair | 40 (100.0%) | 0 (0.0%) |
| Total (Category) | 131 (100.0%) | 0 (0.0%) |
| Total (Overall) | 451 (54.5%) | 377 (45.5%) |
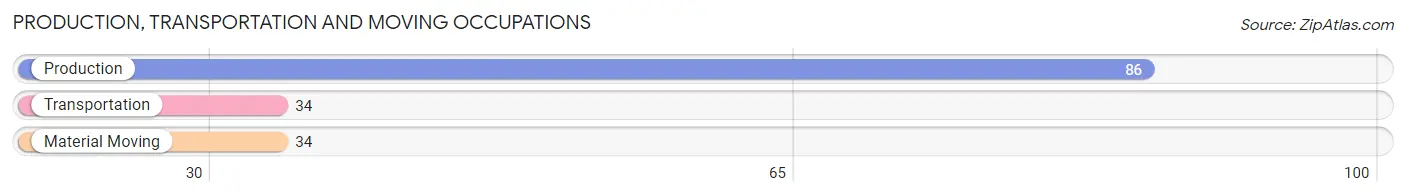
Production, Transportation and Moving Occupations
The most common Production, Transportation and Moving occupations in Lake Village are Production (86 | 10.4%), Transportation (34 | 4.1%), and Material Moving (34 | 4.1%).
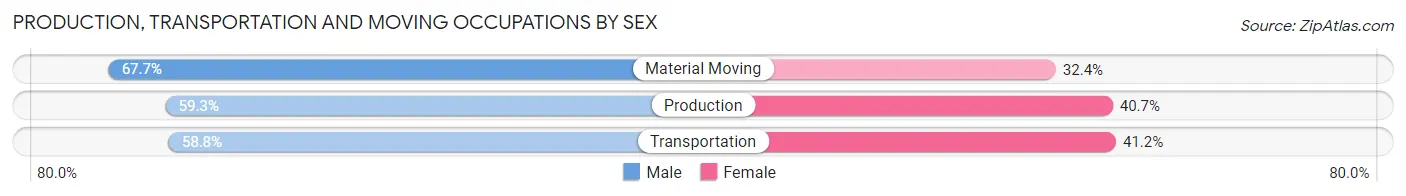
Production, Transportation and Moving Occupations by Sex
| Occupation | Male | Female |
| Production | 51 (59.3%) | 35 (40.7%) |
| Transportation | 20 (58.8%) | 14 (41.2%) |
| Material Moving | 23 (67.6%) | 11 (32.4%) |
| Total (Category) | 94 (61.0%) | 60 (39.0%) |
| Total (Overall) | 451 (54.5%) | 377 (45.5%) |
Employment Industries by Sex in Lake Village
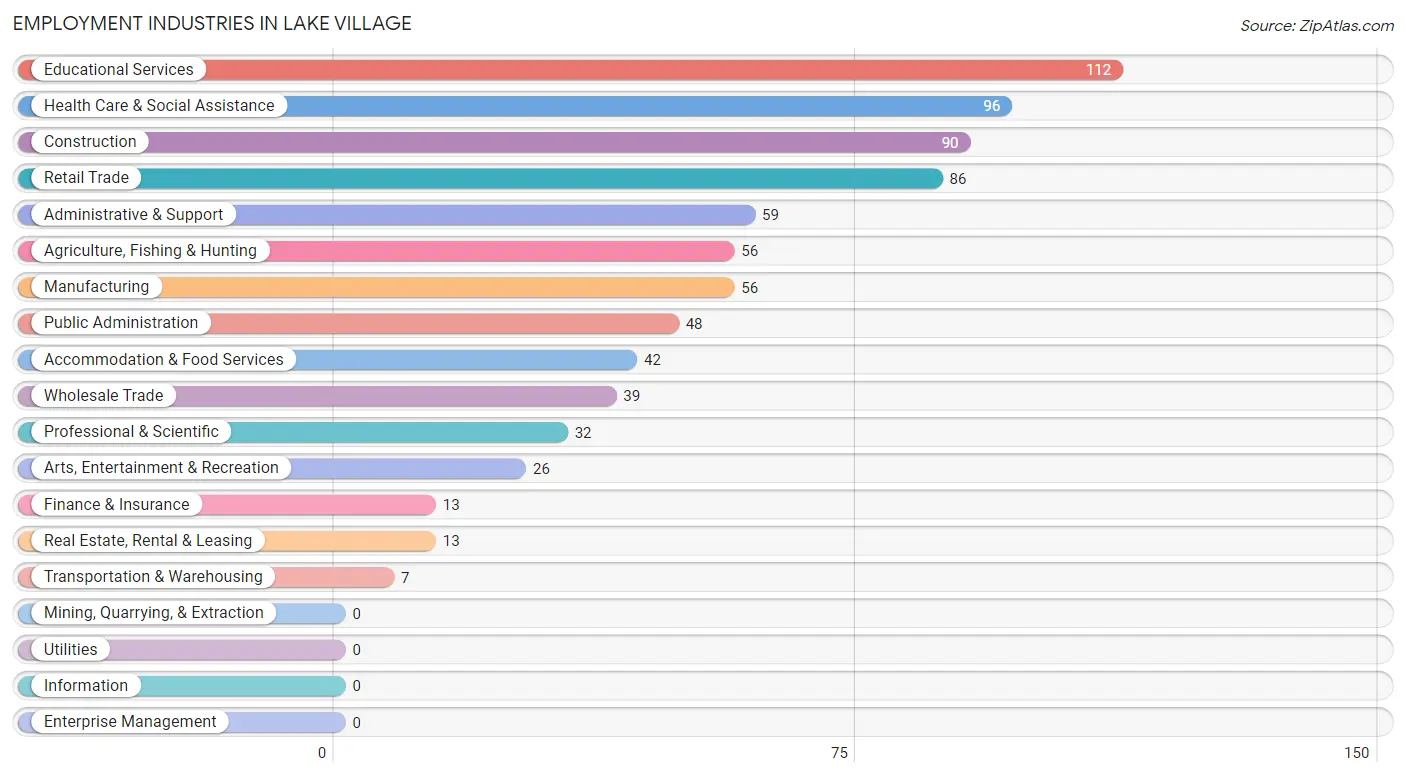
Employment Industries in Lake Village
The major employment industries in Lake Village include Educational Services (112 | 13.5%), Health Care & Social Assistance (96 | 11.6%), Construction (90 | 10.9%), Retail Trade (86 | 10.4%), and Administrative & Support (59 | 7.1%).
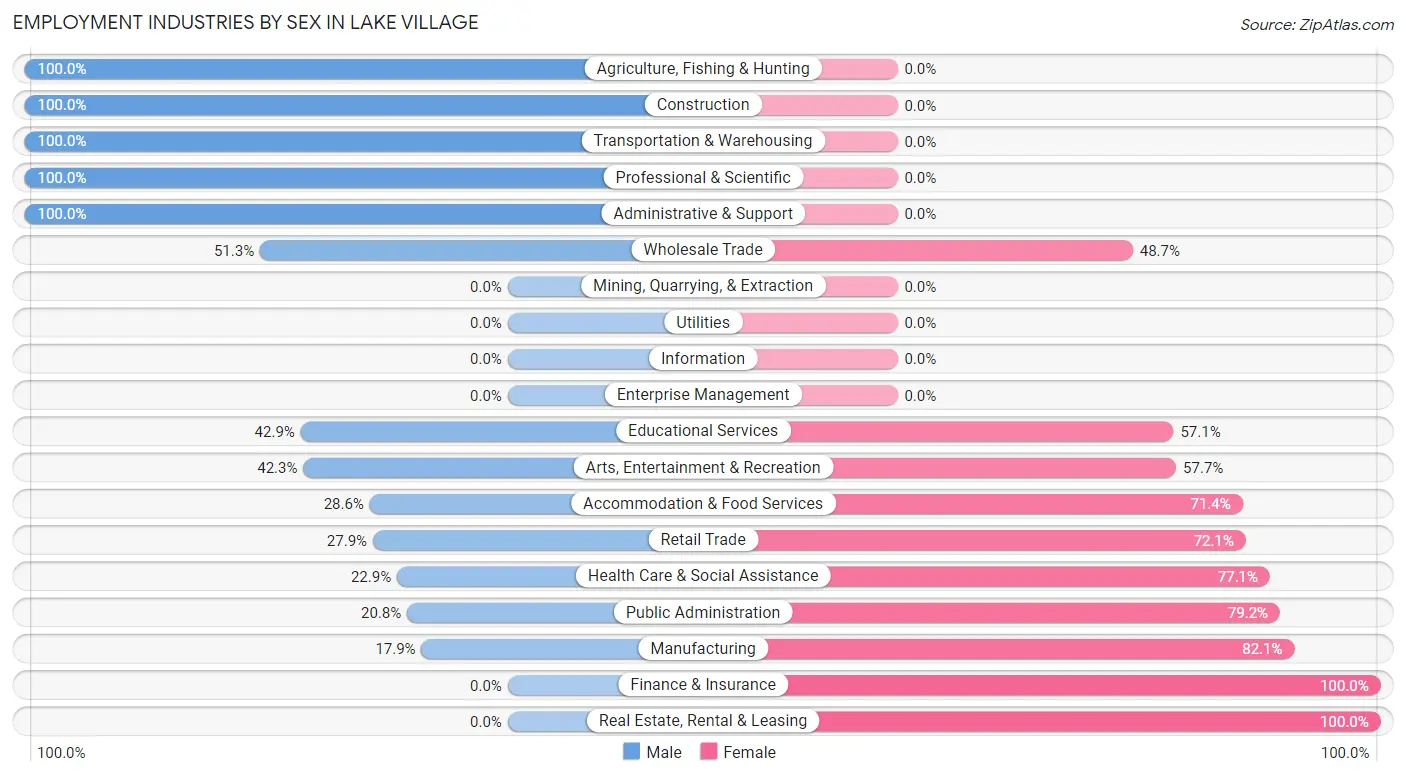
Employment Industries by Sex in Lake Village
The Lake Village industries that see more men than women are Agriculture, Fishing & Hunting (100.0%), Construction (100.0%), and Transportation & Warehousing (100.0%), whereas the industries that tend to have a higher number of women are Finance & Insurance (100.0%), Real Estate, Rental & Leasing (100.0%), and Manufacturing (82.1%).
| Industry | Male | Female |
| Agriculture, Fishing & Hunting | 56 (100.0%) | 0 (0.0%) |
| Mining, Quarrying, & Extraction | 0 (0.0%) | 0 (0.0%) |
| Construction | 90 (100.0%) | 0 (0.0%) |
| Manufacturing | 10 (17.9%) | 46 (82.1%) |
| Wholesale Trade | 20 (51.3%) | 19 (48.7%) |
| Retail Trade | 24 (27.9%) | 62 (72.1%) |
| Transportation & Warehousing | 7 (100.0%) | 0 (0.0%) |
| Utilities | 0 (0.0%) | 0 (0.0%) |
| Information | 0 (0.0%) | 0 (0.0%) |
| Finance & Insurance | 0 (0.0%) | 13 (100.0%) |
| Real Estate, Rental & Leasing | 0 (0.0%) | 13 (100.0%) |
| Professional & Scientific | 32 (100.0%) | 0 (0.0%) |
| Enterprise Management | 0 (0.0%) | 0 (0.0%) |
| Administrative & Support | 59 (100.0%) | 0 (0.0%) |
| Educational Services | 48 (42.9%) | 64 (57.1%) |
| Health Care & Social Assistance | 22 (22.9%) | 74 (77.1%) |
| Arts, Entertainment & Recreation | 11 (42.3%) | 15 (57.7%) |
| Accommodation & Food Services | 12 (28.6%) | 30 (71.4%) |
| Public Administration | 10 (20.8%) | 38 (79.2%) |
| Total | 451 (54.5%) | 377 (45.5%) |
Education in Lake Village
School Enrollment in Lake Village
The most common levels of schooling among the 392 students in Lake Village are high school (102 | 26.0%), middle school (94 | 24.0%), and elementary school (78 | 19.9%).
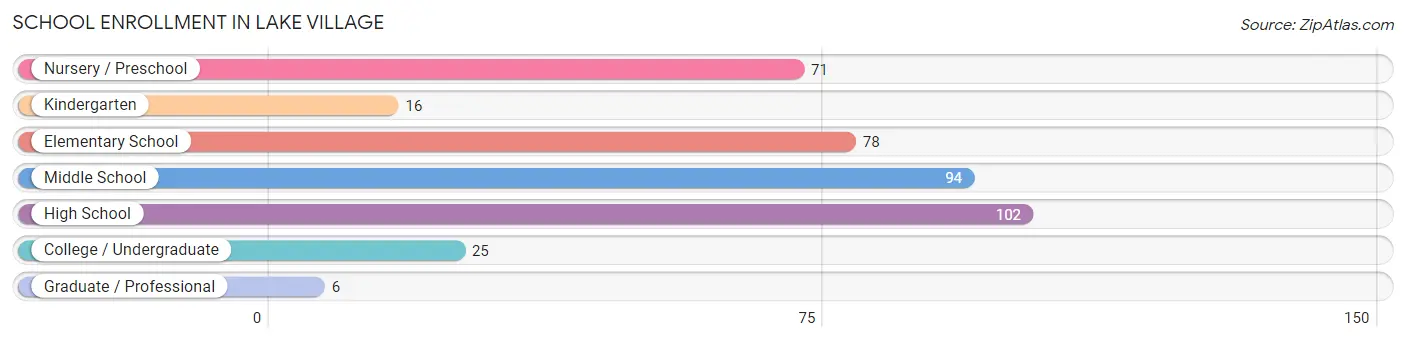
| School Level | # Students | % Students |
| Nursery / Preschool | 71 | 18.1% |
| Kindergarten | 16 | 4.1% |
| Elementary School | 78 | 19.9% |
| Middle School | 94 | 24.0% |
| High School | 102 | 26.0% |
| College / Undergraduate | 25 | 6.4% |
| Graduate / Professional | 6 | 1.5% |
| Total | 392 | 100.0% |
School Enrollment by Age by Funding Source in Lake Village
Out of a total of 392 students who are enrolled in schools in Lake Village, 20 (5.1%) attend a private institution, while the remaining 372 (94.9%) are enrolled in public schools. The age group of 5 to 9 year old has the highest likelihood of being enrolled in private schools, with 14 (28.6% in the age bracket) enrolled. Conversely, the age group of 3 to 4 year olds has the lowest likelihood of being enrolled in a private school, with 71 (100.0% in the age bracket) attending a public institution.
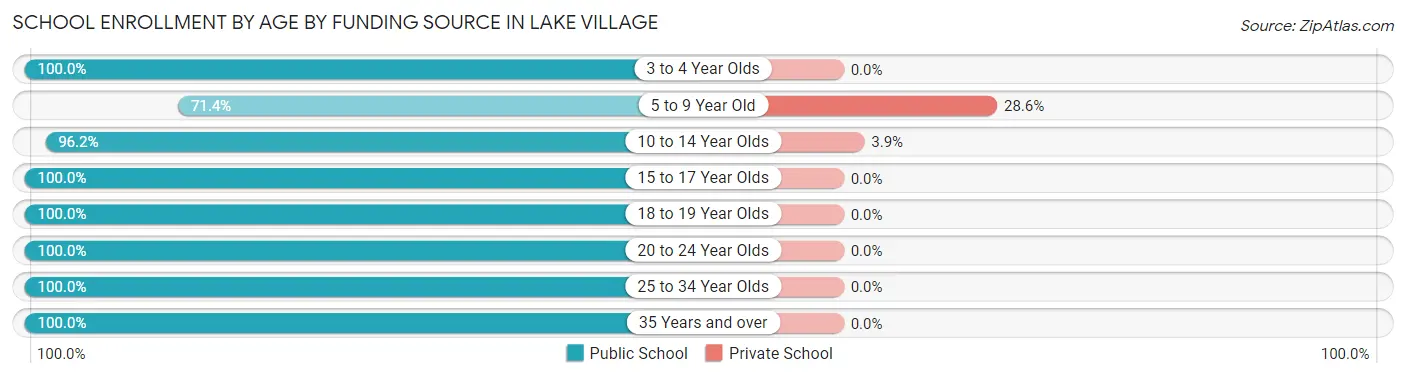
| Age Bracket | Public School | Private School |
| 3 to 4 Year Olds | 71 (100.0%) | 0 (0.0%) |
| 5 to 9 Year Old | 35 (71.4%) | 14 (28.6%) |
| 10 to 14 Year Olds | 150 (96.2%) | 6 (3.8%) |
| 15 to 17 Year Olds | 69 (100.0%) | 0 (0.0%) |
| 18 to 19 Year Olds | 20 (100.0%) | 0 (0.0%) |
| 20 to 24 Year Olds | 9 (100.0%) | 0 (0.0%) |
| 25 to 34 Year Olds | 2 (100.0%) | 0 (0.0%) |
| 35 Years and over | 16 (100.0%) | 0 (0.0%) |
| Total | 372 (94.9%) | 20 (5.1%) |
Educational Attainment by Field of Study in Lake Village
Education (69 | 21.6%), business (59 | 18.5%), bio, nature & agricultural (29 | 9.1%), science & technology (28 | 8.8%), and arts & humanities (28 | 8.8%) are the most common fields of study among 319 individuals in Lake Village who have obtained a bachelor's degree or higher.
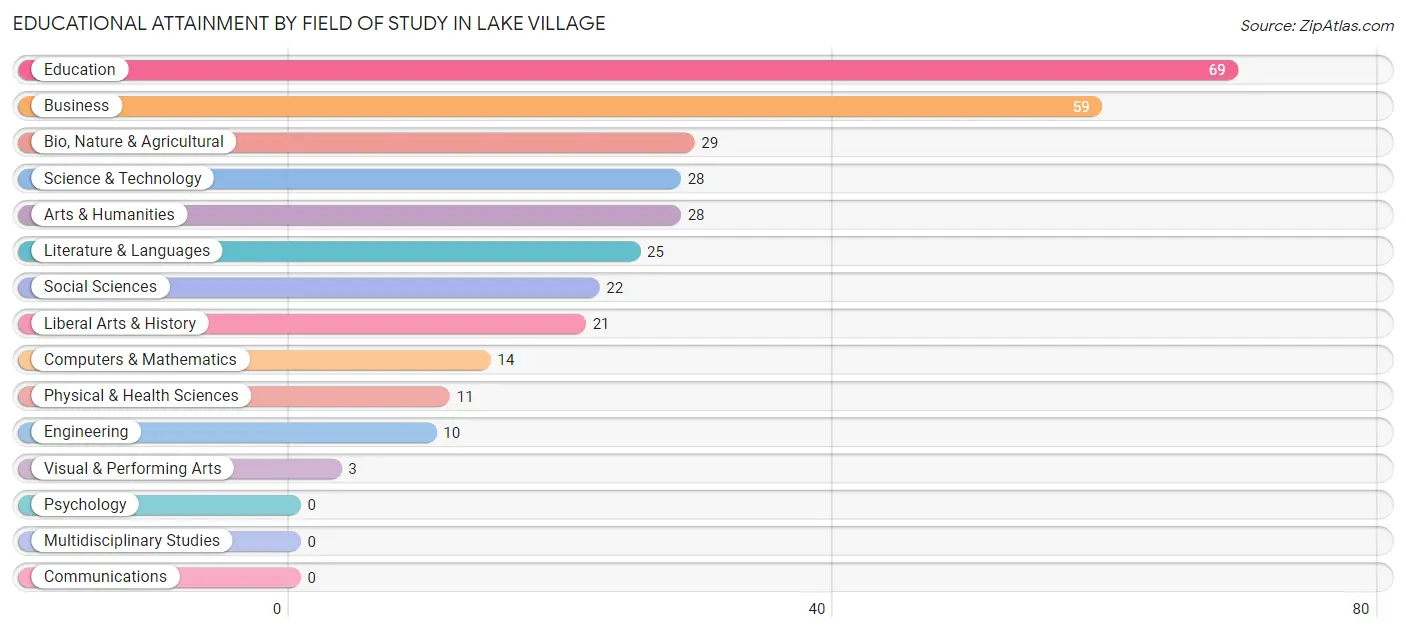
| Field of Study | # Graduates | % Graduates |
| Computers & Mathematics | 14 | 4.4% |
| Bio, Nature & Agricultural | 29 | 9.1% |
| Physical & Health Sciences | 11 | 3.5% |
| Psychology | 0 | 0.0% |
| Social Sciences | 22 | 6.9% |
| Engineering | 10 | 3.1% |
| Multidisciplinary Studies | 0 | 0.0% |
| Science & Technology | 28 | 8.8% |
| Business | 59 | 18.5% |
| Education | 69 | 21.6% |
| Literature & Languages | 25 | 7.8% |
| Liberal Arts & History | 21 | 6.6% |
| Visual & Performing Arts | 3 | 0.9% |
| Communications | 0 | 0.0% |
| Arts & Humanities | 28 | 8.8% |
| Total | 319 | 100.0% |
Transportation & Commute in Lake Village
Vehicle Availability by Sex in Lake Village
The most prevalent vehicle ownership categories in Lake Village are males with 2 vehicles (182, accounting for 42.1%) and females with 2 vehicles (164, making up 48.3%).
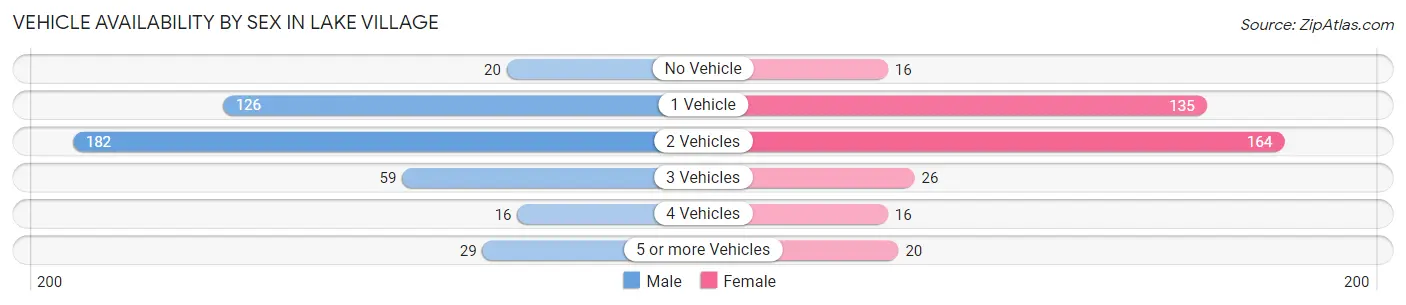
| Vehicles Available | Male | Female |
| No Vehicle | 20 (4.6%) | 16 (4.2%) |
| 1 Vehicle | 126 (29.2%) | 135 (35.8%) |
| 2 Vehicles | 182 (42.1%) | 164 (43.5%) |
| 3 Vehicles | 59 (13.7%) | 26 (6.9%) |
| 4 Vehicles | 16 (3.7%) | 16 (4.2%) |
| 5 or more Vehicles | 29 (6.7%) | 20 (5.3%) |
| Total | 432 (100.0%) | 377 (100.0%) |
Commute Time in Lake Village
The most frequently occuring commute durations in Lake Village are 5 to 9 minutes (278 commuters, 33.9%), 15 to 19 minutes (114 commuters, 13.9%), and less than 5 minutes (105 commuters, 12.8%).
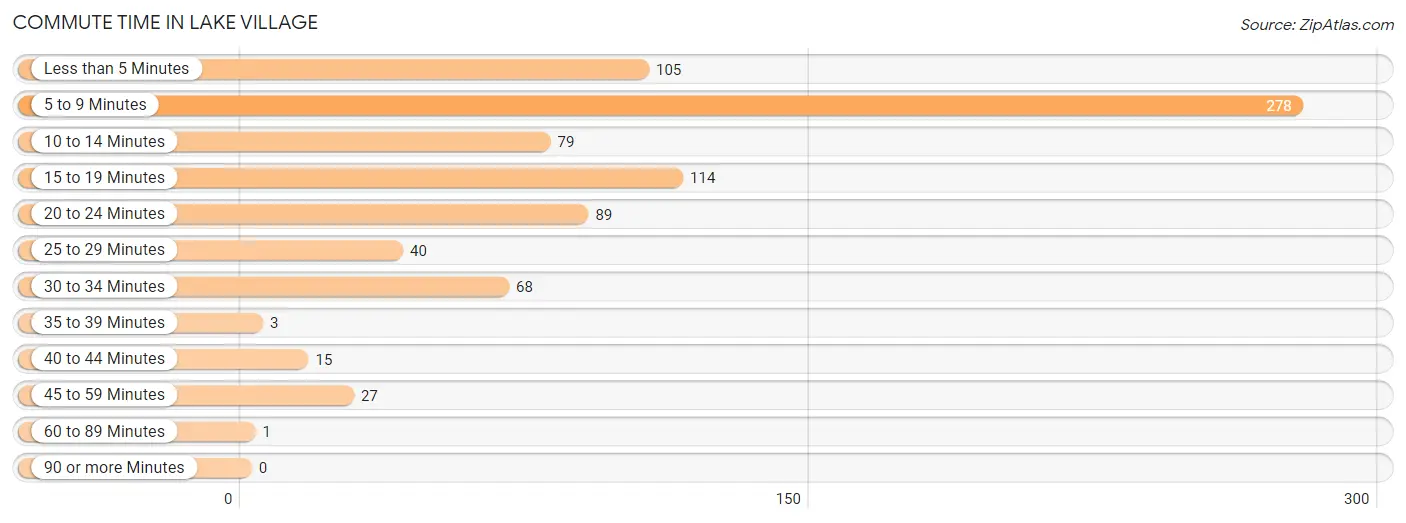
| Commute Time | # Commuters | % Commuters |
| Less than 5 Minutes | 105 | 12.8% |
| 5 to 9 Minutes | 278 | 33.9% |
| 10 to 14 Minutes | 79 | 9.7% |
| 15 to 19 Minutes | 114 | 13.9% |
| 20 to 24 Minutes | 89 | 10.9% |
| 25 to 29 Minutes | 40 | 4.9% |
| 30 to 34 Minutes | 68 | 8.3% |
| 35 to 39 Minutes | 3 | 0.4% |
| 40 to 44 Minutes | 15 | 1.8% |
| 45 to 59 Minutes | 27 | 3.3% |
| 60 to 89 Minutes | 1 | 0.1% |
| 90 or more Minutes | 0 | 0.0% |
Commute Time by Sex in Lake Village
The most common commute times in Lake Village are 5 to 9 minutes (117 commuters, 26.5%) for males and 5 to 9 minutes (161 commuters, 42.7%) for females.
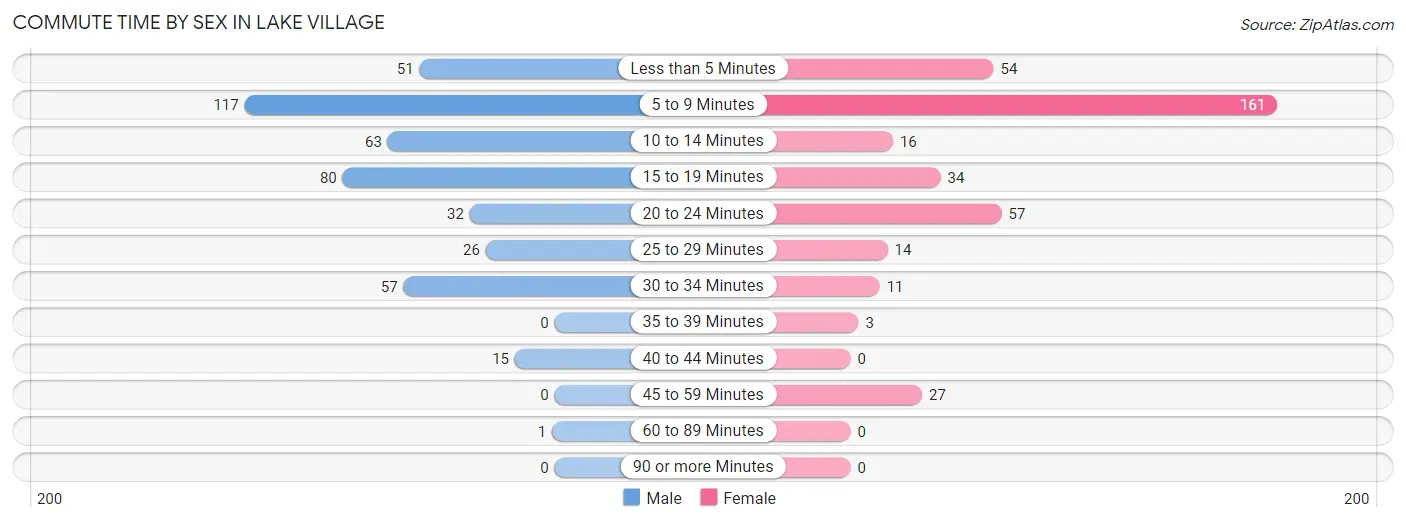
| Commute Time | Male | Female |
| Less than 5 Minutes | 51 (11.5%) | 54 (14.3%) |
| 5 to 9 Minutes | 117 (26.5%) | 161 (42.7%) |
| 10 to 14 Minutes | 63 (14.2%) | 16 (4.2%) |
| 15 to 19 Minutes | 80 (18.1%) | 34 (9.0%) |
| 20 to 24 Minutes | 32 (7.2%) | 57 (15.1%) |
| 25 to 29 Minutes | 26 (5.9%) | 14 (3.7%) |
| 30 to 34 Minutes | 57 (12.9%) | 11 (2.9%) |
| 35 to 39 Minutes | 0 (0.0%) | 3 (0.8%) |
| 40 to 44 Minutes | 15 (3.4%) | 0 (0.0%) |
| 45 to 59 Minutes | 0 (0.0%) | 27 (7.2%) |
| 60 to 89 Minutes | 1 (0.2%) | 0 (0.0%) |
| 90 or more Minutes | 0 (0.0%) | 0 (0.0%) |
Time of Departure to Work by Sex in Lake Village
The most frequent times of departure to work in Lake Village are 6:30 AM to 6:59 AM (127, 28.7%) for males and 7:00 AM to 7:29 AM (111, 29.4%) for females.
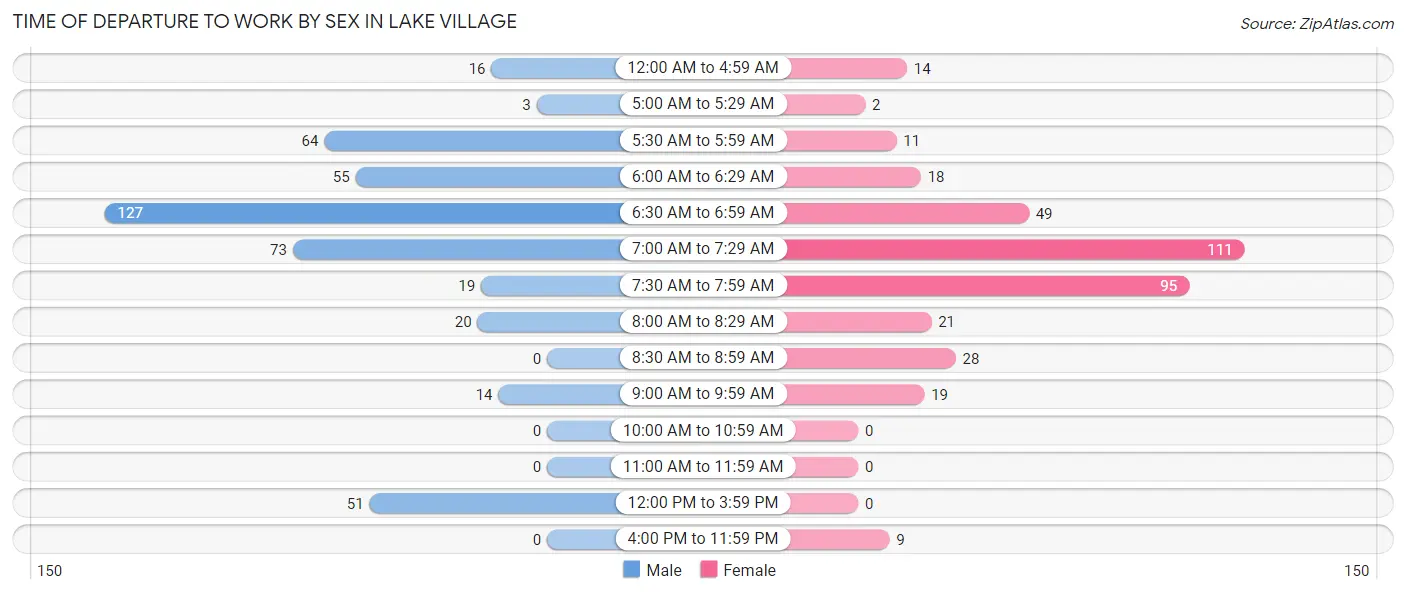
| Time of Departure | Male | Female |
| 12:00 AM to 4:59 AM | 16 (3.6%) | 14 (3.7%) |
| 5:00 AM to 5:29 AM | 3 (0.7%) | 2 (0.5%) |
| 5:30 AM to 5:59 AM | 64 (14.5%) | 11 (2.9%) |
| 6:00 AM to 6:29 AM | 55 (12.4%) | 18 (4.8%) |
| 6:30 AM to 6:59 AM | 127 (28.7%) | 49 (13.0%) |
| 7:00 AM to 7:29 AM | 73 (16.5%) | 111 (29.4%) |
| 7:30 AM to 7:59 AM | 19 (4.3%) | 95 (25.2%) |
| 8:00 AM to 8:29 AM | 20 (4.5%) | 21 (5.6%) |
| 8:30 AM to 8:59 AM | 0 (0.0%) | 28 (7.4%) |
| 9:00 AM to 9:59 AM | 14 (3.2%) | 19 (5.0%) |
| 10:00 AM to 10:59 AM | 0 (0.0%) | 0 (0.0%) |
| 11:00 AM to 11:59 AM | 0 (0.0%) | 0 (0.0%) |
| 12:00 PM to 3:59 PM | 51 (11.5%) | 0 (0.0%) |
| 4:00 PM to 11:59 PM | 0 (0.0%) | 9 (2.4%) |
| Total | 442 (100.0%) | 377 (100.0%) |
Housing Occupancy in Lake Village
Occupancy by Ownership in Lake Village
Of the total 890 dwellings in Lake Village, owner-occupied units account for 575 (64.6%), while renter-occupied units make up 315 (35.4%).
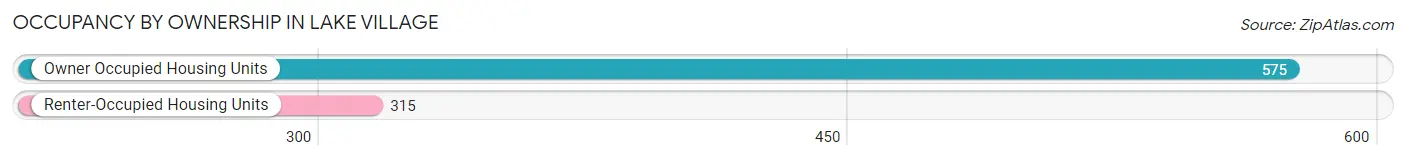
| Occupancy | # Housing Units | % Housing Units |
| Owner Occupied Housing Units | 575 | 64.6% |
| Renter-Occupied Housing Units | 315 | 35.4% |
| Total Occupied Housing Units | 890 | 100.0% |
Occupancy by Household Size in Lake Village

| Household Size | # Housing Units | % Housing Units |
| 1-Person Household | 386 | 43.4% |
| 2-Person Household | 235 | 26.4% |
| 3-Person Household | 121 | 13.6% |
| 4+ Person Household | 148 | 16.6% |
| Total Housing Units | 890 | 100.0% |
Occupancy by Ownership by Household Size in Lake Village
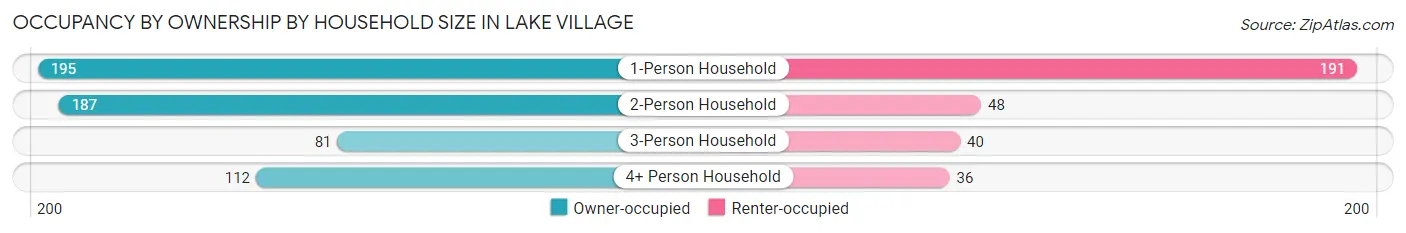
| Household Size | Owner-occupied | Renter-occupied |
| 1-Person Household | 195 (50.5%) | 191 (49.5%) |
| 2-Person Household | 187 (79.6%) | 48 (20.4%) |
| 3-Person Household | 81 (66.9%) | 40 (33.1%) |
| 4+ Person Household | 112 (75.7%) | 36 (24.3%) |
| Total Housing Units | 575 (64.6%) | 315 (35.4%) |
Occupancy by Educational Attainment in Lake Village
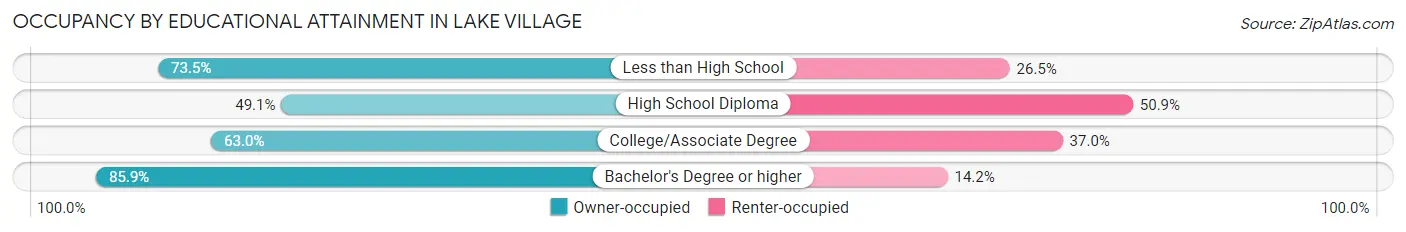
| Household Size | Owner-occupied | Renter-occupied |
| Less than High School | 100 (73.5%) | 36 (26.5%) |
| High School Diploma | 166 (49.1%) | 172 (50.9%) |
| College/Associate Degree | 133 (63.0%) | 78 (37.0%) |
| Bachelor's Degree or higher | 176 (85.9%) | 29 (14.1%) |
Occupancy by Age of Householder in Lake Village
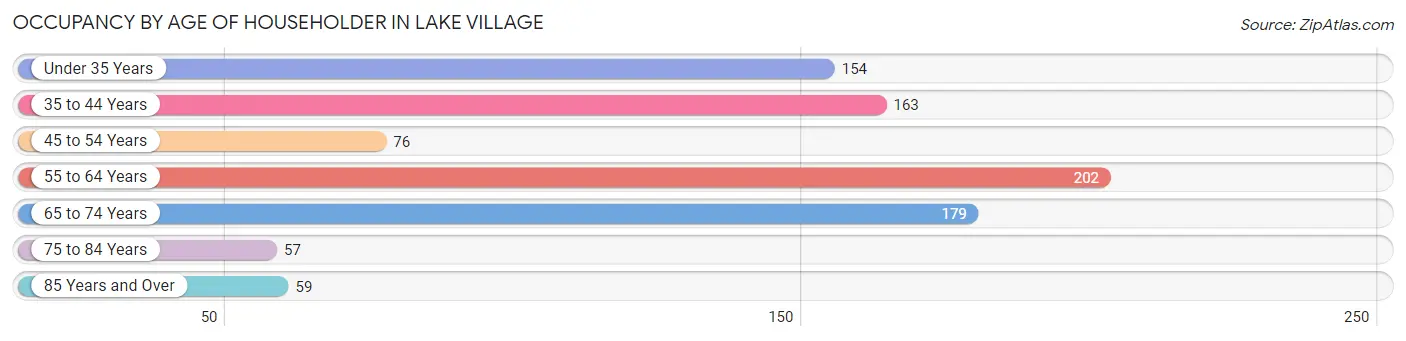
| Age Bracket | # Households | % Households |
| Under 35 Years | 154 | 17.3% |
| 35 to 44 Years | 163 | 18.3% |
| 45 to 54 Years | 76 | 8.5% |
| 55 to 64 Years | 202 | 22.7% |
| 65 to 74 Years | 179 | 20.1% |
| 75 to 84 Years | 57 | 6.4% |
| 85 Years and Over | 59 | 6.6% |
| Total | 890 | 100.0% |
Housing Finances in Lake Village
Median Income by Occupancy in Lake Village
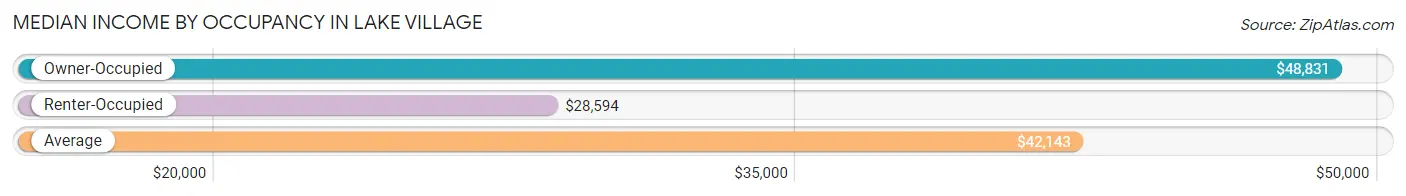
| Occupancy Type | # Households | Median Income |
| Owner-Occupied | 575 (64.6%) | $48,831 |
| Renter-Occupied | 315 (35.4%) | $28,594 |
| Average | 890 (100.0%) | $42,143 |
Occupancy by Householder Income Bracket in Lake Village
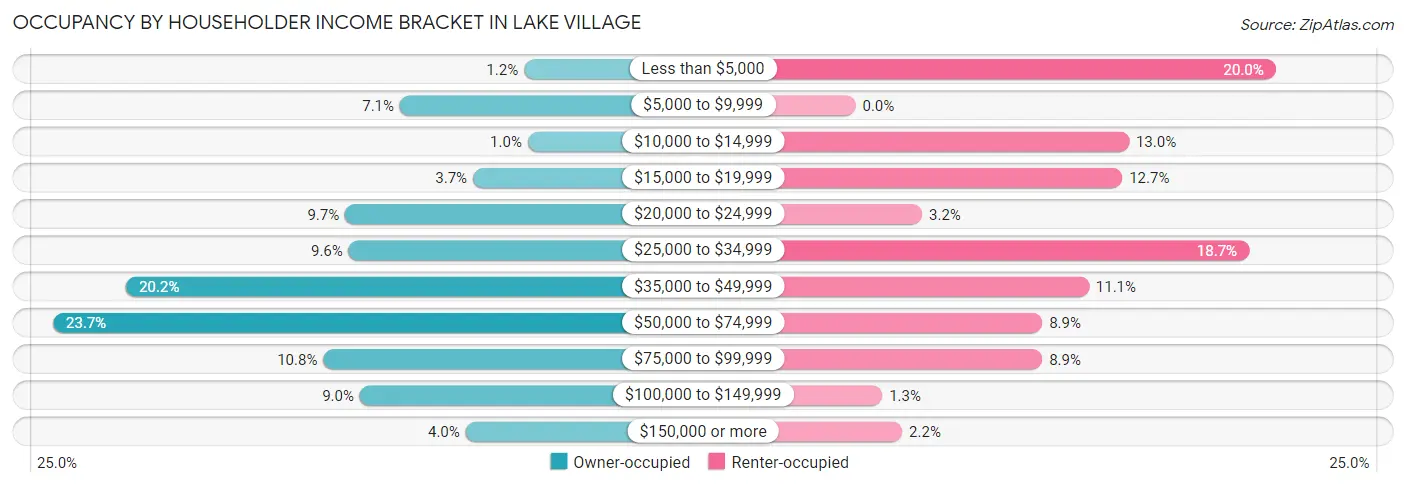
| Income Bracket | Owner-occupied | Renter-occupied |
| Less than $5,000 | 7 (1.2%) | 63 (20.0%) |
| $5,000 to $9,999 | 41 (7.1%) | 0 (0.0%) |
| $10,000 to $14,999 | 6 (1.0%) | 41 (13.0%) |
| $15,000 to $19,999 | 21 (3.6%) | 40 (12.7%) |
| $20,000 to $24,999 | 56 (9.7%) | 10 (3.2%) |
| $25,000 to $34,999 | 55 (9.6%) | 59 (18.7%) |
| $35,000 to $49,999 | 116 (20.2%) | 35 (11.1%) |
| $50,000 to $74,999 | 136 (23.6%) | 28 (8.9%) |
| $75,000 to $99,999 | 62 (10.8%) | 28 (8.9%) |
| $100,000 to $149,999 | 52 (9.0%) | 4 (1.3%) |
| $150,000 or more | 23 (4.0%) | 7 (2.2%) |
| Total | 575 (100.0%) | 315 (100.0%) |
Monthly Housing Cost Tiers in Lake Village
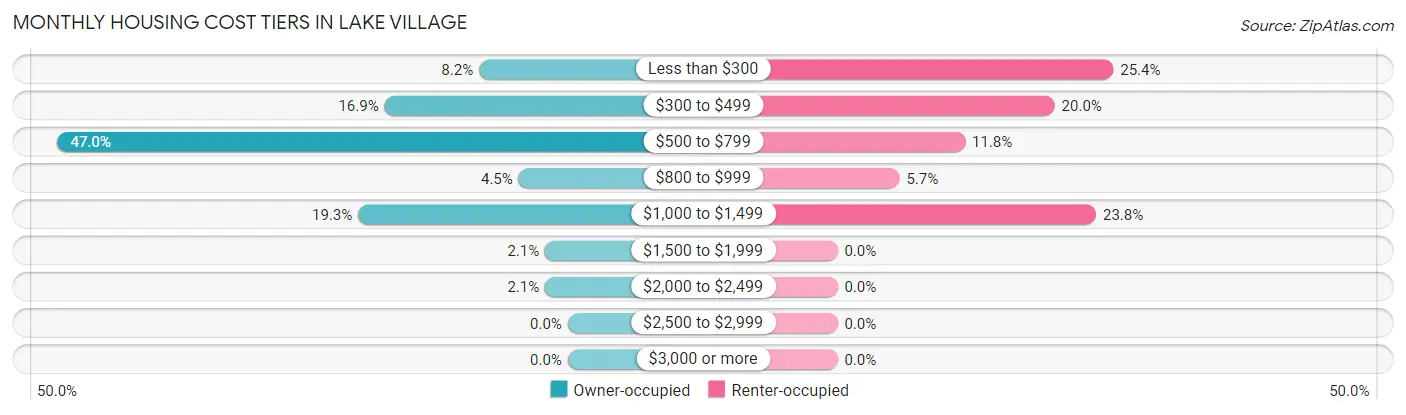
| Monthly Cost | Owner-occupied | Renter-occupied |
| Less than $300 | 47 (8.2%) | 80 (25.4%) |
| $300 to $499 | 97 (16.9%) | 63 (20.0%) |
| $500 to $799 | 270 (47.0%) | 37 (11.7%) |
| $800 to $999 | 26 (4.5%) | 18 (5.7%) |
| $1,000 to $1,499 | 111 (19.3%) | 75 (23.8%) |
| $1,500 to $1,999 | 12 (2.1%) | 0 (0.0%) |
| $2,000 to $2,499 | 12 (2.1%) | 0 (0.0%) |
| $2,500 to $2,999 | 0 (0.0%) | 0 (0.0%) |
| $3,000 or more | 0 (0.0%) | 0 (0.0%) |
| Total | 575 (100.0%) | 315 (100.0%) |
Physical Housing Characteristics in Lake Village
Housing Structures in Lake Village
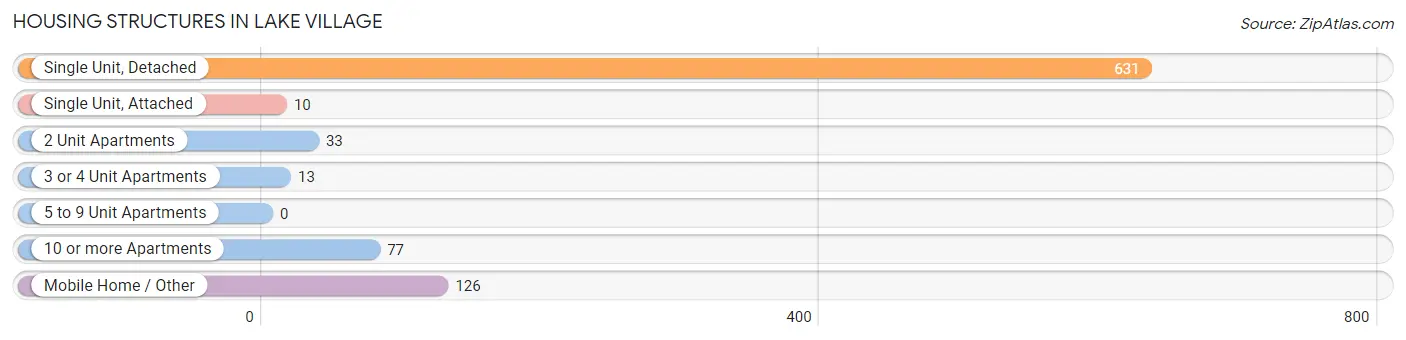
| Structure Type | # Housing Units | % Housing Units |
| Single Unit, Detached | 631 | 70.9% |
| Single Unit, Attached | 10 | 1.1% |
| 2 Unit Apartments | 33 | 3.7% |
| 3 or 4 Unit Apartments | 13 | 1.5% |
| 5 to 9 Unit Apartments | 0 | 0.0% |
| 10 or more Apartments | 77 | 8.6% |
| Mobile Home / Other | 126 | 14.2% |
| Total | 890 | 100.0% |
Housing Structures by Occupancy in Lake Village
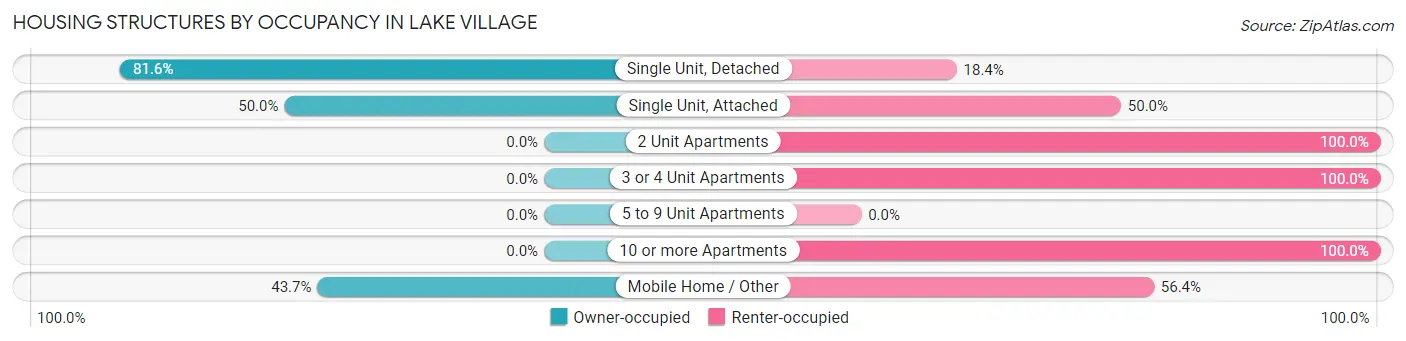
| Structure Type | Owner-occupied | Renter-occupied |
| Single Unit, Detached | 515 (81.6%) | 116 (18.4%) |
| Single Unit, Attached | 5 (50.0%) | 5 (50.0%) |
| 2 Unit Apartments | 0 (0.0%) | 33 (100.0%) |
| 3 or 4 Unit Apartments | 0 (0.0%) | 13 (100.0%) |
| 5 to 9 Unit Apartments | 0 (0.0%) | 0 (0.0%) |
| 10 or more Apartments | 0 (0.0%) | 77 (100.0%) |
| Mobile Home / Other | 55 (43.6%) | 71 (56.4%) |
| Total | 575 (64.6%) | 315 (35.4%) |
Housing Structures by Number of Rooms in Lake Village
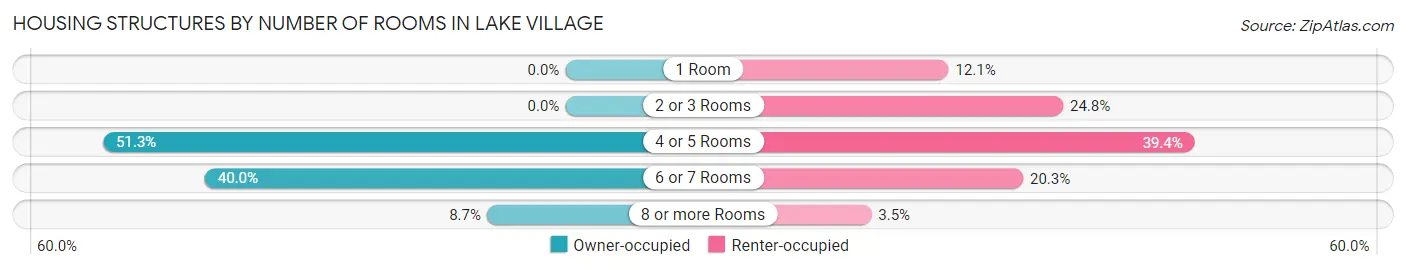
| Number of Rooms | Owner-occupied | Renter-occupied |
| 1 Room | 0 (0.0%) | 38 (12.1%) |
| 2 or 3 Rooms | 0 (0.0%) | 78 (24.8%) |
| 4 or 5 Rooms | 295 (51.3%) | 124 (39.4%) |
| 6 or 7 Rooms | 230 (40.0%) | 64 (20.3%) |
| 8 or more Rooms | 50 (8.7%) | 11 (3.5%) |
| Total | 575 (100.0%) | 315 (100.0%) |
Housing Structure by Heating Type in Lake Village
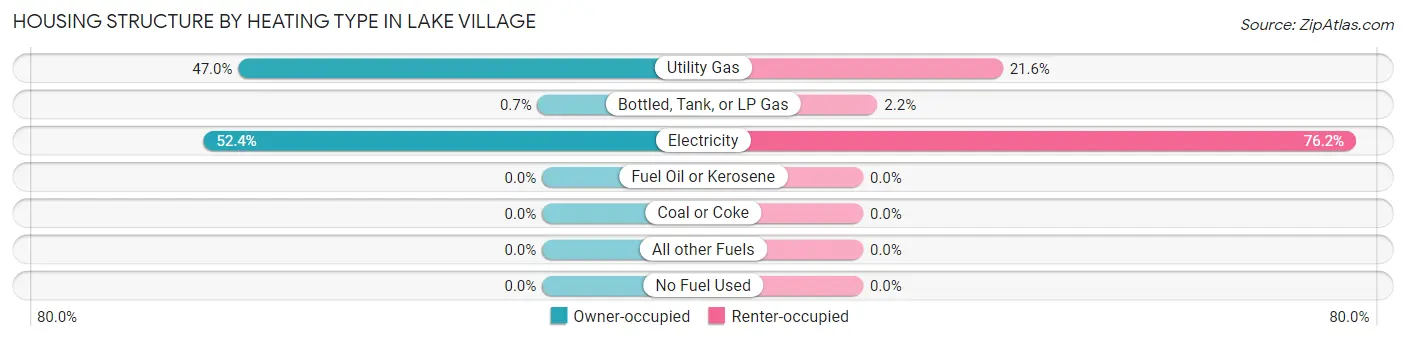
| Heating Type | Owner-occupied | Renter-occupied |
| Utility Gas | 270 (47.0%) | 68 (21.6%) |
| Bottled, Tank, or LP Gas | 4 (0.7%) | 7 (2.2%) |
| Electricity | 301 (52.3%) | 240 (76.2%) |
| Fuel Oil or Kerosene | 0 (0.0%) | 0 (0.0%) |
| Coal or Coke | 0 (0.0%) | 0 (0.0%) |
| All other Fuels | 0 (0.0%) | 0 (0.0%) |
| No Fuel Used | 0 (0.0%) | 0 (0.0%) |
| Total | 575 (100.0%) | 315 (100.0%) |
Household Vehicle Usage in Lake Village
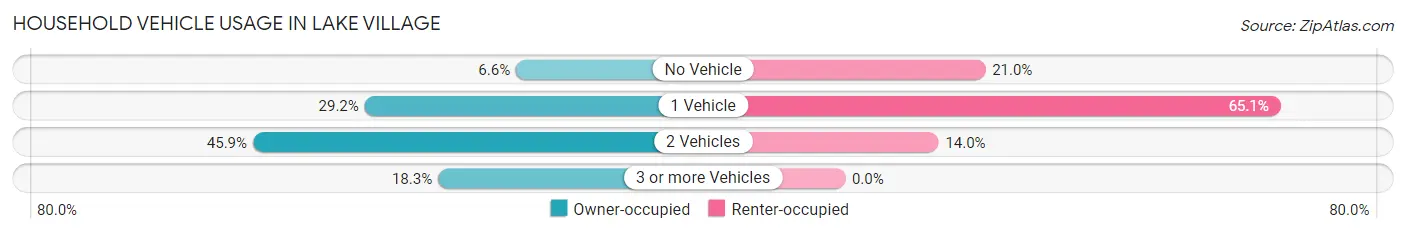
| Vehicles per Household | Owner-occupied | Renter-occupied |
| No Vehicle | 38 (6.6%) | 66 (20.9%) |
| 1 Vehicle | 168 (29.2%) | 205 (65.1%) |
| 2 Vehicles | 264 (45.9%) | 44 (14.0%) |
| 3 or more Vehicles | 105 (18.3%) | 0 (0.0%) |
| Total | 575 (100.0%) | 315 (100.0%) |
Real Estate & Mortgages in Lake Village
Real Estate and Mortgage Overview in Lake Village
| Characteristic | Without Mortgage | With Mortgage |
| Housing Units | 276 | 299 |
| Median Property Value | $151,900 | $89,100 |
| Median Household Income | $56,786 | $20 |
| Monthly Housing Costs | $510 | $0 |
| Real Estate Taxes | $910 | $0 |
Property Value by Mortgage Status in Lake Village
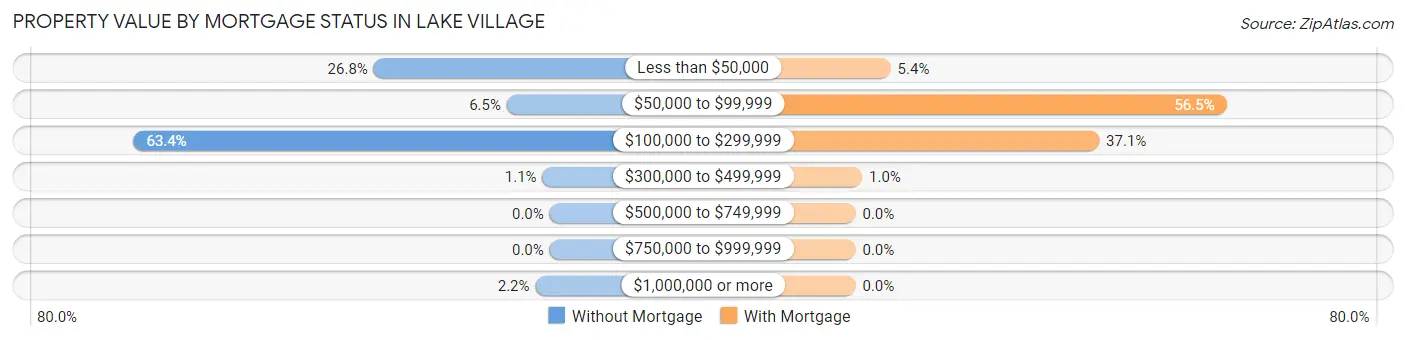
| Property Value | Without Mortgage | With Mortgage |
| Less than $50,000 | 74 (26.8%) | 16 (5.3%) |
| $50,000 to $99,999 | 18 (6.5%) | 169 (56.5%) |
| $100,000 to $299,999 | 175 (63.4%) | 111 (37.1%) |
| $300,000 to $499,999 | 3 (1.1%) | 3 (1.0%) |
| $500,000 to $749,999 | 0 (0.0%) | 0 (0.0%) |
| $750,000 to $999,999 | 0 (0.0%) | 0 (0.0%) |
| $1,000,000 or more | 6 (2.2%) | 0 (0.0%) |
| Total | 276 (100.0%) | 299 (100.0%) |
Household Income by Mortgage Status in Lake Village
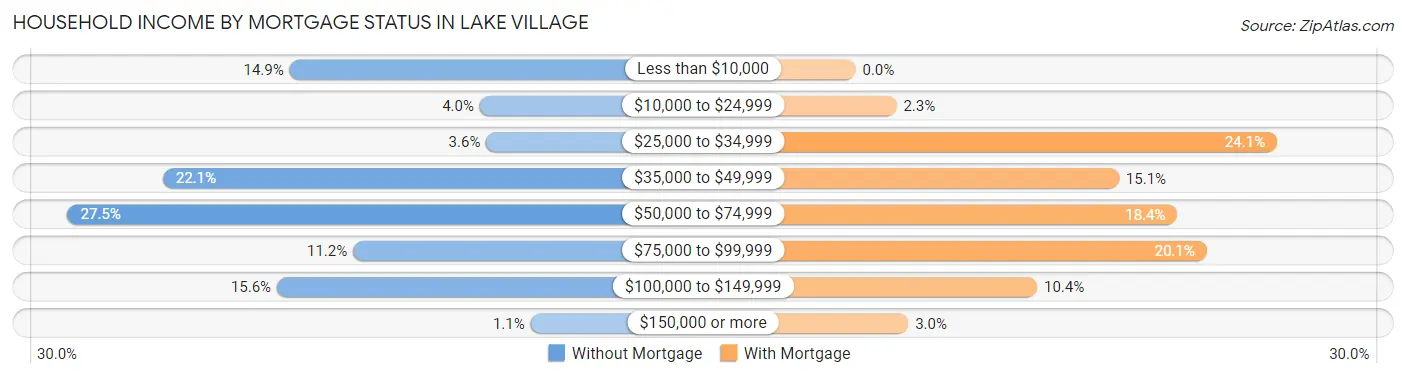
| Household Income | Without Mortgage | With Mortgage |
| Less than $10,000 | 41 (14.9%) | 0 (0.0%) |
| $10,000 to $24,999 | 11 (4.0%) | 7 (2.3%) |
| $25,000 to $34,999 | 10 (3.6%) | 72 (24.1%) |
| $35,000 to $49,999 | 61 (22.1%) | 45 (15.0%) |
| $50,000 to $74,999 | 76 (27.5%) | 55 (18.4%) |
| $75,000 to $99,999 | 31 (11.2%) | 60 (20.1%) |
| $100,000 to $149,999 | 43 (15.6%) | 31 (10.4%) |
| $150,000 or more | 3 (1.1%) | 9 (3.0%) |
| Total | 276 (100.0%) | 299 (100.0%) |
Property Value to Household Income Ratio in Lake Village
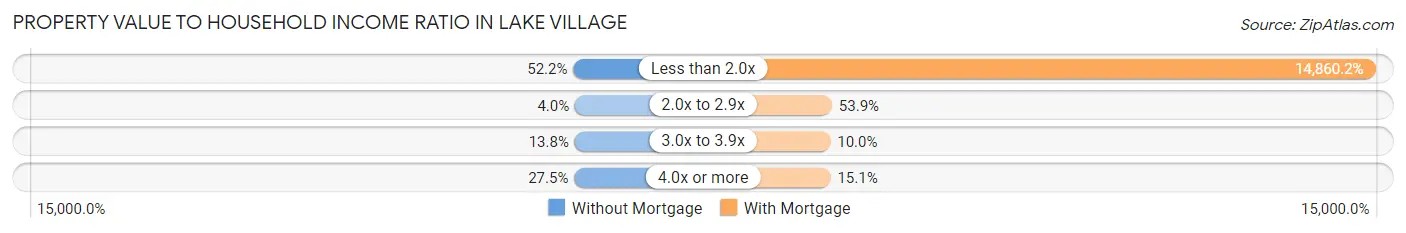
| Value-to-Income Ratio | Without Mortgage | With Mortgage |
| Less than 2.0x | 144 (52.2%) | 44,432 (14,860.2%) |
| 2.0x to 2.9x | 11 (4.0%) | 161 (53.8%) |
| 3.0x to 3.9x | 38 (13.8%) | 30 (10.0%) |
| 4.0x or more | 76 (27.5%) | 45 (15.0%) |
| Total | 276 (100.0%) | 299 (100.0%) |
Real Estate Taxes by Mortgage Status in Lake Village
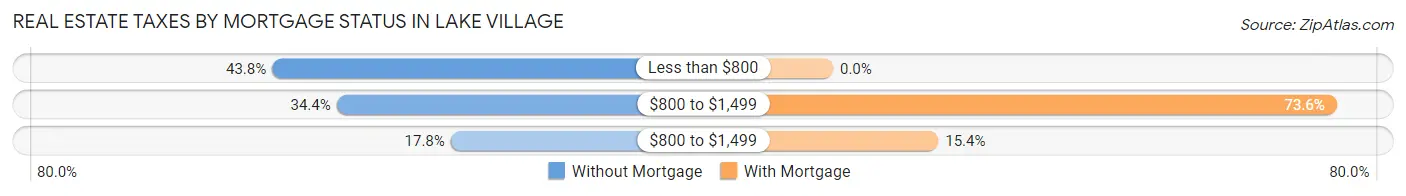
| Property Taxes | Without Mortgage | With Mortgage |
| Less than $800 | 121 (43.8%) | 0 (0.0%) |
| $800 to $1,499 | 95 (34.4%) | 220 (73.6%) |
| $800 to $1,499 | 49 (17.7%) | 46 (15.4%) |
| Total | 276 (100.0%) | 299 (100.0%) |
Health & Disability in Lake Village
Health Insurance Coverage by Age in Lake Village
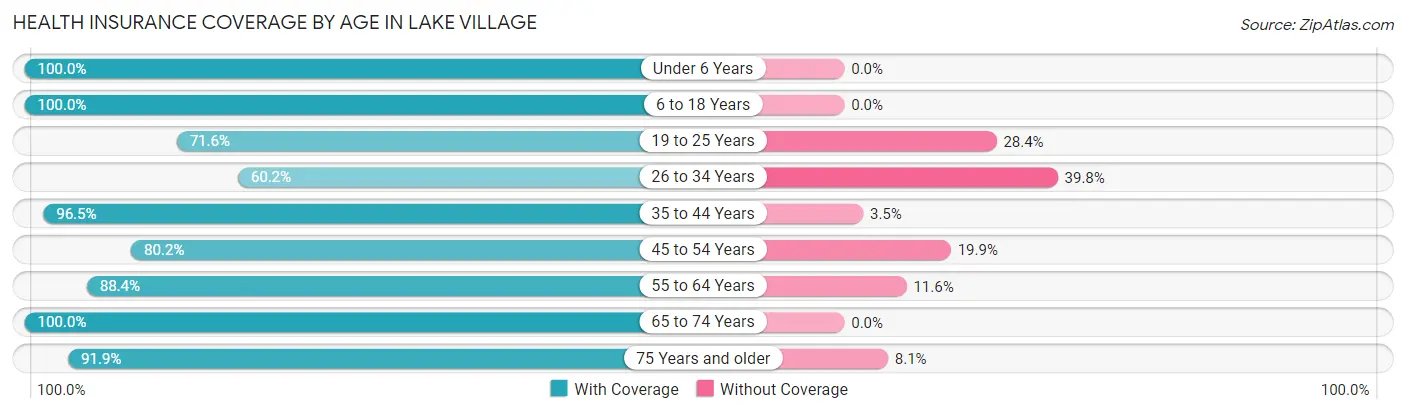
| Age Bracket | With Coverage | Without Coverage |
| Under 6 Years | 181 (100.0%) | 0 (0.0%) |
| 6 to 18 Years | 288 (100.0%) | 0 (0.0%) |
| 19 to 25 Years | 101 (71.6%) | 40 (28.4%) |
| 26 to 34 Years | 168 (60.2%) | 111 (39.8%) |
| 35 to 44 Years | 276 (96.5%) | 10 (3.5%) |
| 45 to 54 Years | 109 (80.1%) | 27 (19.9%) |
| 55 to 64 Years | 259 (88.4%) | 34 (11.6%) |
| 65 to 74 Years | 270 (100.0%) | 0 (0.0%) |
| 75 Years and older | 147 (91.9%) | 13 (8.1%) |
| Total | 1,799 (88.4%) | 235 (11.6%) |
Health Insurance Coverage by Citizenship Status in Lake Village
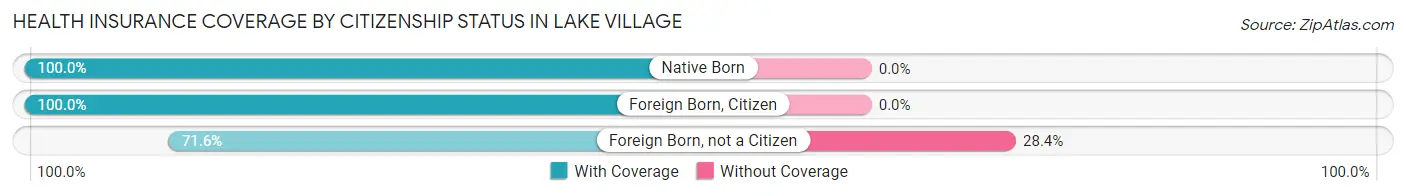
| Citizenship Status | With Coverage | Without Coverage |
| Native Born | 181 (100.0%) | 0 (0.0%) |
| Foreign Born, Citizen | 288 (100.0%) | 0 (0.0%) |
| Foreign Born, not a Citizen | 101 (71.6%) | 40 (28.4%) |
Health Insurance Coverage by Household Income in Lake Village
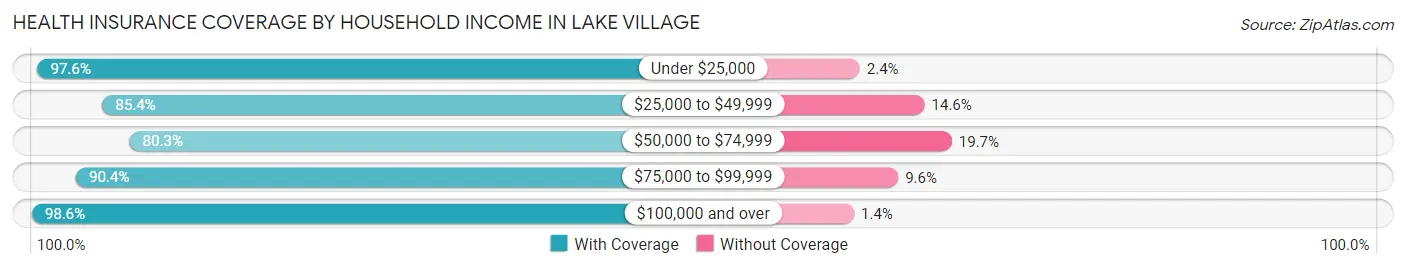
| Household Income | With Coverage | Without Coverage |
| Under $25,000 | 400 (97.6%) | 10 (2.4%) |
| $25,000 to $49,999 | 463 (85.4%) | 79 (14.6%) |
| $50,000 to $74,999 | 396 (80.3%) | 97 (19.7%) |
| $75,000 to $99,999 | 225 (90.4%) | 24 (9.6%) |
| $100,000 and over | 289 (98.6%) | 4 (1.4%) |
Public vs Private Health Insurance Coverage by Age in Lake Village
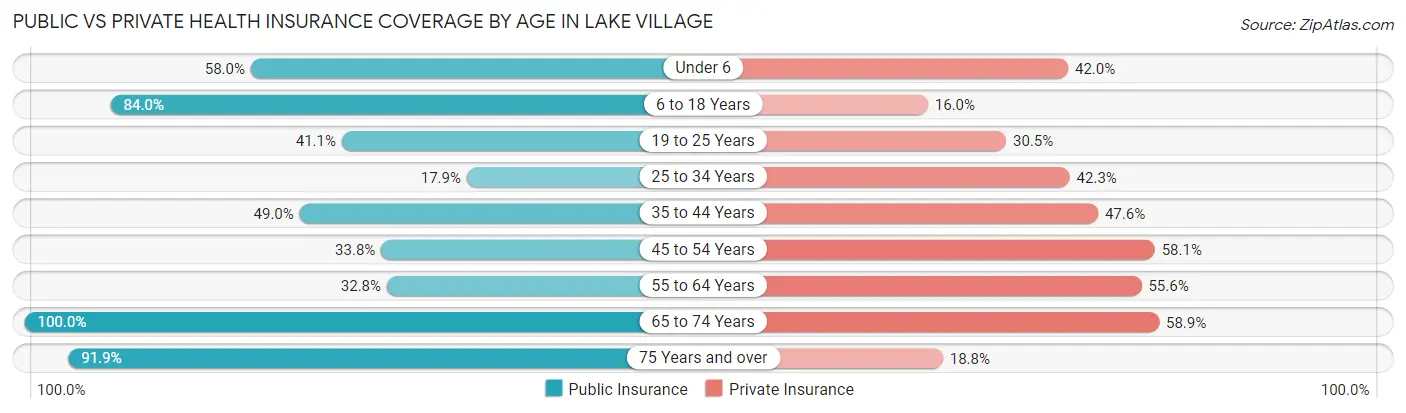
| Age Bracket | Public Insurance | Private Insurance |
| Under 6 | 105 (58.0%) | 76 (42.0%) |
| 6 to 18 Years | 242 (84.0%) | 46 (16.0%) |
| 19 to 25 Years | 58 (41.1%) | 43 (30.5%) |
| 25 to 34 Years | 50 (17.9%) | 118 (42.3%) |
| 35 to 44 Years | 140 (48.9%) | 136 (47.5%) |
| 45 to 54 Years | 46 (33.8%) | 79 (58.1%) |
| 55 to 64 Years | 96 (32.8%) | 163 (55.6%) |
| 65 to 74 Years | 270 (100.0%) | 159 (58.9%) |
| 75 Years and over | 147 (91.9%) | 30 (18.8%) |
| Total | 1,154 (56.7%) | 850 (41.8%) |
Disability Status by Sex by Age in Lake Village
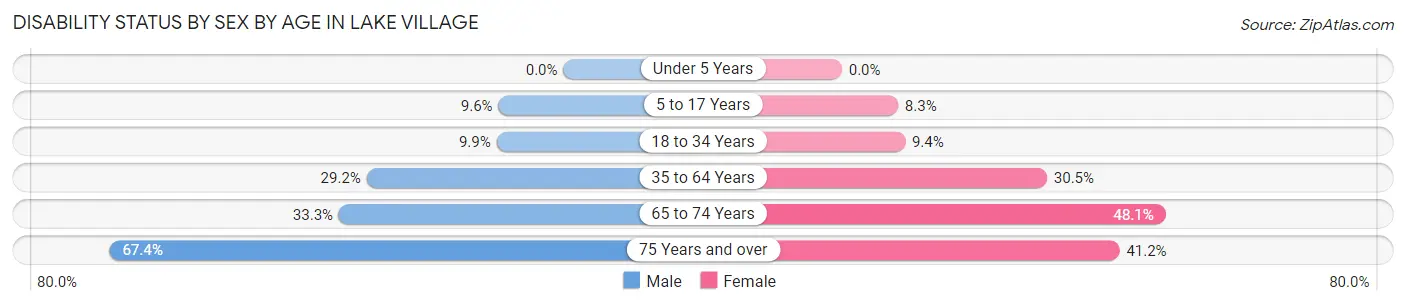
| Age Bracket | Male | Female |
| Under 5 Years | 0 (0.0%) | 0 (0.0%) |
| 5 to 17 Years | 19 (9.6%) | 7 (8.3%) |
| 18 to 34 Years | 24 (9.9%) | 18 (9.4%) |
| 35 to 64 Years | 111 (29.2%) | 102 (30.4%) |
| 65 to 74 Years | 38 (33.3%) | 75 (48.1%) |
| 75 Years and over | 31 (67.4%) | 47 (41.2%) |
Disability Class by Sex by Age in Lake Village
Disability Class: Hearing Difficulty
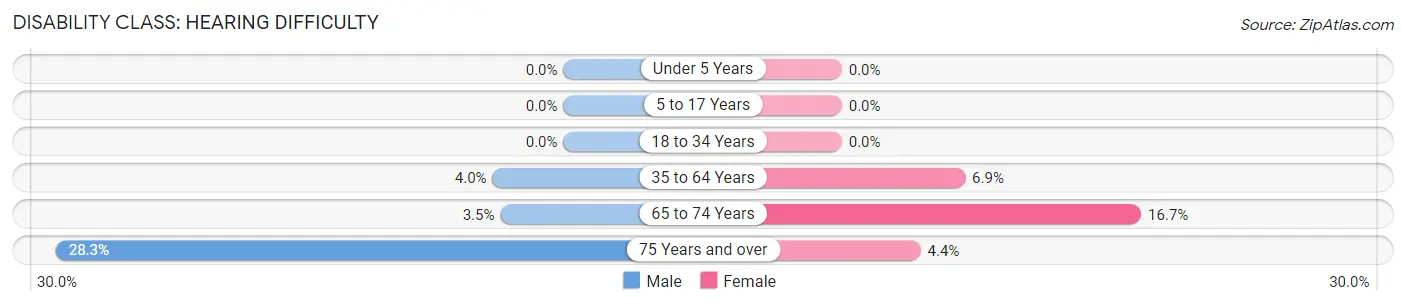
| Age Bracket | Male | Female |
| Under 5 Years | 0 (0.0%) | 0 (0.0%) |
| 5 to 17 Years | 0 (0.0%) | 0 (0.0%) |
| 18 to 34 Years | 0 (0.0%) | 0 (0.0%) |
| 35 to 64 Years | 15 (4.0%) | 23 (6.9%) |
| 65 to 74 Years | 4 (3.5%) | 26 (16.7%) |
| 75 Years and over | 13 (28.3%) | 5 (4.4%) |
Disability Class: Vision Difficulty
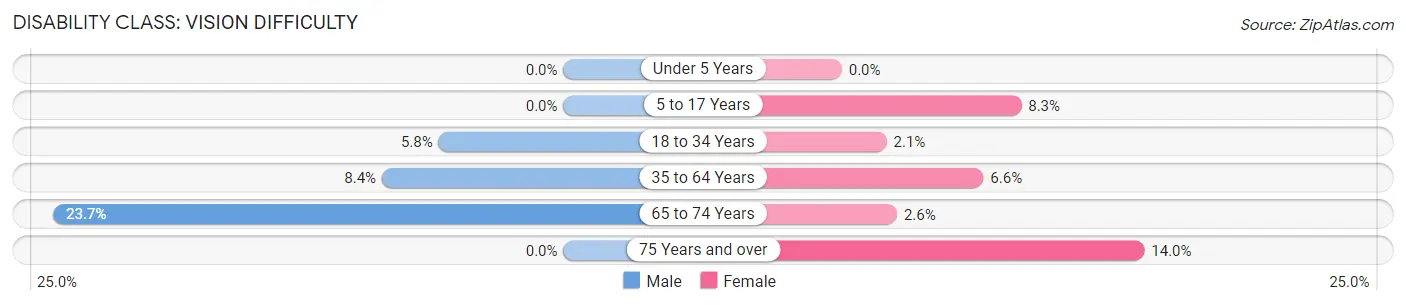
| Age Bracket | Male | Female |
| Under 5 Years | 0 (0.0%) | 0 (0.0%) |
| 5 to 17 Years | 0 (0.0%) | 7 (8.3%) |
| 18 to 34 Years | 14 (5.8%) | 4 (2.1%) |
| 35 to 64 Years | 32 (8.4%) | 22 (6.6%) |
| 65 to 74 Years | 27 (23.7%) | 4 (2.6%) |
| 75 Years and over | 0 (0.0%) | 16 (14.0%) |
Disability Class: Cognitive Difficulty
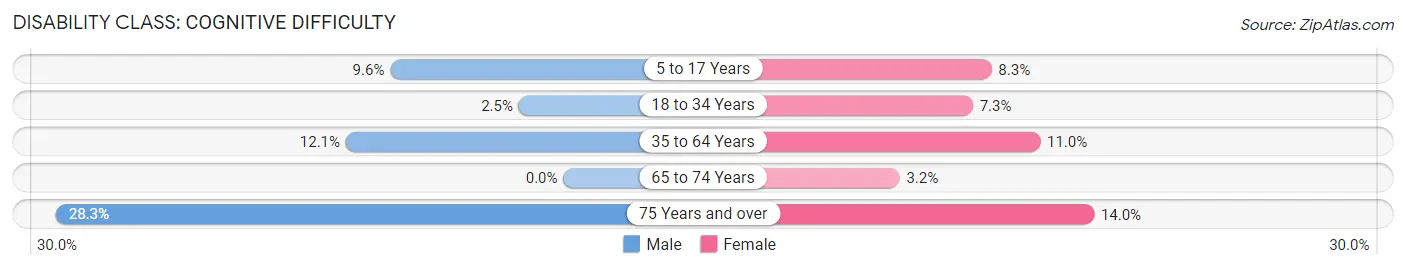
| Age Bracket | Male | Female |
| 5 to 17 Years | 19 (9.6%) | 7 (8.3%) |
| 18 to 34 Years | 6 (2.5%) | 14 (7.3%) |
| 35 to 64 Years | 46 (12.1%) | 37 (11.0%) |
| 65 to 74 Years | 0 (0.0%) | 5 (3.2%) |
| 75 Years and over | 13 (28.3%) | 16 (14.0%) |
Disability Class: Ambulatory Difficulty
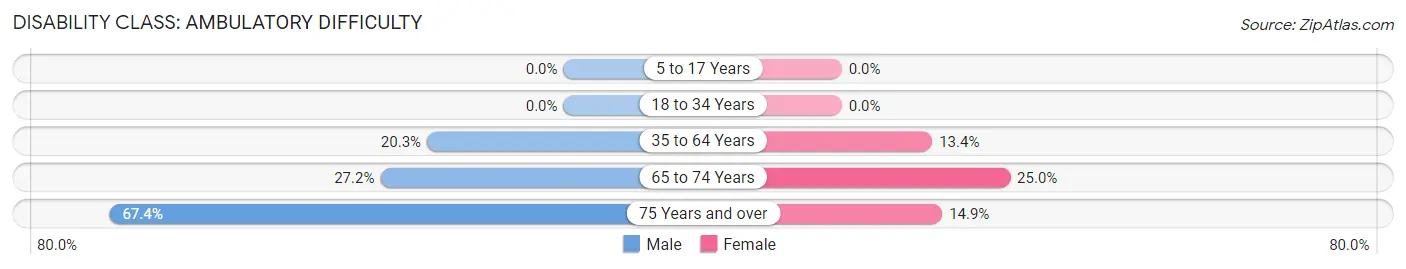
| Age Bracket | Male | Female |
| 5 to 17 Years | 0 (0.0%) | 0 (0.0%) |
| 18 to 34 Years | 0 (0.0%) | 0 (0.0%) |
| 35 to 64 Years | 77 (20.3%) | 45 (13.4%) |
| 65 to 74 Years | 31 (27.2%) | 39 (25.0%) |
| 75 Years and over | 31 (67.4%) | 17 (14.9%) |
Disability Class: Self-Care Difficulty
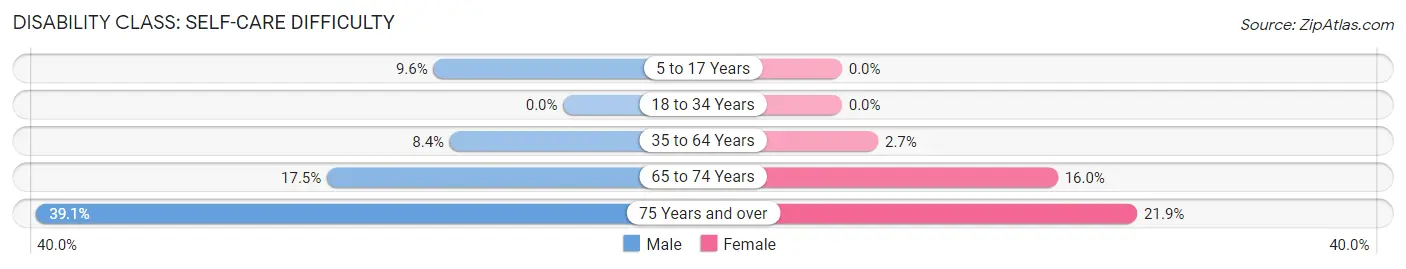
| Age Bracket | Male | Female |
| 5 to 17 Years | 19 (9.6%) | 0 (0.0%) |
| 18 to 34 Years | 0 (0.0%) | 0 (0.0%) |
| 35 to 64 Years | 32 (8.4%) | 9 (2.7%) |
| 65 to 74 Years | 20 (17.5%) | 25 (16.0%) |
| 75 Years and over | 18 (39.1%) | 25 (21.9%) |
Technology Access in Lake Village
Computing Device Access in Lake Village
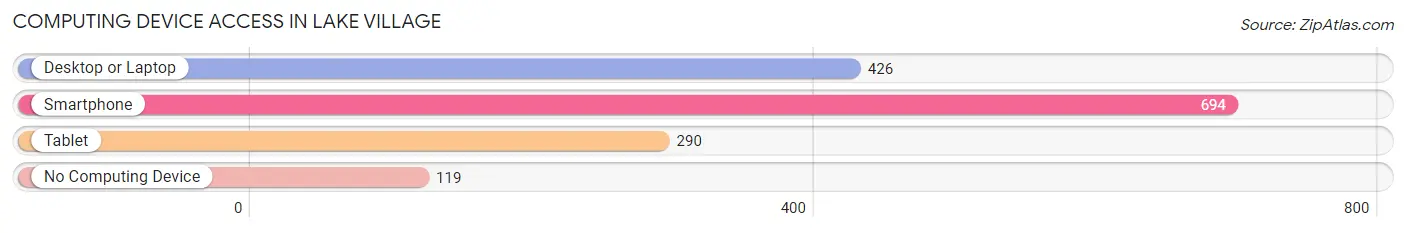
| Device Type | # Households | % Households |
| Desktop or Laptop | 426 | 47.9% |
| Smartphone | 694 | 78.0% |
| Tablet | 290 | 32.6% |
| No Computing Device | 119 | 13.4% |
| Total | 890 | 100.0% |
Internet Access in Lake Village
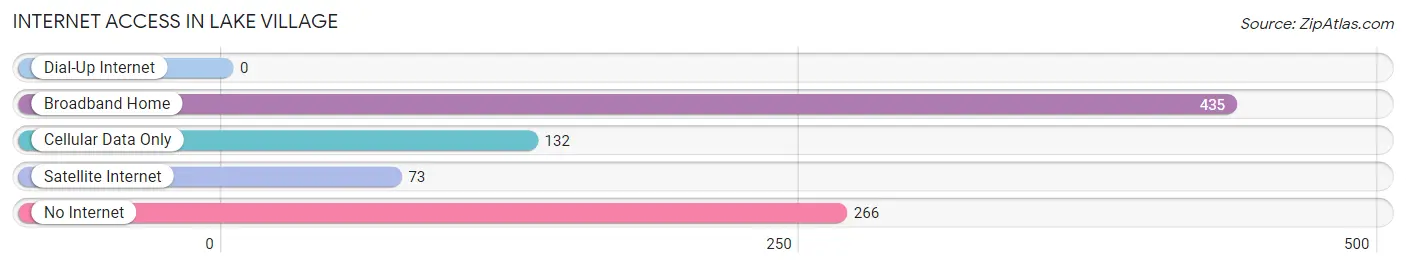
| Internet Type | # Households | % Households |
| Dial-Up Internet | 0 | 0.0% |
| Broadband Home | 435 | 48.9% |
| Cellular Data Only | 132 | 14.8% |
| Satellite Internet | 73 | 8.2% |
| No Internet | 266 | 29.9% |
| Total | 890 | 100.0% |
Lake Village Summary
Village History
Lake Village is a small town located in Chicot County, Arkansas. It is situated on the banks of Lake Chicot, the largest natural lake in the state. The town was founded in 1836 by a group of settlers from the nearby town of Eudora. The settlers were looking for a place to settle and start a new life.
The town was originally called “Chicot” after the lake, but the name was changed to Lake Village in 1837. The town was incorporated in 1838 and the first mayor was elected in 1839.
The town grew slowly but steadily over the years, and by the turn of the 20th century, it had become a thriving agricultural and commercial center. The town was home to several cotton gins, a sawmill, a gristmill, and a number of other businesses.
The town was also home to a number of churches, including the First Baptist Church, which was founded in 1845. The town also had a number of schools, including the Lake Village Academy, which was founded in 1851.
The town was also home to a number of prominent citizens, including the first African-American mayor of Lake Village, William H. Johnson, who was elected in 1891.
Geography
Lake Village is located in the southeastern corner of Arkansas, in Chicot County. It is situated on the banks of Lake Chicot, the largest natural lake in the state. The town is located at the intersection of U.S. Highway 65 and Arkansas Highway 8.
The town is surrounded by a number of small towns and communities, including Eudora, Dermott, and Lake Village. The nearest major city is Little Rock, which is located about 90 miles to the north.
The town has a total area of 2.2 square miles, all of which is land. The town has a humid subtropical climate, with hot, humid summers and mild winters.
Economy
The economy of Lake Village is largely based on agriculture and tourism. The town is home to a number of farms, which produce cotton, soybeans, corn, and other crops. The town is also home to a number of small businesses, including restaurants, retail stores, and other services.
The town is also home to a number of tourist attractions, including the Lake Village Museum, which is located in the old post office building. The museum features exhibits on the history of the town and the surrounding area.
The town is also home to a number of festivals and events, including the Lake Village Festival, which is held every year in May. The festival features live music, food, and other activities.
Demographics
As of the 2010 census, the population of Lake Village was 2,845. The racial makeup of the town was 79.3% White, 18.2% African American, 0.3% Native American, 0.2% Asian, 0.1% Pacific Islander, 0.7% from other races, and 1.4% from two or more races. Hispanic or Latino of any race were 1.7% of the population.
The median income for a household in the town was $25,938, and the median income for a family was $31,250. Males had a median income of $27,500 versus $20,000 for females. The per capita income for the town was $14,845. About 17.2% of families and 20.3% of the population were below the poverty line, including 28.3% of those under age 18 and 15.2% of those age 65 or over.
Common Questions
What is Per Capita Income in Lake Village?
Per Capita income in Lake Village is $22,914.
What is the Median Family Income in Lake Village?
Median Family Income in Lake Village is $55,714.
What is the Median Household income in Lake Village?
Median Household Income in Lake Village is $42,143.
What is Income or Wage Gap in Lake Village?
Income or Wage Gap in Lake Village is 8.7%.
Women in Lake Village earn 91.3 cents for every dollar earned by a man.
What is Inequality or Gini Index in Lake Village?
Inequality or Gini Index in Lake Village is 0.45.
What is the Total Population of Lake Village?
Total Population of Lake Village is 2,084.
What is the Total Male Population of Lake Village?
Total Male Population of Lake Village is 1,077.
What is the Total Female Population of Lake Village?
Total Female Population of Lake Village is 1,007.
What is the Ratio of Males per 100 Females in Lake Village?
There are 106.95 Males per 100 Females in Lake Village.
What is the Ratio of Females per 100 Males in Lake Village?
There are 93.50 Females per 100 Males in Lake Village.
What is the Median Population Age in Lake Village?
Median Population Age in Lake Village is 38.6 Years.
What is the Average Family Size in Lake Village
Average Family Size in Lake Village is 3.1 People.
What is the Average Household Size in Lake Village
Average Household Size in Lake Village is 2.2 People.
How Large is the Labor Force in Lake Village?
There are 876 People in the Labor Forcein in Lake Village.
What is the Percentage of People in the Labor Force in Lake Village?
52.1% of People are in the Labor Force in Lake Village.
What is the Unemployment Rate in Lake Village?
Unemployment Rate in Lake Village is 5.5%.