Diamond City, AR Map & Demographics
Diamond City Map
Diamond City Overview
$21,480
PER CAPITA INCOME
$45,875
AVG FAMILY INCOME
$39,453
AVG HOUSEHOLD INCOME
36.4%
WAGE / INCOME GAP [ % ]
63.6¢/ $1
WAGE / INCOME GAP [ $ ]
0.38
INEQUALITY / GINI INDEX
888
TOTAL POPULATION
370
MALE POPULATION
518
FEMALE POPULATION
71.43
MALES / 100 FEMALES
140.00
FEMALES / 100 MALES
43.8
MEDIAN AGE
3.1
AVG FAMILY SIZE
2.5
AVG HOUSEHOLD SIZE
378
LABOR FORCE [ PEOPLE ]
51.1%
PERCENT IN LABOR FORCE
1.3%
UNEMPLOYMENT RATE
Diamond City Zip Codes
Diamond City Area Codes
Income in Diamond City
Income Overview in Diamond City
Per Capita Income in Diamond City is $21,480, while median incomes of families and households are $45,875 and $39,453 respectively.
| Characteristic | Number | Measure |
| Per Capita Income | 888 | $21,480 |
| Median Family Income | 197 | $45,875 |
| Mean Family Income | 197 | $50,921 |
| Median Household Income | 357 | $39,453 |
| Mean Household Income | 357 | $50,117 |
| Income Deficit | 197 | $0 |
| Wage / Income Gap (%) | 888 | 36.41% |
| Wage / Income Gap ($) | 888 | 63.59¢ per $1 |
| Gini / Inequality Index | 888 | 0.38 |
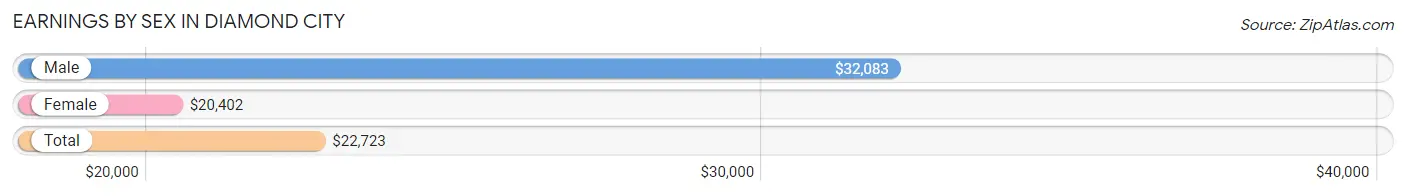
Earnings by Sex in Diamond City
Average Earnings in Diamond City are $22,723, $32,083 for men and $20,402 for women, a difference of 36.4%.
| Sex | Number | Average Earnings |
| Male | 194 (47.2%) | $32,083 |
| Female | 217 (52.8%) | $20,402 |
| Total | 411 (100.0%) | $22,723 |
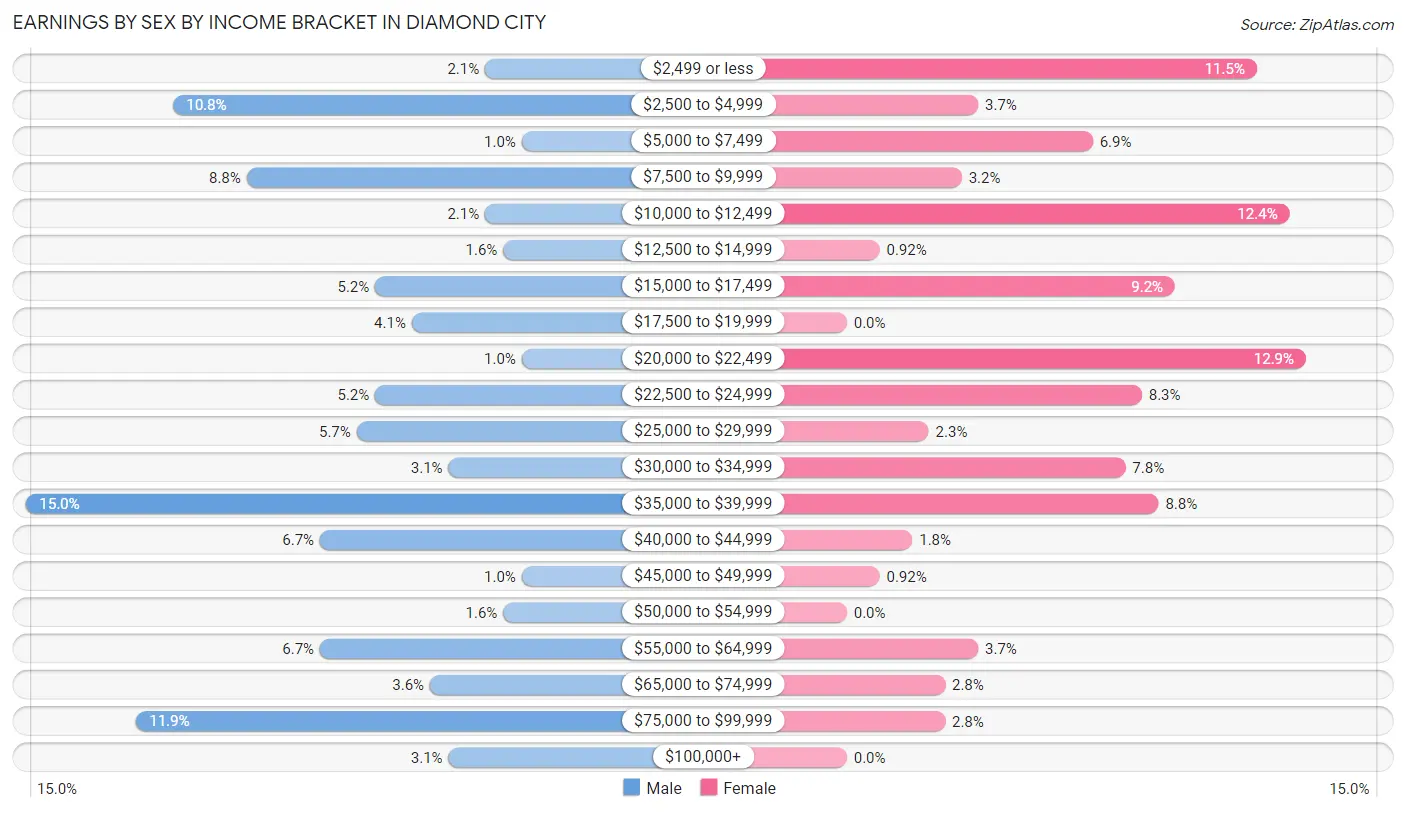
Earnings by Sex by Income Bracket in Diamond City
The most common earnings brackets in Diamond City are $35,000 to $39,999 for men (29 | 14.9%) and $20,000 to $22,499 for women (28 | 12.9%).
| Income | Male | Female |
| $2,499 or less | 4 (2.1%) | 25 (11.5%) |
| $2,500 to $4,999 | 21 (10.8%) | 8 (3.7%) |
| $5,000 to $7,499 | 2 (1.0%) | 15 (6.9%) |
| $7,500 to $9,999 | 17 (8.8%) | 7 (3.2%) |
| $10,000 to $12,499 | 4 (2.1%) | 27 (12.4%) |
| $12,500 to $14,999 | 3 (1.5%) | 2 (0.9%) |
| $15,000 to $17,499 | 10 (5.1%) | 20 (9.2%) |
| $17,500 to $19,999 | 8 (4.1%) | 0 (0.0%) |
| $20,000 to $22,499 | 2 (1.0%) | 28 (12.9%) |
| $22,500 to $24,999 | 10 (5.1%) | 18 (8.3%) |
| $25,000 to $29,999 | 11 (5.7%) | 5 (2.3%) |
| $30,000 to $34,999 | 6 (3.1%) | 17 (7.8%) |
| $35,000 to $39,999 | 29 (14.9%) | 19 (8.8%) |
| $40,000 to $44,999 | 13 (6.7%) | 4 (1.8%) |
| $45,000 to $49,999 | 2 (1.0%) | 2 (0.9%) |
| $50,000 to $54,999 | 3 (1.5%) | 0 (0.0%) |
| $55,000 to $64,999 | 13 (6.7%) | 8 (3.7%) |
| $65,000 to $74,999 | 7 (3.6%) | 6 (2.8%) |
| $75,000 to $99,999 | 23 (11.9%) | 6 (2.8%) |
| $100,000+ | 6 (3.1%) | 0 (0.0%) |
| Total | 194 (100.0%) | 217 (100.0%) |
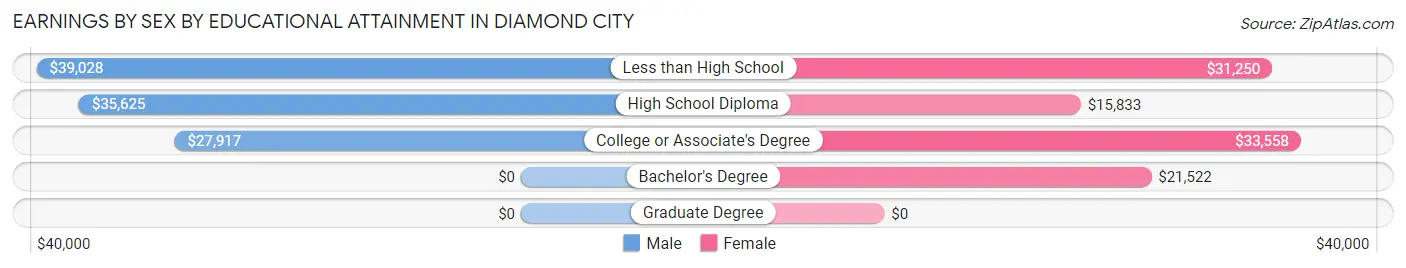
Earnings by Sex by Educational Attainment in Diamond City
Average earnings in Diamond City are $37,946 for men and $23,542 for women, a difference of 38.0%. Men with an educational attainment of less than high school enjoy the highest average annual earnings of $39,028, while those with college or associate's degree education earn the least with $27,917. Women with an educational attainment of college or associate's degree earn the most with the average annual earnings of $33,558, while those with high school diploma education have the smallest earnings of $15,833.
| Educational Attainment | Male Income | Female Income |
| Less than High School | $39,028 | $31,250 |
| High School Diploma | $35,625 | $15,833 |
| College or Associate's Degree | $27,917 | $33,558 |
| Bachelor's Degree | - | - |
| Graduate Degree | - | - |
| Total | $37,946 | $23,542 |
Family Income in Diamond City
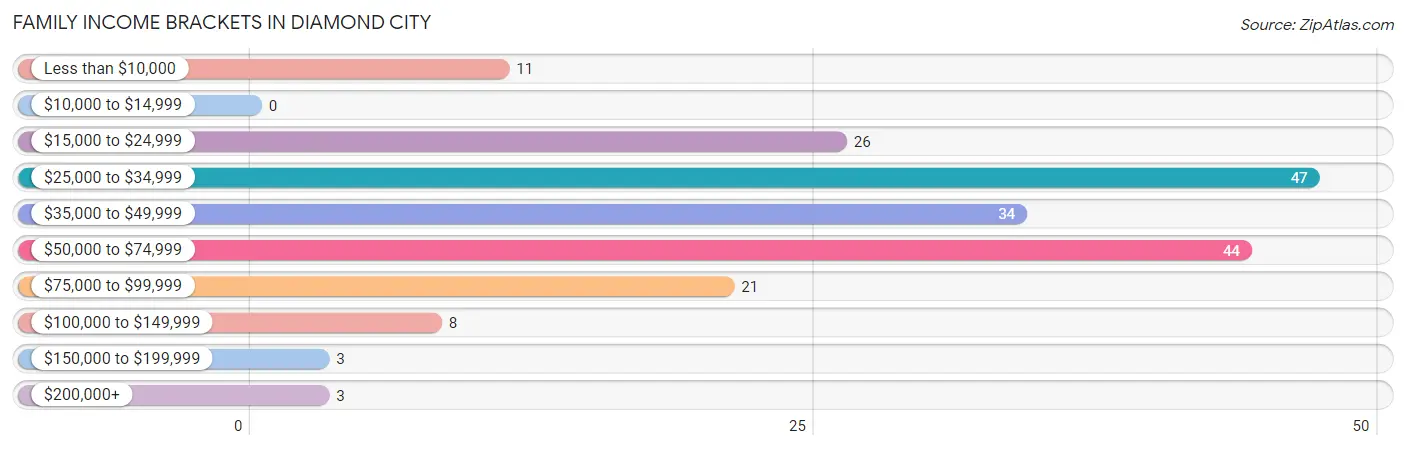
Family Income Brackets in Diamond City
According to the Diamond City family income data, there are 47 families falling into the $25,000 to $34,999 income range, which is the most common income bracket and makes up 23.9% of all families.
| Income Bracket | # Families | % Families |
| Less than $10,000 | 11 | 5.6% |
| $10,000 to $14,999 | 0 | 0.0% |
| $15,000 to $24,999 | 26 | 13.2% |
| $25,000 to $34,999 | 47 | 23.9% |
| $35,000 to $49,999 | 34 | 17.3% |
| $50,000 to $74,999 | 44 | 22.3% |
| $75,000 to $99,999 | 21 | 10.7% |
| $100,000 to $149,999 | 8 | 4.1% |
| $150,000 to $199,999 | 3 | 1.5% |
| $200,000+ | 3 | 1.5% |
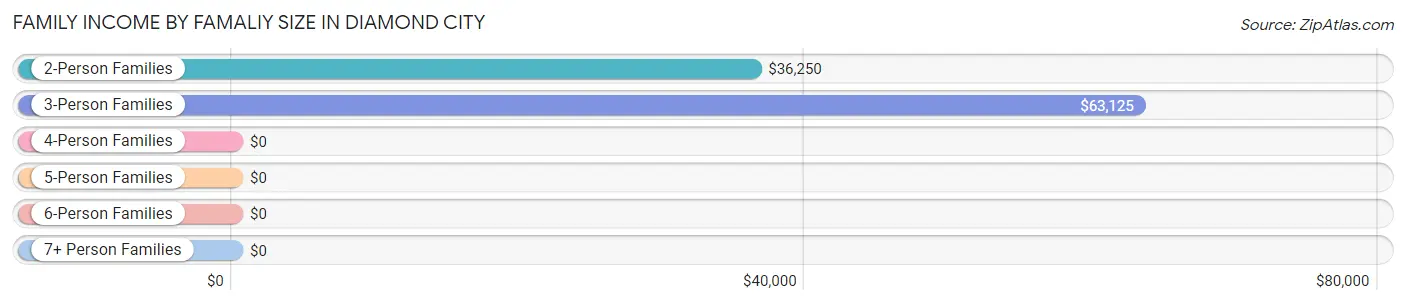
Family Income by Famaliy Size in Diamond City
3-person families (54 | 27.4%) account for the highest median family income in Diamond City with $63,125 per family, while 3-person families (54 | 27.4%) have the highest median income of $21,042 per family member.
| Income Bracket | # Families | Median Income |
| 2-Person Families | 110 (55.8%) | $36,250 |
| 3-Person Families | 54 (27.4%) | $63,125 |
| 4-Person Families | 14 (7.1%) | $0 |
| 5-Person Families | 4 (2.0%) | $0 |
| 6-Person Families | 14 (7.1%) | $0 |
| 7+ Person Families | 1 (0.5%) | $0 |
| Total | 197 (100.0%) | $45,875 |
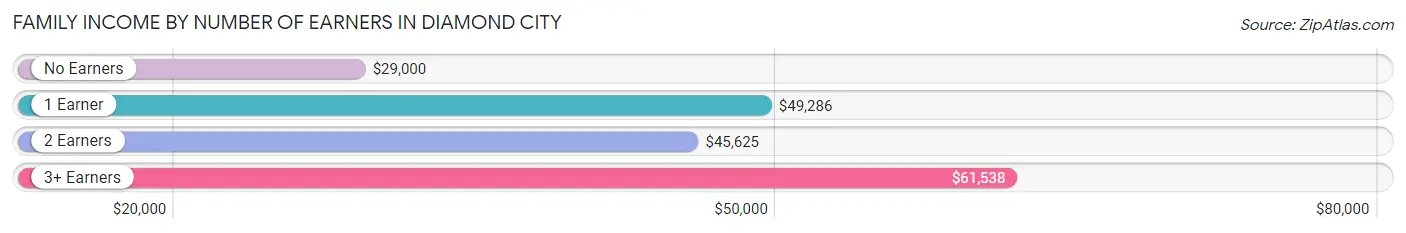
Family Income by Number of Earners in Diamond City
The median family income in Diamond City is $45,875, with families comprising 3+ earners (16) having the highest median family income of $61,538, while families with no earners (66) have the lowest median family income of $29,000, accounting for 8.1% and 33.5% of families, respectively.
| Number of Earners | # Families | Median Income |
| No Earners | 66 (33.5%) | $29,000 |
| 1 Earner | 54 (27.4%) | $49,286 |
| 2 Earners | 61 (31.0%) | $45,625 |
| 3+ Earners | 16 (8.1%) | $61,538 |
| Total | 197 (100.0%) | $45,875 |
Household Income in Diamond City
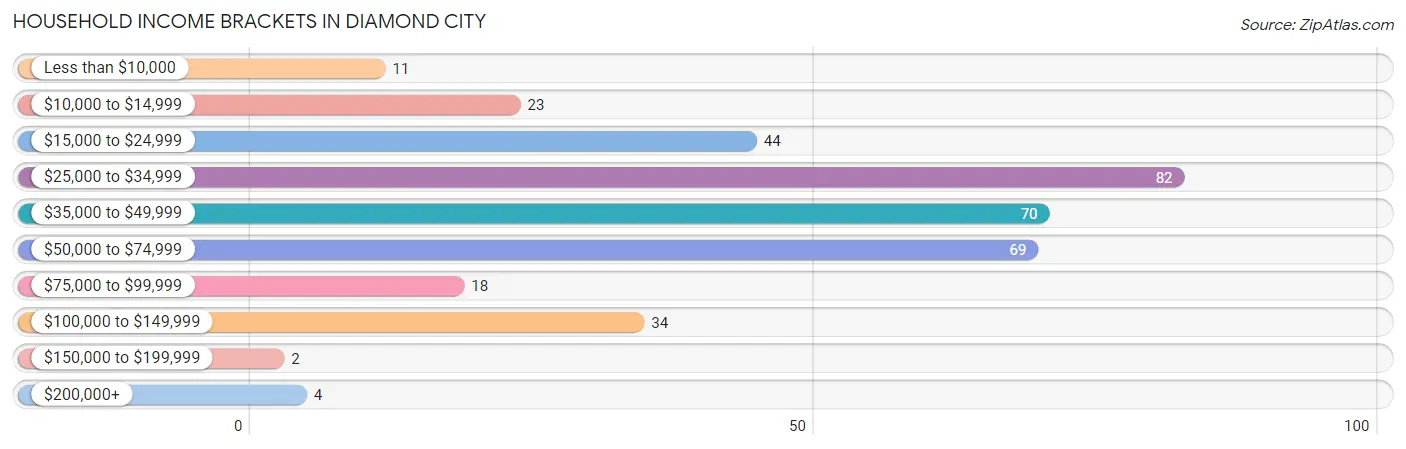
Household Income Brackets in Diamond City
With 82 households falling in the category, the $25,000 to $34,999 income range is the most frequent in Diamond City, accounting for 23.0% of all households. In contrast, only 2 households (0.6%) fall into the $150,000 to $199,999 income bracket, making it the least populous group.
| Income Bracket | # Households | % Households |
| Less than $10,000 | 11 | 3.1% |
| $10,000 to $14,999 | 23 | 6.4% |
| $15,000 to $24,999 | 44 | 12.3% |
| $25,000 to $34,999 | 82 | 23.0% |
| $35,000 to $49,999 | 70 | 19.6% |
| $50,000 to $74,999 | 69 | 19.3% |
| $75,000 to $99,999 | 18 | 5.0% |
| $100,000 to $149,999 | 34 | 9.5% |
| $150,000 to $199,999 | 2 | 0.6% |
| $200,000+ | 4 | 1.1% |
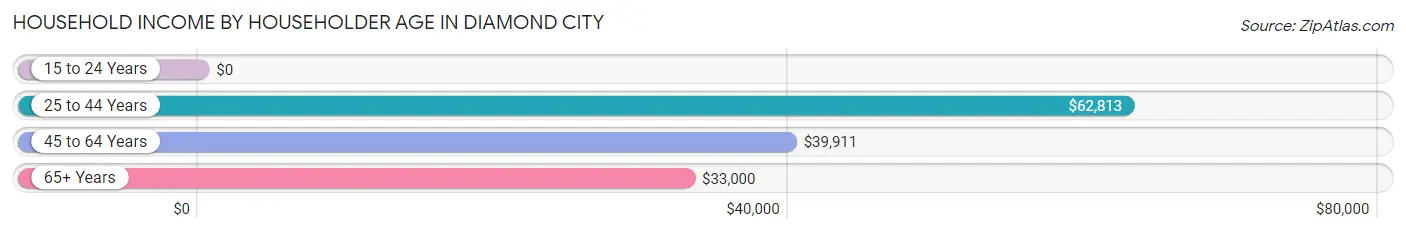
Household Income by Householder Age in Diamond City
The median household income in Diamond City is $39,453, with the highest median household income of $62,813 found in the 25 to 44 years age bracket for the primary householder. A total of 85 households (23.8%) fall into this category. Meanwhile, the 15 to 24 years age bracket for the primary householder has the lowest median household income of $0, with 3 households (0.8%) in this group.
| Income Bracket | # Households | Median Income |
| 15 to 24 Years | 3 (0.8%) | $0 |
| 25 to 44 Years | 85 (23.8%) | $62,813 |
| 45 to 64 Years | 107 (30.0%) | $39,911 |
| 65+ Years | 162 (45.4%) | $33,000 |
| Total | 357 (100.0%) | $39,453 |
Poverty in Diamond City
Income Below Poverty by Sex and Age in Diamond City
With 18.0% poverty level for males and 19.5% for females among the residents of Diamond City, 5 year old males and 5 year old females are the most vulnerable to poverty, with 7 males (87.5%) and 3 females (100.0%) in their respective age groups living below the poverty level.
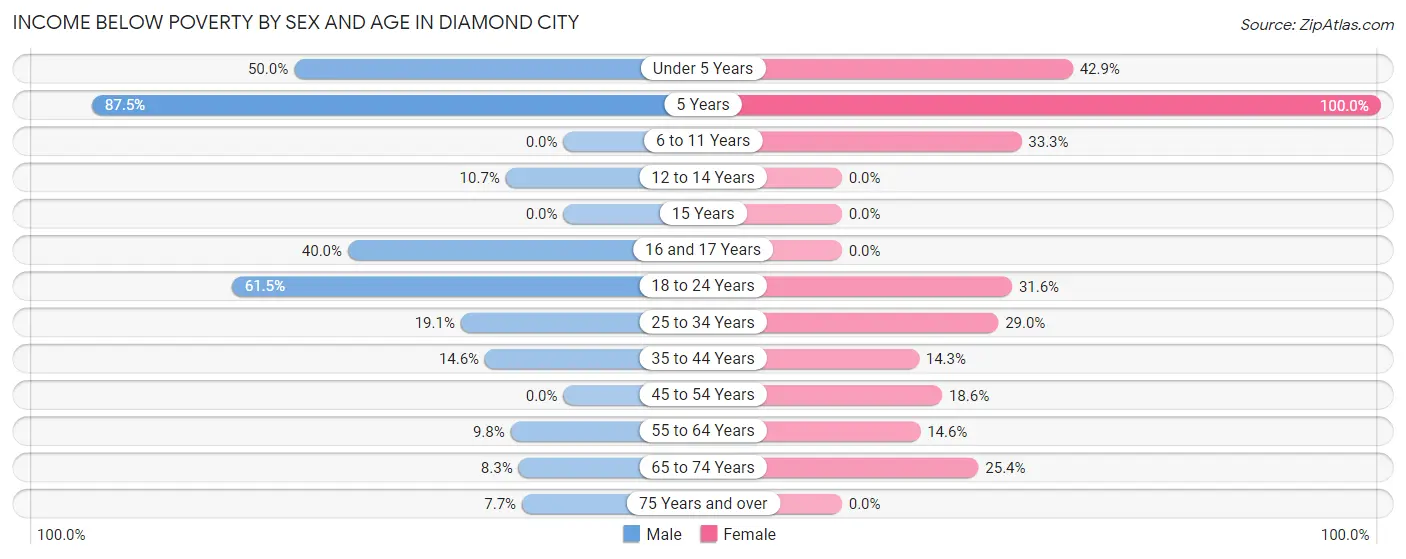
| Age Bracket | Male | Female |
| Under 5 Years | 2 (50.0%) | 15 (42.9%) |
| 5 Years | 7 (87.5%) | 3 (100.0%) |
| 6 to 11 Years | 0 (0.0%) | 5 (33.3%) |
| 12 to 14 Years | 3 (10.7%) | 0 (0.0%) |
| 15 Years | 0 (0.0%) | 0 (0.0%) |
| 16 and 17 Years | 2 (40.0%) | 0 (0.0%) |
| 18 to 24 Years | 24 (61.5%) | 18 (31.6%) |
| 25 to 34 Years | 8 (19.1%) | 9 (29.0%) |
| 35 to 44 Years | 8 (14.5%) | 9 (14.3%) |
| 45 to 54 Years | 0 (0.0%) | 8 (18.6%) |
| 55 to 64 Years | 5 (9.8%) | 8 (14.5%) |
| 65 to 74 Years | 4 (8.3%) | 18 (25.4%) |
| 75 Years and over | 3 (7.7%) | 0 (0.0%) |
| Total | 66 (18.0%) | 93 (19.5%) |
Income Above Poverty by Sex and Age in Diamond City
According to the poverty statistics in Diamond City, males aged 45 to 54 years and females aged 15 years are the age groups that are most secure financially, with 100.0% of males and 100.0% of females in these age groups living above the poverty line.
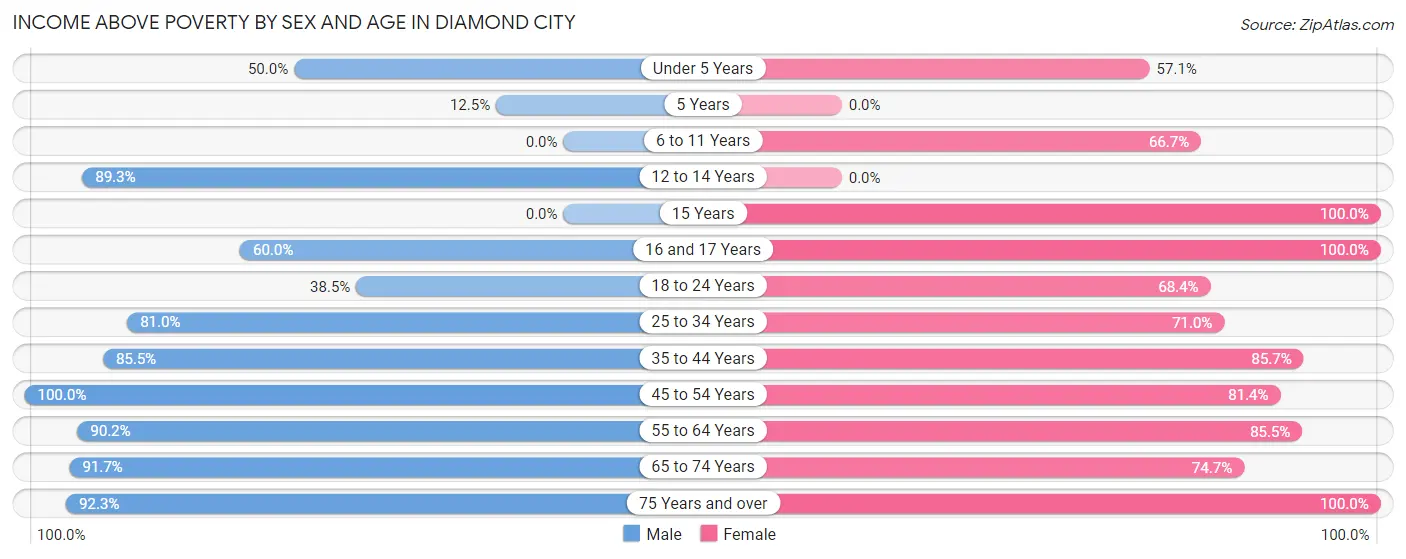
| Age Bracket | Male | Female |
| Under 5 Years | 2 (50.0%) | 20 (57.1%) |
| 5 Years | 1 (12.5%) | 0 (0.0%) |
| 6 to 11 Years | 0 (0.0%) | 10 (66.7%) |
| 12 to 14 Years | 25 (89.3%) | 0 (0.0%) |
| 15 Years | 0 (0.0%) | 12 (100.0%) |
| 16 and 17 Years | 3 (60.0%) | 22 (100.0%) |
| 18 to 24 Years | 15 (38.5%) | 39 (68.4%) |
| 25 to 34 Years | 34 (80.9%) | 22 (71.0%) |
| 35 to 44 Years | 47 (85.5%) | 54 (85.7%) |
| 45 to 54 Years | 48 (100.0%) | 35 (81.4%) |
| 55 to 64 Years | 46 (90.2%) | 47 (85.5%) |
| 65 to 74 Years | 44 (91.7%) | 53 (74.7%) |
| 75 Years and over | 36 (92.3%) | 71 (100.0%) |
| Total | 301 (82.0%) | 385 (80.5%) |
Income Below Poverty Among Married-Couple Families in Diamond City
The poverty statistics for married-couple families in Diamond City show that 16.4% or 22 of the total 134 families live below the poverty line. Families with 3 or 4 children have the highest poverty rate of 50.0%, comprising of 2 families. On the other hand, families with no children have the lowest poverty rate of 6.4%, which includes 6 families.
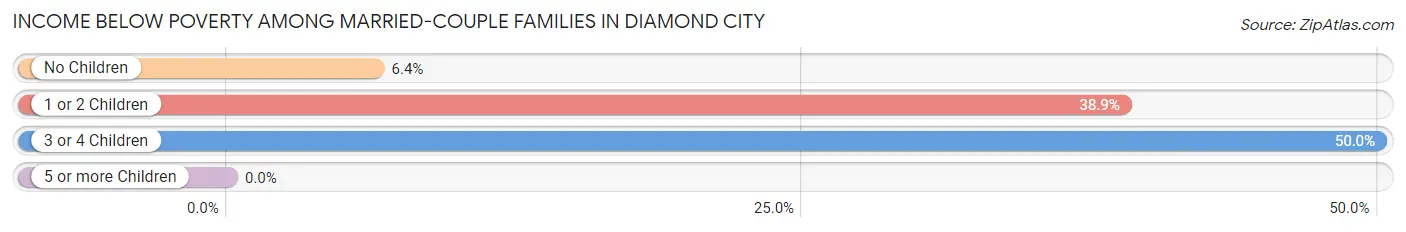
| Children | Above Poverty | Below Poverty |
| No Children | 88 (93.6%) | 6 (6.4%) |
| 1 or 2 Children | 22 (61.1%) | 14 (38.9%) |
| 3 or 4 Children | 2 (50.0%) | 2 (50.0%) |
| 5 or more Children | 0 (0.0%) | 0 (0.0%) |
| Total | 112 (83.6%) | 22 (16.4%) |
Income Below Poverty Among Single-Parent Households in Diamond City
According to the poverty data in Diamond City, 15.0% or 3 single-father households and 4.6% or 2 single-mother households are living below the poverty line. Among single-father households, those with 1 or 2 children have the highest poverty rate, with 3 households (100.0%) experiencing poverty. Likewise, among single-mother households, those with 1 or 2 children have the highest poverty rate, with 2 households (6.5%) falling below the poverty line.
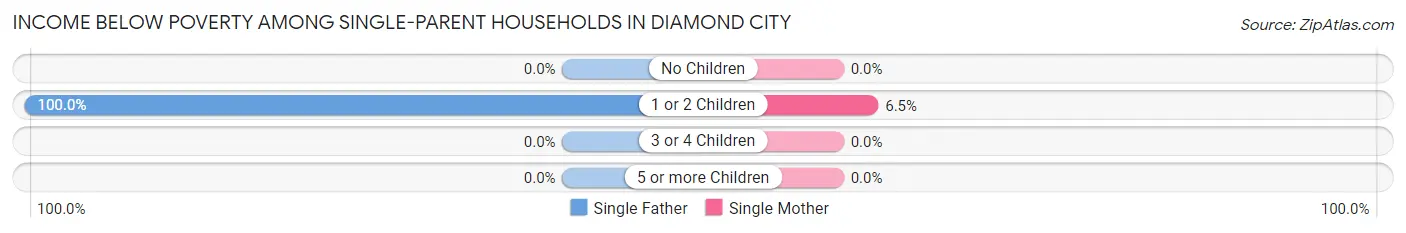
| Children | Single Father | Single Mother |
| No Children | 0 (0.0%) | 0 (0.0%) |
| 1 or 2 Children | 3 (100.0%) | 2 (6.5%) |
| 3 or 4 Children | 0 (0.0%) | 0 (0.0%) |
| 5 or more Children | 0 (0.0%) | 0 (0.0%) |
| Total | 3 (15.0%) | 2 (4.6%) |
Income Below Poverty Among Married-Couple vs Single-Parent Households in Diamond City
The poverty data for Diamond City shows that 22 of the married-couple family households (16.4%) and 5 of the single-parent households (7.9%) are living below the poverty level. Within the married-couple family households, those with 3 or 4 children have the highest poverty rate, with 2 households (50.0%) falling below the poverty line. Among the single-parent households, those with 1 or 2 children have the highest poverty rate, with 5 household (14.7%) living below poverty.
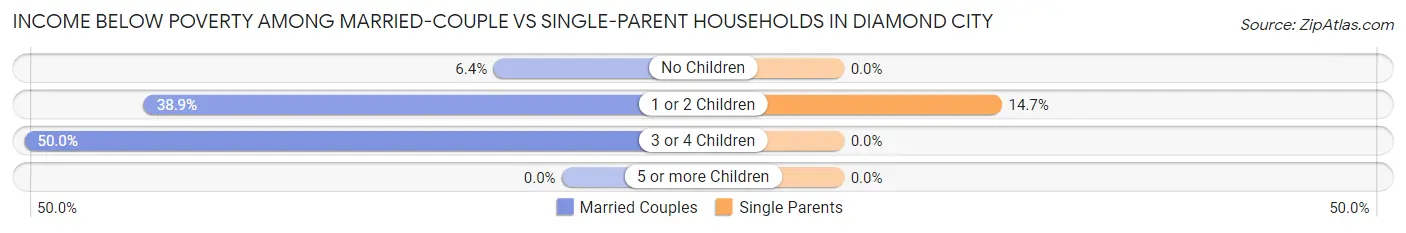
| Children | Married-Couple Families | Single-Parent Households |
| No Children | 6 (6.4%) | 0 (0.0%) |
| 1 or 2 Children | 14 (38.9%) | 5 (14.7%) |
| 3 or 4 Children | 2 (50.0%) | 0 (0.0%) |
| 5 or more Children | 0 (0.0%) | 0 (0.0%) |
| Total | 22 (16.4%) | 5 (7.9%) |
Race in Diamond City
The most populous races in Diamond City are White / Caucasian (825 | 92.9%), Hispanic or Latino (42 | 4.7%), and Two or more Races (31 | 3.5%).
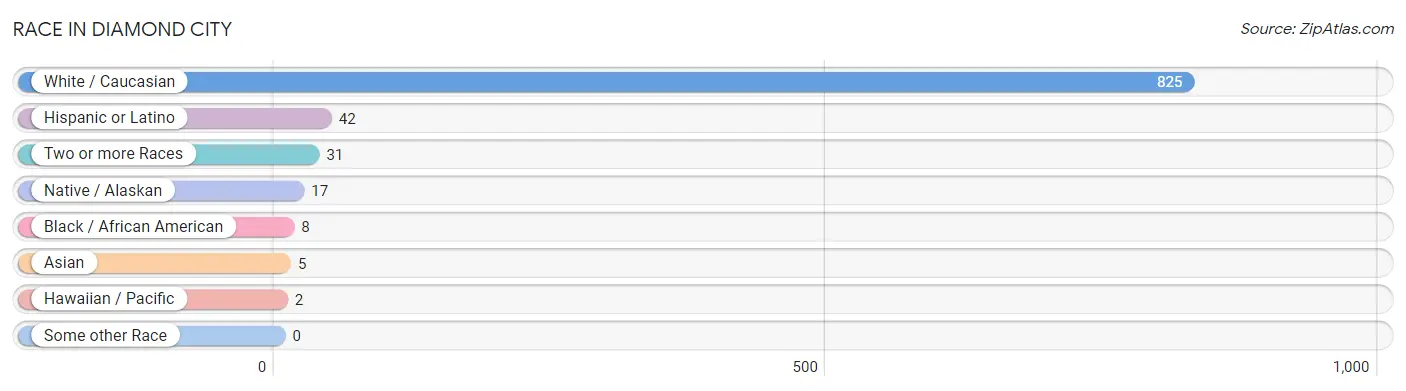
| Race | # Population | % Population |
| Asian | 5 | 0.6% |
| Black / African American | 8 | 0.9% |
| Hawaiian / Pacific | 2 | 0.2% |
| Hispanic or Latino | 42 | 4.7% |
| Native / Alaskan | 17 | 1.9% |
| White / Caucasian | 825 | 92.9% |
| Two or more Races | 31 | 3.5% |
| Some other Race | 0 | 0.0% |
| Total | 888 | 100.0% |
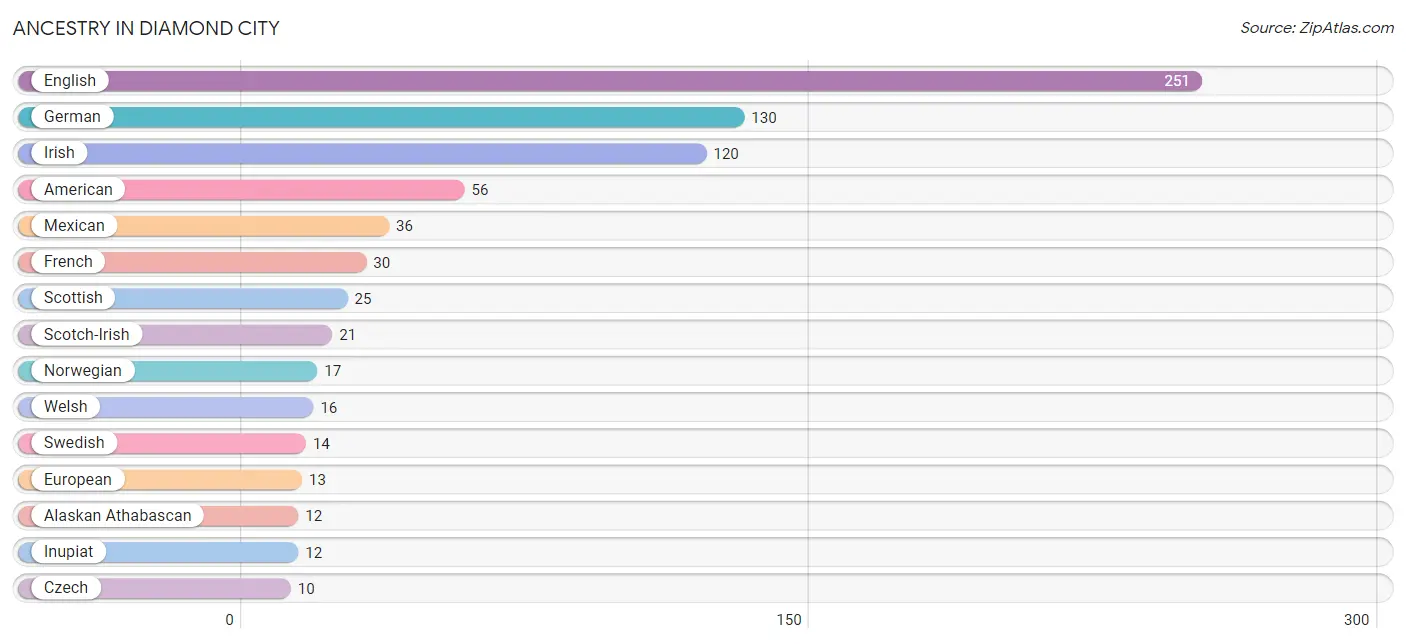
Ancestry in Diamond City
The most populous ancestries reported in Diamond City are English (251 | 28.3%), German (130 | 14.6%), Irish (120 | 13.5%), American (56 | 6.3%), and Mexican (36 | 4.1%), together accounting for 66.8% of all Diamond City residents.
| Ancestry | # Population | % Population |
| Alaskan Athabascan | 12 | 1.3% |
| American | 56 | 6.3% |
| Austrian | 5 | 0.6% |
| Canadian | 6 | 0.7% |
| Cherokee | 2 | 0.2% |
| Chickasaw | 4 | 0.4% |
| Czech | 10 | 1.1% |
| Danish | 3 | 0.3% |
| English | 251 | 28.3% |
| European | 13 | 1.5% |
| French | 30 | 3.4% |
| German | 130 | 14.6% |
| Greek | 6 | 0.7% |
| Guamanian / Chamorro | 2 | 0.2% |
| Inupiat | 12 | 1.3% |
| Irish | 120 | 13.5% |
| Italian | 7 | 0.8% |
| Korean | 2 | 0.2% |
| Mexican | 36 | 4.1% |
| Native Hawaiian | 2 | 0.2% |
| Norwegian | 17 | 1.9% |
| Polish | 7 | 0.8% |
| Portuguese | 2 | 0.2% |
| Russian | 2 | 0.2% |
| Scandinavian | 10 | 1.1% |
| Scotch-Irish | 21 | 2.4% |
| Scottish | 25 | 2.8% |
| Slavic | 1 | 0.1% |
| Slovak | 5 | 0.6% |
| Spanish | 5 | 0.6% |
| Sri Lankan | 3 | 0.3% |
| Swedish | 14 | 1.6% |
| Welsh | 16 | 1.8% | View All 33 Rows |
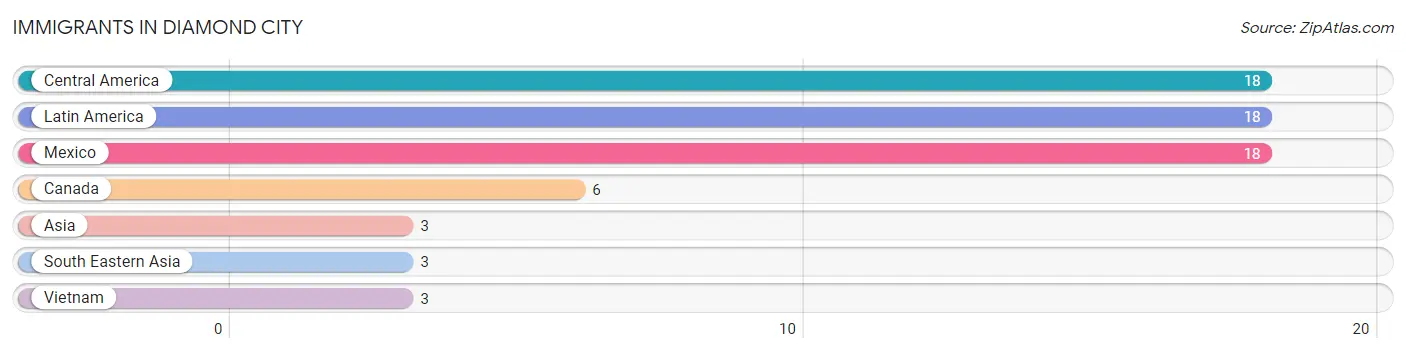
Immigrants in Diamond City
The most numerous immigrant groups reported in Diamond City came from Central America (18 | 2.0%), Latin America (18 | 2.0%), Mexico (18 | 2.0%), Canada (6 | 0.7%), and Asia (3 | 0.3%), together accounting for 7.1% of all Diamond City residents.
| Immigration Origin | # Population | % Population |
| Asia | 3 | 0.3% |
| Canada | 6 | 0.7% |
| Central America | 18 | 2.0% |
| Latin America | 18 | 2.0% |
| Mexico | 18 | 2.0% |
| South Eastern Asia | 3 | 0.3% |
| Vietnam | 3 | 0.3% | View All 7 Rows |
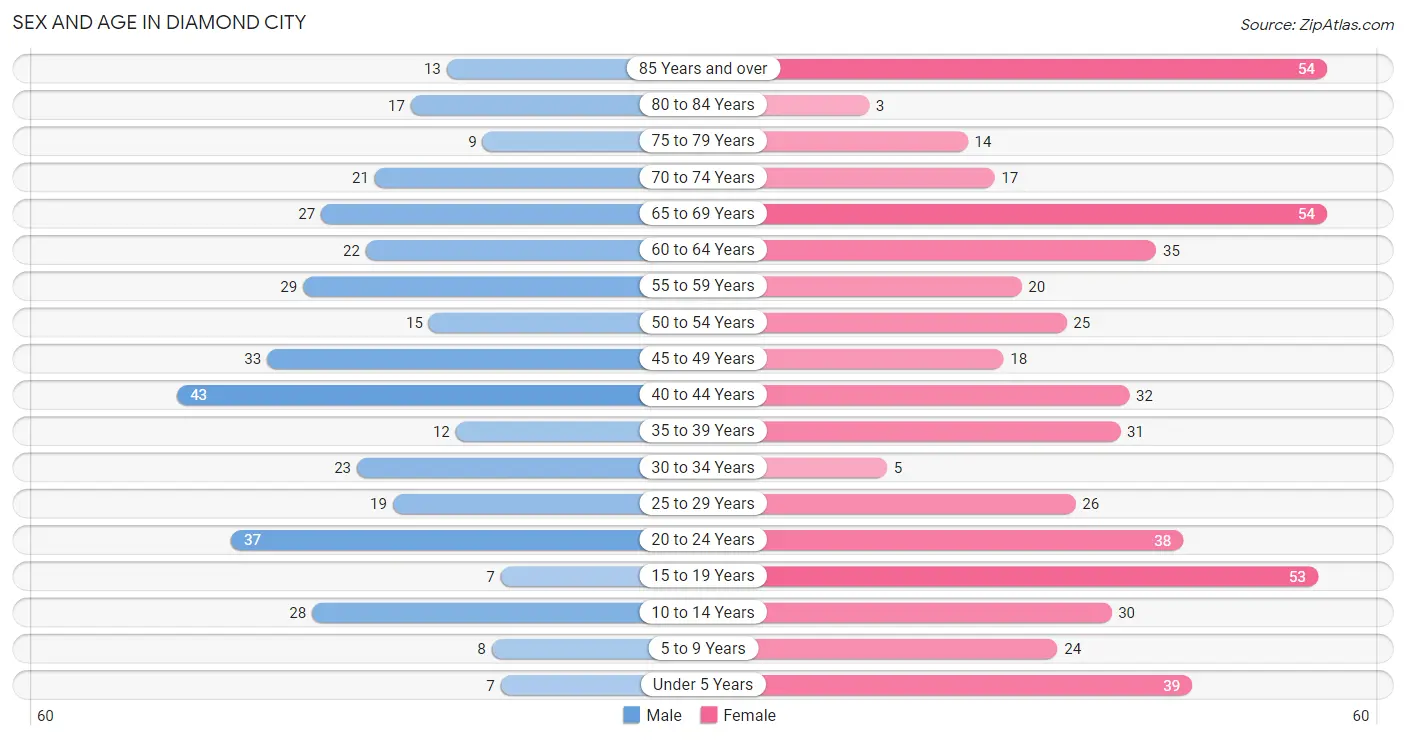
Sex and Age in Diamond City
Sex and Age in Diamond City
The most populous age groups in Diamond City are 40 to 44 Years (43 | 11.6%) for men and 65 to 69 Years (54 | 10.4%) for women.
| Age Bracket | Male | Female |
| Under 5 Years | 7 (1.9%) | 39 (7.5%) |
| 5 to 9 Years | 8 (2.2%) | 24 (4.6%) |
| 10 to 14 Years | 28 (7.6%) | 30 (5.8%) |
| 15 to 19 Years | 7 (1.9%) | 53 (10.2%) |
| 20 to 24 Years | 37 (10.0%) | 38 (7.3%) |
| 25 to 29 Years | 19 (5.1%) | 26 (5.0%) |
| 30 to 34 Years | 23 (6.2%) | 5 (1.0%) |
| 35 to 39 Years | 12 (3.2%) | 31 (6.0%) |
| 40 to 44 Years | 43 (11.6%) | 32 (6.2%) |
| 45 to 49 Years | 33 (8.9%) | 18 (3.5%) |
| 50 to 54 Years | 15 (4.1%) | 25 (4.8%) |
| 55 to 59 Years | 29 (7.8%) | 20 (3.9%) |
| 60 to 64 Years | 22 (5.9%) | 35 (6.8%) |
| 65 to 69 Years | 27 (7.3%) | 54 (10.4%) |
| 70 to 74 Years | 21 (5.7%) | 17 (3.3%) |
| 75 to 79 Years | 9 (2.4%) | 14 (2.7%) |
| 80 to 84 Years | 17 (4.6%) | 3 (0.6%) |
| 85 Years and over | 13 (3.5%) | 54 (10.4%) |
| Total | 370 (100.0%) | 518 (100.0%) |
Families and Households in Diamond City
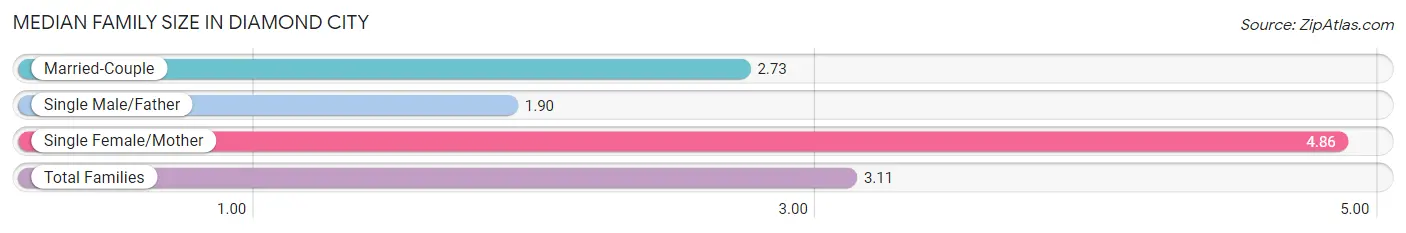
Median Family Size in Diamond City
The median family size in Diamond City is 3.11 persons per family, with single female/mother families (43 | 21.8%) accounting for the largest median family size of 4.86 persons per family. On the other hand, single male/father families (20 | 10.2%) represent the smallest median family size with 1.90 persons per family.
| Family Type | # Families | Family Size |
| Married-Couple | 134 (68.0%) | 2.73 |
| Single Male/Father | 20 (10.2%) | 1.90 |
| Single Female/Mother | 43 (21.8%) | 4.86 |
| Total Families | 197 (100.0%) | 3.11 |
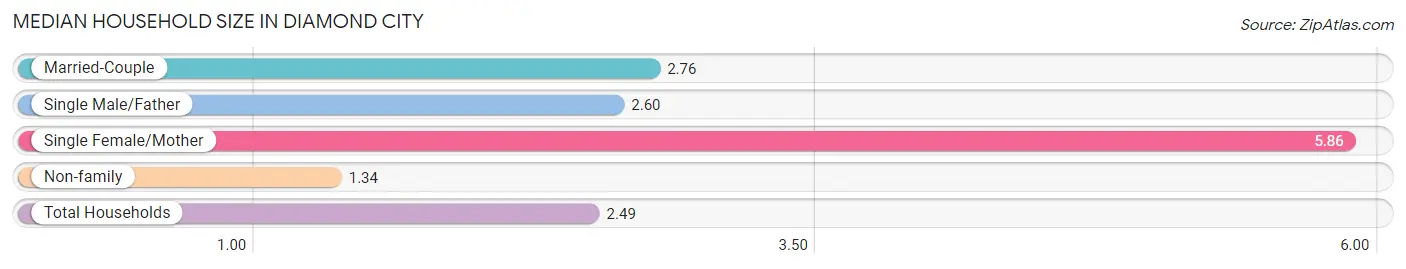
Median Household Size in Diamond City
The median household size in Diamond City is 2.49 persons per household, with single female/mother households (43 | 12.0%) accounting for the largest median household size of 5.86 persons per household. non-family households (160 | 44.8%) represent the smallest median household size with 1.34 persons per household.
| Household Type | # Households | Household Size |
| Married-Couple | 134 (37.5%) | 2.76 |
| Single Male/Father | 20 (5.6%) | 2.60 |
| Single Female/Mother | 43 (12.0%) | 5.86 |
| Non-family | 160 (44.8%) | 1.34 |
| Total Households | 357 (100.0%) | 2.49 |
Household Size by Marriage Status in Diamond City
Out of a total of 357 households in Diamond City, 197 (55.2%) are family households, while 160 (44.8%) are nonfamily households. The most numerous type of family households are 2-person households, comprising 97, and the most common type of nonfamily households are 1-person households, comprising 109.
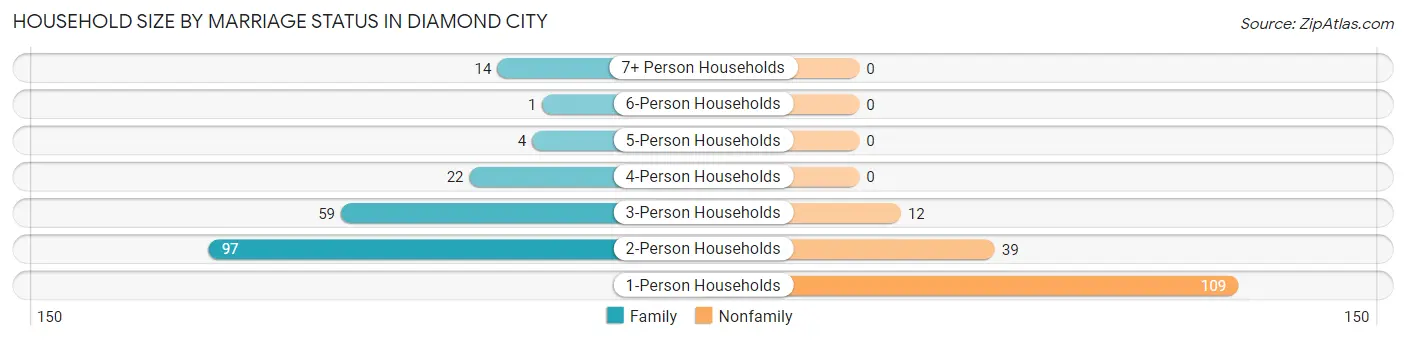
| Household Size | Family Households | Nonfamily Households |
| 1-Person Households | - | 109 (30.5%) |
| 2-Person Households | 97 (27.2%) | 39 (10.9%) |
| 3-Person Households | 59 (16.5%) | 12 (3.4%) |
| 4-Person Households | 22 (6.2%) | 0 (0.0%) |
| 5-Person Households | 4 (1.1%) | 0 (0.0%) |
| 6-Person Households | 1 (0.3%) | 0 (0.0%) |
| 7+ Person Households | 14 (3.9%) | 0 (0.0%) |
| Total | 197 (55.2%) | 160 (44.8%) |
Female Fertility in Diamond City
Fertility by Age in Diamond City
Average fertility rate in Diamond City is 48.0 births per 1,000 women. Women in the age bracket of 20 to 34 years have the highest fertility rate with 145.0 births per 1,000 women. Women in the age bracket of 20 to 34 years acount for 100.0% of all women with births.
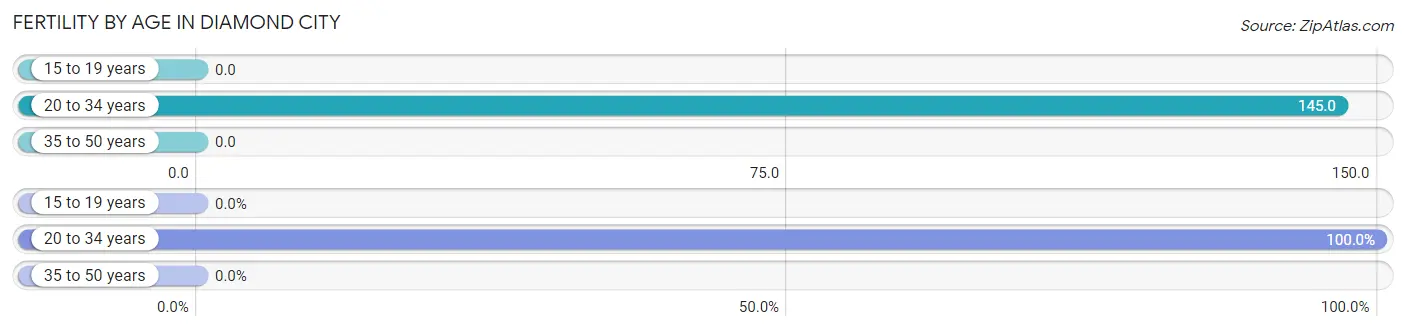
| Age Bracket | Women with Births | Births / 1,000 Women |
| 15 to 19 years | 0 (0.0%) | 0.0 |
| 20 to 34 years | 10 (100.0%) | 145.0 |
| 35 to 50 years | 0 (0.0%) | 0.0 |
| Total | 10 (100.0%) | 48.0 |
Fertility by Age by Marriage Status in Diamond City
70.0% of women with births (10) in Diamond City are married. The highest percentage of unmarried women with births falls into 20 to 34 years age bracket with 30.0% of them unmarried at the time of birth, while the lowest percentage of unmarried women with births belong to 20 to 34 years age bracket with 30.0% of them unmarried.
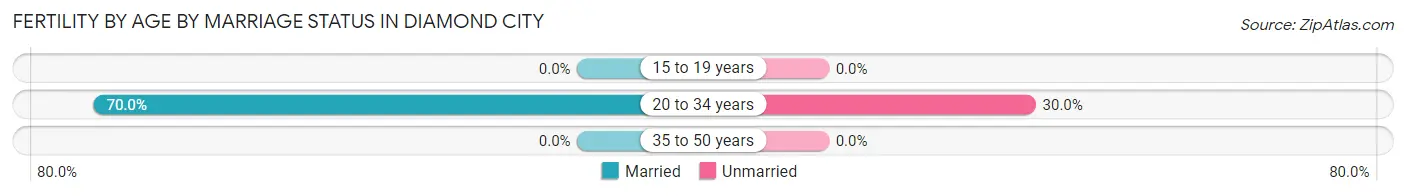
| Age Bracket | Married | Unmarried |
| 15 to 19 years | 0 (0.0%) | 0 (0.0%) |
| 20 to 34 years | 7 (70.0%) | 3 (30.0%) |
| 35 to 50 years | 0 (0.0%) | 0 (0.0%) |
| Total | 7 (70.0%) | 3 (30.0%) |
Fertility by Education in Diamond City
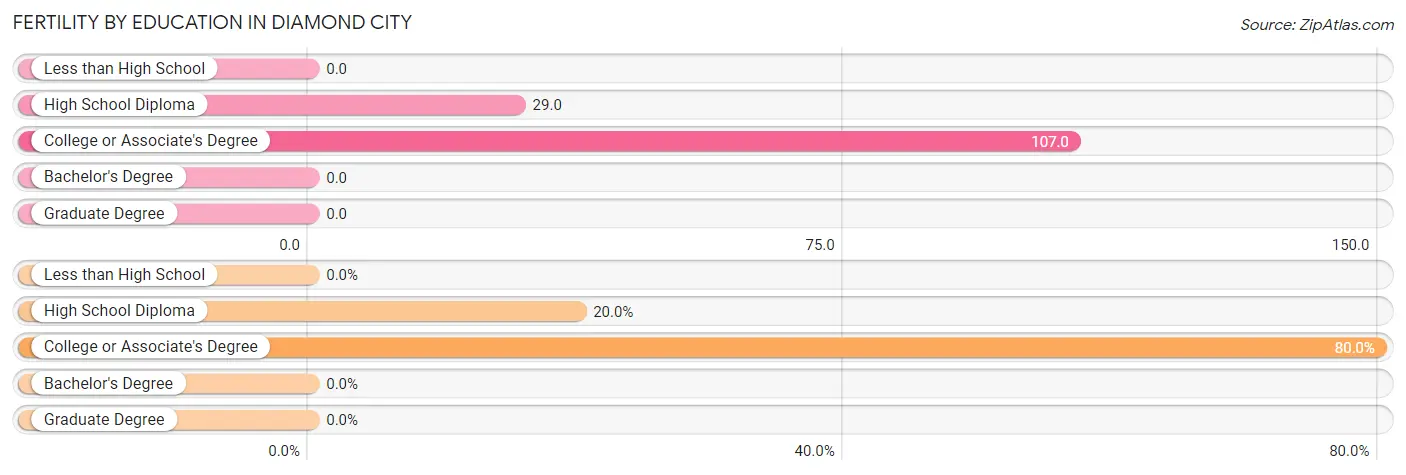
| Educational Attainment | Women with Births | Births / 1,000 Women |
| Less than High School | 0 (0.0%) | 0.0 |
| High School Diploma | 2 (20.0%) | 29.0 |
| College or Associate's Degree | 8 (80.0%) | 107.0 |
| Bachelor's Degree | 0 (0.0%) | 0.0 |
| Graduate Degree | 0 (0.0%) | 0.0 |
| Total | 10 (100.0%) | 48.0 |
Fertility by Education by Marriage Status in Diamond City
30.0% of women with births in Diamond City are unmarried. Women with the educational attainment of high school diploma are most likely to be married with 100.0% of them married at childbirth, while women with the educational attainment of college or associate's degree are least likely to be married with 37.5% of them unmarried at childbirth.
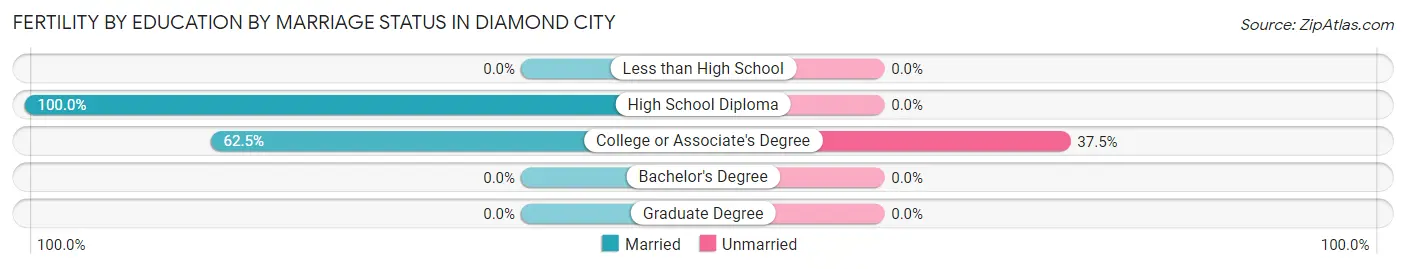
| Educational Attainment | Married | Unmarried |
| Less than High School | 0 (0.0%) | 0 (0.0%) |
| High School Diploma | 2 (100.0%) | 0 (0.0%) |
| College or Associate's Degree | 5 (62.5%) | 3 (37.5%) |
| Bachelor's Degree | 0 (0.0%) | 0 (0.0%) |
| Graduate Degree | 0 (0.0%) | 0 (0.0%) |
| Total | 7 (70.0%) | 3 (30.0%) |
Employment Characteristics in Diamond City
Employment by Class of Employer in Diamond City
Among the 364 employed individuals in Diamond City, private company employees (262 | 72.0%), local government employees (51 | 14.0%), and state government employees (25 | 6.9%) make up the most common classes of employment.
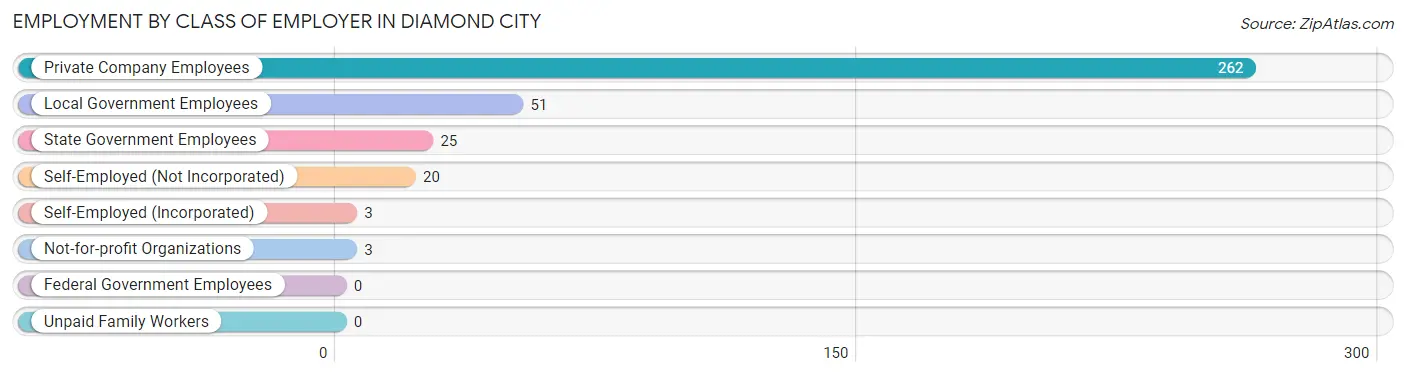
| Employer Class | # Employees | % Employees |
| Private Company Employees | 262 | 72.0% |
| Self-Employed (Incorporated) | 3 | 0.8% |
| Self-Employed (Not Incorporated) | 20 | 5.5% |
| Not-for-profit Organizations | 3 | 0.8% |
| Local Government Employees | 51 | 14.0% |
| State Government Employees | 25 | 6.9% |
| Federal Government Employees | 0 | 0.0% |
| Unpaid Family Workers | 0 | 0.0% |
| Total | 364 | 100.0% |
Employment Status by Age in Diamond City
According to the labor force statistics for Diamond City, out of the total population over 16 years of age (740), 51.1% or 378 individuals are in the labor force, with 1.3% or 5 of them unemployed. The age group with the highest labor force participation rate is 30 to 34 years, with 100.0% or 28 individuals in the labor force. Within the labor force, the 25 to 29 years age range has the highest percentage of unemployed individuals, with 10.0% or 3 of them being unemployed.
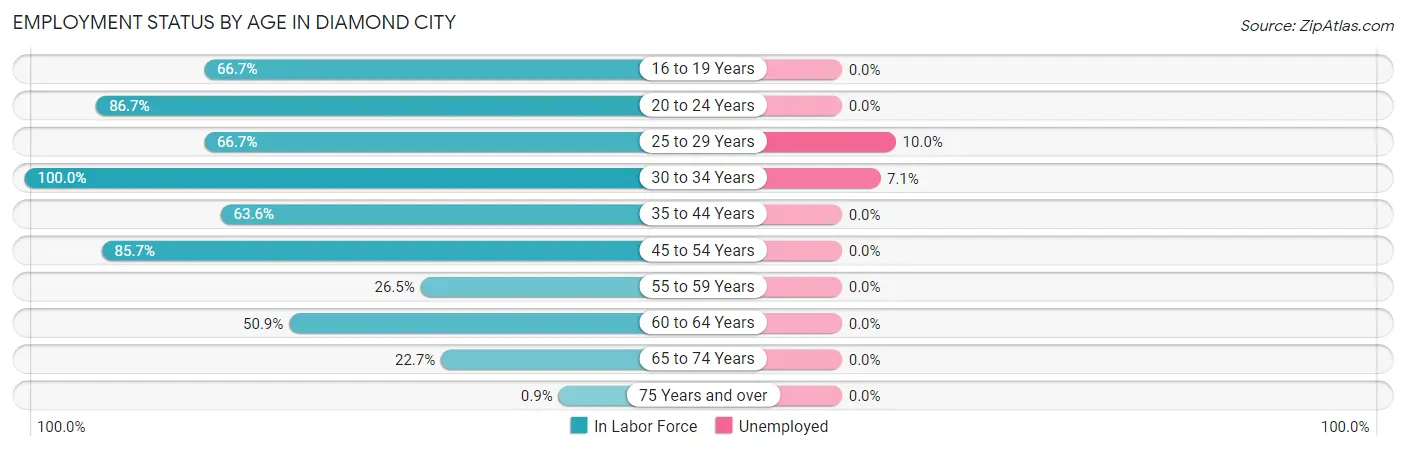
| Age Bracket | In Labor Force | Unemployed |
| 16 to 19 Years | 32 (66.7%) | 0 (0.0%) |
| 20 to 24 Years | 65 (86.7%) | 0 (0.0%) |
| 25 to 29 Years | 30 (66.7%) | 3 (10.0%) |
| 30 to 34 Years | 28 (100.0%) | 2 (7.1%) |
| 35 to 44 Years | 75 (63.6%) | 0 (0.0%) |
| 45 to 54 Years | 78 (85.7%) | 0 (0.0%) |
| 55 to 59 Years | 13 (26.5%) | 0 (0.0%) |
| 60 to 64 Years | 29 (50.9%) | 0 (0.0%) |
| 65 to 74 Years | 27 (22.7%) | 0 (0.0%) |
| 75 Years and over | 1 (0.9%) | 0 (0.0%) |
| Total | 378 (51.1%) | 5 (1.3%) |
Employment Status by Educational Attainment in Diamond City
According to labor force statistics for Diamond City, 65.2% of individuals (253) out of the total population between 25 and 64 years of age (388) are in the labor force, with 2.0% or 5 of them being unemployed. The group with the highest labor force participation rate are those with the educational attainment of bachelor's degree or higher, with 87.7% or 57 individuals in the labor force. Within the labor force, individuals with college / associate degree education have the highest percentage of unemployment, with 4.3% or 5 of them being unemployed.
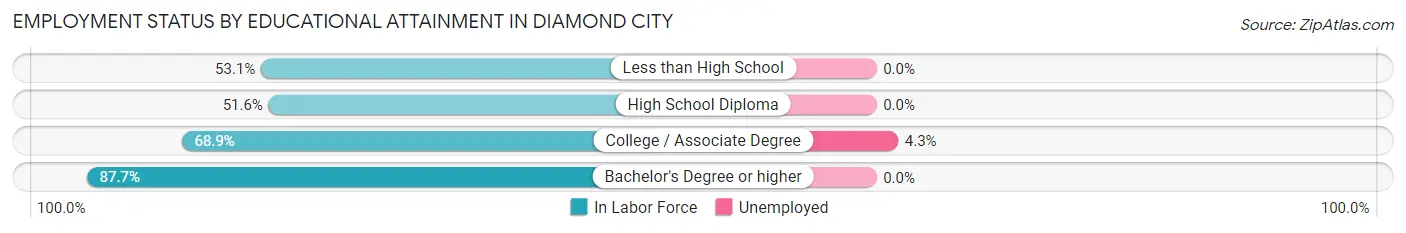
| Educational Attainment | In Labor Force | Unemployed |
| Less than High School | 17 (53.1%) | 0 (0.0%) |
| High School Diploma | 64 (51.6%) | 0 (0.0%) |
| College / Associate Degree | 115 (68.9%) | 7 (4.3%) |
| Bachelor's Degree or higher | 57 (87.7%) | 0 (0.0%) |
| Total | 253 (65.2%) | 8 (2.0%) |
Employment Occupations by Sex in Diamond City
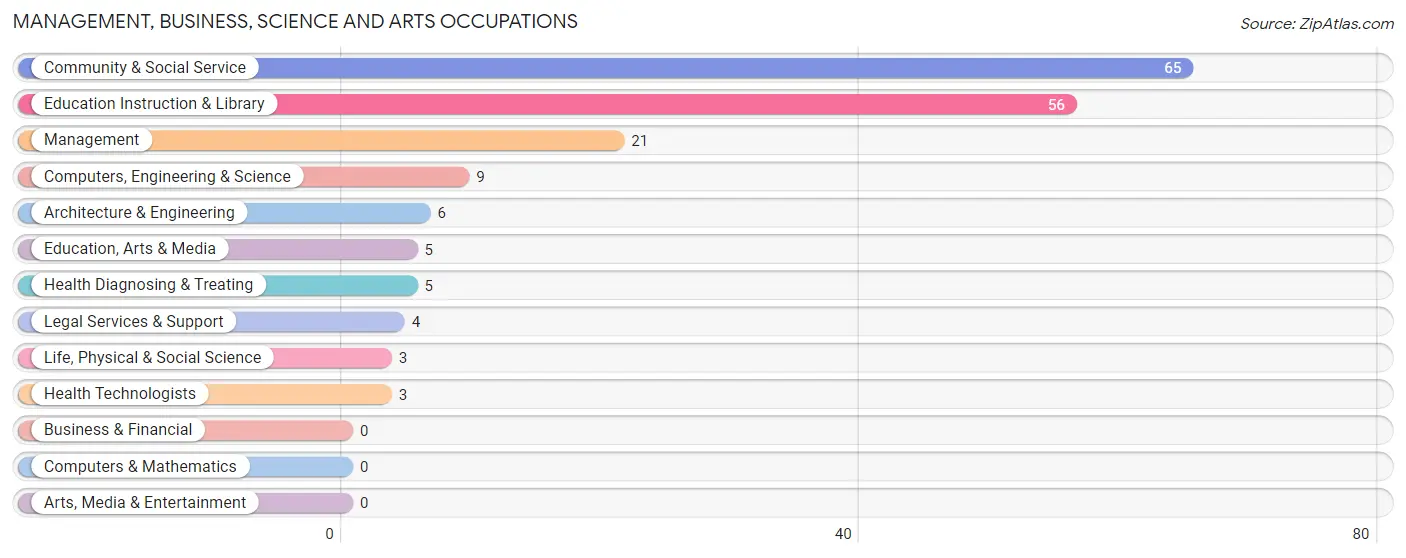
Management, Business, Science and Arts Occupations
The most common Management, Business, Science and Arts occupations in Diamond City are Community & Social Service (65 | 17.4%), Education Instruction & Library (56 | 15.0%), Management (21 | 5.6%), Computers, Engineering & Science (9 | 2.4%), and Architecture & Engineering (6 | 1.6%).
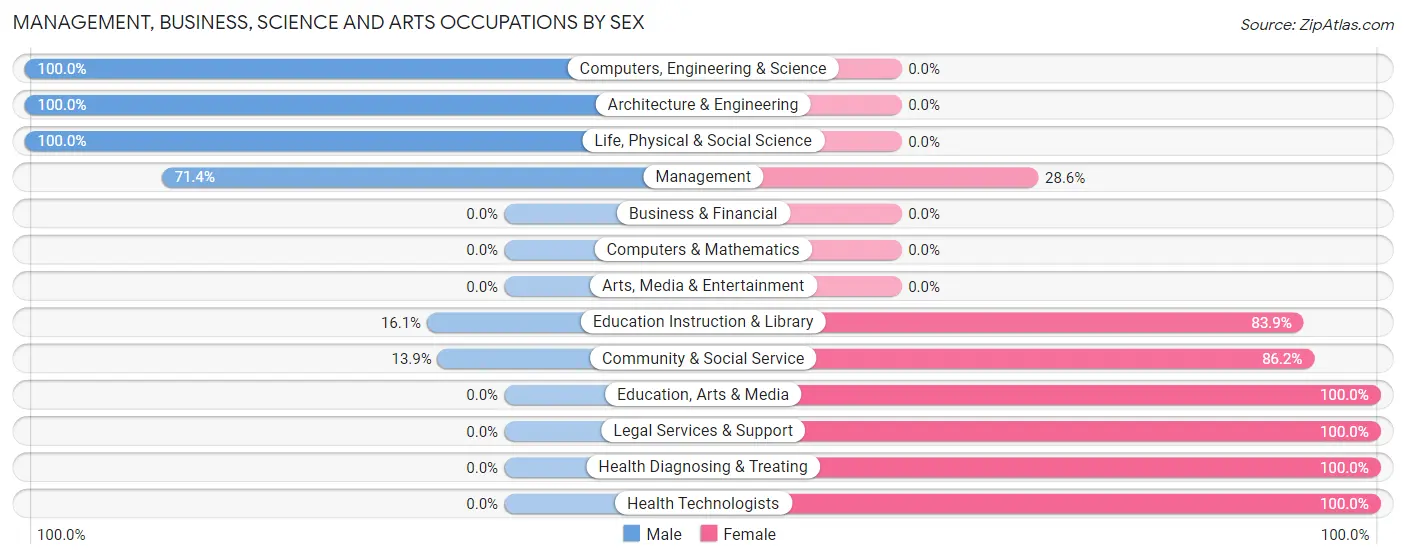
Management, Business, Science and Arts Occupations by Sex
Within the Management, Business, Science and Arts occupations in Diamond City, the most male-oriented occupations are Computers, Engineering & Science (100.0%), Architecture & Engineering (100.0%), and Life, Physical & Social Science (100.0%), while the most female-oriented occupations are Education, Arts & Media (100.0%), Legal Services & Support (100.0%), and Health Diagnosing & Treating (100.0%).
| Occupation | Male | Female |
| Management | 15 (71.4%) | 6 (28.6%) |
| Business & Financial | 0 (0.0%) | 0 (0.0%) |
| Computers, Engineering & Science | 9 (100.0%) | 0 (0.0%) |
| Computers & Mathematics | 0 (0.0%) | 0 (0.0%) |
| Architecture & Engineering | 6 (100.0%) | 0 (0.0%) |
| Life, Physical & Social Science | 3 (100.0%) | 0 (0.0%) |
| Community & Social Service | 9 (13.9%) | 56 (86.2%) |
| Education, Arts & Media | 0 (0.0%) | 5 (100.0%) |
| Legal Services & Support | 0 (0.0%) | 4 (100.0%) |
| Education Instruction & Library | 9 (16.1%) | 47 (83.9%) |
| Arts, Media & Entertainment | 0 (0.0%) | 0 (0.0%) |
| Health Diagnosing & Treating | 0 (0.0%) | 5 (100.0%) |
| Health Technologists | 0 (0.0%) | 3 (100.0%) |
| Total (Category) | 33 (33.0%) | 67 (67.0%) |
| Total (Overall) | 163 (43.7%) | 210 (56.3%) |
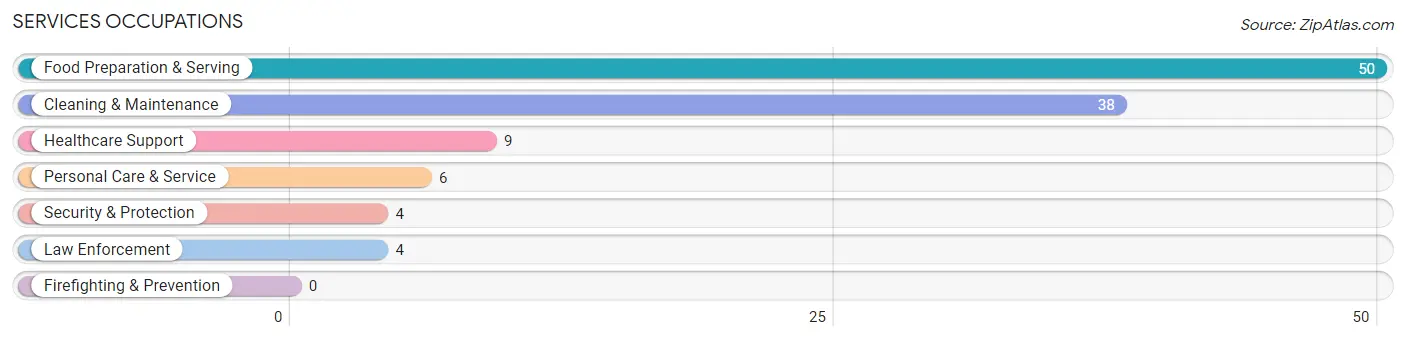
Services Occupations
The most common Services occupations in Diamond City are Food Preparation & Serving (50 | 13.4%), Cleaning & Maintenance (38 | 10.2%), Healthcare Support (9 | 2.4%), Personal Care & Service (6 | 1.6%), and Security & Protection (4 | 1.1%).
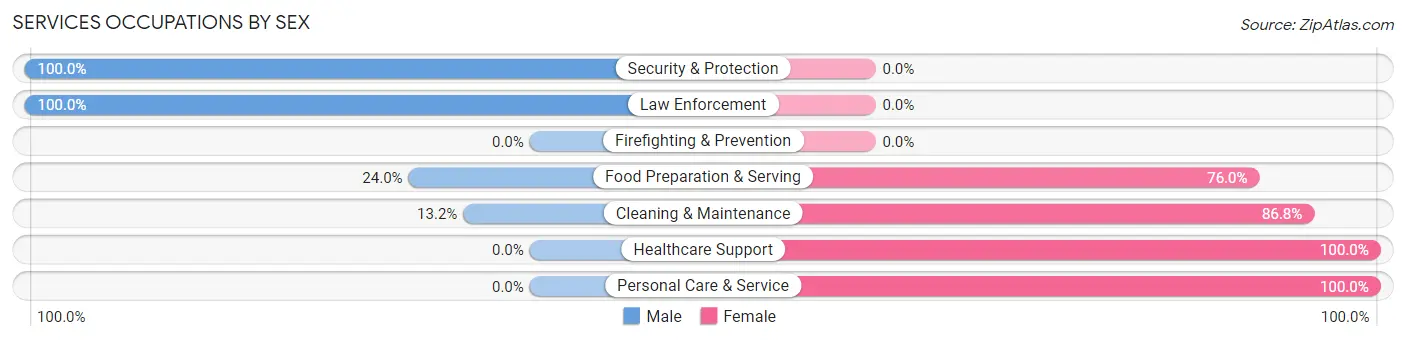
Services Occupations by Sex
Within the Services occupations in Diamond City, the most male-oriented occupations are Security & Protection (100.0%), Law Enforcement (100.0%), and Food Preparation & Serving (24.0%), while the most female-oriented occupations are Healthcare Support (100.0%), Personal Care & Service (100.0%), and Cleaning & Maintenance (86.8%).
| Occupation | Male | Female |
| Healthcare Support | 0 (0.0%) | 9 (100.0%) |
| Security & Protection | 4 (100.0%) | 0 (0.0%) |
| Firefighting & Prevention | 0 (0.0%) | 0 (0.0%) |
| Law Enforcement | 4 (100.0%) | 0 (0.0%) |
| Food Preparation & Serving | 12 (24.0%) | 38 (76.0%) |
| Cleaning & Maintenance | 5 (13.2%) | 33 (86.8%) |
| Personal Care & Service | 0 (0.0%) | 6 (100.0%) |
| Total (Category) | 21 (19.6%) | 86 (80.4%) |
| Total (Overall) | 163 (43.7%) | 210 (56.3%) |
Sales and Office Occupations
The most common Sales and Office occupations in Diamond City are Sales & Related (24 | 6.4%), and Office & Administration (24 | 6.4%).
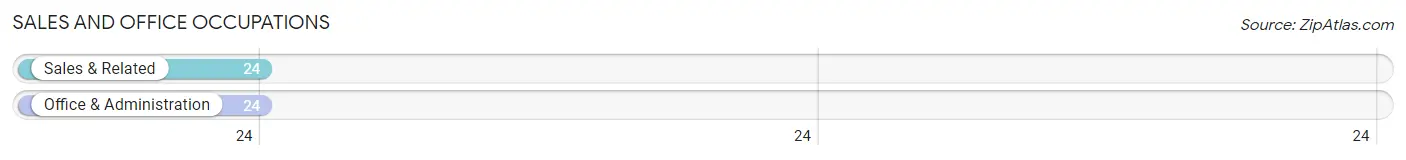
Sales and Office Occupations by Sex
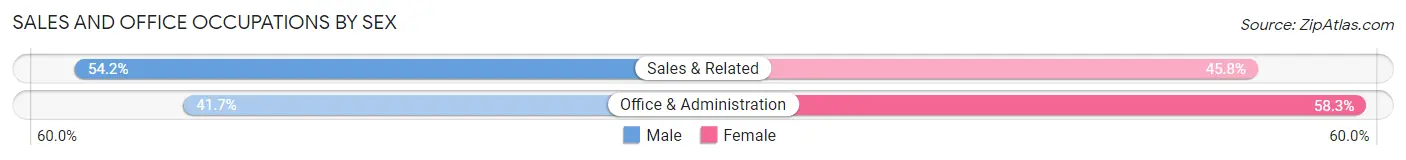
| Occupation | Male | Female |
| Sales & Related | 13 (54.2%) | 11 (45.8%) |
| Office & Administration | 10 (41.7%) | 14 (58.3%) |
| Total (Category) | 23 (47.9%) | 25 (52.1%) |
| Total (Overall) | 163 (43.7%) | 210 (56.3%) |
Natural Resources, Construction and Maintenance Occupations
The most common Natural Resources, Construction and Maintenance occupations in Diamond City are Installation, Maintenance & Repair (22 | 5.9%), Construction & Extraction (20 | 5.4%), and Farming, Fishing & Forestry (2 | 0.5%).
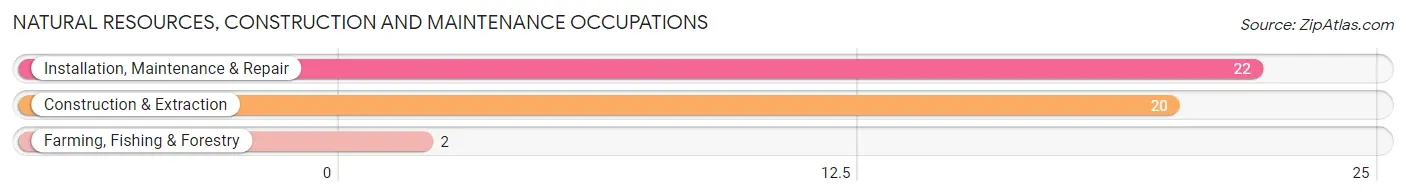
Natural Resources, Construction and Maintenance Occupations by Sex
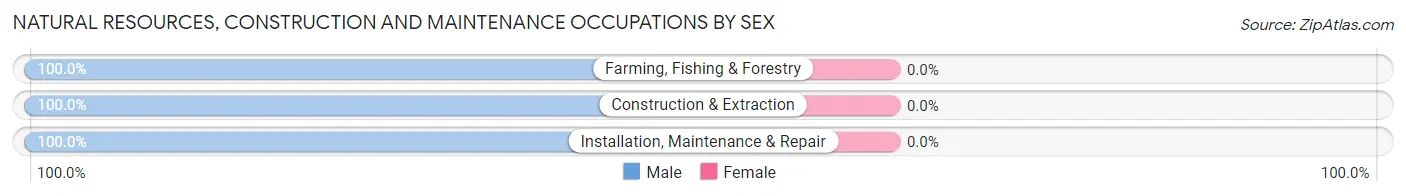
| Occupation | Male | Female |
| Farming, Fishing & Forestry | 2 (100.0%) | 0 (0.0%) |
| Construction & Extraction | 20 (100.0%) | 0 (0.0%) |
| Installation, Maintenance & Repair | 22 (100.0%) | 0 (0.0%) |
| Total (Category) | 44 (100.0%) | 0 (0.0%) |
| Total (Overall) | 163 (43.7%) | 210 (56.3%) |
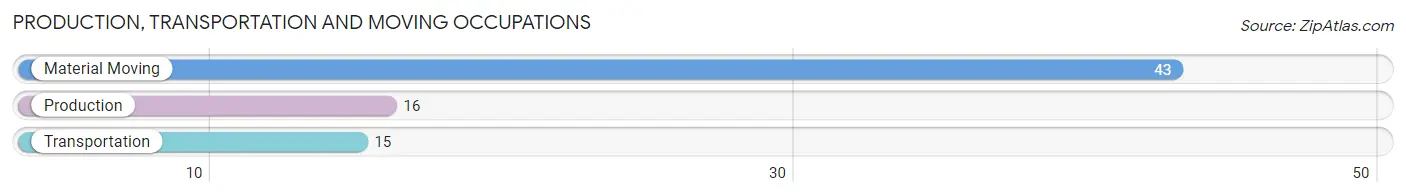
Production, Transportation and Moving Occupations
The most common Production, Transportation and Moving occupations in Diamond City are Material Moving (43 | 11.5%), Production (16 | 4.3%), and Transportation (15 | 4.0%).
Production, Transportation and Moving Occupations by Sex
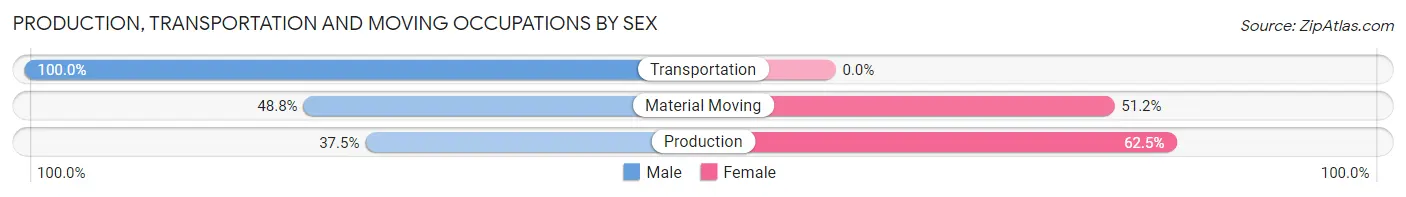
| Occupation | Male | Female |
| Production | 6 (37.5%) | 10 (62.5%) |
| Transportation | 15 (100.0%) | 0 (0.0%) |
| Material Moving | 21 (48.8%) | 22 (51.2%) |
| Total (Category) | 42 (56.8%) | 32 (43.2%) |
| Total (Overall) | 163 (43.7%) | 210 (56.3%) |
Employment Industries by Sex in Diamond City
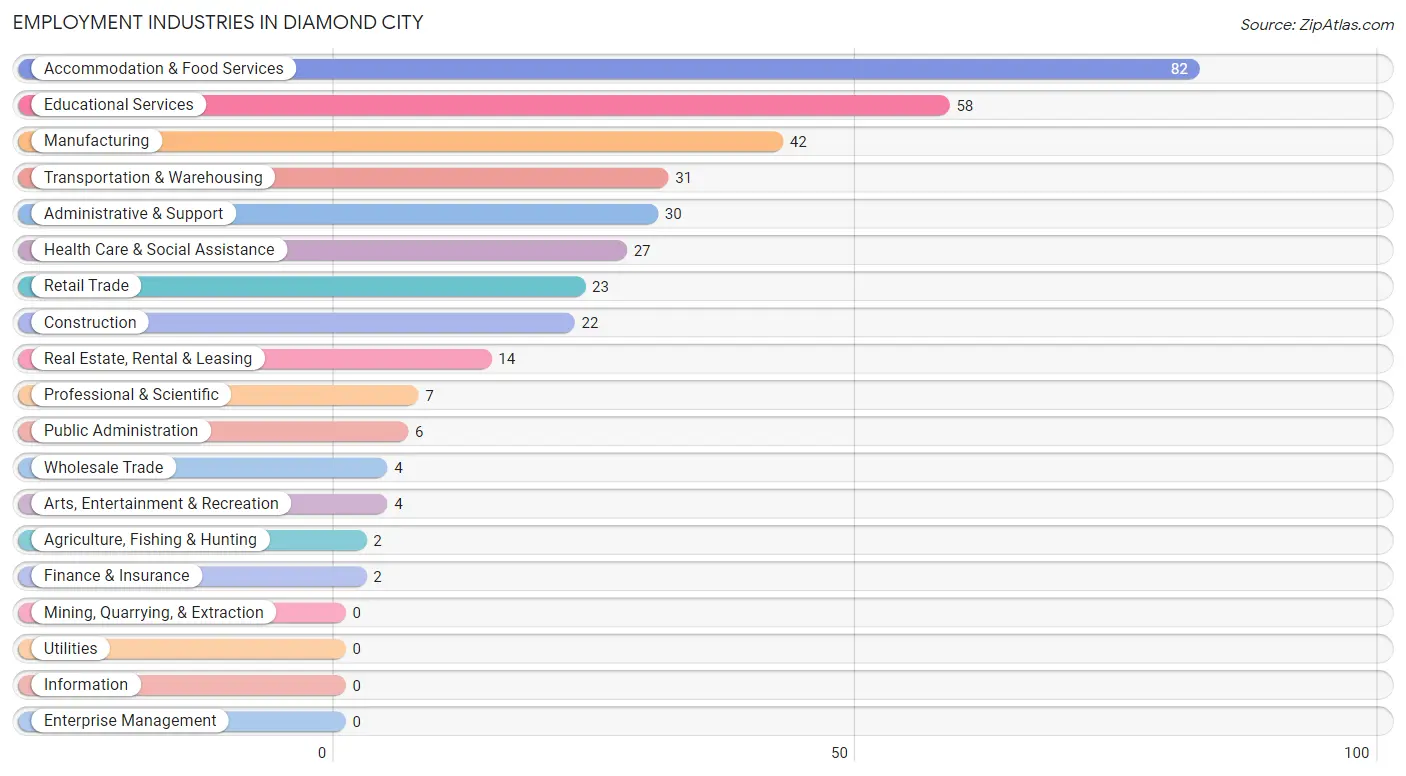
Employment Industries in Diamond City
The major employment industries in Diamond City include Accommodation & Food Services (82 | 22.0%), Educational Services (58 | 15.5%), Manufacturing (42 | 11.3%), Transportation & Warehousing (31 | 8.3%), and Administrative & Support (30 | 8.0%).
Employment Industries by Sex in Diamond City
The Diamond City industries that see more men than women are Agriculture, Fishing & Hunting (100.0%), Construction (100.0%), and Arts, Entertainment & Recreation (100.0%), whereas the industries that tend to have a higher number of women are Finance & Insurance (100.0%), Health Care & Social Assistance (100.0%), and Retail Trade (91.3%).
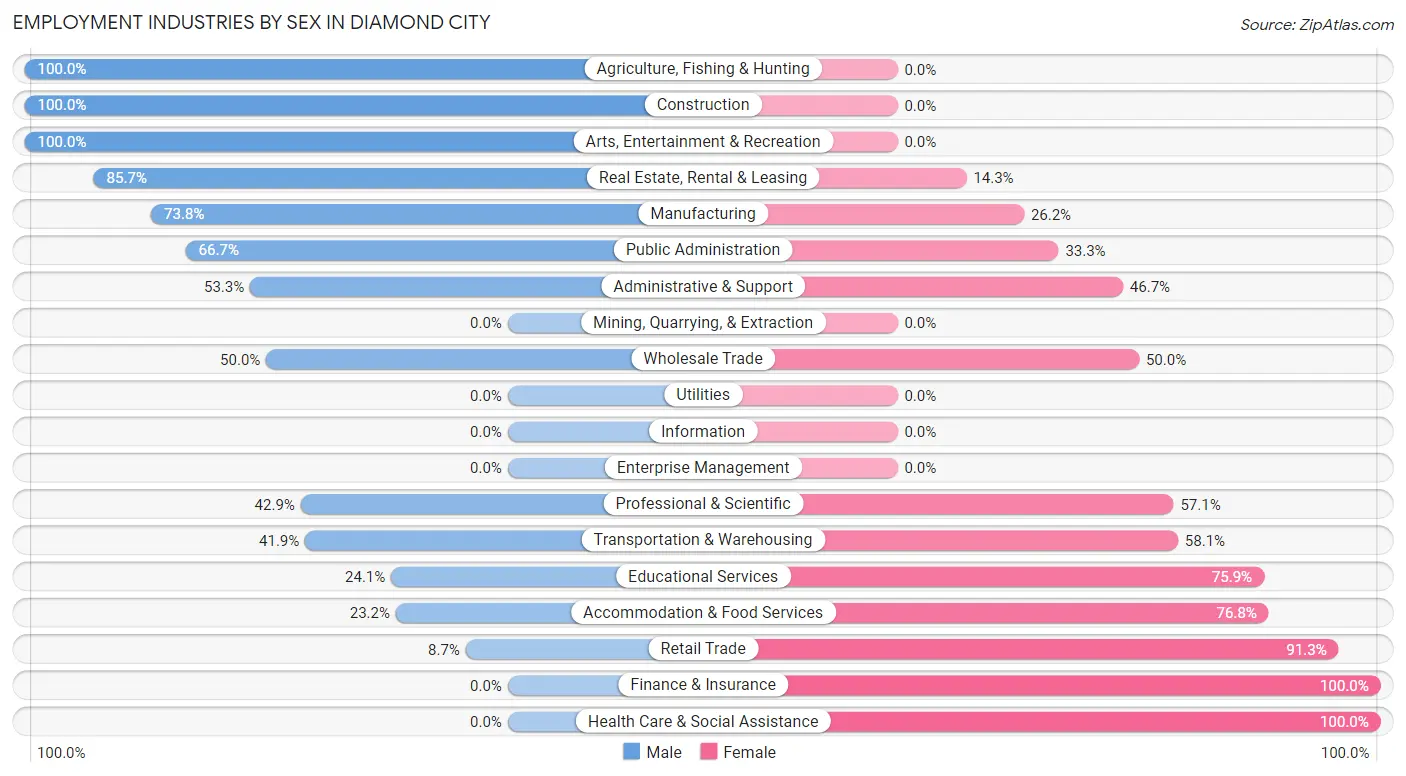
| Industry | Male | Female |
| Agriculture, Fishing & Hunting | 2 (100.0%) | 0 (0.0%) |
| Mining, Quarrying, & Extraction | 0 (0.0%) | 0 (0.0%) |
| Construction | 22 (100.0%) | 0 (0.0%) |
| Manufacturing | 31 (73.8%) | 11 (26.2%) |
| Wholesale Trade | 2 (50.0%) | 2 (50.0%) |
| Retail Trade | 2 (8.7%) | 21 (91.3%) |
| Transportation & Warehousing | 13 (41.9%) | 18 (58.1%) |
| Utilities | 0 (0.0%) | 0 (0.0%) |
| Information | 0 (0.0%) | 0 (0.0%) |
| Finance & Insurance | 0 (0.0%) | 2 (100.0%) |
| Real Estate, Rental & Leasing | 12 (85.7%) | 2 (14.3%) |
| Professional & Scientific | 3 (42.9%) | 4 (57.1%) |
| Enterprise Management | 0 (0.0%) | 0 (0.0%) |
| Administrative & Support | 16 (53.3%) | 14 (46.7%) |
| Educational Services | 14 (24.1%) | 44 (75.9%) |
| Health Care & Social Assistance | 0 (0.0%) | 27 (100.0%) |
| Arts, Entertainment & Recreation | 4 (100.0%) | 0 (0.0%) |
| Accommodation & Food Services | 19 (23.2%) | 63 (76.8%) |
| Public Administration | 4 (66.7%) | 2 (33.3%) |
| Total | 163 (43.7%) | 210 (56.3%) |
Education in Diamond City
School Enrollment in Diamond City
The most common levels of schooling among the 138 students in Diamond City are high school (44 | 31.9%), middle school (40 | 29.0%), and college / undergraduate (28 | 20.3%).
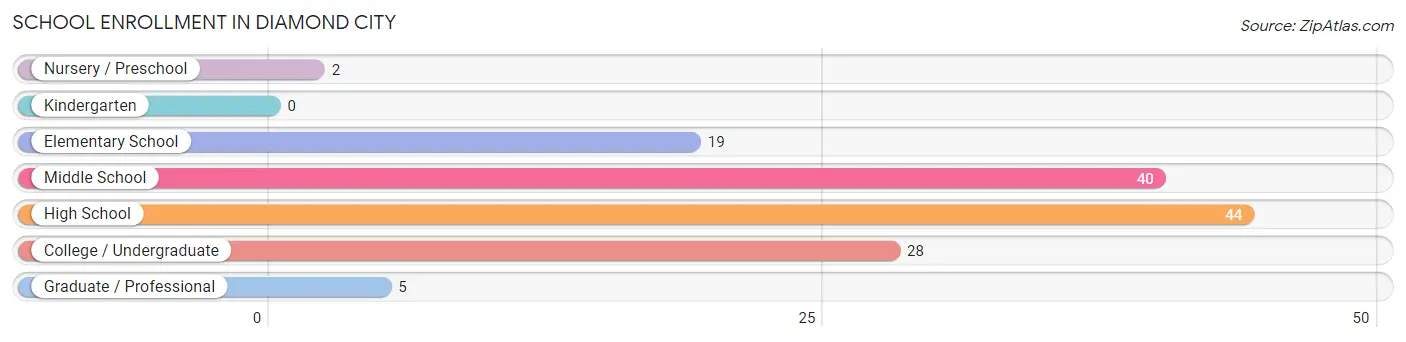
| School Level | # Students | % Students |
| Nursery / Preschool | 2 | 1.5% |
| Kindergarten | 0 | 0.0% |
| Elementary School | 19 | 13.8% |
| Middle School | 40 | 29.0% |
| High School | 44 | 31.9% |
| College / Undergraduate | 28 | 20.3% |
| Graduate / Professional | 5 | 3.6% |
| Total | 138 | 100.0% |
School Enrollment by Age by Funding Source in Diamond City
Out of a total of 138 students who are enrolled in schools in Diamond City, 2 (1.4%) attend a private institution, while the remaining 136 (98.6%) are enrolled in public schools. The age group of 10 to 14 year olds has the highest likelihood of being enrolled in private schools, with 2 (4.6% in the age bracket) enrolled. Conversely, the age group of 3 to 4 year olds has the lowest likelihood of being enrolled in a private school, with 1 (100.0% in the age bracket) attending a public institution.
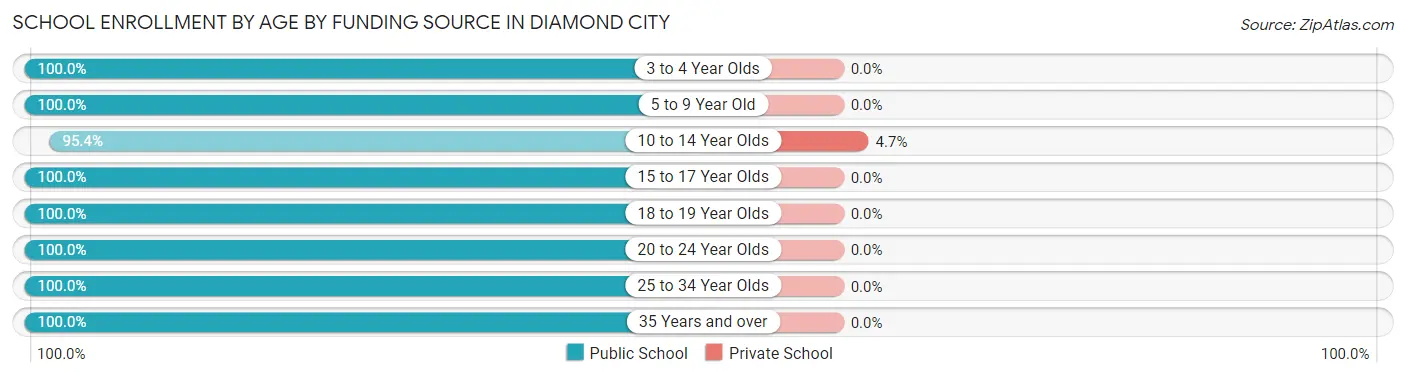
| Age Bracket | Public School | Private School |
| 3 to 4 Year Olds | 1 (100.0%) | 0 (0.0%) |
| 5 to 9 Year Old | 20 (100.0%) | 0 (0.0%) |
| 10 to 14 Year Olds | 41 (95.4%) | 2 (4.6%) |
| 15 to 17 Year Olds | 39 (100.0%) | 0 (0.0%) |
| 18 to 19 Year Olds | 2 (100.0%) | 0 (0.0%) |
| 20 to 24 Year Olds | 8 (100.0%) | 0 (0.0%) |
| 25 to 34 Year Olds | 7 (100.0%) | 0 (0.0%) |
| 35 Years and over | 18 (100.0%) | 0 (0.0%) |
| Total | 136 (98.6%) | 2 (1.4%) |
Educational Attainment by Field of Study in Diamond City
Education (41 | 43.6%), visual & performing arts (19 | 20.2%), liberal arts & history (14 | 14.9%), business (6 | 6.4%), and literature & languages (6 | 6.4%) are the most common fields of study among 94 individuals in Diamond City who have obtained a bachelor's degree or higher.
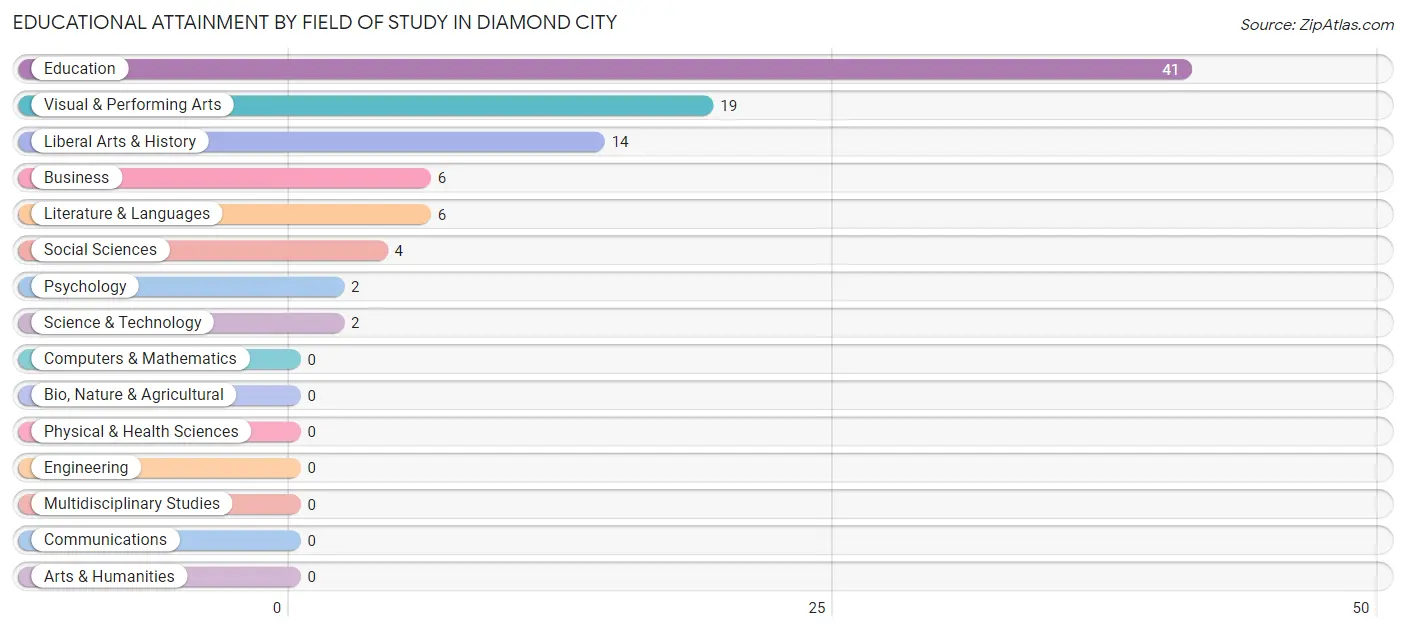
| Field of Study | # Graduates | % Graduates |
| Computers & Mathematics | 0 | 0.0% |
| Bio, Nature & Agricultural | 0 | 0.0% |
| Physical & Health Sciences | 0 | 0.0% |
| Psychology | 2 | 2.1% |
| Social Sciences | 4 | 4.3% |
| Engineering | 0 | 0.0% |
| Multidisciplinary Studies | 0 | 0.0% |
| Science & Technology | 2 | 2.1% |
| Business | 6 | 6.4% |
| Education | 41 | 43.6% |
| Literature & Languages | 6 | 6.4% |
| Liberal Arts & History | 14 | 14.9% |
| Visual & Performing Arts | 19 | 20.2% |
| Communications | 0 | 0.0% |
| Arts & Humanities | 0 | 0.0% |
| Total | 94 | 100.0% |
Transportation & Commute in Diamond City
Vehicle Availability by Sex in Diamond City
The most prevalent vehicle ownership categories in Diamond City are males with 2 vehicles (66, accounting for 42.9%) and females with 2 vehicles (53, making up 31.4%).
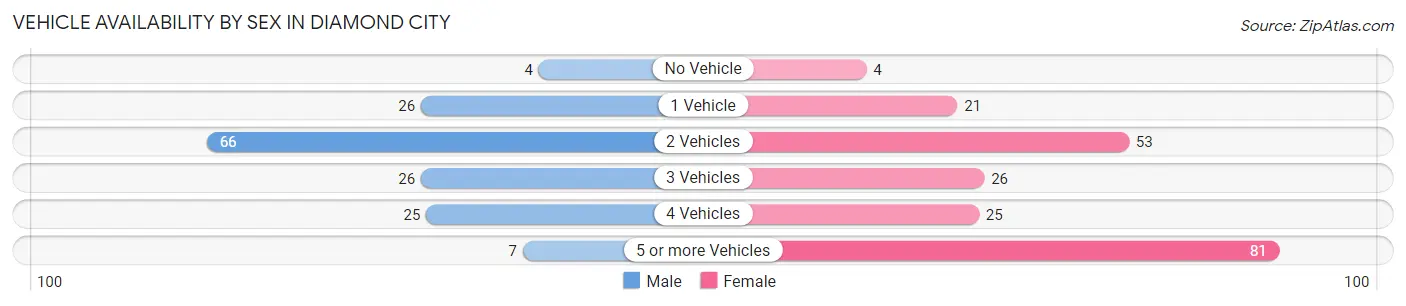
| Vehicles Available | Male | Female |
| No Vehicle | 4 (2.6%) | 4 (1.9%) |
| 1 Vehicle | 26 (16.9%) | 21 (10.0%) |
| 2 Vehicles | 66 (42.9%) | 53 (25.2%) |
| 3 Vehicles | 26 (16.9%) | 26 (12.4%) |
| 4 Vehicles | 25 (16.2%) | 25 (11.9%) |
| 5 or more Vehicles | 7 (4.5%) | 81 (38.6%) |
| Total | 154 (100.0%) | 210 (100.0%) |
Commute Time in Diamond City
The most frequently occuring commute durations in Diamond City are 5 to 9 minutes (88 commuters, 24.9%), 30 to 34 minutes (49 commuters, 13.9%), and 60 to 89 minutes (48 commuters, 13.6%).
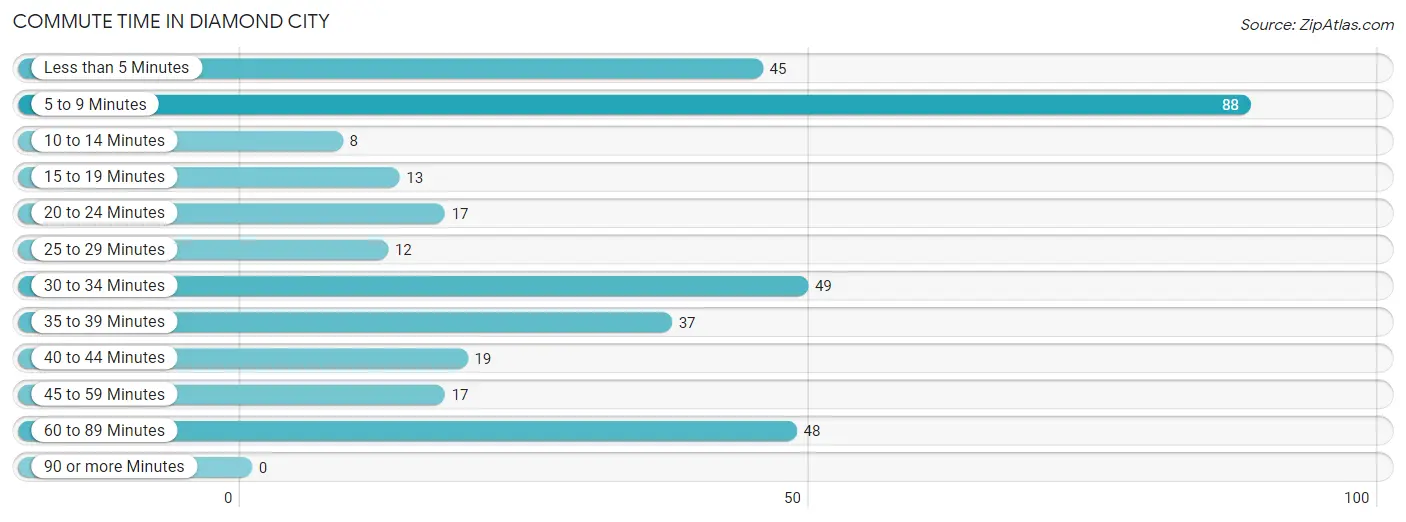
| Commute Time | # Commuters | % Commuters |
| Less than 5 Minutes | 45 | 12.8% |
| 5 to 9 Minutes | 88 | 24.9% |
| 10 to 14 Minutes | 8 | 2.3% |
| 15 to 19 Minutes | 13 | 3.7% |
| 20 to 24 Minutes | 17 | 4.8% |
| 25 to 29 Minutes | 12 | 3.4% |
| 30 to 34 Minutes | 49 | 13.9% |
| 35 to 39 Minutes | 37 | 10.5% |
| 40 to 44 Minutes | 19 | 5.4% |
| 45 to 59 Minutes | 17 | 4.8% |
| 60 to 89 Minutes | 48 | 13.6% |
| 90 or more Minutes | 0 | 0.0% |
Commute Time by Sex in Diamond City
The most common commute times in Diamond City are 60 to 89 minutes (34 commuters, 23.4%) for males and 5 to 9 minutes (66 commuters, 31.7%) for females.
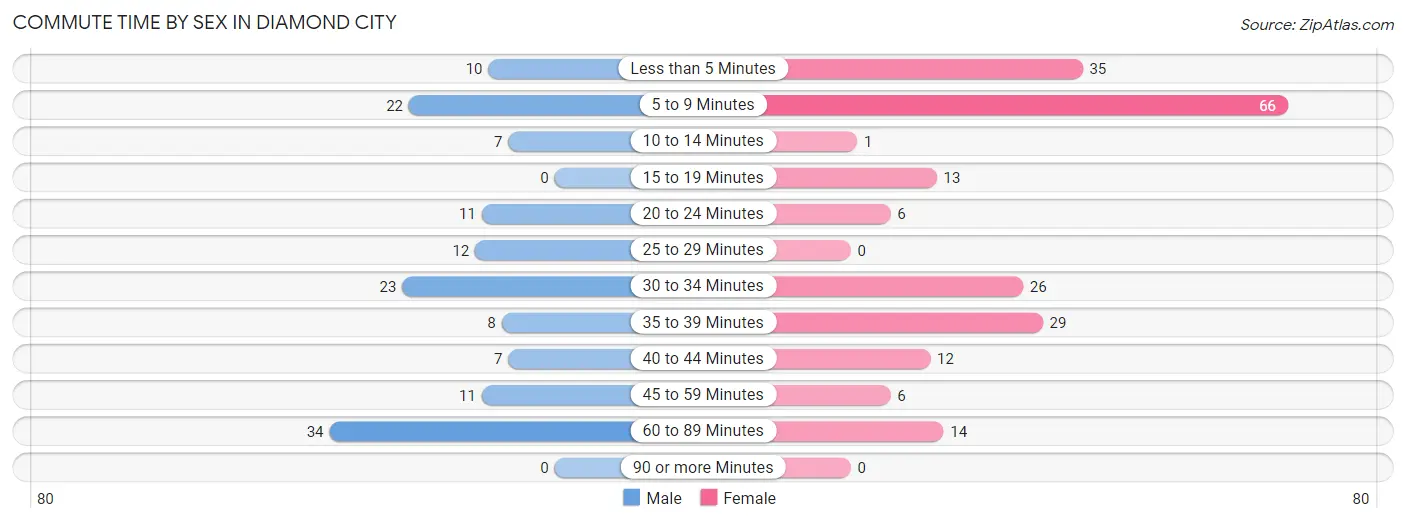
| Commute Time | Male | Female |
| Less than 5 Minutes | 10 (6.9%) | 35 (16.8%) |
| 5 to 9 Minutes | 22 (15.2%) | 66 (31.7%) |
| 10 to 14 Minutes | 7 (4.8%) | 1 (0.5%) |
| 15 to 19 Minutes | 0 (0.0%) | 13 (6.2%) |
| 20 to 24 Minutes | 11 (7.6%) | 6 (2.9%) |
| 25 to 29 Minutes | 12 (8.3%) | 0 (0.0%) |
| 30 to 34 Minutes | 23 (15.9%) | 26 (12.5%) |
| 35 to 39 Minutes | 8 (5.5%) | 29 (13.9%) |
| 40 to 44 Minutes | 7 (4.8%) | 12 (5.8%) |
| 45 to 59 Minutes | 11 (7.6%) | 6 (2.9%) |
| 60 to 89 Minutes | 34 (23.4%) | 14 (6.7%) |
| 90 or more Minutes | 0 (0.0%) | 0 (0.0%) |
Time of Departure to Work by Sex in Diamond City
The most frequent times of departure to work in Diamond City are 6:00 AM to 6:29 AM (49, 33.8%) for males and 7:00 AM to 7:29 AM (67, 32.2%) for females.
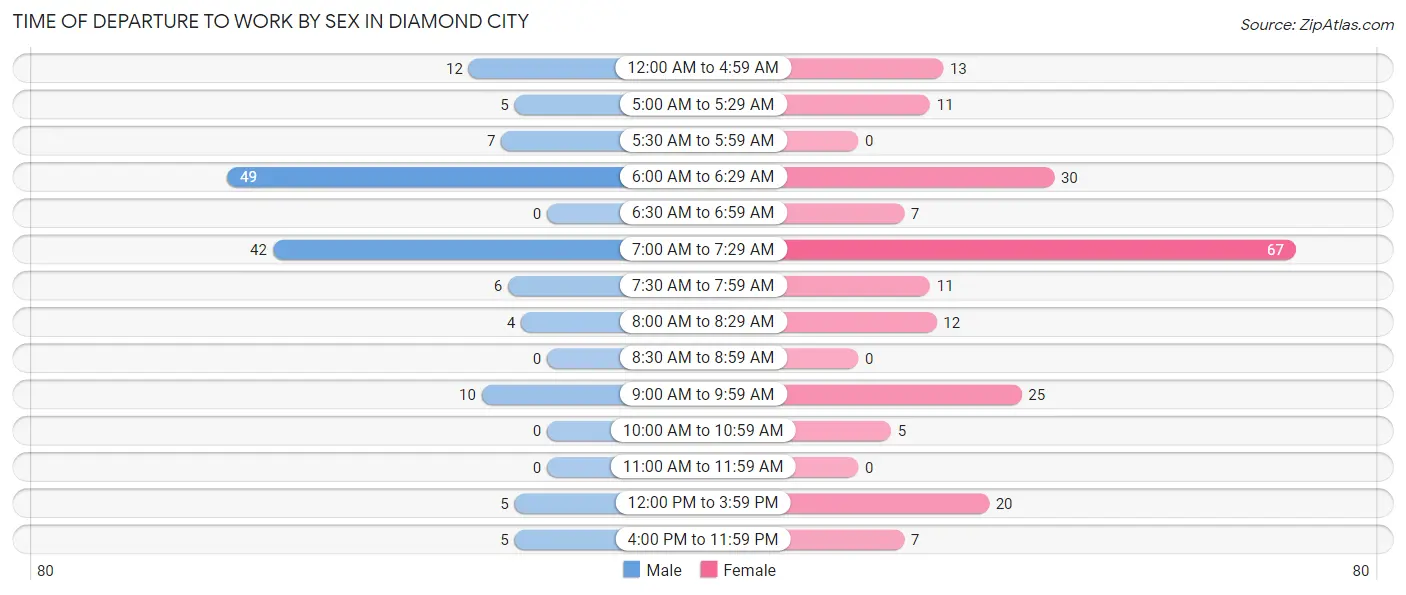
| Time of Departure | Male | Female |
| 12:00 AM to 4:59 AM | 12 (8.3%) | 13 (6.2%) |
| 5:00 AM to 5:29 AM | 5 (3.5%) | 11 (5.3%) |
| 5:30 AM to 5:59 AM | 7 (4.8%) | 0 (0.0%) |
| 6:00 AM to 6:29 AM | 49 (33.8%) | 30 (14.4%) |
| 6:30 AM to 6:59 AM | 0 (0.0%) | 7 (3.4%) |
| 7:00 AM to 7:29 AM | 42 (29.0%) | 67 (32.2%) |
| 7:30 AM to 7:59 AM | 6 (4.1%) | 11 (5.3%) |
| 8:00 AM to 8:29 AM | 4 (2.8%) | 12 (5.8%) |
| 8:30 AM to 8:59 AM | 0 (0.0%) | 0 (0.0%) |
| 9:00 AM to 9:59 AM | 10 (6.9%) | 25 (12.0%) |
| 10:00 AM to 10:59 AM | 0 (0.0%) | 5 (2.4%) |
| 11:00 AM to 11:59 AM | 0 (0.0%) | 0 (0.0%) |
| 12:00 PM to 3:59 PM | 5 (3.5%) | 20 (9.6%) |
| 4:00 PM to 11:59 PM | 5 (3.5%) | 7 (3.4%) |
| Total | 145 (100.0%) | 208 (100.0%) |
Housing Occupancy in Diamond City
Occupancy by Ownership in Diamond City
Of the total 357 dwellings in Diamond City, owner-occupied units account for 270 (75.6%), while renter-occupied units make up 87 (24.4%).
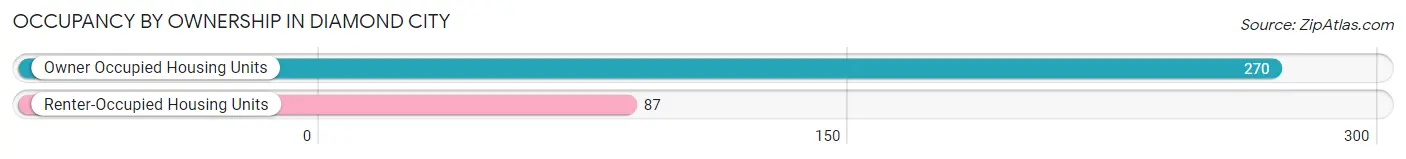
| Occupancy | # Housing Units | % Housing Units |
| Owner Occupied Housing Units | 270 | 75.6% |
| Renter-Occupied Housing Units | 87 | 24.4% |
| Total Occupied Housing Units | 357 | 100.0% |
Occupancy by Household Size in Diamond City
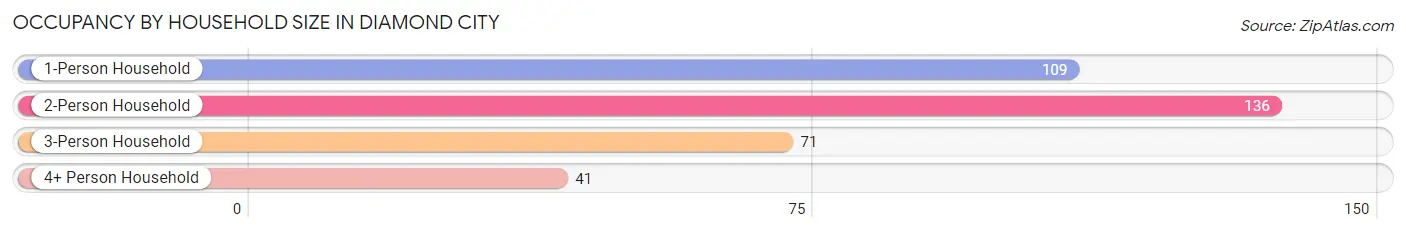
| Household Size | # Housing Units | % Housing Units |
| 1-Person Household | 109 | 30.5% |
| 2-Person Household | 136 | 38.1% |
| 3-Person Household | 71 | 19.9% |
| 4+ Person Household | 41 | 11.5% |
| Total Housing Units | 357 | 100.0% |
Occupancy by Ownership by Household Size in Diamond City
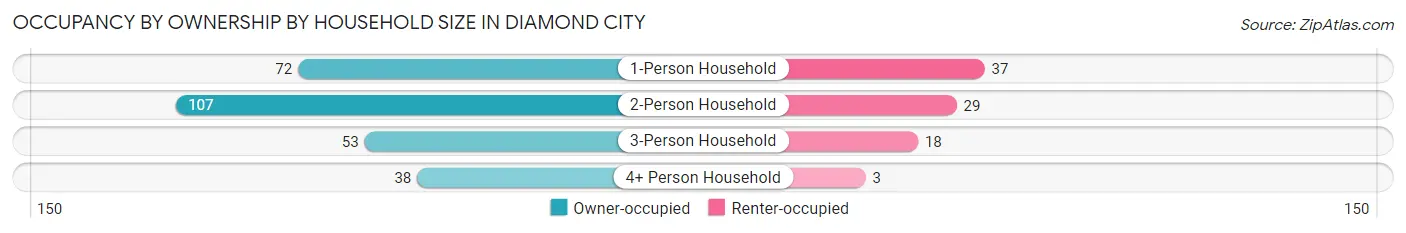
| Household Size | Owner-occupied | Renter-occupied |
| 1-Person Household | 72 (66.1%) | 37 (33.9%) |
| 2-Person Household | 107 (78.7%) | 29 (21.3%) |
| 3-Person Household | 53 (74.7%) | 18 (25.4%) |
| 4+ Person Household | 38 (92.7%) | 3 (7.3%) |
| Total Housing Units | 270 (75.6%) | 87 (24.4%) |
Occupancy by Educational Attainment in Diamond City
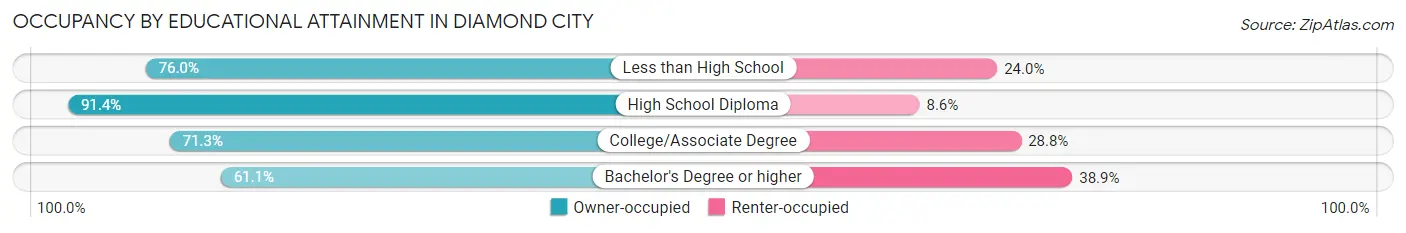
| Household Size | Owner-occupied | Renter-occupied |
| Less than High School | 38 (76.0%) | 12 (24.0%) |
| High School Diploma | 85 (91.4%) | 8 (8.6%) |
| College/Associate Degree | 114 (71.3%) | 46 (28.7%) |
| Bachelor's Degree or higher | 33 (61.1%) | 21 (38.9%) |
Occupancy by Age of Householder in Diamond City
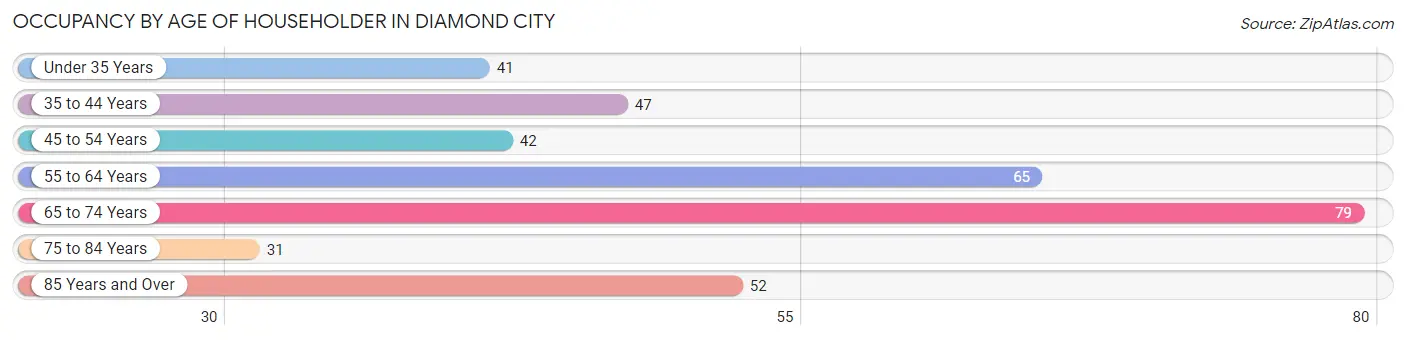
| Age Bracket | # Households | % Households |
| Under 35 Years | 41 | 11.5% |
| 35 to 44 Years | 47 | 13.2% |
| 45 to 54 Years | 42 | 11.8% |
| 55 to 64 Years | 65 | 18.2% |
| 65 to 74 Years | 79 | 22.1% |
| 75 to 84 Years | 31 | 8.7% |
| 85 Years and Over | 52 | 14.6% |
| Total | 357 | 100.0% |
Housing Finances in Diamond City
Median Income by Occupancy in Diamond City
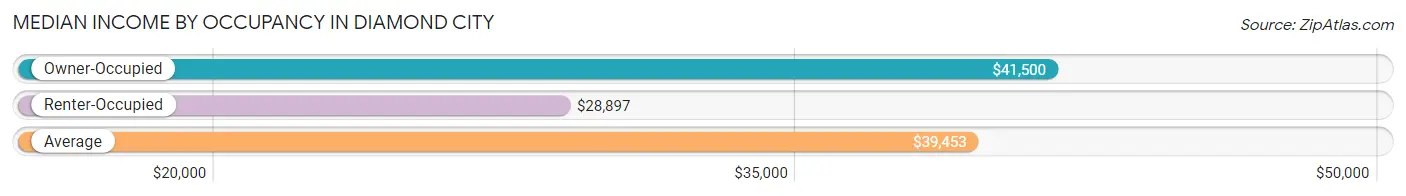
| Occupancy Type | # Households | Median Income |
| Owner-Occupied | 270 (75.6%) | $41,500 |
| Renter-Occupied | 87 (24.4%) | $28,897 |
| Average | 357 (100.0%) | $39,453 |
Occupancy by Householder Income Bracket in Diamond City
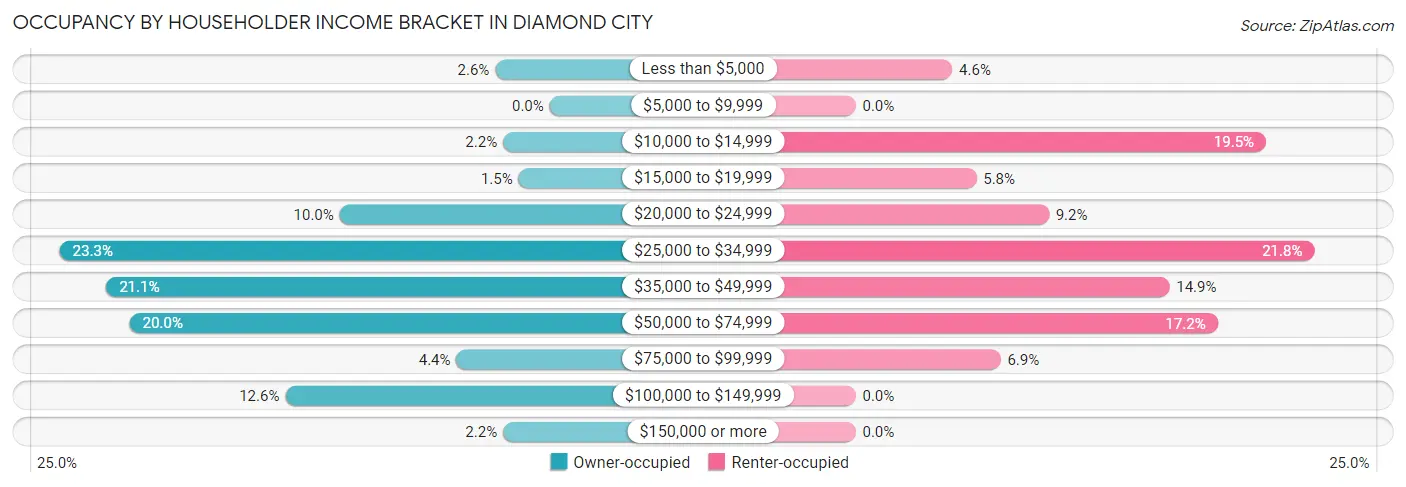
| Income Bracket | Owner-occupied | Renter-occupied |
| Less than $5,000 | 7 (2.6%) | 4 (4.6%) |
| $5,000 to $9,999 | 0 (0.0%) | 0 (0.0%) |
| $10,000 to $14,999 | 6 (2.2%) | 17 (19.5%) |
| $15,000 to $19,999 | 4 (1.5%) | 5 (5.8%) |
| $20,000 to $24,999 | 27 (10.0%) | 8 (9.2%) |
| $25,000 to $34,999 | 63 (23.3%) | 19 (21.8%) |
| $35,000 to $49,999 | 57 (21.1%) | 13 (14.9%) |
| $50,000 to $74,999 | 54 (20.0%) | 15 (17.2%) |
| $75,000 to $99,999 | 12 (4.4%) | 6 (6.9%) |
| $100,000 to $149,999 | 34 (12.6%) | 0 (0.0%) |
| $150,000 or more | 6 (2.2%) | 0 (0.0%) |
| Total | 270 (100.0%) | 87 (100.0%) |
Monthly Housing Cost Tiers in Diamond City
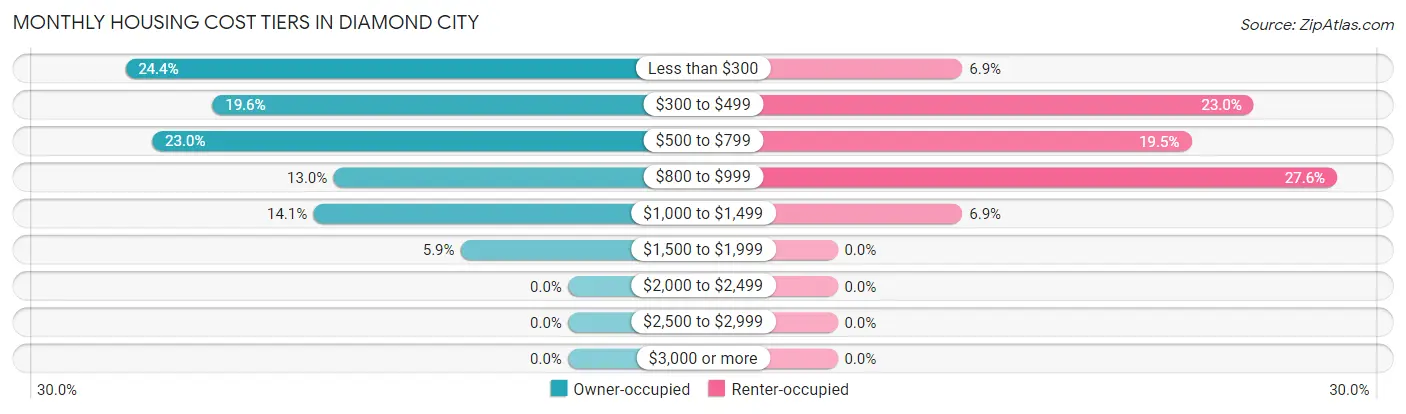
| Monthly Cost | Owner-occupied | Renter-occupied |
| Less than $300 | 66 (24.4%) | 6 (6.9%) |
| $300 to $499 | 53 (19.6%) | 20 (23.0%) |
| $500 to $799 | 62 (23.0%) | 17 (19.5%) |
| $800 to $999 | 35 (13.0%) | 24 (27.6%) |
| $1,000 to $1,499 | 38 (14.1%) | 6 (6.9%) |
| $1,500 to $1,999 | 16 (5.9%) | 0 (0.0%) |
| $2,000 to $2,499 | 0 (0.0%) | 0 (0.0%) |
| $2,500 to $2,999 | 0 (0.0%) | 0 (0.0%) |
| $3,000 or more | 0 (0.0%) | 0 (0.0%) |
| Total | 270 (100.0%) | 87 (100.0%) |
Physical Housing Characteristics in Diamond City
Housing Structures in Diamond City
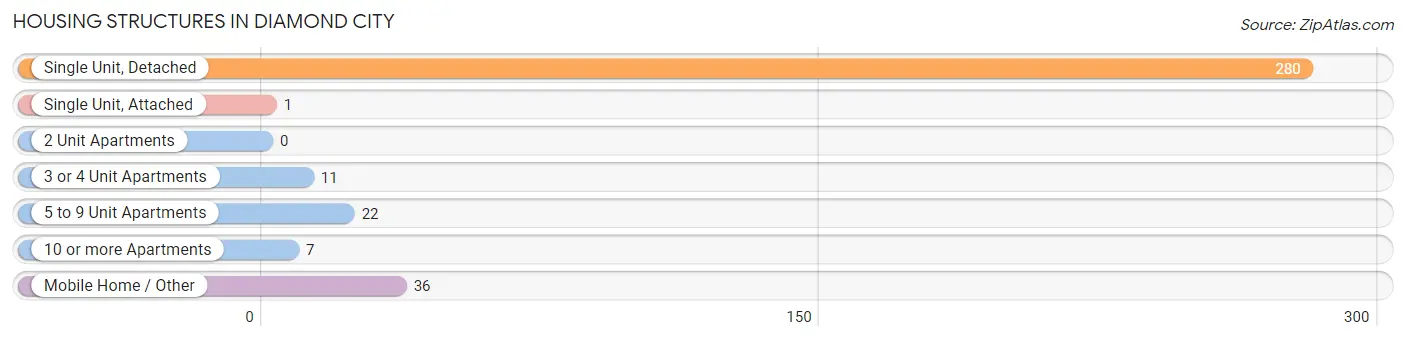
| Structure Type | # Housing Units | % Housing Units |
| Single Unit, Detached | 280 | 78.4% |
| Single Unit, Attached | 1 | 0.3% |
| 2 Unit Apartments | 0 | 0.0% |
| 3 or 4 Unit Apartments | 11 | 3.1% |
| 5 to 9 Unit Apartments | 22 | 6.2% |
| 10 or more Apartments | 7 | 2.0% |
| Mobile Home / Other | 36 | 10.1% |
| Total | 357 | 100.0% |
Housing Structures by Occupancy in Diamond City
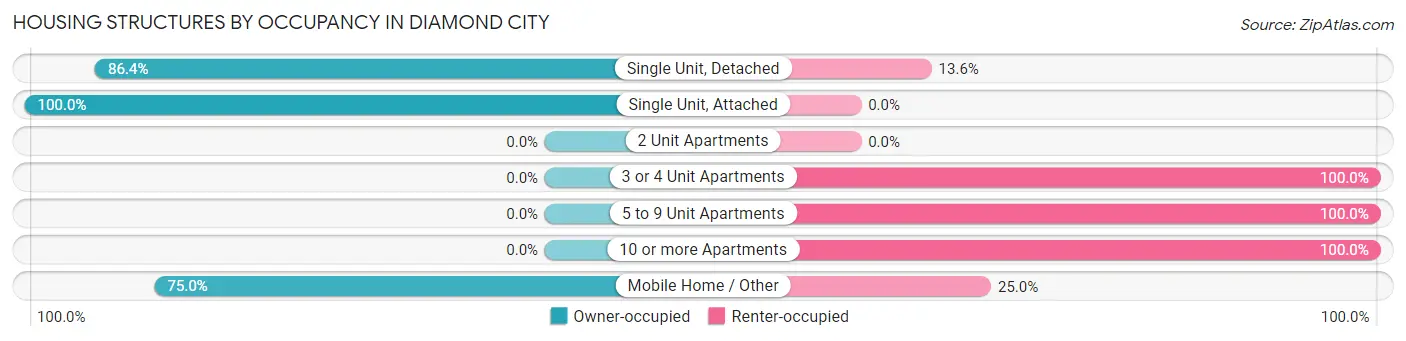
| Structure Type | Owner-occupied | Renter-occupied |
| Single Unit, Detached | 242 (86.4%) | 38 (13.6%) |
| Single Unit, Attached | 1 (100.0%) | 0 (0.0%) |
| 2 Unit Apartments | 0 (0.0%) | 0 (0.0%) |
| 3 or 4 Unit Apartments | 0 (0.0%) | 11 (100.0%) |
| 5 to 9 Unit Apartments | 0 (0.0%) | 22 (100.0%) |
| 10 or more Apartments | 0 (0.0%) | 7 (100.0%) |
| Mobile Home / Other | 27 (75.0%) | 9 (25.0%) |
| Total | 270 (75.6%) | 87 (24.4%) |
Housing Structures by Number of Rooms in Diamond City
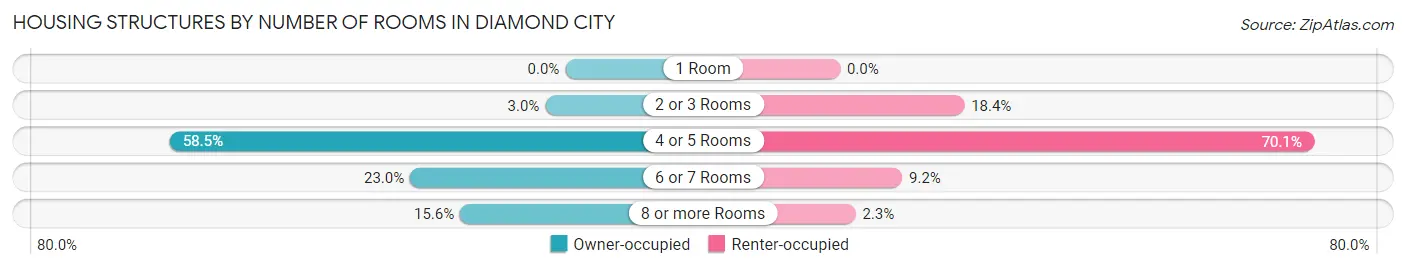
| Number of Rooms | Owner-occupied | Renter-occupied |
| 1 Room | 0 (0.0%) | 0 (0.0%) |
| 2 or 3 Rooms | 8 (3.0%) | 16 (18.4%) |
| 4 or 5 Rooms | 158 (58.5%) | 61 (70.1%) |
| 6 or 7 Rooms | 62 (23.0%) | 8 (9.2%) |
| 8 or more Rooms | 42 (15.6%) | 2 (2.3%) |
| Total | 270 (100.0%) | 87 (100.0%) |
Housing Structure by Heating Type in Diamond City
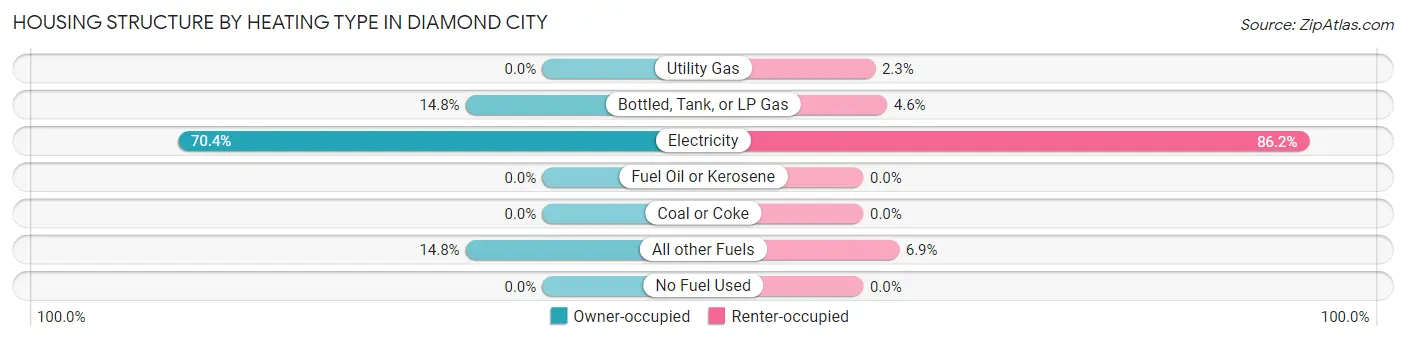
| Heating Type | Owner-occupied | Renter-occupied |
| Utility Gas | 0 (0.0%) | 2 (2.3%) |
| Bottled, Tank, or LP Gas | 40 (14.8%) | 4 (4.6%) |
| Electricity | 190 (70.4%) | 75 (86.2%) |
| Fuel Oil or Kerosene | 0 (0.0%) | 0 (0.0%) |
| Coal or Coke | 0 (0.0%) | 0 (0.0%) |
| All other Fuels | 40 (14.8%) | 6 (6.9%) |
| No Fuel Used | 0 (0.0%) | 0 (0.0%) |
| Total | 270 (100.0%) | 87 (100.0%) |
Household Vehicle Usage in Diamond City
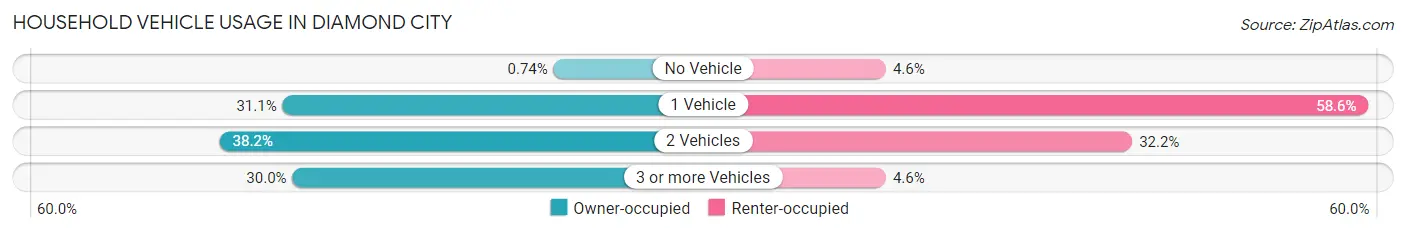
| Vehicles per Household | Owner-occupied | Renter-occupied |
| No Vehicle | 2 (0.7%) | 4 (4.6%) |
| 1 Vehicle | 84 (31.1%) | 51 (58.6%) |
| 2 Vehicles | 103 (38.2%) | 28 (32.2%) |
| 3 or more Vehicles | 81 (30.0%) | 4 (4.6%) |
| Total | 270 (100.0%) | 87 (100.0%) |
Real Estate & Mortgages in Diamond City
Real Estate and Mortgage Overview in Diamond City
| Characteristic | Without Mortgage | With Mortgage |
| Housing Units | 163 | 107 |
| Median Property Value | $95,500 | $93,400 |
| Median Household Income | $34,625 | $6 |
| Monthly Housing Costs | $411 | $0 |
| Real Estate Taxes | $592 | $8 |
Property Value by Mortgage Status in Diamond City
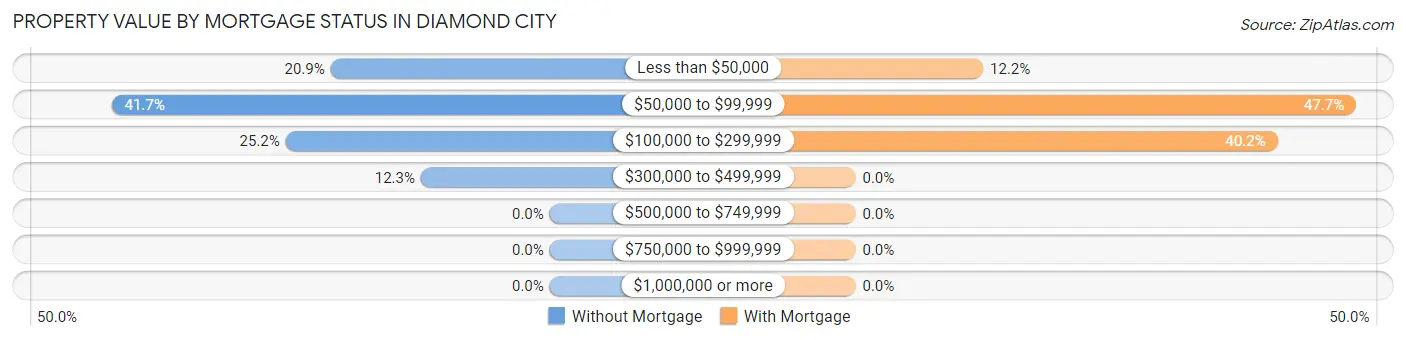
| Property Value | Without Mortgage | With Mortgage |
| Less than $50,000 | 34 (20.9%) | 13 (12.1%) |
| $50,000 to $99,999 | 68 (41.7%) | 51 (47.7%) |
| $100,000 to $299,999 | 41 (25.2%) | 43 (40.2%) |
| $300,000 to $499,999 | 20 (12.3%) | 0 (0.0%) |
| $500,000 to $749,999 | 0 (0.0%) | 0 (0.0%) |
| $750,000 to $999,999 | 0 (0.0%) | 0 (0.0%) |
| $1,000,000 or more | 0 (0.0%) | 0 (0.0%) |
| Total | 163 (100.0%) | 107 (100.0%) |
Household Income by Mortgage Status in Diamond City
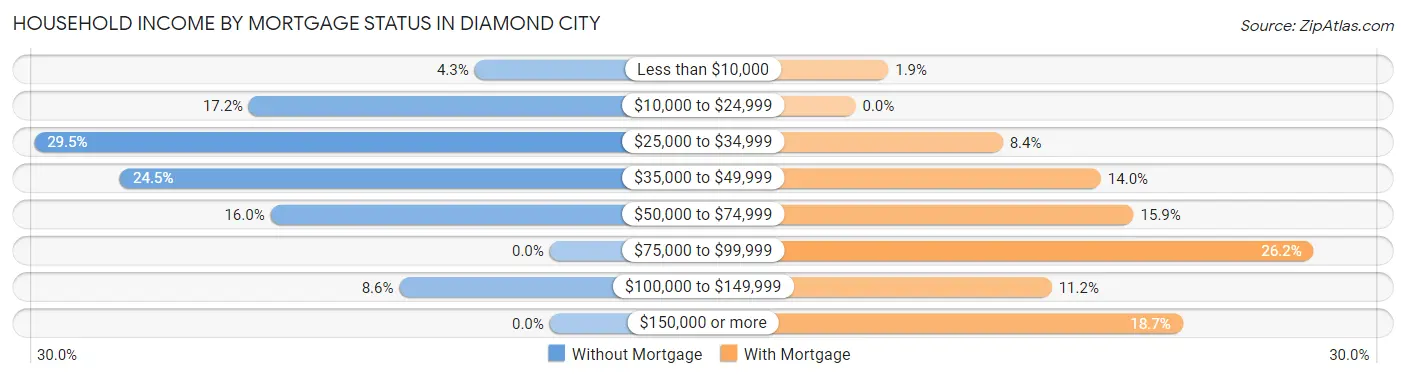
| Household Income | Without Mortgage | With Mortgage |
| Less than $10,000 | 7 (4.3%) | 2 (1.9%) |
| $10,000 to $24,999 | 28 (17.2%) | 0 (0.0%) |
| $25,000 to $34,999 | 48 (29.4%) | 9 (8.4%) |
| $35,000 to $49,999 | 40 (24.5%) | 15 (14.0%) |
| $50,000 to $74,999 | 26 (16.0%) | 17 (15.9%) |
| $75,000 to $99,999 | 0 (0.0%) | 28 (26.2%) |
| $100,000 to $149,999 | 14 (8.6%) | 12 (11.2%) |
| $150,000 or more | 0 (0.0%) | 20 (18.7%) |
| Total | 163 (100.0%) | 107 (100.0%) |
Property Value to Household Income Ratio in Diamond City
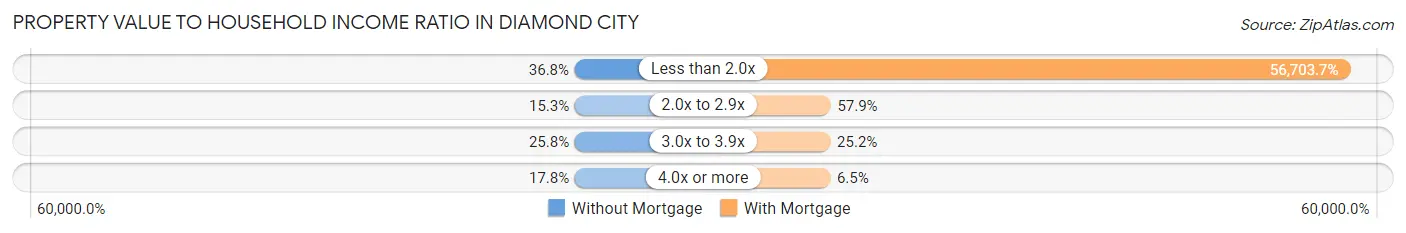
| Value-to-Income Ratio | Without Mortgage | With Mortgage |
| Less than 2.0x | 60 (36.8%) | 60,673 (56,703.7%) |
| 2.0x to 2.9x | 25 (15.3%) | 62 (57.9%) |
| 3.0x to 3.9x | 42 (25.8%) | 27 (25.2%) |
| 4.0x or more | 29 (17.8%) | 7 (6.5%) |
| Total | 163 (100.0%) | 107 (100.0%) |
Real Estate Taxes by Mortgage Status in Diamond City
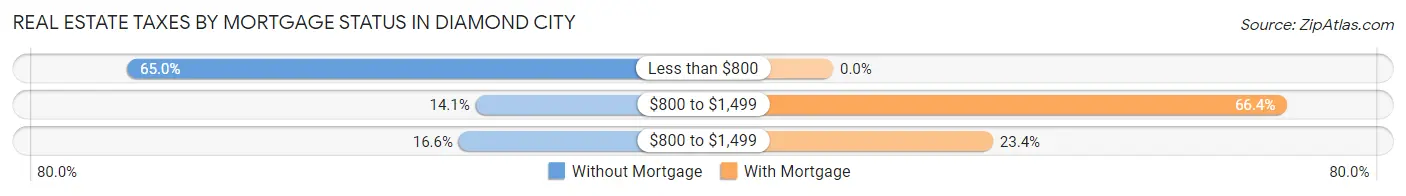
| Property Taxes | Without Mortgage | With Mortgage |
| Less than $800 | 106 (65.0%) | 0 (0.0%) |
| $800 to $1,499 | 23 (14.1%) | 71 (66.4%) |
| $800 to $1,499 | 27 (16.6%) | 25 (23.4%) |
| Total | 163 (100.0%) | 107 (100.0%) |
Health & Disability in Diamond City
Health Insurance Coverage by Age in Diamond City
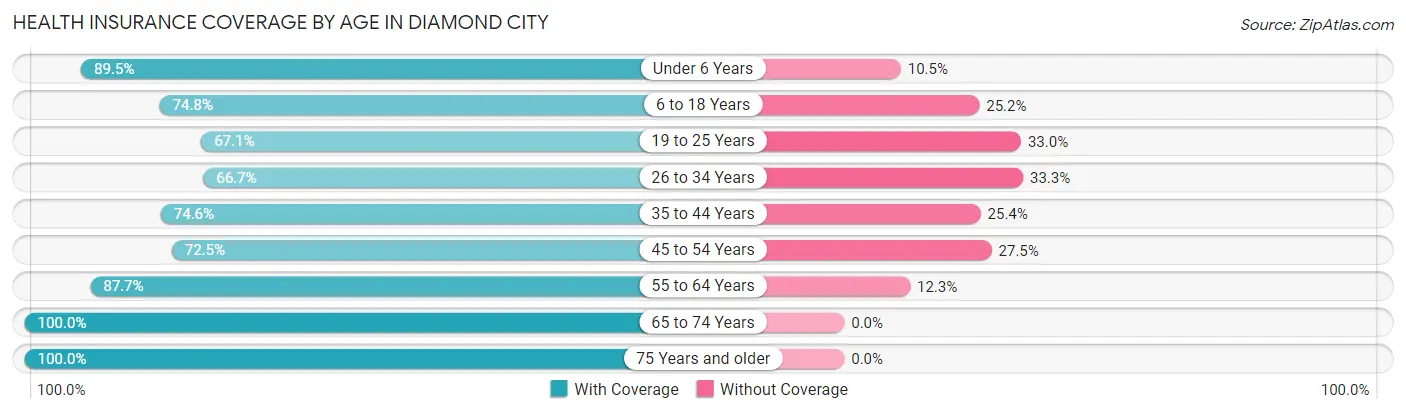
| Age Bracket | With Coverage | Without Coverage |
| Under 6 Years | 51 (89.5%) | 6 (10.5%) |
| 6 to 18 Years | 104 (74.8%) | 35 (25.2%) |
| 19 to 25 Years | 59 (67.0%) | 29 (33.0%) |
| 26 to 34 Years | 40 (66.7%) | 20 (33.3%) |
| 35 to 44 Years | 88 (74.6%) | 30 (25.4%) |
| 45 to 54 Years | 66 (72.5%) | 25 (27.5%) |
| 55 to 64 Years | 93 (87.7%) | 13 (12.3%) |
| 65 to 74 Years | 119 (100.0%) | 0 (0.0%) |
| 75 Years and older | 110 (100.0%) | 0 (0.0%) |
| Total | 730 (82.2%) | 158 (17.8%) |
Health Insurance Coverage by Citizenship Status in Diamond City
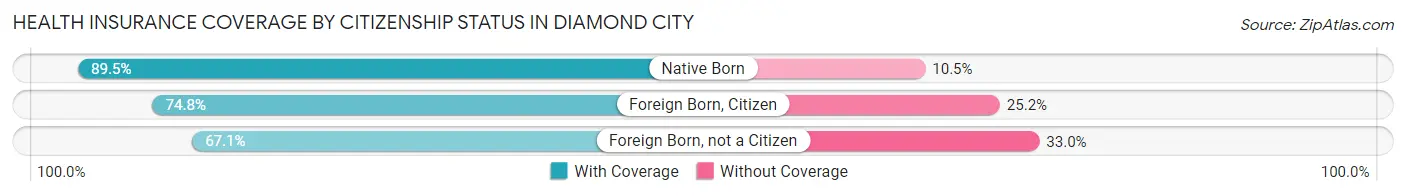
| Citizenship Status | With Coverage | Without Coverage |
| Native Born | 51 (89.5%) | 6 (10.5%) |
| Foreign Born, Citizen | 104 (74.8%) | 35 (25.2%) |
| Foreign Born, not a Citizen | 59 (67.0%) | 29 (33.0%) |
Health Insurance Coverage by Household Income in Diamond City
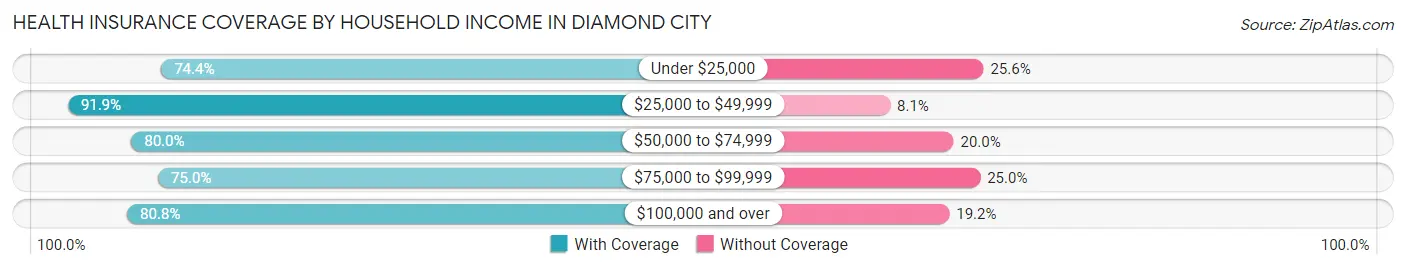
| Household Income | With Coverage | Without Coverage |
| Under $25,000 | 122 (74.4%) | 42 (25.6%) |
| $25,000 to $49,999 | 238 (91.9%) | 21 (8.1%) |
| $50,000 to $74,999 | 224 (80.0%) | 56 (20.0%) |
| $75,000 to $99,999 | 45 (75.0%) | 15 (25.0%) |
| $100,000 and over | 101 (80.8%) | 24 (19.2%) |
Public vs Private Health Insurance Coverage by Age in Diamond City
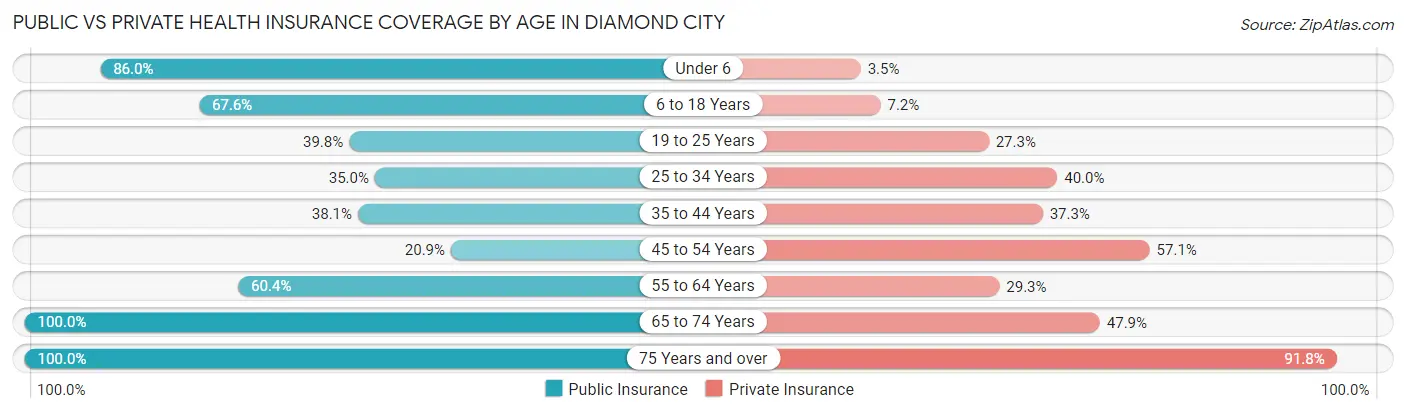
| Age Bracket | Public Insurance | Private Insurance |
| Under 6 | 49 (86.0%) | 2 (3.5%) |
| 6 to 18 Years | 94 (67.6%) | 10 (7.2%) |
| 19 to 25 Years | 35 (39.8%) | 24 (27.3%) |
| 25 to 34 Years | 21 (35.0%) | 24 (40.0%) |
| 35 to 44 Years | 45 (38.1%) | 44 (37.3%) |
| 45 to 54 Years | 19 (20.9%) | 52 (57.1%) |
| 55 to 64 Years | 64 (60.4%) | 31 (29.2%) |
| 65 to 74 Years | 119 (100.0%) | 57 (47.9%) |
| 75 Years and over | 110 (100.0%) | 101 (91.8%) |
| Total | 556 (62.6%) | 345 (38.9%) |
Disability Status by Sex by Age in Diamond City
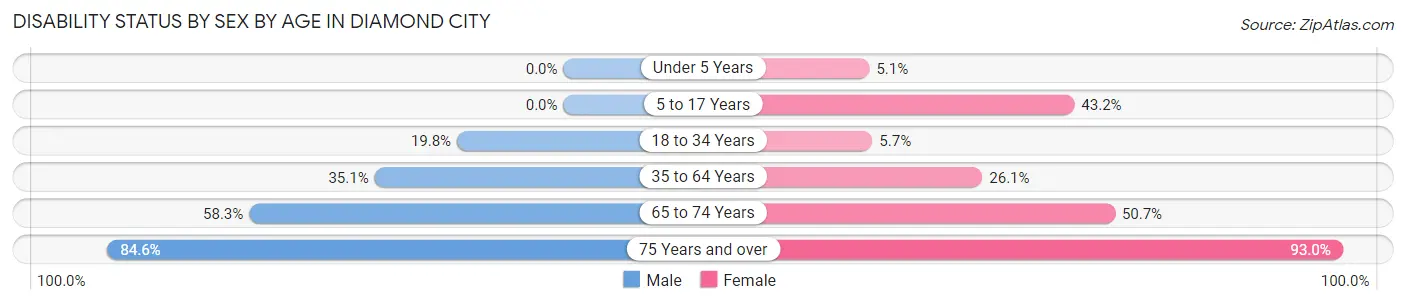
| Age Bracket | Male | Female |
| Under 5 Years | 0 (0.0%) | 2 (5.1%) |
| 5 to 17 Years | 0 (0.0%) | 38 (43.2%) |
| 18 to 34 Years | 16 (19.8%) | 5 (5.7%) |
| 35 to 64 Years | 54 (35.1%) | 42 (26.1%) |
| 65 to 74 Years | 28 (58.3%) | 36 (50.7%) |
| 75 Years and over | 33 (84.6%) | 66 (93.0%) |
Disability Class by Sex by Age in Diamond City
Disability Class: Hearing Difficulty
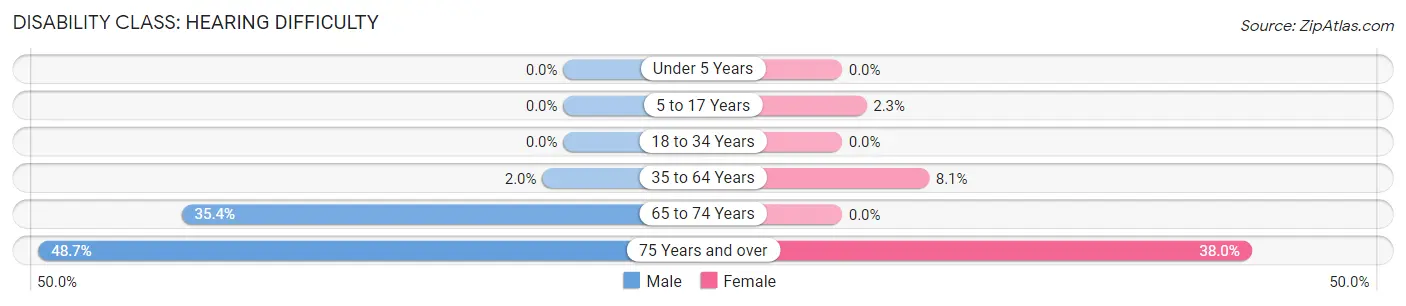
| Age Bracket | Male | Female |
| Under 5 Years | 0 (0.0%) | 0 (0.0%) |
| 5 to 17 Years | 0 (0.0%) | 2 (2.3%) |
| 18 to 34 Years | 0 (0.0%) | 0 (0.0%) |
| 35 to 64 Years | 3 (1.9%) | 13 (8.1%) |
| 65 to 74 Years | 17 (35.4%) | 0 (0.0%) |
| 75 Years and over | 19 (48.7%) | 27 (38.0%) |
Disability Class: Vision Difficulty
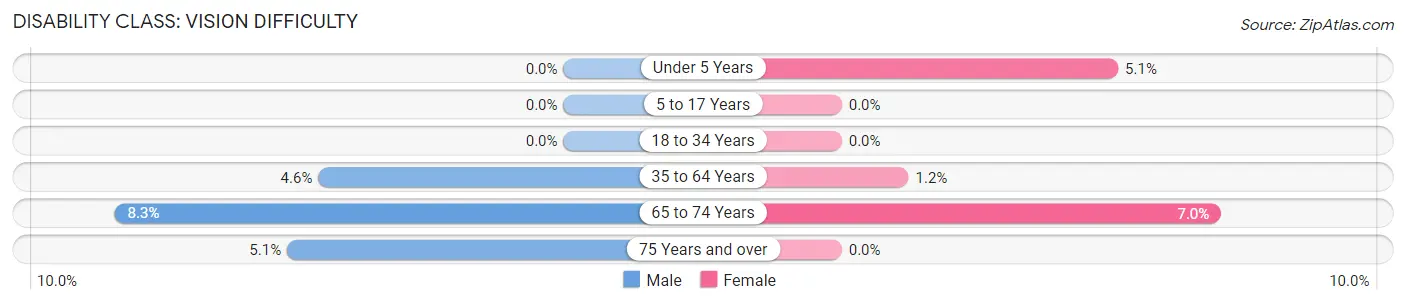
| Age Bracket | Male | Female |
| Under 5 Years | 0 (0.0%) | 2 (5.1%) |
| 5 to 17 Years | 0 (0.0%) | 0 (0.0%) |
| 18 to 34 Years | 0 (0.0%) | 0 (0.0%) |
| 35 to 64 Years | 7 (4.5%) | 2 (1.2%) |
| 65 to 74 Years | 4 (8.3%) | 5 (7.0%) |
| 75 Years and over | 2 (5.1%) | 0 (0.0%) |
Disability Class: Cognitive Difficulty
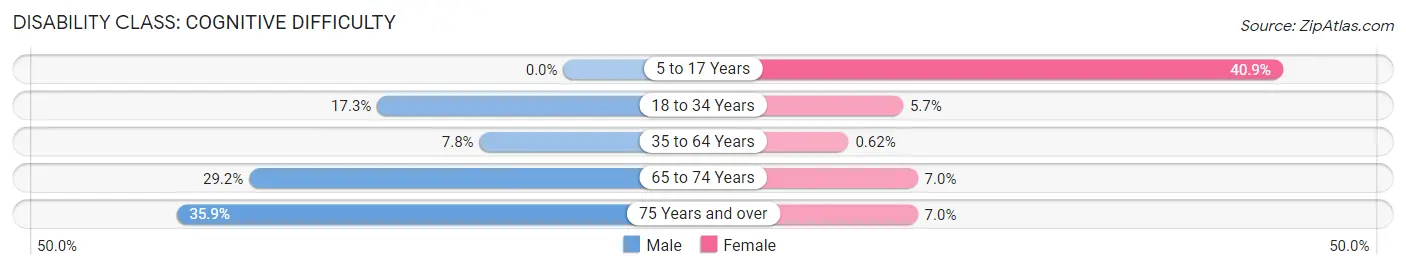
| Age Bracket | Male | Female |
| 5 to 17 Years | 0 (0.0%) | 36 (40.9%) |
| 18 to 34 Years | 14 (17.3%) | 5 (5.7%) |
| 35 to 64 Years | 12 (7.8%) | 1 (0.6%) |
| 65 to 74 Years | 14 (29.2%) | 5 (7.0%) |
| 75 Years and over | 14 (35.9%) | 5 (7.0%) |
Disability Class: Ambulatory Difficulty
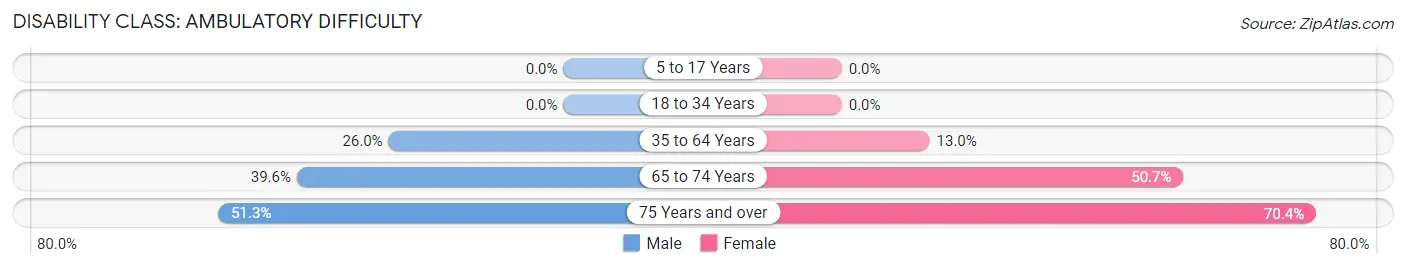
| Age Bracket | Male | Female |
| 5 to 17 Years | 0 (0.0%) | 0 (0.0%) |
| 18 to 34 Years | 0 (0.0%) | 0 (0.0%) |
| 35 to 64 Years | 40 (26.0%) | 21 (13.0%) |
| 65 to 74 Years | 19 (39.6%) | 36 (50.7%) |
| 75 Years and over | 20 (51.3%) | 50 (70.4%) |
Disability Class: Self-Care Difficulty
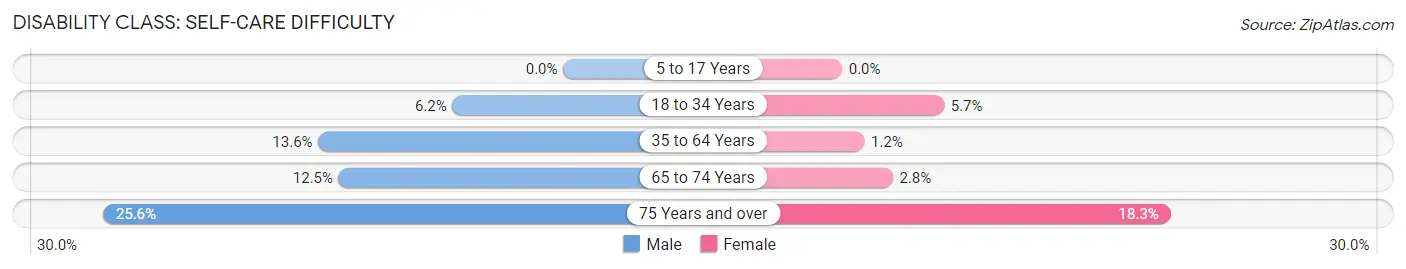
| Age Bracket | Male | Female |
| 5 to 17 Years | 0 (0.0%) | 0 (0.0%) |
| 18 to 34 Years | 5 (6.2%) | 5 (5.7%) |
| 35 to 64 Years | 21 (13.6%) | 2 (1.2%) |
| 65 to 74 Years | 6 (12.5%) | 2 (2.8%) |
| 75 Years and over | 10 (25.6%) | 13 (18.3%) |
Technology Access in Diamond City
Computing Device Access in Diamond City
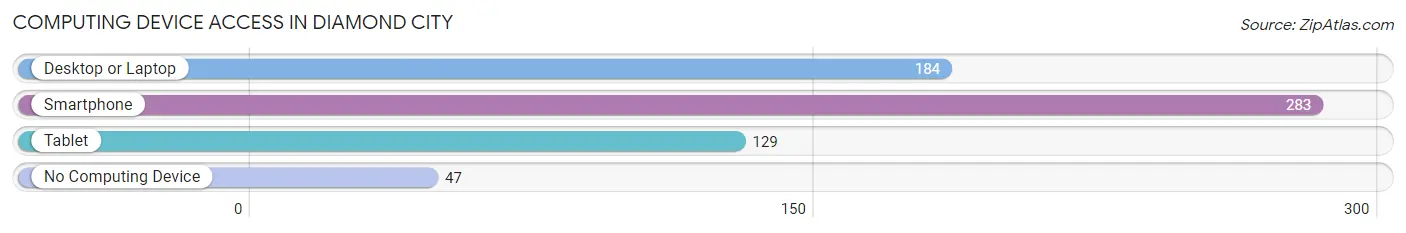
| Device Type | # Households | % Households |
| Desktop or Laptop | 184 | 51.5% |
| Smartphone | 283 | 79.3% |
| Tablet | 129 | 36.1% |
| No Computing Device | 47 | 13.2% |
| Total | 357 | 100.0% |
Internet Access in Diamond City
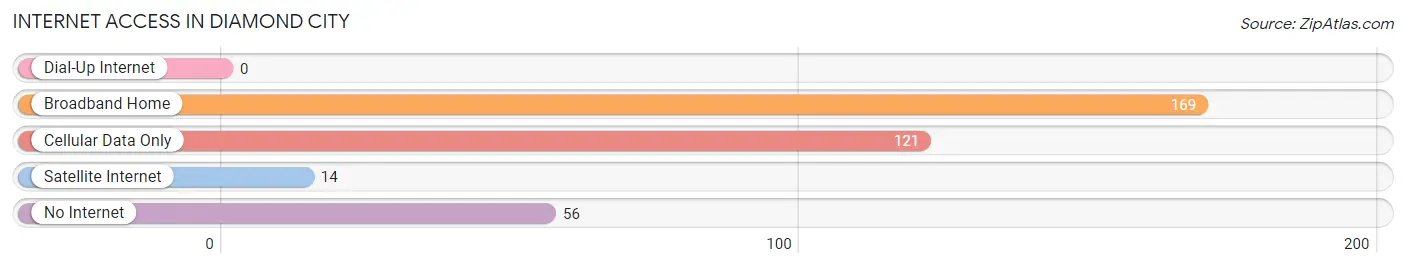
| Internet Type | # Households | % Households |
| Dial-Up Internet | 0 | 0.0% |
| Broadband Home | 169 | 47.3% |
| Cellular Data Only | 121 | 33.9% |
| Satellite Internet | 14 | 3.9% |
| No Internet | 56 | 15.7% |
| Total | 357 | 100.0% |
Diamond City Summary
City of Diamond City Arkansas
History
Diamond City, Arkansas is a small town located in the Ozark Mountains of Arkansas. It was founded in 1883 by a group of settlers who were looking for a place to settle and start a new life. The town was named after the nearby Diamond Mine, which was discovered in 1882. The mine was the first diamond mine in the United States and was the source of the town's name.
The town was originally a small farming community, but it soon grew into a bustling mining town. The town was home to a variety of businesses, including a hotel, a general store, a bank, a post office, and a school. The town also had a newspaper, the Diamond City News, which was published from 1883 to 1891.
The town was also home to a variety of churches, including the First Baptist Church, the Methodist Church, and the Presbyterian Church. The town also had a variety of social clubs, including the Diamond City Social Club, the Diamond City Literary Society, and the Diamond City Women's Club.
The town was also home to a variety of businesses, including a sawmill, a gristmill, a blacksmith shop, a livery stable, and a saloon. The town also had a variety of stores, including a general store, a drug store, a hardware store, and a furniture store.
The town was also home to a variety of industries, including a brickyard, a canning factory, a flour mill, a lumber mill, and a tannery. The town also had a variety of services, including a doctor, a dentist, a lawyer, and a barber.
The town was also home to a variety of recreational activities, including baseball, basketball, and tennis. The town also had a variety of cultural activities, including a theater, a library, and a museum.
The town was also home to a variety of organizations, including the Diamond City Chamber of Commerce, the Diamond City Historical Society, and the Diamond City Women's Club.
Geography
Diamond City is located in the Ozark Mountains of Arkansas. The town is situated on the banks of the White River, which is a tributary of the Arkansas River. The town is located in the foothills of the Ozark Mountains, which are part of the Appalachian Mountains.
The town is located in the Ozark-St. Francis National Forest, which is a protected area of the United States. The town is located in the Ozark Plateau, which is a region of rolling hills and valleys. The town is located in the Arkansas River Valley, which is a region of flatlands and rolling hills.
The town is located in the Arkansas Delta, which is a region of flatlands and swamps. The town is located in the Arkansas River Valley, which is a region of flatlands and rolling hills.
Economy
The economy of Diamond City is largely based on agriculture and tourism. The town is home to a variety of farms, including cattle, poultry, and hog farms. The town is also home to a variety of tourist attractions, including the Diamond Mine, the Diamond City Museum, and the Diamond City Historical Society.
The town is also home to a variety of businesses, including a general store, a hardware store, a drug store, a furniture store, a sawmill, a gristmill, a blacksmith shop, a livery stable, and a saloon. The town is also home to a variety of industries, including a brickyard, a canning factory, a flour mill, a lumber mill, and a tannery.
Demographics
As of the 2010 census, the population of Diamond City was 1,845. The population is predominantly white, with a small percentage of African Americans and Hispanics. The median age of the population is 44.7 years. The median household income is $37,941.
The town is home to a variety of religious denominations, including Baptist, Methodist, Presbyterian, and Catholic. The town is also home to a variety of educational institutions, including a public school, a private school, and a community college.
Conclusion
Diamond City, Arkansas is a small town located in the Ozark Mountains of Arkansas. The town was founded in 1883 and was named after the nearby Diamond Mine. The town is home to a variety of businesses, industries, and services. The town is also home to a variety of recreational activities, cultural activities, and organizations. The town is predominantly white, with a small percentage of African Americans and Hispanics. The town is home to a variety of religious denominations and educational institutions. The town has a median household income of $37,941.
Common Questions
What is Per Capita Income in Diamond City?
Per Capita income in Diamond City is $21,480.
What is the Median Family Income in Diamond City?
Median Family Income in Diamond City is $45,875.
What is the Median Household income in Diamond City?
Median Household Income in Diamond City is $39,453.
What is Income or Wage Gap in Diamond City?
Income or Wage Gap in Diamond City is 36.4%.
Women in Diamond City earn 63.6 cents for every dollar earned by a man.
What is Inequality or Gini Index in Diamond City?
Inequality or Gini Index in Diamond City is 0.38.
What is the Total Population of Diamond City?
Total Population of Diamond City is 888.
What is the Total Male Population of Diamond City?
Total Male Population of Diamond City is 370.
What is the Total Female Population of Diamond City?
Total Female Population of Diamond City is 518.
What is the Ratio of Males per 100 Females in Diamond City?
There are 71.43 Males per 100 Females in Diamond City.
What is the Ratio of Females per 100 Males in Diamond City?
There are 140.00 Females per 100 Males in Diamond City.
What is the Median Population Age in Diamond City?
Median Population Age in Diamond City is 43.8 Years.
What is the Average Family Size in Diamond City
Average Family Size in Diamond City is 3.1 People.
What is the Average Household Size in Diamond City
Average Household Size in Diamond City is 2.5 People.
How Large is the Labor Force in Diamond City?
There are 378 People in the Labor Forcein in Diamond City.
What is the Percentage of People in the Labor Force in Diamond City?
51.1% of People are in the Labor Force in Diamond City.
What is the Unemployment Rate in Diamond City?
Unemployment Rate in Diamond City is 1.3%.