Ashdown, AR Map & Demographics
Ashdown Map
Ashdown Overview
$26,596
PER CAPITA INCOME
$80,186
AVG FAMILY INCOME
$60,909
AVG HOUSEHOLD INCOME
8.5%
WAGE / INCOME GAP [ % ]
91.5¢/ $1
WAGE / INCOME GAP [ $ ]
0.40
INEQUALITY / GINI INDEX
4,264
TOTAL POPULATION
1,859
MALE POPULATION
2,405
FEMALE POPULATION
77.30
MALES / 100 FEMALES
129.37
FEMALES / 100 MALES
42.1
MEDIAN AGE
3.1
AVG FAMILY SIZE
2.6
AVG HOUSEHOLD SIZE
1,970
LABOR FORCE [ PEOPLE ]
57.8%
PERCENT IN LABOR FORCE
10.5%
UNEMPLOYMENT RATE
Ashdown Zip Codes
Ashdown Area Codes
Income in Ashdown
Income Overview in Ashdown
Per Capita Income in Ashdown is $26,596, while median incomes of families and households are $80,186 and $60,909 respectively.
| Characteristic | Number | Measure |
| Per Capita Income | 4,264 | $26,596 |
| Median Family Income | 1,161 | $80,186 |
| Mean Family Income | 1,161 | $79,998 |
| Median Household Income | 1,596 | $60,909 |
| Mean Household Income | 1,596 | $68,809 |
| Income Deficit | 1,161 | $0 |
| Wage / Income Gap (%) | 4,264 | 8.46% |
| Wage / Income Gap ($) | 4,264 | 91.54¢ per $1 |
| Gini / Inequality Index | 4,264 | 0.40 |
Earnings by Sex in Ashdown
Average Earnings in Ashdown are $34,784, $32,708 for men and $35,732 for women, a difference of 8.5%.
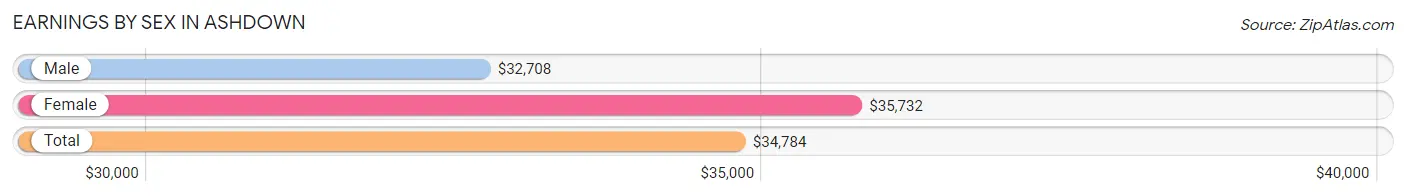
| Sex | Number | Average Earnings |
| Male | 905 (46.9%) | $32,708 |
| Female | 1,026 (53.1%) | $35,732 |
| Total | 1,931 (100.0%) | $34,784 |
Earnings by Sex by Income Bracket in Ashdown
The most common earnings brackets in Ashdown are $100,000+ for men (213 | 23.5%) and $35,000 to $39,999 for women (186 | 18.1%).
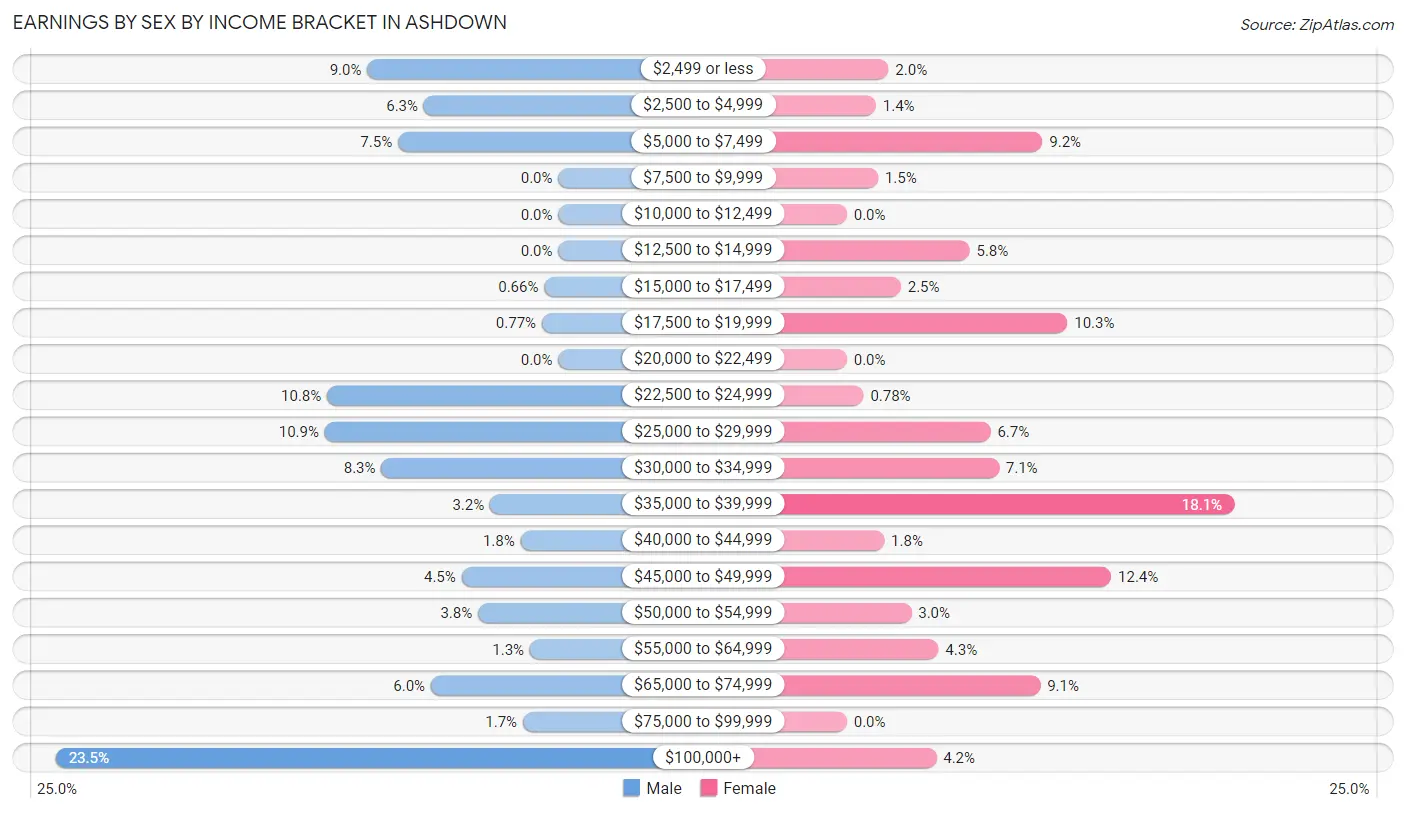
| Income | Male | Female |
| $2,499 or less | 81 (8.9%) | 20 (1.9%) |
| $2,500 to $4,999 | 57 (6.3%) | 14 (1.4%) |
| $5,000 to $7,499 | 68 (7.5%) | 94 (9.2%) |
| $7,500 to $9,999 | 0 (0.0%) | 15 (1.5%) |
| $10,000 to $12,499 | 0 (0.0%) | 0 (0.0%) |
| $12,500 to $14,999 | 0 (0.0%) | 59 (5.8%) |
| $15,000 to $17,499 | 6 (0.7%) | 26 (2.5%) |
| $17,500 to $19,999 | 7 (0.8%) | 106 (10.3%) |
| $20,000 to $22,499 | 0 (0.0%) | 0 (0.0%) |
| $22,500 to $24,999 | 98 (10.8%) | 8 (0.8%) |
| $25,000 to $29,999 | 99 (10.9%) | 69 (6.7%) |
| $30,000 to $34,999 | 75 (8.3%) | 73 (7.1%) |
| $35,000 to $39,999 | 29 (3.2%) | 186 (18.1%) |
| $40,000 to $44,999 | 16 (1.8%) | 18 (1.8%) |
| $45,000 to $49,999 | 41 (4.5%) | 127 (12.4%) |
| $50,000 to $54,999 | 34 (3.8%) | 31 (3.0%) |
| $55,000 to $64,999 | 12 (1.3%) | 44 (4.3%) |
| $65,000 to $74,999 | 54 (6.0%) | 93 (9.1%) |
| $75,000 to $99,999 | 15 (1.7%) | 0 (0.0%) |
| $100,000+ | 213 (23.5%) | 43 (4.2%) |
| Total | 905 (100.0%) | 1,026 (100.0%) |
Earnings by Sex by Educational Attainment in Ashdown
Average earnings in Ashdown are $48,110 for men and $37,787 for women, a difference of 21.5%. Men with an educational attainment of graduate degree enjoy the highest average annual earnings of $74,375, while those with high school diploma education earn the least with $32,917. Women with an educational attainment of graduate degree earn the most with the average annual earnings of $53,661, while those with high school diploma education have the smallest earnings of $29,840.
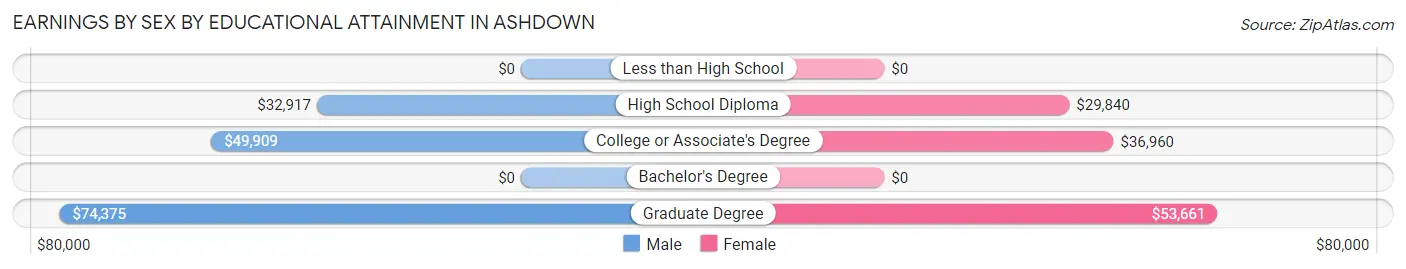
| Educational Attainment | Male Income | Female Income |
| Less than High School | - | - |
| High School Diploma | $32,917 | $29,840 |
| College or Associate's Degree | $49,909 | $36,960 |
| Bachelor's Degree | - | - |
| Graduate Degree | $74,375 | $53,661 |
| Total | $48,110 | $37,787 |
Family Income in Ashdown
Family Income Brackets in Ashdown
According to the Ashdown family income data, there are 353 families falling into the $75,000 to $99,999 income range, which is the most common income bracket and makes up 30.4% of all families.
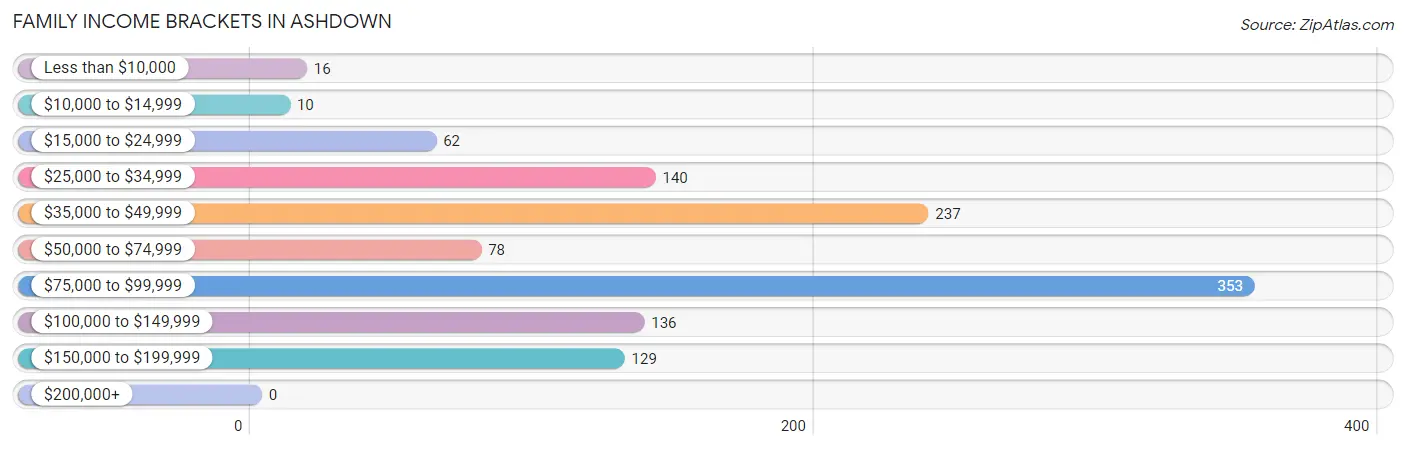
| Income Bracket | # Families | % Families |
| Less than $10,000 | 16 | 1.4% |
| $10,000 to $14,999 | 10 | 0.9% |
| $15,000 to $24,999 | 62 | 5.3% |
| $25,000 to $34,999 | 140 | 12.1% |
| $35,000 to $49,999 | 237 | 20.4% |
| $50,000 to $74,999 | 78 | 6.7% |
| $75,000 to $99,999 | 353 | 30.4% |
| $100,000 to $149,999 | 136 | 11.7% |
| $150,000 to $199,999 | 129 | 11.1% |
| $200,000+ | 0 | 0.0% |
Family Income by Famaliy Size in Ashdown
4-person families (260 | 22.4%) account for the highest median family income in Ashdown with $99,787 per family, while 2-person families (595 | 51.2%) have the highest median income of $35,860 per family member.
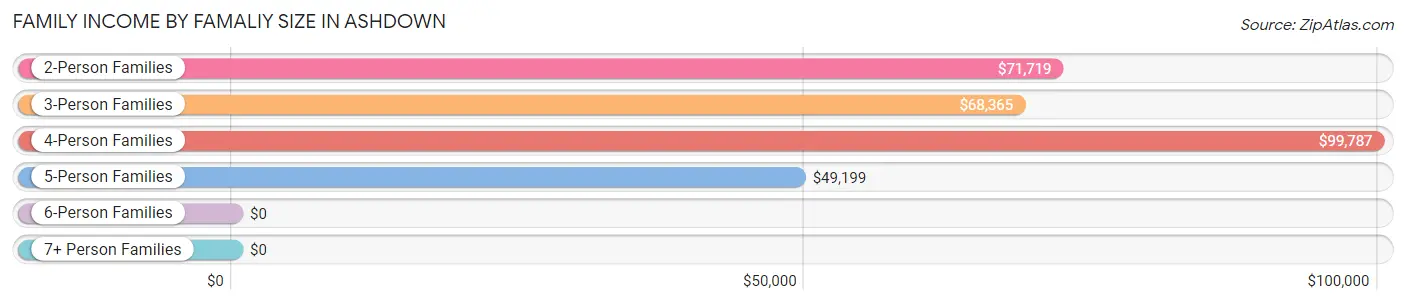
| Income Bracket | # Families | Median Income |
| 2-Person Families | 595 (51.2%) | $71,719 |
| 3-Person Families | 216 (18.6%) | $68,365 |
| 4-Person Families | 260 (22.4%) | $99,787 |
| 5-Person Families | 53 (4.6%) | $49,199 |
| 6-Person Families | 37 (3.2%) | $0 |
| 7+ Person Families | 0 (0.0%) | $0 |
| Total | 1,161 (100.0%) | $80,186 |
Family Income by Number of Earners in Ashdown
The median family income in Ashdown is $80,186, with families comprising 3+ earners (194) having the highest median family income of $143,587, while families with no earners (237) have the lowest median family income of $28,865, accounting for 16.7% and 20.4% of families, respectively.
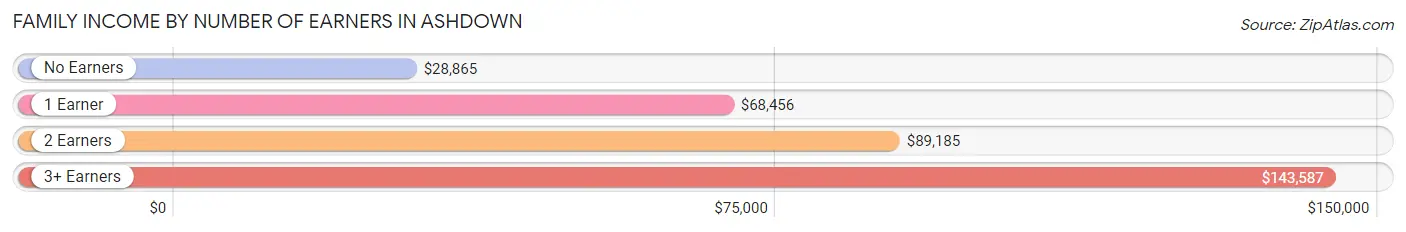
| Number of Earners | # Families | Median Income |
| No Earners | 237 (20.4%) | $28,865 |
| 1 Earner | 431 (37.1%) | $68,456 |
| 2 Earners | 299 (25.8%) | $89,185 |
| 3+ Earners | 194 (16.7%) | $143,587 |
| Total | 1,161 (100.0%) | $80,186 |
Household Income in Ashdown
Household Income Brackets in Ashdown
With 393 households falling in the category, the $75,000 to $99,999 income range is the most frequent in Ashdown, accounting for 24.6% of all households. In contrast, only 3 households (0.2%) fall into the $200,000+ income bracket, making it the least populous group.
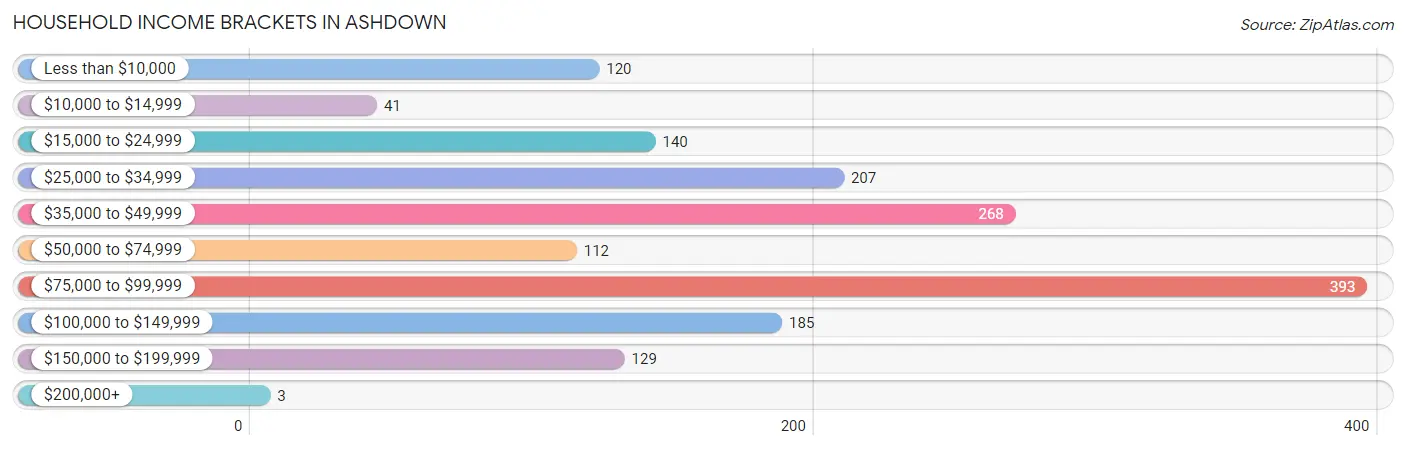
| Income Bracket | # Households | % Households |
| Less than $10,000 | 120 | 7.5% |
| $10,000 to $14,999 | 41 | 2.6% |
| $15,000 to $24,999 | 140 | 8.8% |
| $25,000 to $34,999 | 207 | 13.0% |
| $35,000 to $49,999 | 268 | 16.8% |
| $50,000 to $74,999 | 112 | 7.0% |
| $75,000 to $99,999 | 393 | 24.6% |
| $100,000 to $149,999 | 185 | 11.6% |
| $150,000 to $199,999 | 129 | 8.1% |
| $200,000+ | 3 | 0.2% |
Household Income by Householder Age in Ashdown
The median household income in Ashdown is $60,909, with the highest median household income of $81,214 found in the 25 to 44 years age bracket for the primary householder. A total of 480 households (30.1%) fall into this category. Meanwhile, the 15 to 24 years age bracket for the primary householder has the lowest median household income of $0, with 6 households (0.4%) in this group.
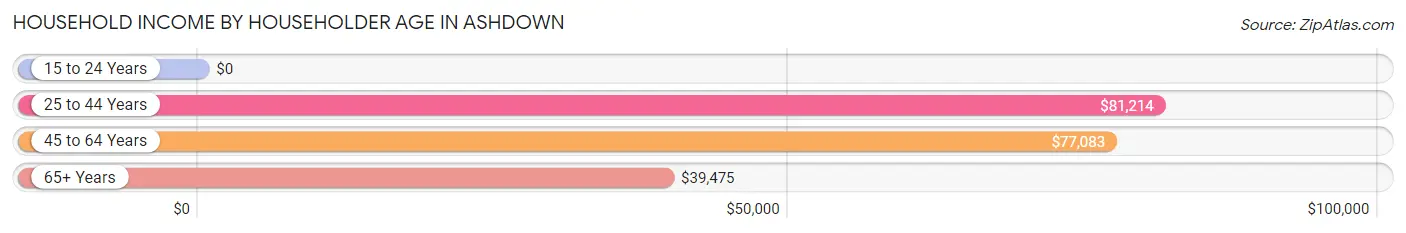
| Income Bracket | # Households | Median Income |
| 15 to 24 Years | 6 (0.4%) | $0 |
| 25 to 44 Years | 480 (30.1%) | $81,214 |
| 45 to 64 Years | 621 (38.9%) | $77,083 |
| 65+ Years | 489 (30.6%) | $39,475 |
| Total | 1,596 (100.0%) | $60,909 |
Poverty in Ashdown
Income Below Poverty by Sex and Age in Ashdown
With 6.8% poverty level for males and 21.2% for females among the residents of Ashdown, 12 to 14 year old males and under 5 year old females are the most vulnerable to poverty, with 14 males (14.7%) and 104 females (66.2%) in their respective age groups living below the poverty level.
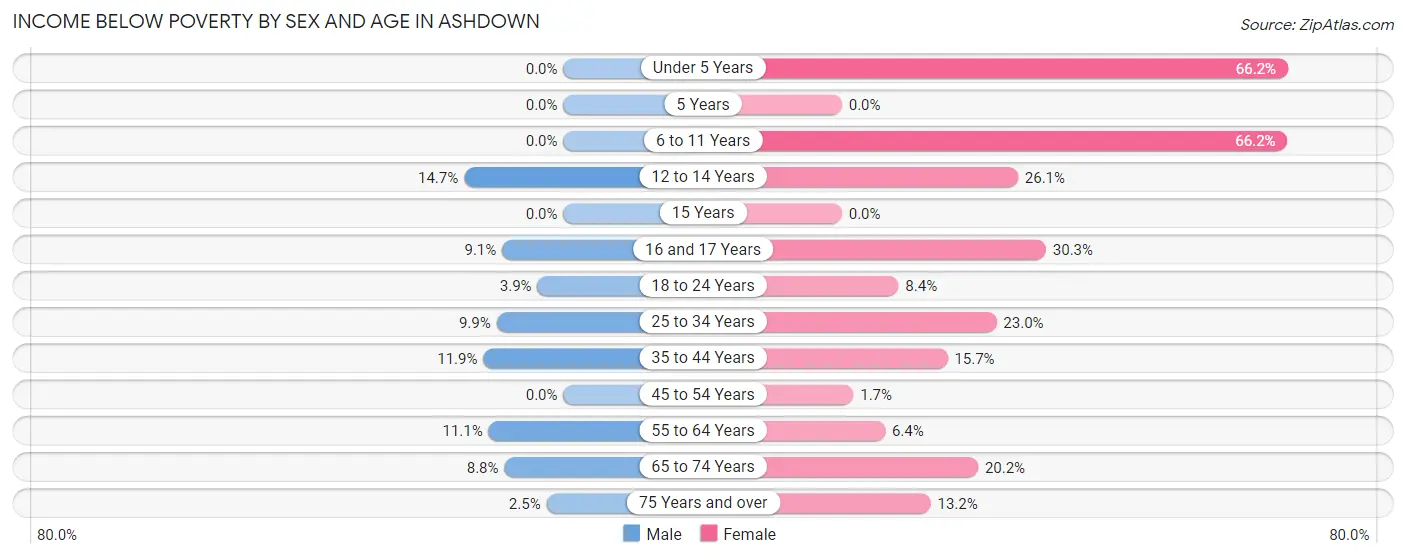
| Age Bracket | Male | Female |
| Under 5 Years | 0 (0.0%) | 104 (66.2%) |
| 5 Years | 0 (0.0%) | 0 (0.0%) |
| 6 to 11 Years | 0 (0.0%) | 133 (66.2%) |
| 12 to 14 Years | 14 (14.7%) | 23 (26.1%) |
| 15 Years | 0 (0.0%) | 0 (0.0%) |
| 16 and 17 Years | 9 (9.1%) | 10 (30.3%) |
| 18 to 24 Years | 7 (3.8%) | 18 (8.4%) |
| 25 to 34 Years | 26 (9.9%) | 45 (23.0%) |
| 35 to 44 Years | 22 (11.9%) | 51 (15.7%) |
| 45 to 54 Years | 0 (0.0%) | 4 (1.7%) |
| 55 to 64 Years | 29 (11.1%) | 22 (6.4%) |
| 65 to 74 Years | 12 (8.8%) | 55 (20.2%) |
| 75 Years and over | 2 (2.5%) | 29 (13.2%) |
| Total | 121 (6.8%) | 494 (21.2%) |
Income Above Poverty by Sex and Age in Ashdown
According to the poverty statistics in Ashdown, males aged under 5 years and females aged 5 years are the age groups that are most secure financially, with 100.0% of males and 100.0% of females in these age groups living above the poverty line.
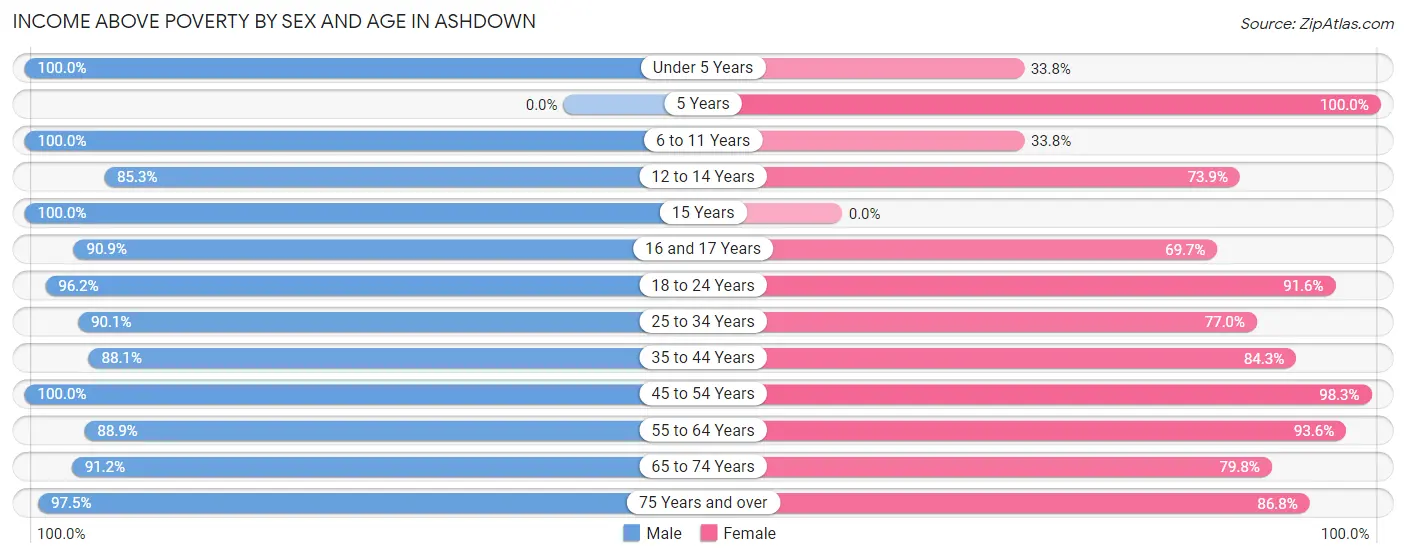
| Age Bracket | Male | Female |
| Under 5 Years | 20 (100.0%) | 53 (33.8%) |
| 5 Years | 0 (0.0%) | 43 (100.0%) |
| 6 to 11 Years | 77 (100.0%) | 68 (33.8%) |
| 12 to 14 Years | 81 (85.3%) | 65 (73.9%) |
| 15 Years | 174 (100.0%) | 0 (0.0%) |
| 16 and 17 Years | 90 (90.9%) | 23 (69.7%) |
| 18 to 24 Years | 175 (96.2%) | 196 (91.6%) |
| 25 to 34 Years | 236 (90.1%) | 151 (77.0%) |
| 35 to 44 Years | 163 (88.1%) | 274 (84.3%) |
| 45 to 54 Years | 208 (100.0%) | 230 (98.3%) |
| 55 to 64 Years | 232 (88.9%) | 321 (93.6%) |
| 65 to 74 Years | 125 (91.2%) | 217 (79.8%) |
| 75 Years and over | 78 (97.5%) | 191 (86.8%) |
| Total | 1,659 (93.2%) | 1,832 (78.8%) |
Income Below Poverty Among Married-Couple Families in Ashdown
The poverty statistics for married-couple families in Ashdown show that 0.7% or 5 of the total 683 families live below the poverty line. Families with 1 or 2 children have the highest poverty rate of 2.9%, comprising of 5 families. On the other hand, families with no children have the lowest poverty rate of 0.0%, which includes 0 families.
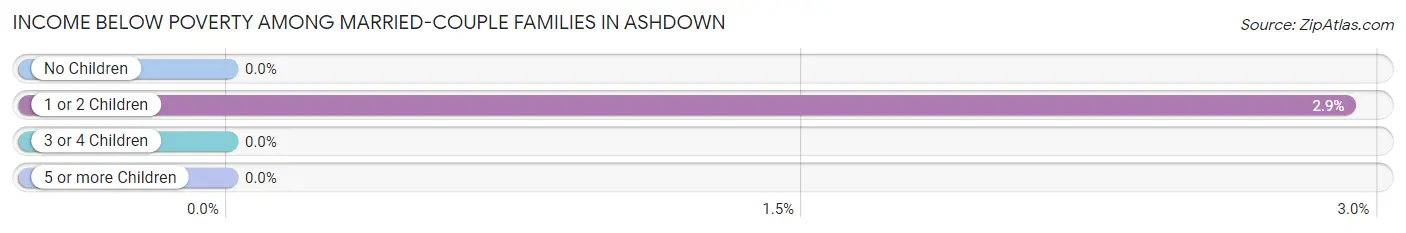
| Children | Above Poverty | Below Poverty |
| No Children | 504 (100.0%) | 0 (0.0%) |
| 1 or 2 Children | 166 (97.1%) | 5 (2.9%) |
| 3 or 4 Children | 8 (100.0%) | 0 (0.0%) |
| 5 or more Children | 0 (0.0%) | 0 (0.0%) |
| Total | 678 (99.3%) | 5 (0.7%) |
Income Below Poverty Among Single-Parent Households in Ashdown
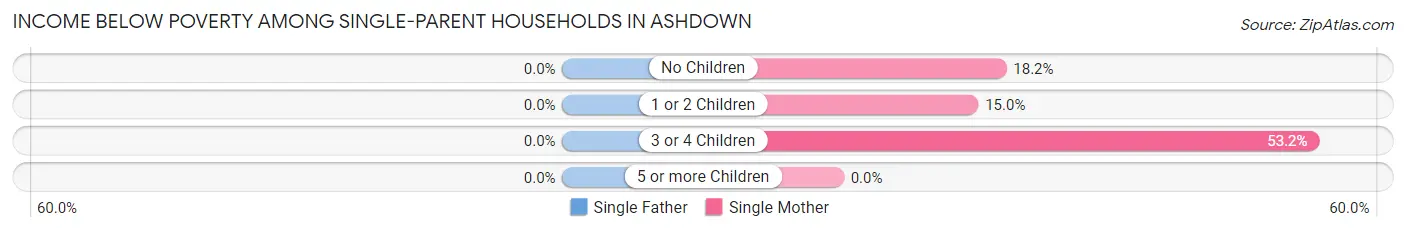
| Children | Single Father | Single Mother |
| No Children | 0 (0.0%) | 30 (18.2%) |
| 1 or 2 Children | 0 (0.0%) | 17 (15.0%) |
| 3 or 4 Children | 0 (0.0%) | 42 (53.2%) |
| 5 or more Children | 0 (0.0%) | 0 (0.0%) |
| Total | 0 (0.0%) | 89 (24.9%) |
Income Below Poverty Among Married-Couple vs Single-Parent Households in Ashdown
The poverty data for Ashdown shows that 5 of the married-couple family households (0.7%) and 89 of the single-parent households (18.6%) are living below the poverty level. Within the married-couple family households, those with 1 or 2 children have the highest poverty rate, with 5 households (2.9%) falling below the poverty line. Among the single-parent households, those with 3 or 4 children have the highest poverty rate, with 42 household (35.6%) living below poverty.
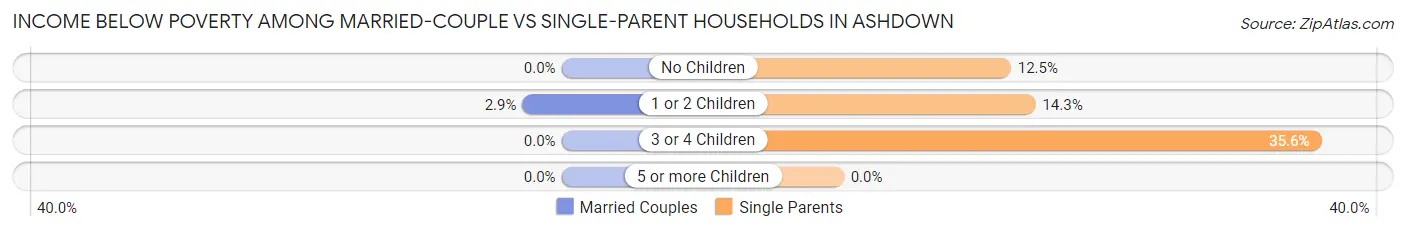
| Children | Married-Couple Families | Single-Parent Households |
| No Children | 0 (0.0%) | 30 (12.4%) |
| 1 or 2 Children | 5 (2.9%) | 17 (14.3%) |
| 3 or 4 Children | 0 (0.0%) | 42 (35.6%) |
| 5 or more Children | 0 (0.0%) | 0 (0.0%) |
| Total | 5 (0.7%) | 89 (18.6%) |
Race in Ashdown
The most populous races in Ashdown are White / Caucasian (2,540 | 59.6%), Black / African American (1,304 | 30.6%), and Two or more Races (379 | 8.9%).
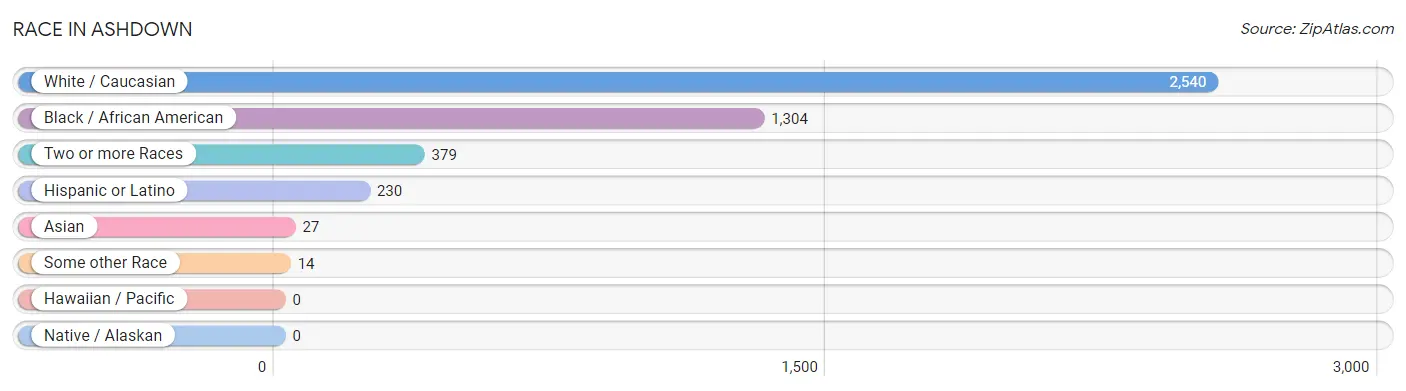
| Race | # Population | % Population |
| Asian | 27 | 0.6% |
| Black / African American | 1,304 | 30.6% |
| Hawaiian / Pacific | 0 | 0.0% |
| Hispanic or Latino | 230 | 5.4% |
| Native / Alaskan | 0 | 0.0% |
| White / Caucasian | 2,540 | 59.6% |
| Two or more Races | 379 | 8.9% |
| Some other Race | 14 | 0.3% |
| Total | 4,264 | 100.0% |
Ancestry in Ashdown
The most populous ancestries reported in Ashdown are Irish (411 | 9.6%), English (371 | 8.7%), Mexican (221 | 5.2%), German (201 | 4.7%), and American (153 | 3.6%), together accounting for 31.8% of all Ashdown residents.
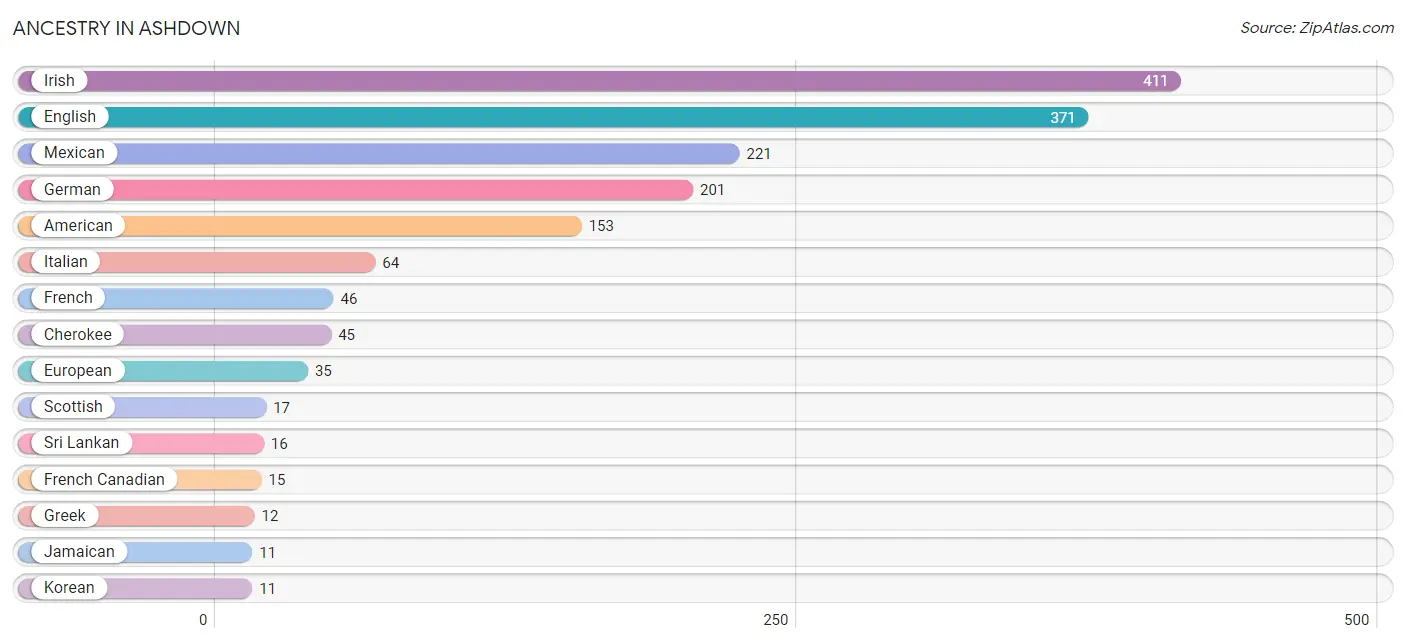
| Ancestry | # Population | % Population |
| American | 153 | 3.6% |
| Cherokee | 45 | 1.1% |
| Choctaw | 6 | 0.1% |
| Cuban | 9 | 0.2% |
| Dutch | 6 | 0.1% |
| English | 371 | 8.7% |
| European | 35 | 0.8% |
| French | 46 | 1.1% |
| French Canadian | 15 | 0.4% |
| German | 201 | 4.7% |
| Greek | 12 | 0.3% |
| Irish | 411 | 9.6% |
| Italian | 64 | 1.5% |
| Jamaican | 11 | 0.3% |
| Korean | 11 | 0.3% |
| Mexican | 221 | 5.2% |
| Scottish | 17 | 0.4% |
| Sri Lankan | 16 | 0.4% |
| Swedish | 2 | 0.1% | View All 19 Rows |
Immigrants in Ashdown
The most numerous immigrant groups reported in Ashdown came from Central America (52 | 1.2%), Latin America (52 | 1.2%), Mexico (52 | 1.2%), Asia (5 | 0.1%), and South Eastern Asia (5 | 0.1%), together accounting for 3.9% of all Ashdown residents.
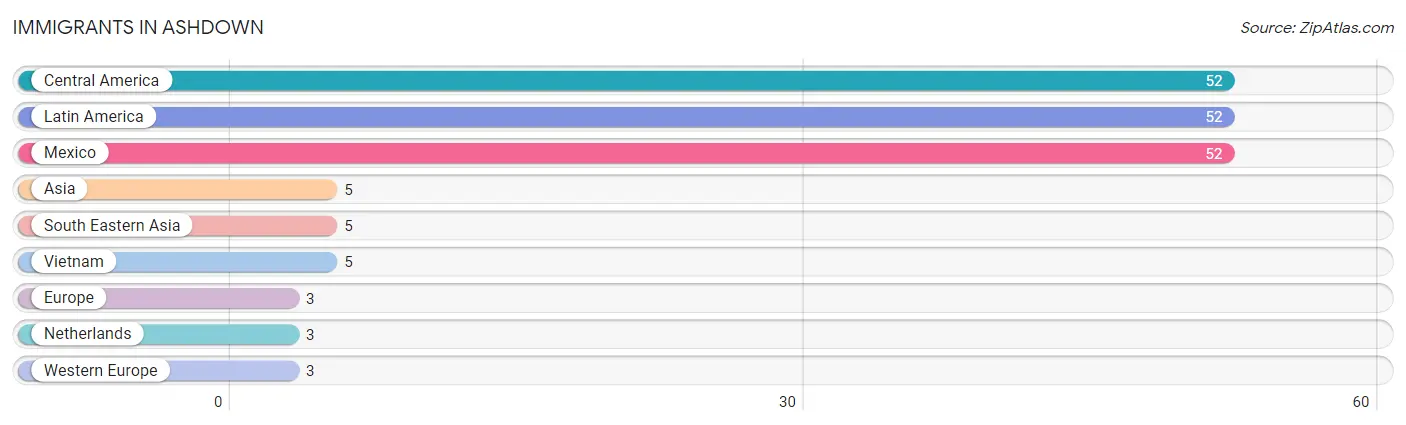
| Immigration Origin | # Population | % Population |
| Asia | 5 | 0.1% |
| Central America | 52 | 1.2% |
| Europe | 3 | 0.1% |
| Latin America | 52 | 1.2% |
| Mexico | 52 | 1.2% |
| Netherlands | 3 | 0.1% |
| South Eastern Asia | 5 | 0.1% |
| Vietnam | 5 | 0.1% |
| Western Europe | 3 | 0.1% | View All 9 Rows |
Sex and Age in Ashdown
Sex and Age in Ashdown
The most populous age groups in Ashdown are 15 to 19 Years (311 | 16.7%) for men and 40 to 44 Years (228 | 9.5%) for women.
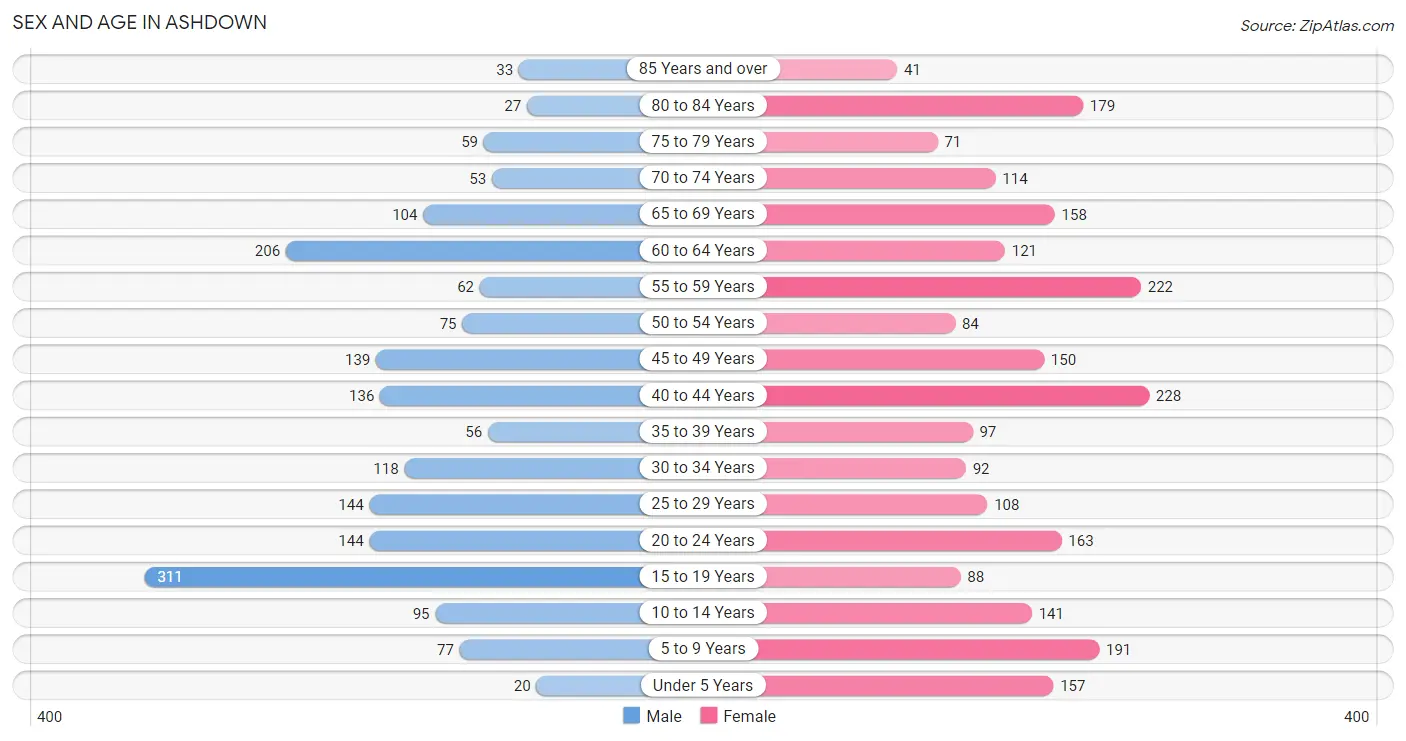
| Age Bracket | Male | Female |
| Under 5 Years | 20 (1.1%) | 157 (6.5%) |
| 5 to 9 Years | 77 (4.1%) | 191 (7.9%) |
| 10 to 14 Years | 95 (5.1%) | 141 (5.9%) |
| 15 to 19 Years | 311 (16.7%) | 88 (3.7%) |
| 20 to 24 Years | 144 (7.7%) | 163 (6.8%) |
| 25 to 29 Years | 144 (7.7%) | 108 (4.5%) |
| 30 to 34 Years | 118 (6.4%) | 92 (3.8%) |
| 35 to 39 Years | 56 (3.0%) | 97 (4.0%) |
| 40 to 44 Years | 136 (7.3%) | 228 (9.5%) |
| 45 to 49 Years | 139 (7.5%) | 150 (6.2%) |
| 50 to 54 Years | 75 (4.0%) | 84 (3.5%) |
| 55 to 59 Years | 62 (3.3%) | 222 (9.2%) |
| 60 to 64 Years | 206 (11.1%) | 121 (5.0%) |
| 65 to 69 Years | 104 (5.6%) | 158 (6.6%) |
| 70 to 74 Years | 53 (2.9%) | 114 (4.7%) |
| 75 to 79 Years | 59 (3.2%) | 71 (2.9%) |
| 80 to 84 Years | 27 (1.5%) | 179 (7.4%) |
| 85 Years and over | 33 (1.8%) | 41 (1.7%) |
| Total | 1,859 (100.0%) | 2,405 (100.0%) |
Families and Households in Ashdown
Median Family Size in Ashdown
The median family size in Ashdown is 3.08 persons per family, with single female/mother families (357 | 30.7%) accounting for the largest median family size of 3.48 persons per family. On the other hand, married-couple families (683 | 58.8%) represent the smallest median family size with 2.89 persons per family.
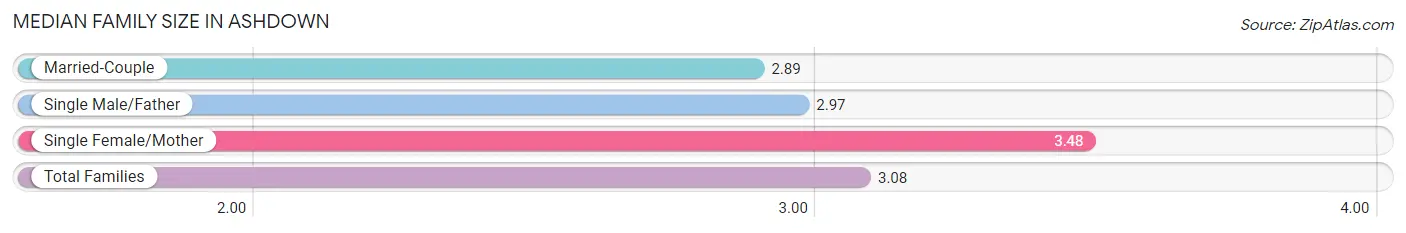
| Family Type | # Families | Family Size |
| Married-Couple | 683 (58.8%) | 2.89 |
| Single Male/Father | 121 (10.4%) | 2.97 |
| Single Female/Mother | 357 (30.7%) | 3.48 |
| Total Families | 1,161 (100.0%) | 3.08 |
Median Household Size in Ashdown
The median household size in Ashdown is 2.57 persons per household, with single female/mother households (357 | 22.4%) accounting for the largest median household size of 3.55 persons per household. non-family households (435 | 27.3%) represent the smallest median household size with 1.06 persons per household.
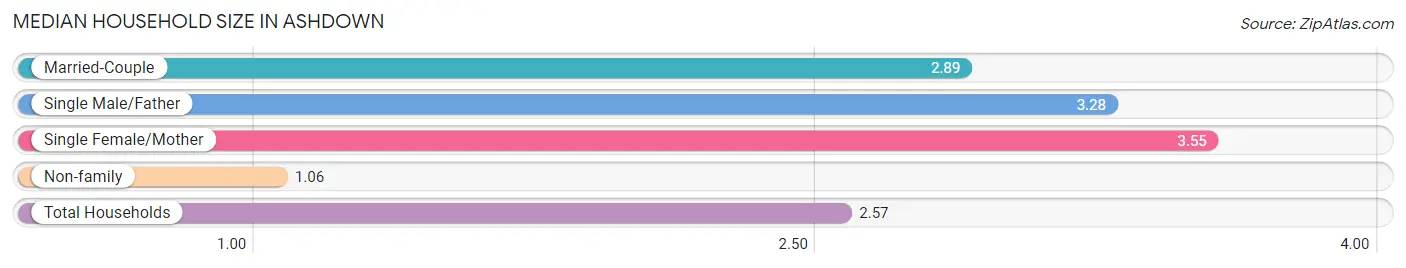
| Household Type | # Households | Household Size |
| Married-Couple | 683 (42.8%) | 2.89 |
| Single Male/Father | 121 (7.6%) | 3.28 |
| Single Female/Mother | 357 (22.4%) | 3.55 |
| Non-family | 435 (27.3%) | 1.06 |
| Total Households | 1,596 (100.0%) | 2.57 |
Household Size by Marriage Status in Ashdown
Out of a total of 1,596 households in Ashdown, 1,161 (72.7%) are family households, while 435 (27.3%) are nonfamily households. The most numerous type of family households are 2-person households, comprising 579, and the most common type of nonfamily households are 1-person households, comprising 403.
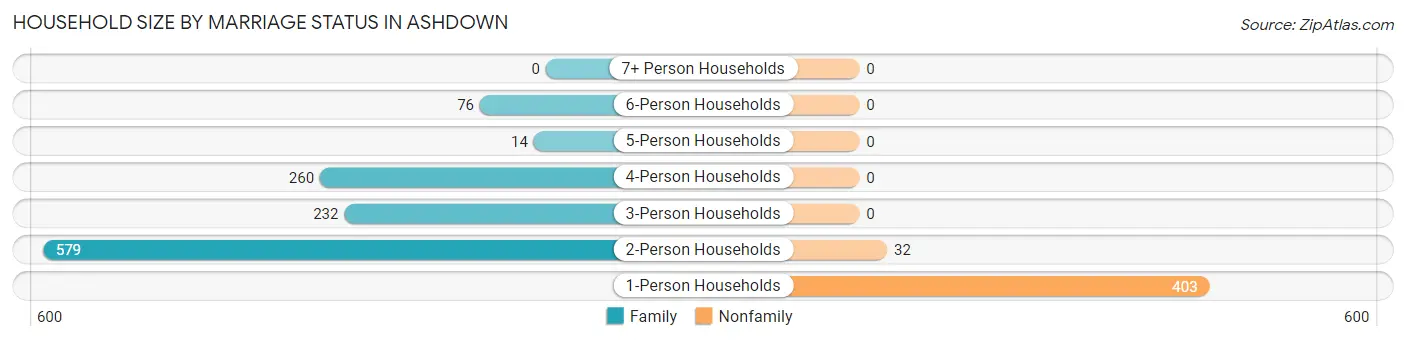
| Household Size | Family Households | Nonfamily Households |
| 1-Person Households | - | 403 (25.3%) |
| 2-Person Households | 579 (36.3%) | 32 (2.0%) |
| 3-Person Households | 232 (14.5%) | 0 (0.0%) |
| 4-Person Households | 260 (16.3%) | 0 (0.0%) |
| 5-Person Households | 14 (0.9%) | 0 (0.0%) |
| 6-Person Households | 76 (4.8%) | 0 (0.0%) |
| 7+ Person Households | 0 (0.0%) | 0 (0.0%) |
| Total | 1,161 (72.7%) | 435 (27.3%) |
Female Fertility in Ashdown
Fertility by Age in Ashdown
Average fertility rate in Ashdown is 33.0 births per 1,000 women. Women in the age bracket of 15 to 19 years have the highest fertility rate with 216.0 births per 1,000 women. Women in the age bracket of 15 to 19 years acount for 61.3% of all women with births.
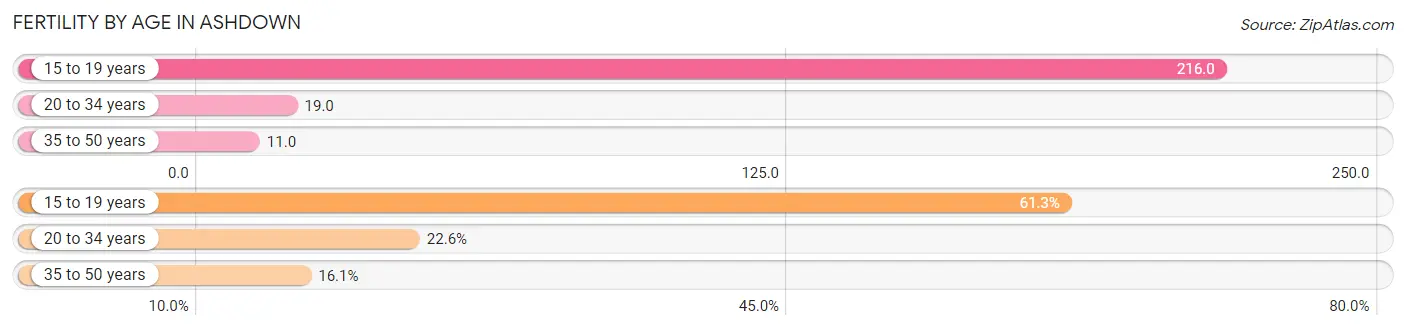
| Age Bracket | Women with Births | Births / 1,000 Women |
| 15 to 19 years | 19 (61.3%) | 216.0 |
| 20 to 34 years | 7 (22.6%) | 19.0 |
| 35 to 50 years | 5 (16.1%) | 11.0 |
| Total | 31 (100.0%) | 33.0 |
Fertility by Age by Marriage Status in Ashdown
16.1% of women with births (31) in Ashdown are married. The highest percentage of unmarried women with births falls into 15 to 19 years age bracket with 100.0% of them unmarried at the time of birth, while the lowest percentage of unmarried women with births belong to 35 to 50 years age bracket with 0.0% of them unmarried.
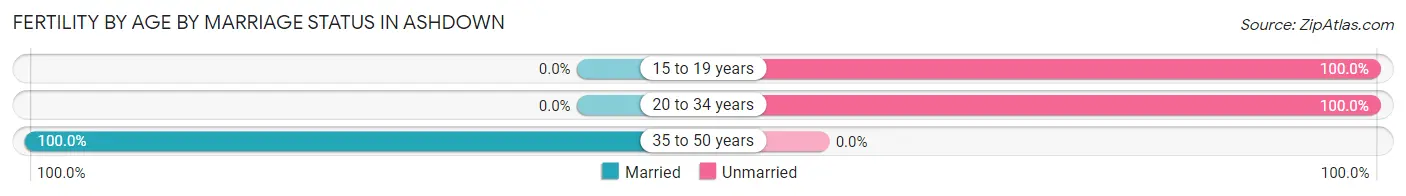
| Age Bracket | Married | Unmarried |
| 15 to 19 years | 0 (0.0%) | 19 (100.0%) |
| 20 to 34 years | 0 (0.0%) | 7 (100.0%) |
| 35 to 50 years | 5 (100.0%) | 0 (0.0%) |
| Total | 5 (16.1%) | 26 (83.9%) |
Fertility by Education in Ashdown
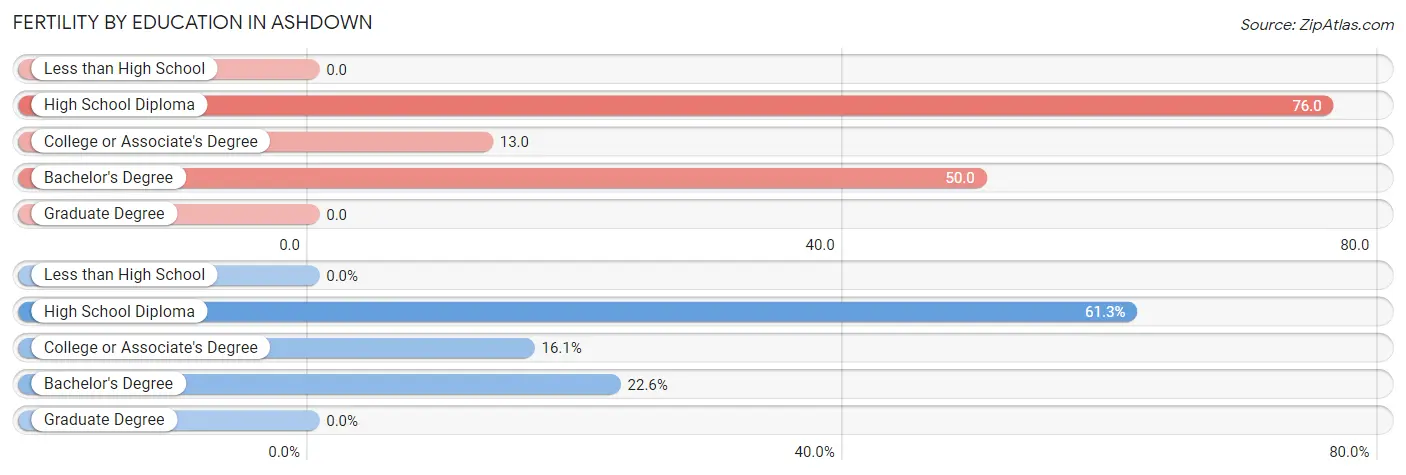
| Educational Attainment | Women with Births | Births / 1,000 Women |
| Less than High School | 0 (0.0%) | 0.0 |
| High School Diploma | 19 (61.3%) | 76.0 |
| College or Associate's Degree | 5 (16.1%) | 13.0 |
| Bachelor's Degree | 7 (22.6%) | 50.0 |
| Graduate Degree | 0 (0.0%) | 0.0 |
| Total | 31 (100.0%) | 33.0 |
Fertility by Education by Marriage Status in Ashdown
83.9% of women with births in Ashdown are unmarried. Women with the educational attainment of college or associate's degree are most likely to be married with 100.0% of them married at childbirth, while women with the educational attainment of high school diploma are least likely to be married with 100.0% of them unmarried at childbirth.
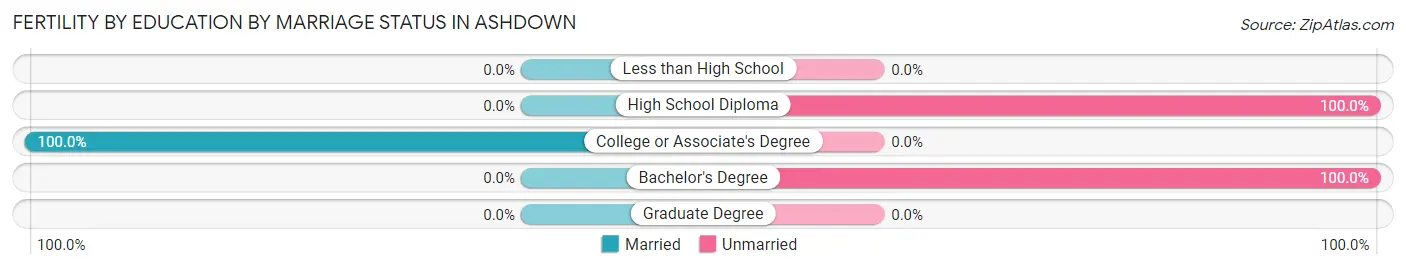
| Educational Attainment | Married | Unmarried |
| Less than High School | 0 (0.0%) | 0 (0.0%) |
| High School Diploma | 0 (0.0%) | 19 (100.0%) |
| College or Associate's Degree | 5 (100.0%) | 0 (0.0%) |
| Bachelor's Degree | 0 (0.0%) | 7 (100.0%) |
| Graduate Degree | 0 (0.0%) | 0 (0.0%) |
| Total | 5 (16.1%) | 26 (83.9%) |
Employment Characteristics in Ashdown
Employment by Class of Employer in Ashdown
Among the 1,725 employed individuals in Ashdown, private company employees (1,099 | 63.7%), local government employees (431 | 25.0%), and not-for-profit organizations (120 | 7.0%) make up the most common classes of employment.
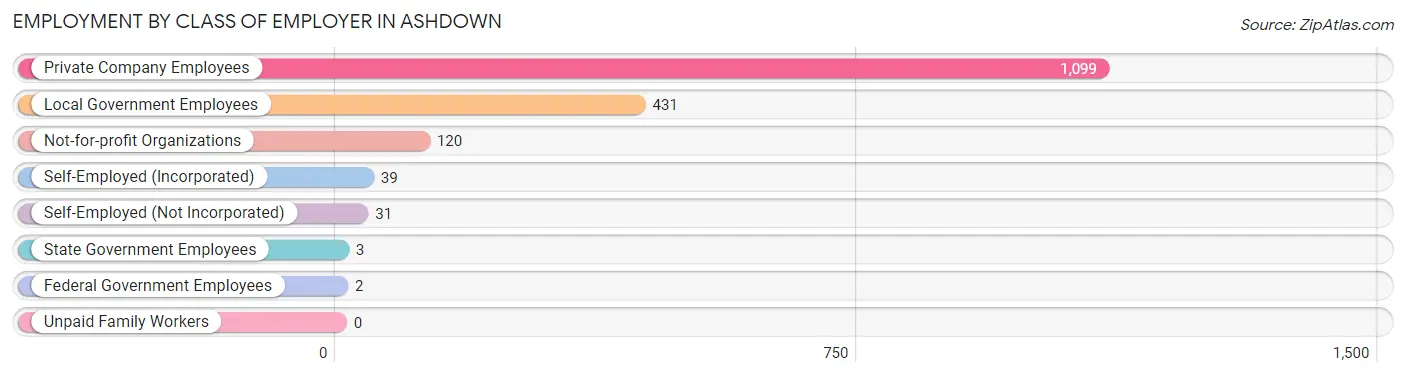
| Employer Class | # Employees | % Employees |
| Private Company Employees | 1,099 | 63.7% |
| Self-Employed (Incorporated) | 39 | 2.3% |
| Self-Employed (Not Incorporated) | 31 | 1.8% |
| Not-for-profit Organizations | 120 | 7.0% |
| Local Government Employees | 431 | 25.0% |
| State Government Employees | 3 | 0.2% |
| Federal Government Employees | 2 | 0.1% |
| Unpaid Family Workers | 0 | 0.0% |
| Total | 1,725 | 100.0% |
Employment Status by Age in Ashdown
According to the labor force statistics for Ashdown, out of the total population over 16 years of age (3,409), 57.8% or 1,970 individuals are in the labor force, with 10.5% or 207 of them unemployed. The age group with the highest labor force participation rate is 25 to 29 years, with 96.4% or 243 individuals in the labor force. Within the labor force, the 20 to 24 years age range has the highest percentage of unemployed individuals, with 36.5% or 104 of them being unemployed.
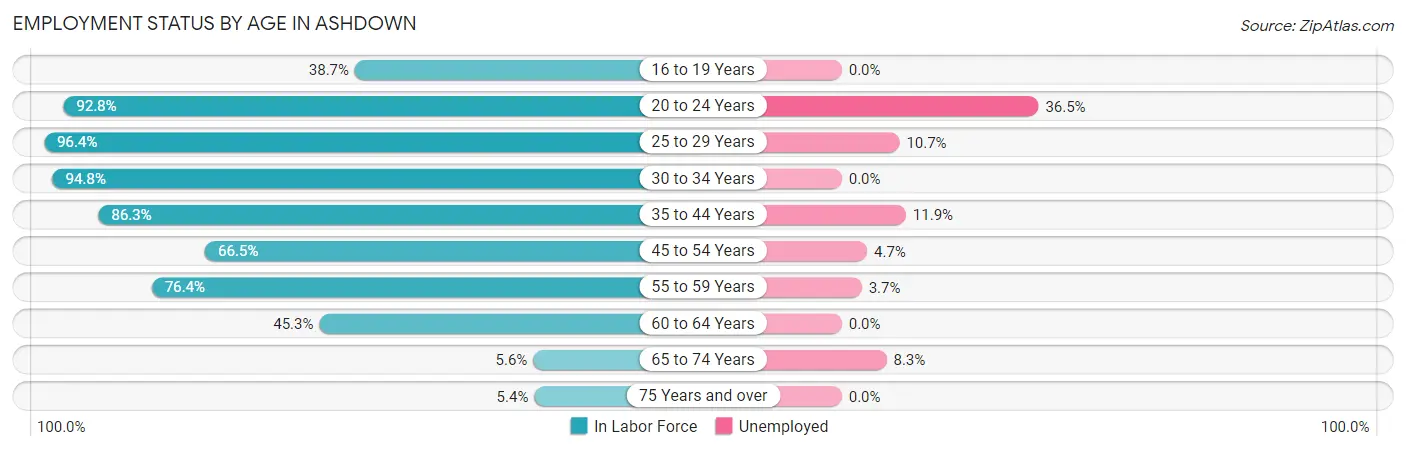
| Age Bracket | In Labor Force | Unemployed |
| 16 to 19 Years | 87 (38.7%) | 0 (0.0%) |
| 20 to 24 Years | 285 (92.8%) | 104 (36.5%) |
| 25 to 29 Years | 243 (96.4%) | 26 (10.7%) |
| 30 to 34 Years | 199 (94.8%) | 0 (0.0%) |
| 35 to 44 Years | 446 (86.3%) | 53 (11.9%) |
| 45 to 54 Years | 298 (66.5%) | 14 (4.7%) |
| 55 to 59 Years | 217 (76.4%) | 8 (3.7%) |
| 60 to 64 Years | 148 (45.3%) | 0 (0.0%) |
| 65 to 74 Years | 24 (5.6%) | 2 (8.3%) |
| 75 Years and over | 22 (5.4%) | 0 (0.0%) |
| Total | 1,970 (57.8%) | 207 (10.5%) |
Employment Status by Educational Attainment in Ashdown
According to labor force statistics for Ashdown, 76.1% of individuals (1,551) out of the total population between 25 and 64 years of age (2,038) are in the labor force, with 6.5% or 101 of them being unemployed. The group with the highest labor force participation rate are those with the educational attainment of bachelor's degree or higher, with 83.1% or 393 individuals in the labor force. Within the labor force, individuals with high school diploma education have the highest percentage of unemployment, with 11.5% or 64 of them being unemployed.
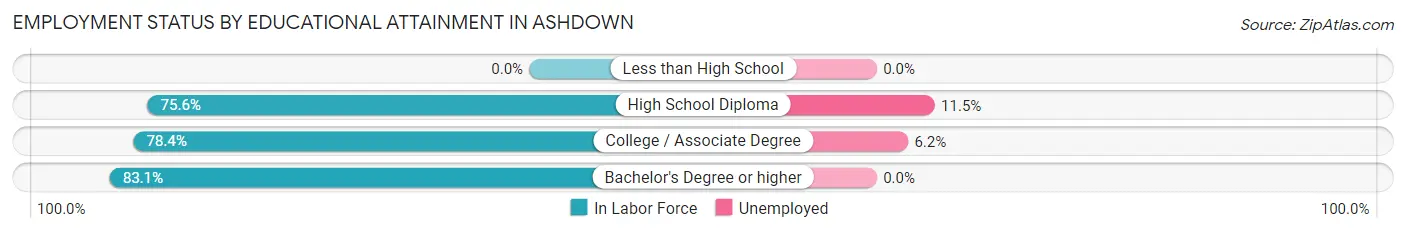
| Educational Attainment | In Labor Force | Unemployed |
| Less than High School | 0 (0.0%) | 0 (0.0%) |
| High School Diploma | 558 (75.6%) | 85 (11.5%) |
| College / Associate Degree | 600 (78.4%) | 47 (6.2%) |
| Bachelor's Degree or higher | 393 (83.1%) | 0 (0.0%) |
| Total | 1,551 (76.1%) | 132 (6.5%) |
Employment Occupations by Sex in Ashdown
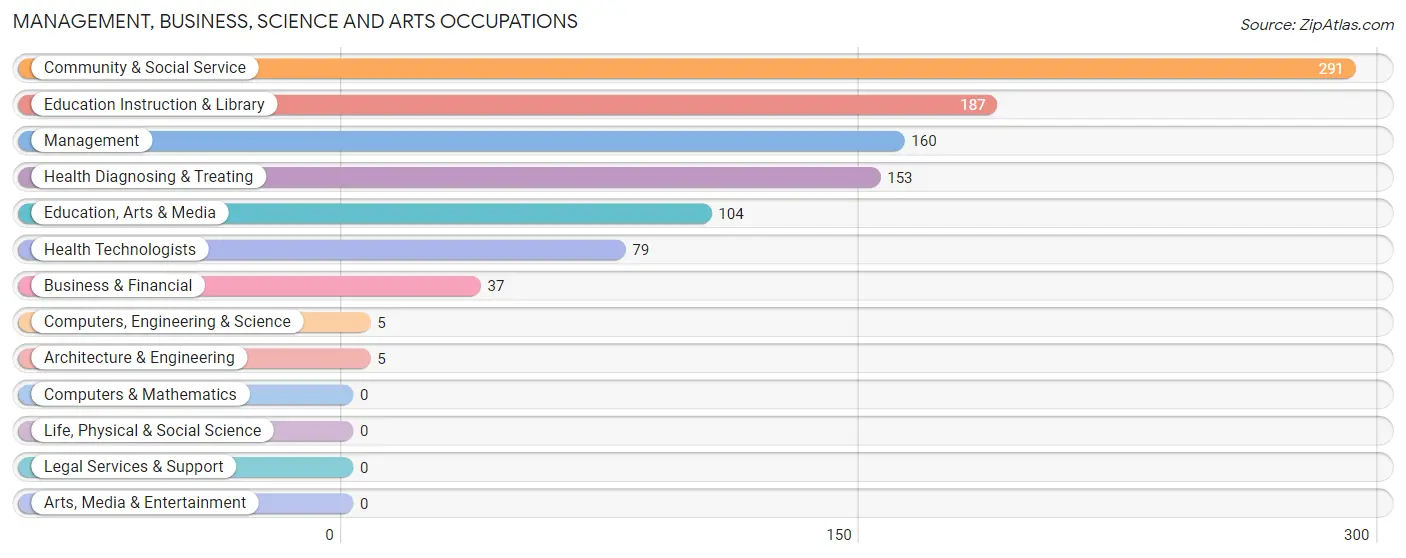
Management, Business, Science and Arts Occupations
The most common Management, Business, Science and Arts occupations in Ashdown are Community & Social Service (291 | 16.5%), Education Instruction & Library (187 | 10.6%), Management (160 | 9.1%), Health Diagnosing & Treating (153 | 8.7%), and Education, Arts & Media (104 | 5.9%).
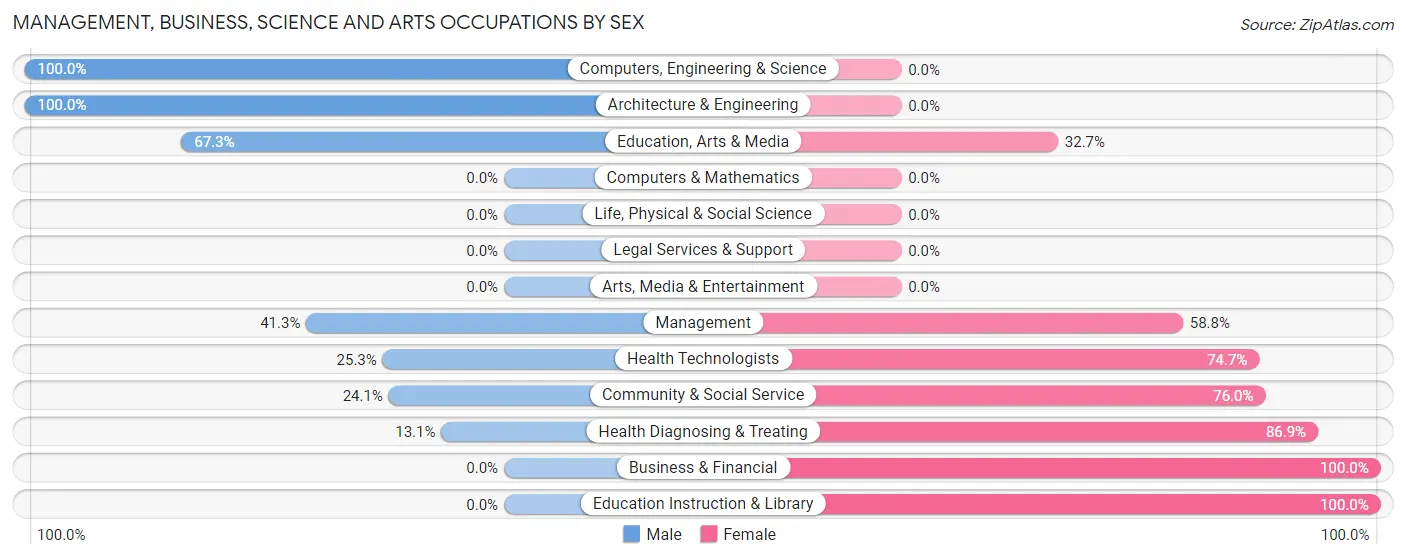
Management, Business, Science and Arts Occupations by Sex
Within the Management, Business, Science and Arts occupations in Ashdown, the most male-oriented occupations are Computers, Engineering & Science (100.0%), Architecture & Engineering (100.0%), and Education, Arts & Media (67.3%), while the most female-oriented occupations are Business & Financial (100.0%), Education Instruction & Library (100.0%), and Health Diagnosing & Treating (86.9%).
| Occupation | Male | Female |
| Management | 66 (41.2%) | 94 (58.8%) |
| Business & Financial | 0 (0.0%) | 37 (100.0%) |
| Computers, Engineering & Science | 5 (100.0%) | 0 (0.0%) |
| Computers & Mathematics | 0 (0.0%) | 0 (0.0%) |
| Architecture & Engineering | 5 (100.0%) | 0 (0.0%) |
| Life, Physical & Social Science | 0 (0.0%) | 0 (0.0%) |
| Community & Social Service | 70 (24.0%) | 221 (75.9%) |
| Education, Arts & Media | 70 (67.3%) | 34 (32.7%) |
| Legal Services & Support | 0 (0.0%) | 0 (0.0%) |
| Education Instruction & Library | 0 (0.0%) | 187 (100.0%) |
| Arts, Media & Entertainment | 0 (0.0%) | 0 (0.0%) |
| Health Diagnosing & Treating | 20 (13.1%) | 133 (86.9%) |
| Health Technologists | 20 (25.3%) | 59 (74.7%) |
| Total (Category) | 161 (24.9%) | 485 (75.1%) |
| Total (Overall) | 790 (44.8%) | 972 (55.2%) |
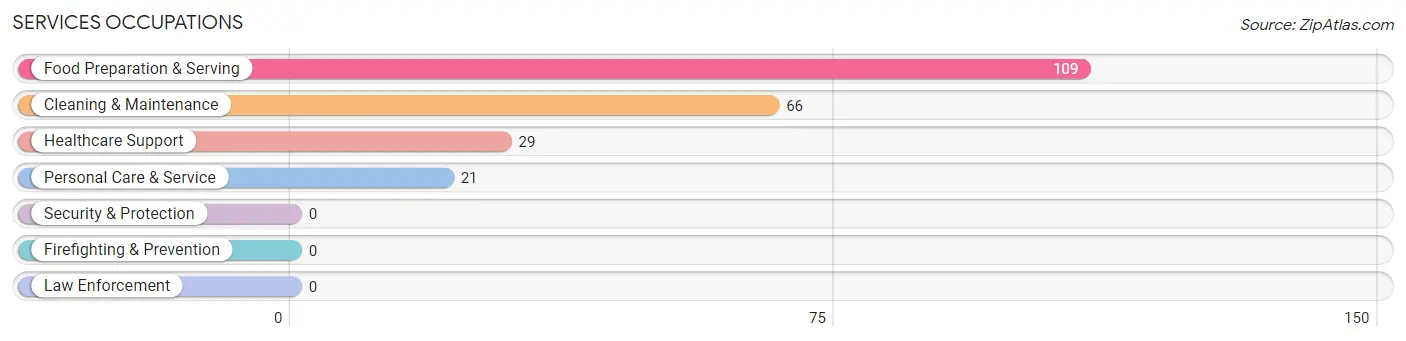
Services Occupations
The most common Services occupations in Ashdown are Food Preparation & Serving (109 | 6.2%), Cleaning & Maintenance (66 | 3.7%), Healthcare Support (29 | 1.7%), and Personal Care & Service (21 | 1.2%).
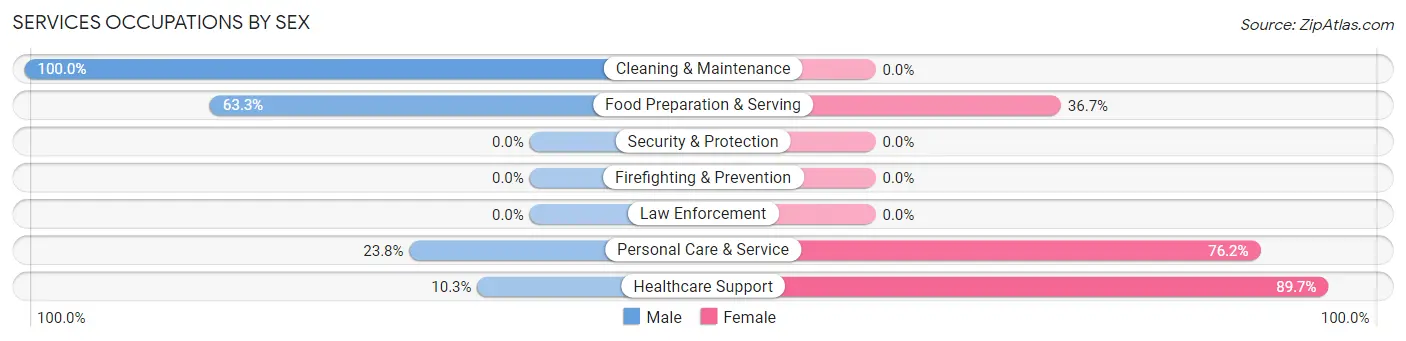
Services Occupations by Sex
Within the Services occupations in Ashdown, the most male-oriented occupations are Cleaning & Maintenance (100.0%), Food Preparation & Serving (63.3%), and Personal Care & Service (23.8%), while the most female-oriented occupations are Healthcare Support (89.7%), Personal Care & Service (76.2%), and Food Preparation & Serving (36.7%).
| Occupation | Male | Female |
| Healthcare Support | 3 (10.3%) | 26 (89.7%) |
| Security & Protection | 0 (0.0%) | 0 (0.0%) |
| Firefighting & Prevention | 0 (0.0%) | 0 (0.0%) |
| Law Enforcement | 0 (0.0%) | 0 (0.0%) |
| Food Preparation & Serving | 69 (63.3%) | 40 (36.7%) |
| Cleaning & Maintenance | 66 (100.0%) | 0 (0.0%) |
| Personal Care & Service | 5 (23.8%) | 16 (76.2%) |
| Total (Category) | 143 (63.6%) | 82 (36.4%) |
| Total (Overall) | 790 (44.8%) | 972 (55.2%) |
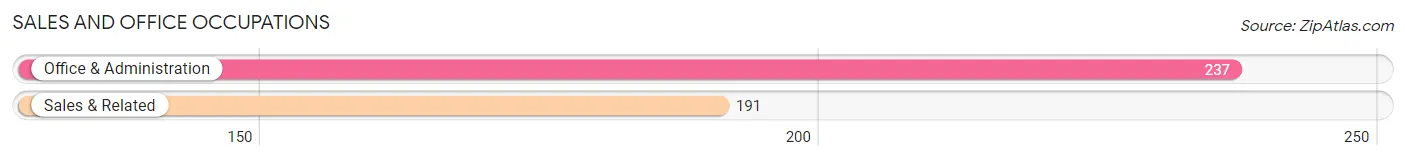
Sales and Office Occupations
The most common Sales and Office occupations in Ashdown are Office & Administration (237 | 13.5%), and Sales & Related (191 | 10.8%).
Sales and Office Occupations by Sex
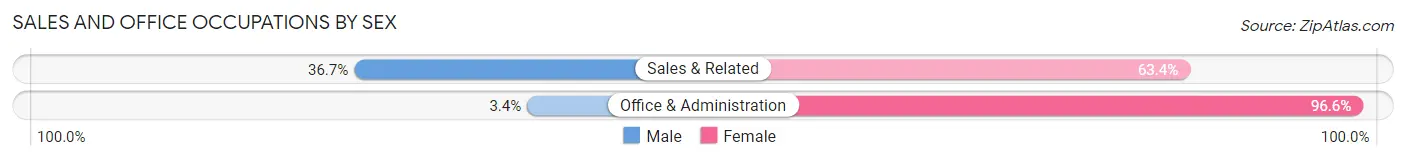
| Occupation | Male | Female |
| Sales & Related | 70 (36.6%) | 121 (63.3%) |
| Office & Administration | 8 (3.4%) | 229 (96.6%) |
| Total (Category) | 78 (18.2%) | 350 (81.8%) |
| Total (Overall) | 790 (44.8%) | 972 (55.2%) |
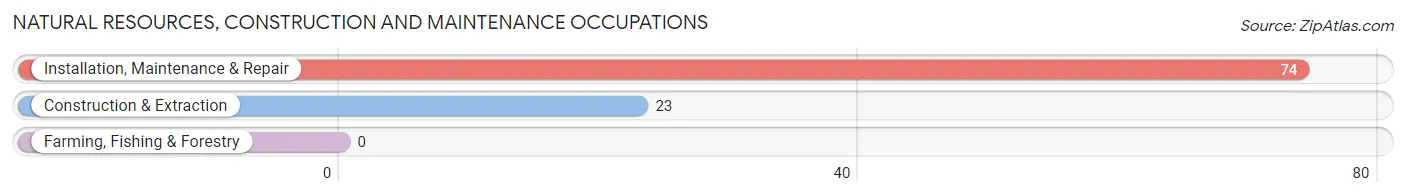
Natural Resources, Construction and Maintenance Occupations
The most common Natural Resources, Construction and Maintenance occupations in Ashdown are Installation, Maintenance & Repair (74 | 4.2%), and Construction & Extraction (23 | 1.3%).
Natural Resources, Construction and Maintenance Occupations by Sex
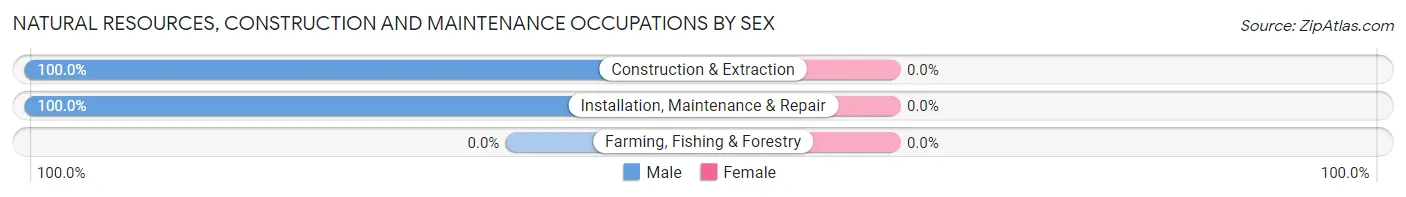
| Occupation | Male | Female |
| Farming, Fishing & Forestry | 0 (0.0%) | 0 (0.0%) |
| Construction & Extraction | 23 (100.0%) | 0 (0.0%) |
| Installation, Maintenance & Repair | 74 (100.0%) | 0 (0.0%) |
| Total (Category) | 97 (100.0%) | 0 (0.0%) |
| Total (Overall) | 790 (44.8%) | 972 (55.2%) |
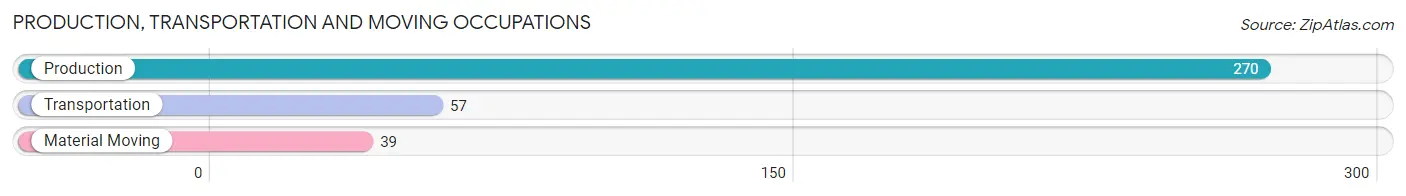
Production, Transportation and Moving Occupations
The most common Production, Transportation and Moving occupations in Ashdown are Production (270 | 15.3%), Transportation (57 | 3.2%), and Material Moving (39 | 2.2%).
Production, Transportation and Moving Occupations by Sex
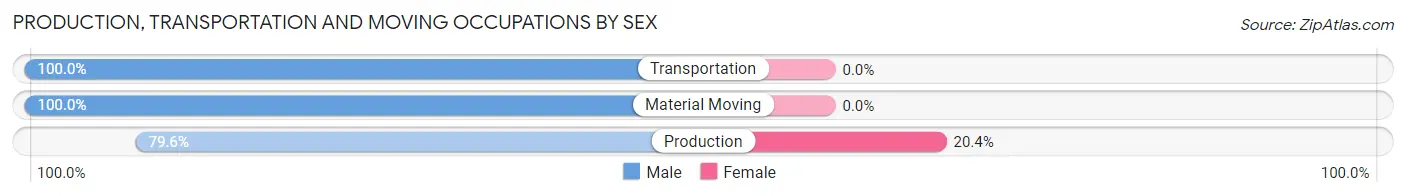
| Occupation | Male | Female |
| Production | 215 (79.6%) | 55 (20.4%) |
| Transportation | 57 (100.0%) | 0 (0.0%) |
| Material Moving | 39 (100.0%) | 0 (0.0%) |
| Total (Category) | 311 (85.0%) | 55 (15.0%) |
| Total (Overall) | 790 (44.8%) | 972 (55.2%) |
Employment Industries by Sex in Ashdown
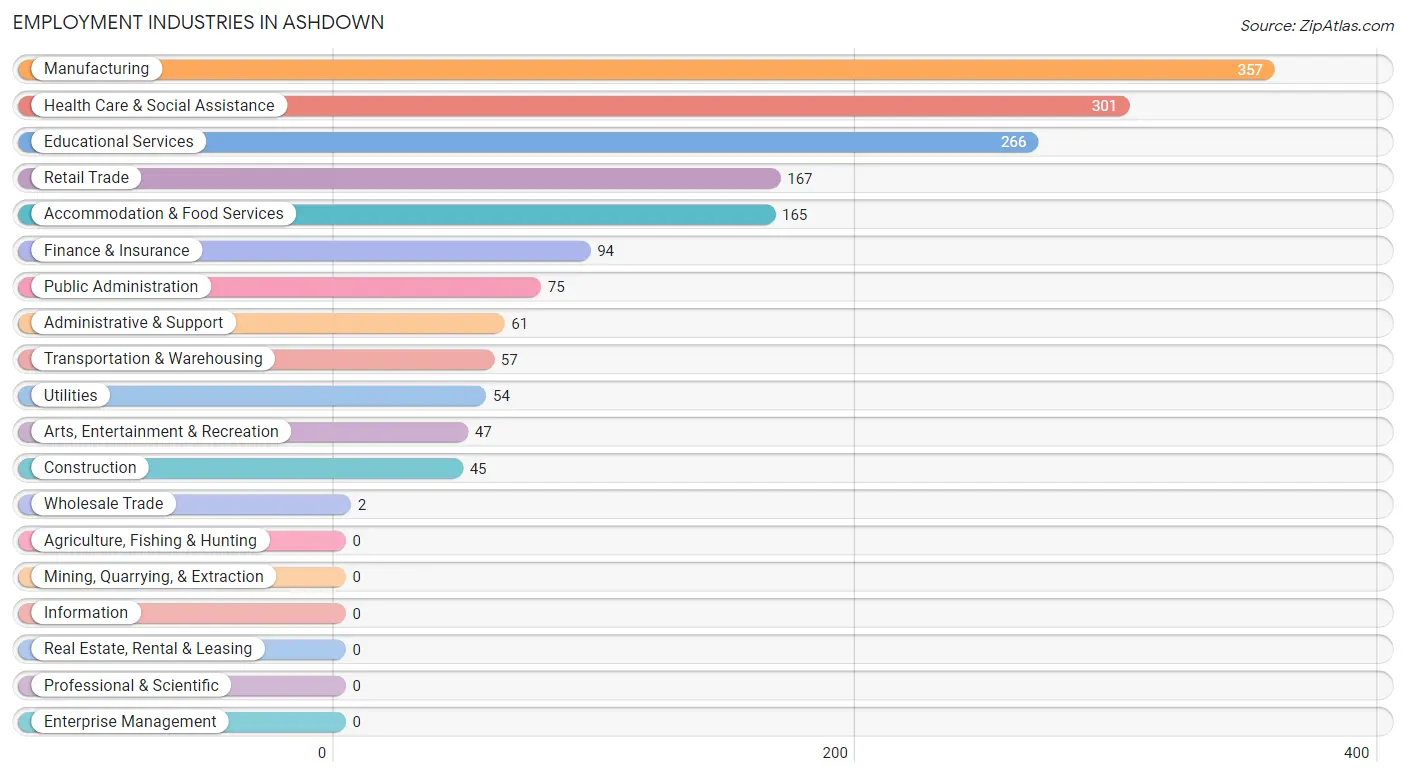
Employment Industries in Ashdown
The major employment industries in Ashdown include Manufacturing (357 | 20.3%), Health Care & Social Assistance (301 | 17.1%), Educational Services (266 | 15.1%), Retail Trade (167 | 9.5%), and Accommodation & Food Services (165 | 9.4%).
Employment Industries by Sex in Ashdown
The Ashdown industries that see more men than women are Wholesale Trade (100.0%), Transportation & Warehousing (100.0%), and Utilities (100.0%), whereas the industries that tend to have a higher number of women are Finance & Insurance (100.0%), Educational Services (97.0%), and Public Administration (89.3%).
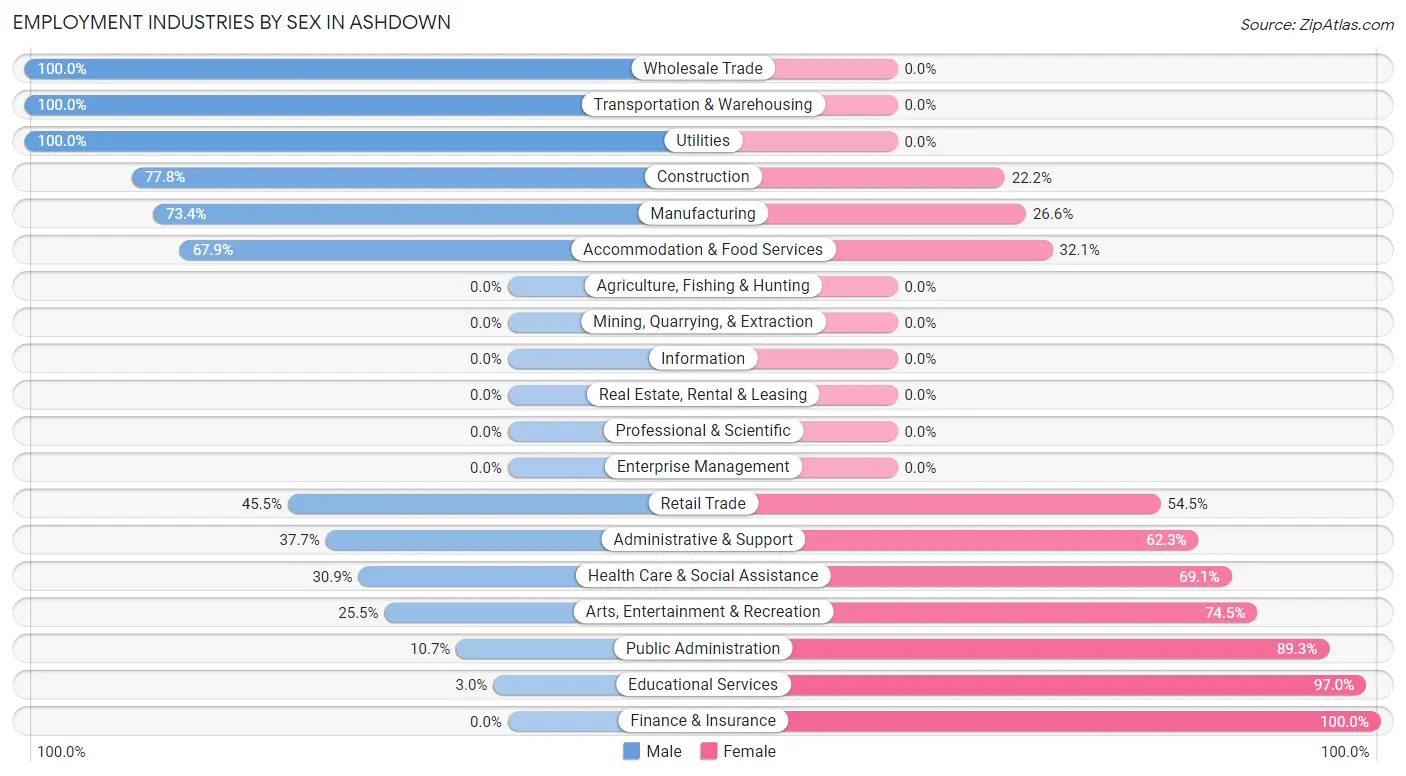
| Industry | Male | Female |
| Agriculture, Fishing & Hunting | 0 (0.0%) | 0 (0.0%) |
| Mining, Quarrying, & Extraction | 0 (0.0%) | 0 (0.0%) |
| Construction | 35 (77.8%) | 10 (22.2%) |
| Manufacturing | 262 (73.4%) | 95 (26.6%) |
| Wholesale Trade | 2 (100.0%) | 0 (0.0%) |
| Retail Trade | 76 (45.5%) | 91 (54.5%) |
| Transportation & Warehousing | 57 (100.0%) | 0 (0.0%) |
| Utilities | 54 (100.0%) | 0 (0.0%) |
| Information | 0 (0.0%) | 0 (0.0%) |
| Finance & Insurance | 0 (0.0%) | 94 (100.0%) |
| Real Estate, Rental & Leasing | 0 (0.0%) | 0 (0.0%) |
| Professional & Scientific | 0 (0.0%) | 0 (0.0%) |
| Enterprise Management | 0 (0.0%) | 0 (0.0%) |
| Administrative & Support | 23 (37.7%) | 38 (62.3%) |
| Educational Services | 8 (3.0%) | 258 (97.0%) |
| Health Care & Social Assistance | 93 (30.9%) | 208 (69.1%) |
| Arts, Entertainment & Recreation | 12 (25.5%) | 35 (74.5%) |
| Accommodation & Food Services | 112 (67.9%) | 53 (32.1%) |
| Public Administration | 8 (10.7%) | 67 (89.3%) |
| Total | 790 (44.8%) | 972 (55.2%) |
Education in Ashdown
School Enrollment in Ashdown
The most common levels of schooling among the 1,038 students in Ashdown are high school (351 | 33.8%), middle school (195 | 18.8%), and elementary school (165 | 15.9%).
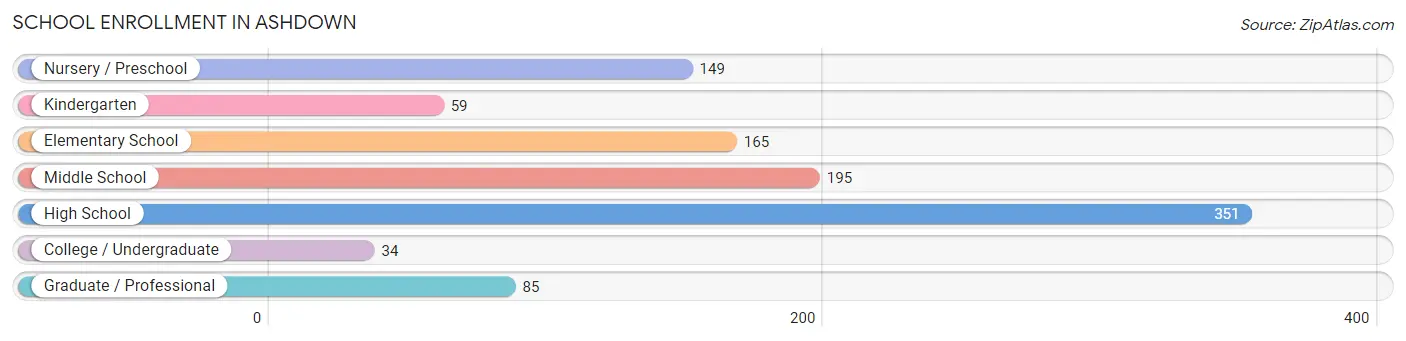
| School Level | # Students | % Students |
| Nursery / Preschool | 149 | 14.3% |
| Kindergarten | 59 | 5.7% |
| Elementary School | 165 | 15.9% |
| Middle School | 195 | 18.8% |
| High School | 351 | 33.8% |
| College / Undergraduate | 34 | 3.3% |
| Graduate / Professional | 85 | 8.2% |
| Total | 1,038 | 100.0% |
School Enrollment by Age by Funding Source in Ashdown
Out of a total of 1,038 students who are enrolled in schools in Ashdown, 33 (3.2%) attend a private institution, while the remaining 1,005 (96.8%) are enrolled in public schools. The age group of 5 to 9 year old has the highest likelihood of being enrolled in private schools, with 24 (9.4% in the age bracket) enrolled. Conversely, the age group of 3 to 4 year olds has the lowest likelihood of being enrolled in a private school, with 106 (100.0% in the age bracket) attending a public institution.
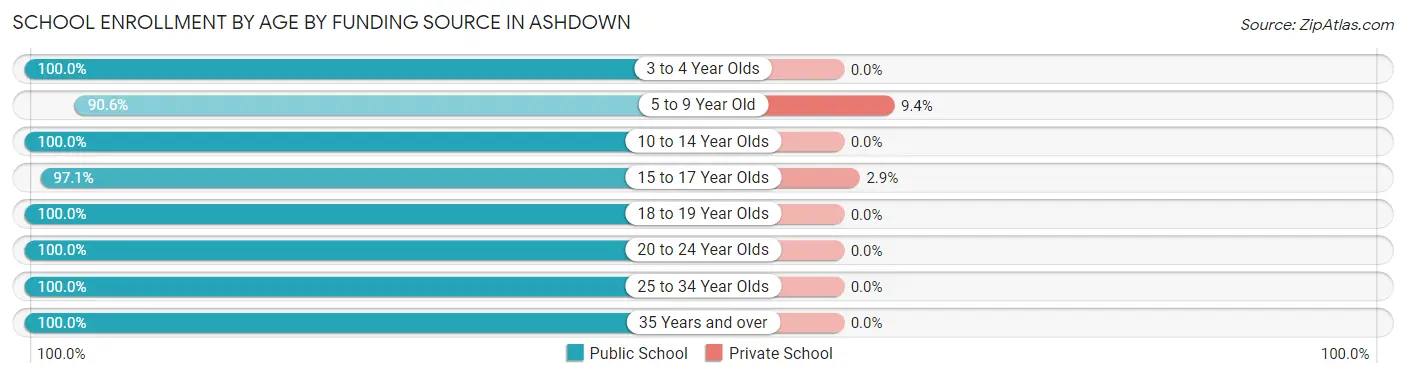
| Age Bracket | Public School | Private School |
| 3 to 4 Year Olds | 106 (100.0%) | 0 (0.0%) |
| 5 to 9 Year Old | 232 (90.6%) | 24 (9.4%) |
| 10 to 14 Year Olds | 222 (100.0%) | 0 (0.0%) |
| 15 to 17 Year Olds | 297 (97.1%) | 9 (2.9%) |
| 18 to 19 Year Olds | 11 (100.0%) | 0 (0.0%) |
| 20 to 24 Year Olds | 32 (100.0%) | 0 (0.0%) |
| 25 to 34 Year Olds | 15 (100.0%) | 0 (0.0%) |
| 35 Years and over | 90 (100.0%) | 0 (0.0%) |
| Total | 1,005 (96.8%) | 33 (3.2%) |
Educational Attainment by Field of Study in Ashdown
Education (260 | 42.0%), business (119 | 19.2%), computers & mathematics (65 | 10.5%), psychology (39 | 6.3%), and science & technology (31 | 5.0%) are the most common fields of study among 619 individuals in Ashdown who have obtained a bachelor's degree or higher.
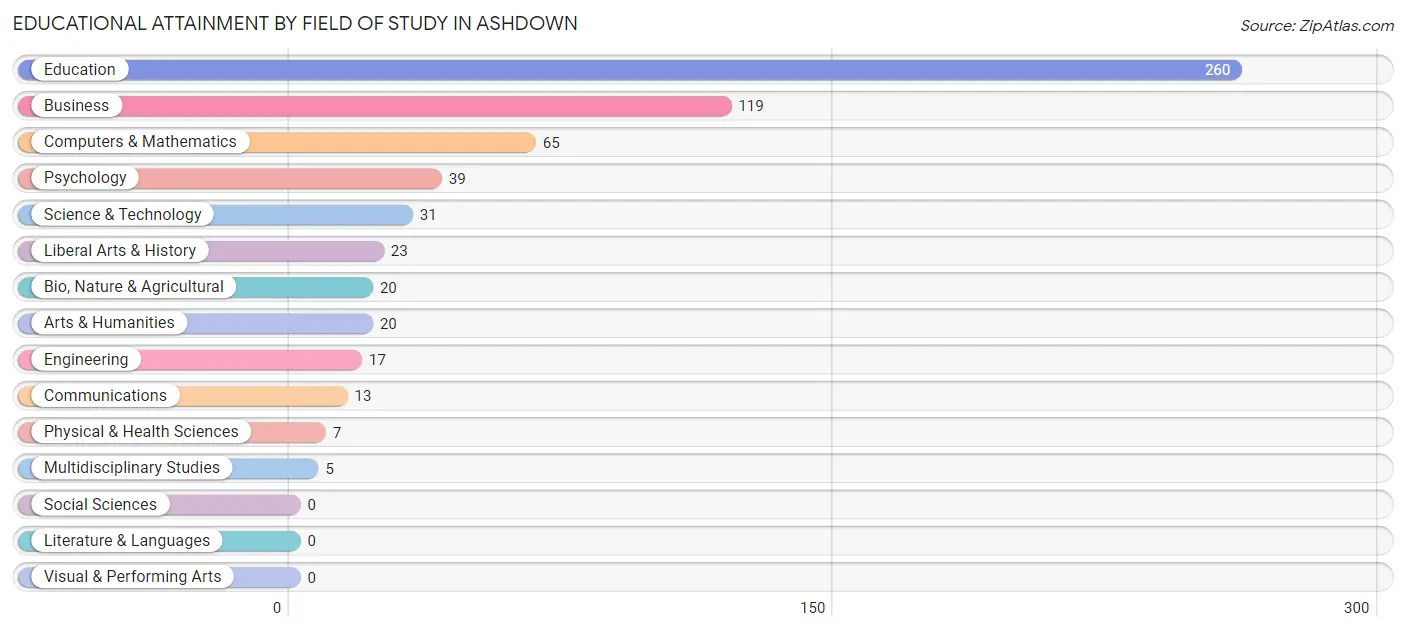
| Field of Study | # Graduates | % Graduates |
| Computers & Mathematics | 65 | 10.5% |
| Bio, Nature & Agricultural | 20 | 3.2% |
| Physical & Health Sciences | 7 | 1.1% |
| Psychology | 39 | 6.3% |
| Social Sciences | 0 | 0.0% |
| Engineering | 17 | 2.8% |
| Multidisciplinary Studies | 5 | 0.8% |
| Science & Technology | 31 | 5.0% |
| Business | 119 | 19.2% |
| Education | 260 | 42.0% |
| Literature & Languages | 0 | 0.0% |
| Liberal Arts & History | 23 | 3.7% |
| Visual & Performing Arts | 0 | 0.0% |
| Communications | 13 | 2.1% |
| Arts & Humanities | 20 | 3.2% |
| Total | 619 | 100.0% |
Transportation & Commute in Ashdown
Vehicle Availability by Sex in Ashdown
The most prevalent vehicle ownership categories in Ashdown are males with 2 vehicles (491, accounting for 64.0%) and females with 2 vehicles (564, making up 51.2%).
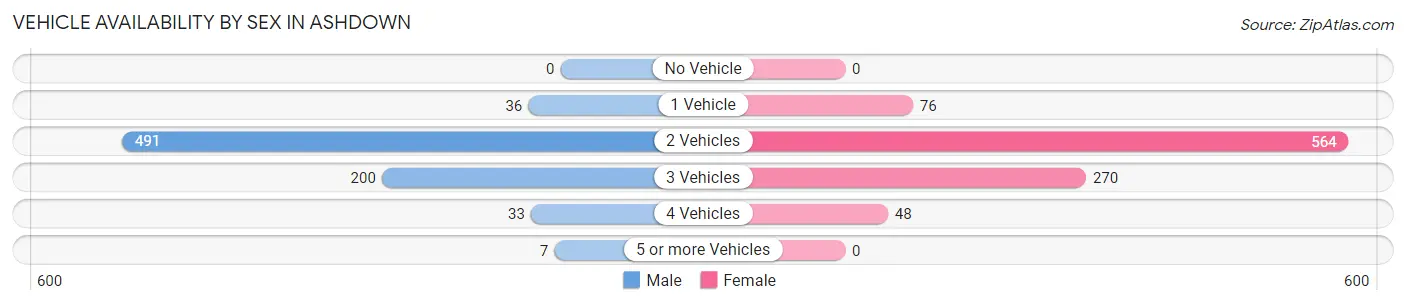
| Vehicles Available | Male | Female |
| No Vehicle | 0 (0.0%) | 0 (0.0%) |
| 1 Vehicle | 36 (4.7%) | 76 (7.9%) |
| 2 Vehicles | 491 (64.0%) | 564 (58.9%) |
| 3 Vehicles | 200 (26.1%) | 270 (28.2%) |
| 4 Vehicles | 33 (4.3%) | 48 (5.0%) |
| 5 or more Vehicles | 7 (0.9%) | 0 (0.0%) |
| Total | 767 (100.0%) | 958 (100.0%) |
Commute Time in Ashdown
The most frequently occuring commute durations in Ashdown are 30 to 34 minutes (414 commuters, 25.4%), 10 to 14 minutes (318 commuters, 19.5%), and 5 to 9 minutes (229 commuters, 14.1%).
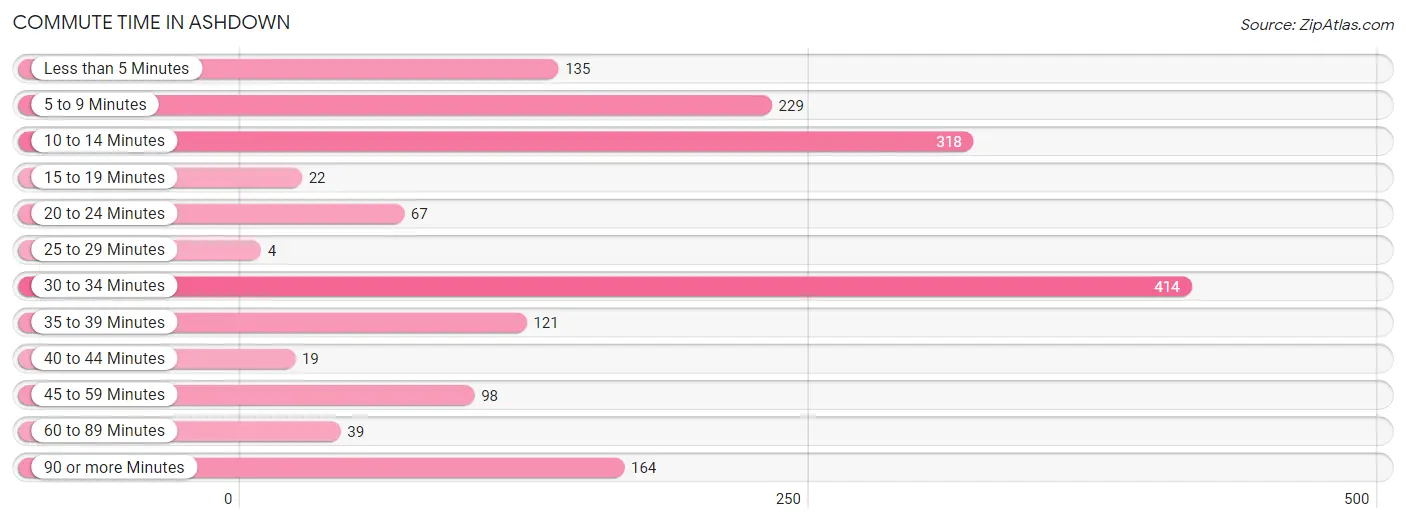
| Commute Time | # Commuters | % Commuters |
| Less than 5 Minutes | 135 | 8.3% |
| 5 to 9 Minutes | 229 | 14.1% |
| 10 to 14 Minutes | 318 | 19.5% |
| 15 to 19 Minutes | 22 | 1.3% |
| 20 to 24 Minutes | 67 | 4.1% |
| 25 to 29 Minutes | 4 | 0.3% |
| 30 to 34 Minutes | 414 | 25.4% |
| 35 to 39 Minutes | 121 | 7.4% |
| 40 to 44 Minutes | 19 | 1.2% |
| 45 to 59 Minutes | 98 | 6.0% |
| 60 to 89 Minutes | 39 | 2.4% |
| 90 or more Minutes | 164 | 10.1% |
Commute Time by Sex in Ashdown
The most common commute times in Ashdown are 10 to 14 minutes (130 commuters, 17.4%) for males and 30 to 34 minutes (286 commuters, 32.4%) for females.
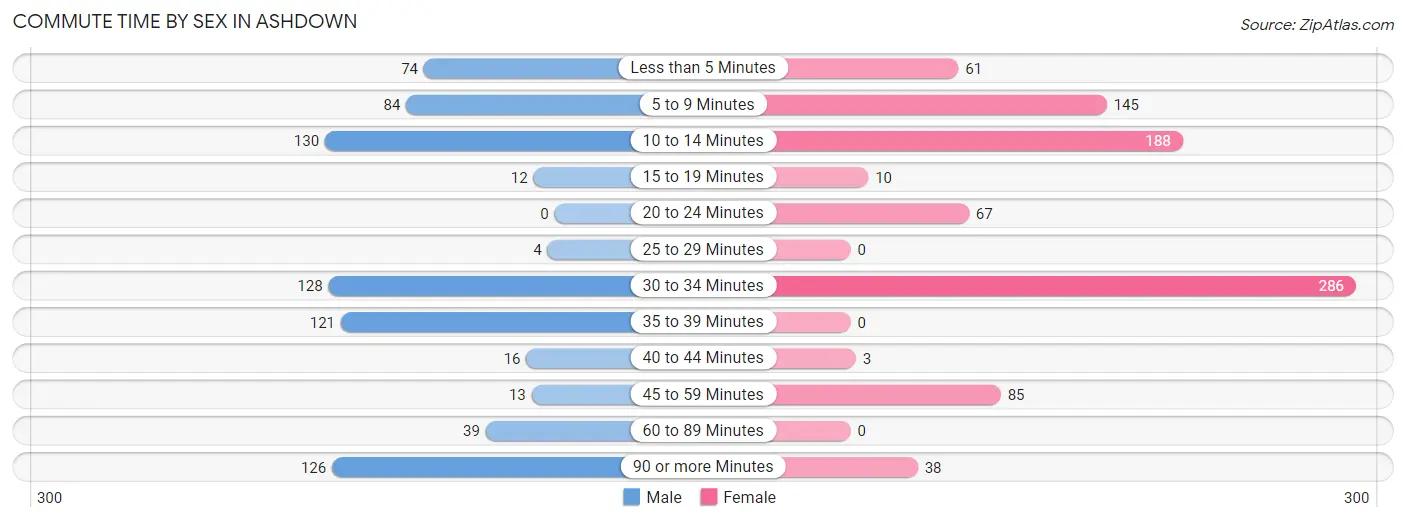
| Commute Time | Male | Female |
| Less than 5 Minutes | 74 (9.9%) | 61 (6.9%) |
| 5 to 9 Minutes | 84 (11.2%) | 145 (16.4%) |
| 10 to 14 Minutes | 130 (17.4%) | 188 (21.3%) |
| 15 to 19 Minutes | 12 (1.6%) | 10 (1.1%) |
| 20 to 24 Minutes | 0 (0.0%) | 67 (7.6%) |
| 25 to 29 Minutes | 4 (0.5%) | 0 (0.0%) |
| 30 to 34 Minutes | 128 (17.1%) | 286 (32.4%) |
| 35 to 39 Minutes | 121 (16.2%) | 0 (0.0%) |
| 40 to 44 Minutes | 16 (2.1%) | 3 (0.3%) |
| 45 to 59 Minutes | 13 (1.7%) | 85 (9.6%) |
| 60 to 89 Minutes | 39 (5.2%) | 0 (0.0%) |
| 90 or more Minutes | 126 (16.9%) | 38 (4.3%) |
Time of Departure to Work by Sex in Ashdown
The most frequent times of departure to work in Ashdown are 12:00 PM to 3:59 PM (168, 22.5%) for males and 7:00 AM to 7:29 AM (245, 27.8%) for females.
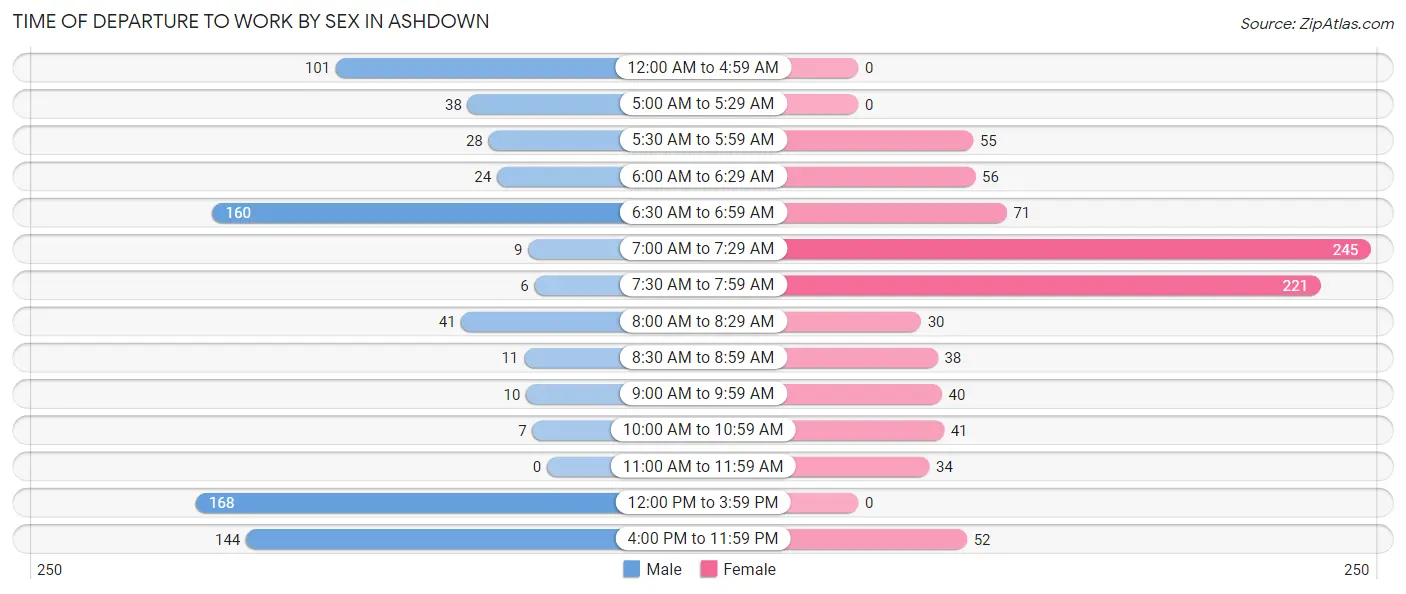
| Time of Departure | Male | Female |
| 12:00 AM to 4:59 AM | 101 (13.5%) | 0 (0.0%) |
| 5:00 AM to 5:29 AM | 38 (5.1%) | 0 (0.0%) |
| 5:30 AM to 5:59 AM | 28 (3.7%) | 55 (6.2%) |
| 6:00 AM to 6:29 AM | 24 (3.2%) | 56 (6.3%) |
| 6:30 AM to 6:59 AM | 160 (21.4%) | 71 (8.0%) |
| 7:00 AM to 7:29 AM | 9 (1.2%) | 245 (27.8%) |
| 7:30 AM to 7:59 AM | 6 (0.8%) | 221 (25.0%) |
| 8:00 AM to 8:29 AM | 41 (5.5%) | 30 (3.4%) |
| 8:30 AM to 8:59 AM | 11 (1.5%) | 38 (4.3%) |
| 9:00 AM to 9:59 AM | 10 (1.3%) | 40 (4.5%) |
| 10:00 AM to 10:59 AM | 7 (0.9%) | 41 (4.6%) |
| 11:00 AM to 11:59 AM | 0 (0.0%) | 34 (3.8%) |
| 12:00 PM to 3:59 PM | 168 (22.5%) | 0 (0.0%) |
| 4:00 PM to 11:59 PM | 144 (19.3%) | 52 (5.9%) |
| Total | 747 (100.0%) | 883 (100.0%) |
Housing Occupancy in Ashdown
Occupancy by Ownership in Ashdown
Of the total 1,596 dwellings in Ashdown, owner-occupied units account for 1,359 (85.2%), while renter-occupied units make up 237 (14.8%).
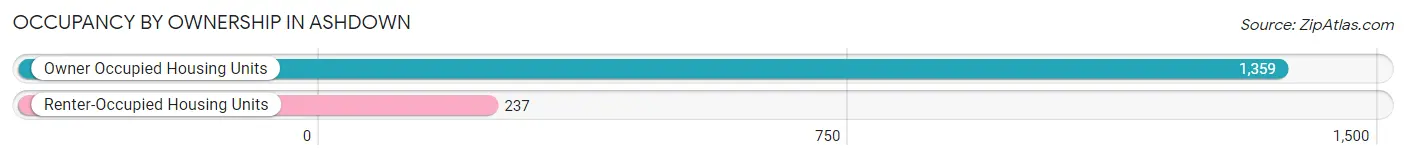
| Occupancy | # Housing Units | % Housing Units |
| Owner Occupied Housing Units | 1,359 | 85.2% |
| Renter-Occupied Housing Units | 237 | 14.8% |
| Total Occupied Housing Units | 1,596 | 100.0% |
Occupancy by Household Size in Ashdown
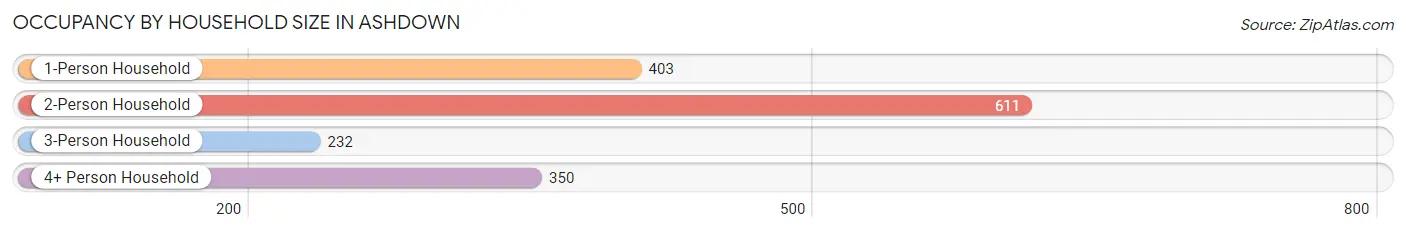
| Household Size | # Housing Units | % Housing Units |
| 1-Person Household | 403 | 25.3% |
| 2-Person Household | 611 | 38.3% |
| 3-Person Household | 232 | 14.5% |
| 4+ Person Household | 350 | 21.9% |
| Total Housing Units | 1,596 | 100.0% |
Occupancy by Ownership by Household Size in Ashdown
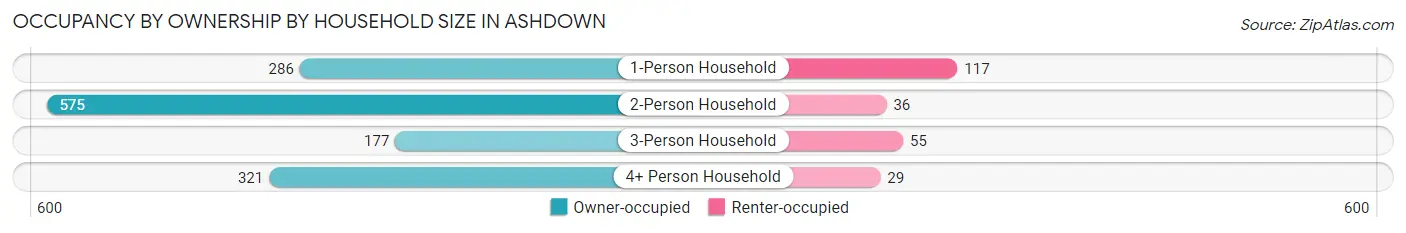
| Household Size | Owner-occupied | Renter-occupied |
| 1-Person Household | 286 (71.0%) | 117 (29.0%) |
| 2-Person Household | 575 (94.1%) | 36 (5.9%) |
| 3-Person Household | 177 (76.3%) | 55 (23.7%) |
| 4+ Person Household | 321 (91.7%) | 29 (8.3%) |
| Total Housing Units | 1,359 (85.2%) | 237 (14.8%) |
Occupancy by Educational Attainment in Ashdown
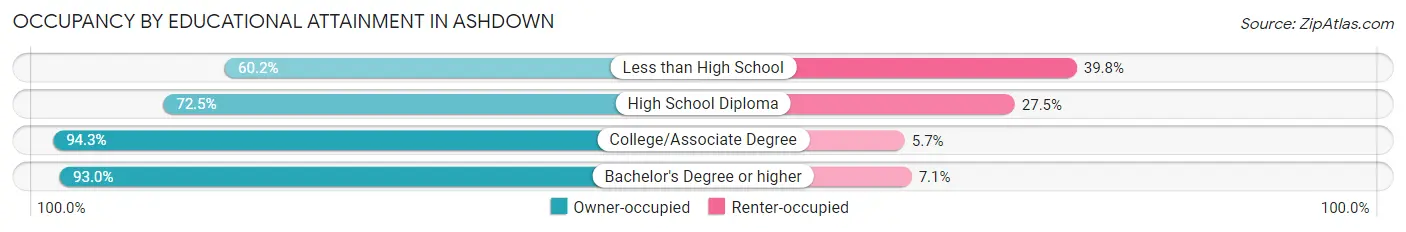
| Household Size | Owner-occupied | Renter-occupied |
| Less than High School | 53 (60.2%) | 35 (39.8%) |
| High School Diploma | 369 (72.5%) | 140 (27.5%) |
| College/Associate Degree | 581 (94.3%) | 35 (5.7%) |
| Bachelor's Degree or higher | 356 (92.9%) | 27 (7.0%) |
Occupancy by Age of Householder in Ashdown
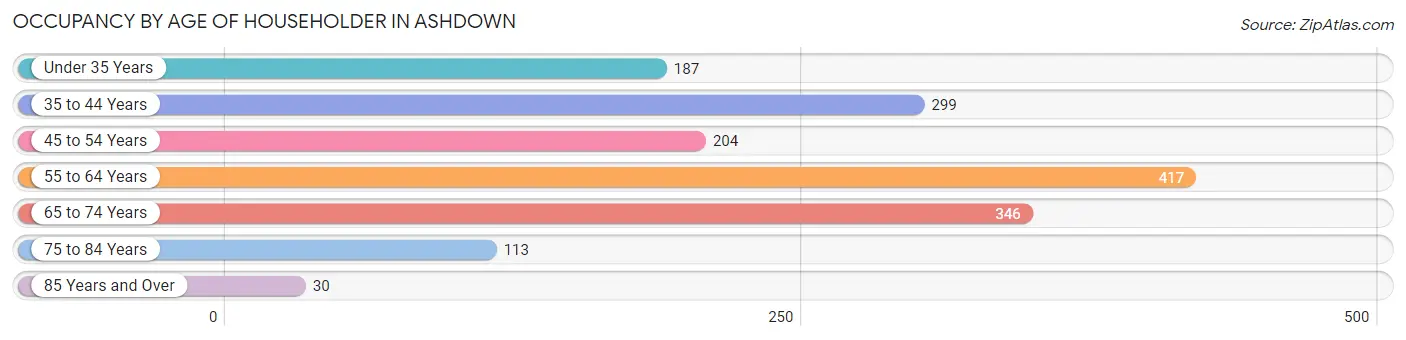
| Age Bracket | # Households | % Households |
| Under 35 Years | 187 | 11.7% |
| 35 to 44 Years | 299 | 18.7% |
| 45 to 54 Years | 204 | 12.8% |
| 55 to 64 Years | 417 | 26.1% |
| 65 to 74 Years | 346 | 21.7% |
| 75 to 84 Years | 113 | 7.1% |
| 85 Years and Over | 30 | 1.9% |
| Total | 1,596 | 100.0% |
Housing Finances in Ashdown
Median Income by Occupancy in Ashdown
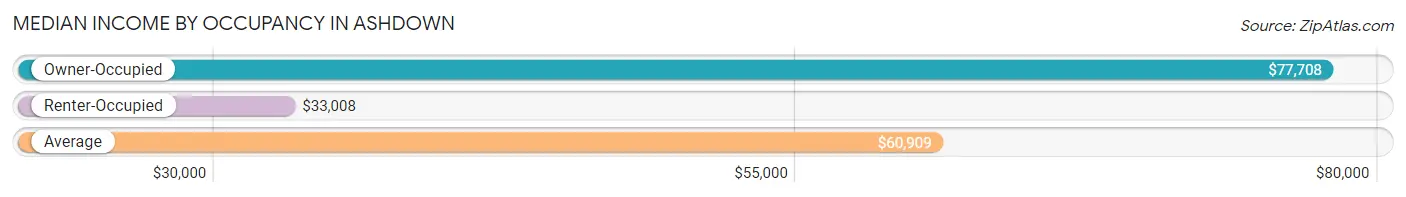
| Occupancy Type | # Households | Median Income |
| Owner-Occupied | 1,359 (85.2%) | $77,708 |
| Renter-Occupied | 237 (14.8%) | $33,008 |
| Average | 1,596 (100.0%) | $60,909 |
Occupancy by Householder Income Bracket in Ashdown
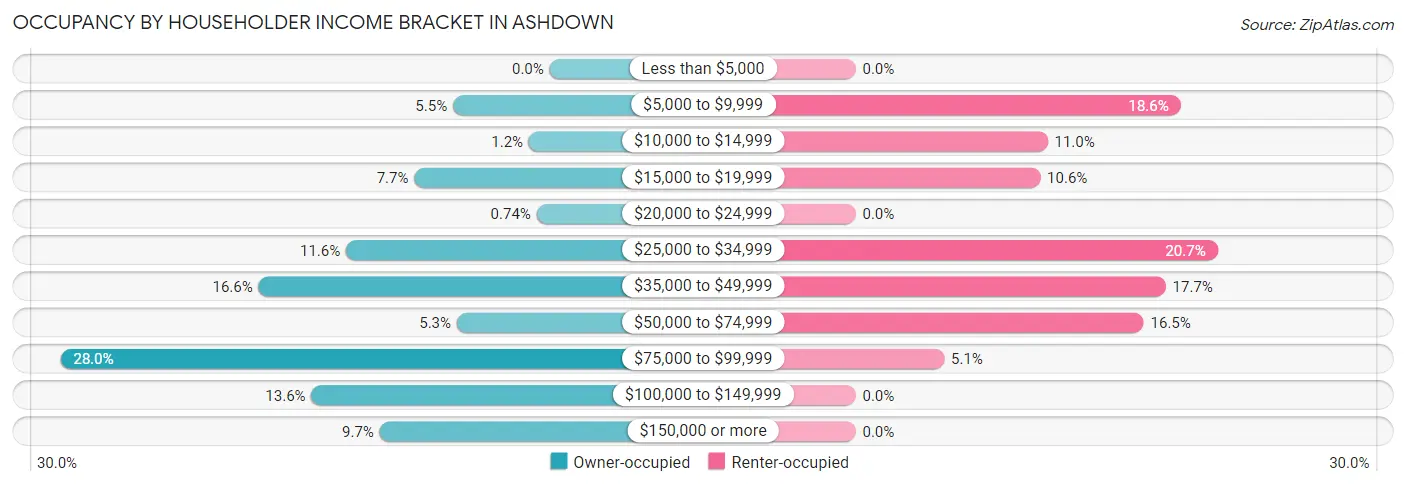
| Income Bracket | Owner-occupied | Renter-occupied |
| Less than $5,000 | 0 (0.0%) | 0 (0.0%) |
| $5,000 to $9,999 | 75 (5.5%) | 44 (18.6%) |
| $10,000 to $14,999 | 16 (1.2%) | 26 (11.0%) |
| $15,000 to $19,999 | 105 (7.7%) | 25 (10.5%) |
| $20,000 to $24,999 | 10 (0.7%) | 0 (0.0%) |
| $25,000 to $34,999 | 158 (11.6%) | 49 (20.7%) |
| $35,000 to $49,999 | 226 (16.6%) | 42 (17.7%) |
| $50,000 to $74,999 | 72 (5.3%) | 39 (16.5%) |
| $75,000 to $99,999 | 380 (28.0%) | 12 (5.1%) |
| $100,000 to $149,999 | 185 (13.6%) | 0 (0.0%) |
| $150,000 or more | 132 (9.7%) | 0 (0.0%) |
| Total | 1,359 (100.0%) | 237 (100.0%) |
Monthly Housing Cost Tiers in Ashdown
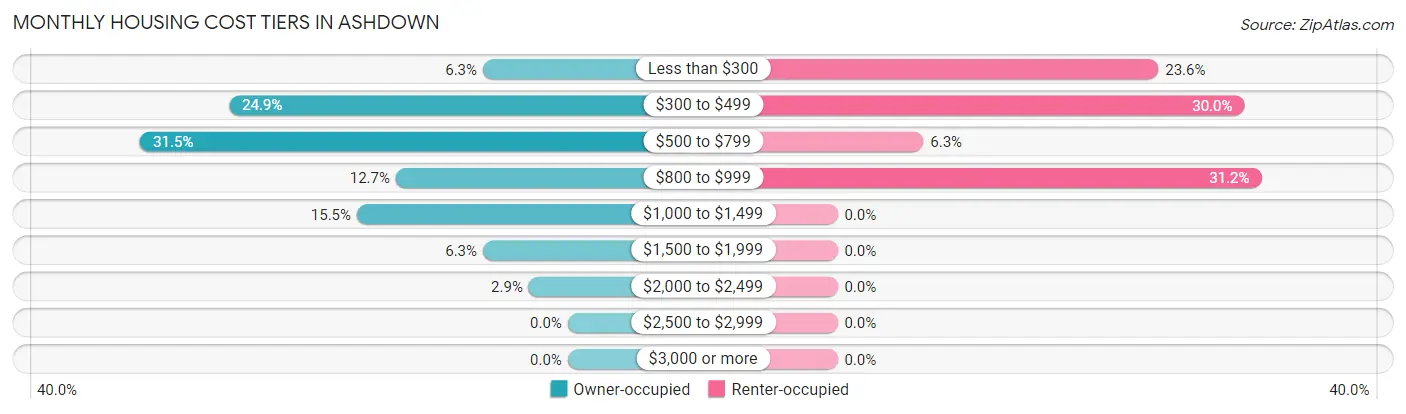
| Monthly Cost | Owner-occupied | Renter-occupied |
| Less than $300 | 85 (6.2%) | 56 (23.6%) |
| $300 to $499 | 339 (24.9%) | 71 (30.0%) |
| $500 to $799 | 428 (31.5%) | 15 (6.3%) |
| $800 to $999 | 172 (12.7%) | 74 (31.2%) |
| $1,000 to $1,499 | 211 (15.5%) | 0 (0.0%) |
| $1,500 to $1,999 | 85 (6.2%) | 0 (0.0%) |
| $2,000 to $2,499 | 39 (2.9%) | 0 (0.0%) |
| $2,500 to $2,999 | 0 (0.0%) | 0 (0.0%) |
| $3,000 or more | 0 (0.0%) | 0 (0.0%) |
| Total | 1,359 (100.0%) | 237 (100.0%) |
Physical Housing Characteristics in Ashdown
Housing Structures in Ashdown
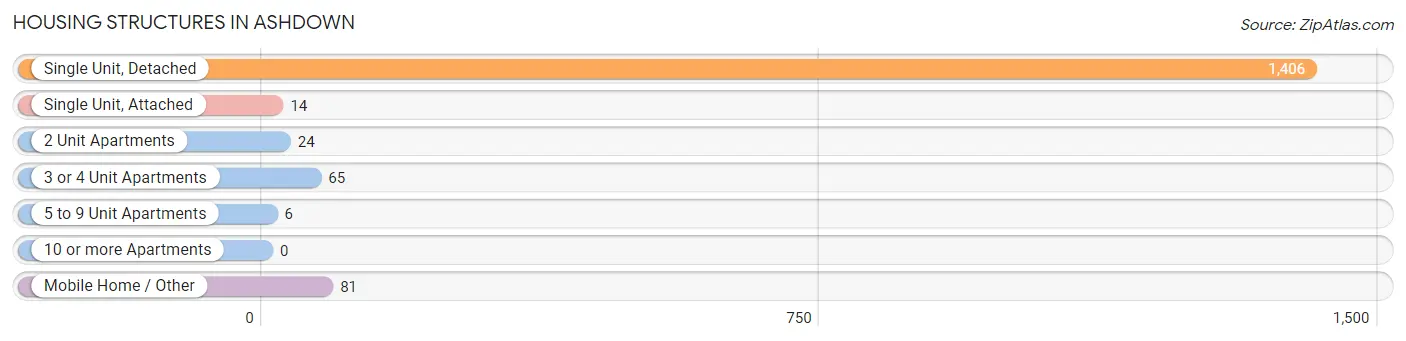
| Structure Type | # Housing Units | % Housing Units |
| Single Unit, Detached | 1,406 | 88.1% |
| Single Unit, Attached | 14 | 0.9% |
| 2 Unit Apartments | 24 | 1.5% |
| 3 or 4 Unit Apartments | 65 | 4.1% |
| 5 to 9 Unit Apartments | 6 | 0.4% |
| 10 or more Apartments | 0 | 0.0% |
| Mobile Home / Other | 81 | 5.1% |
| Total | 1,596 | 100.0% |
Housing Structures by Occupancy in Ashdown
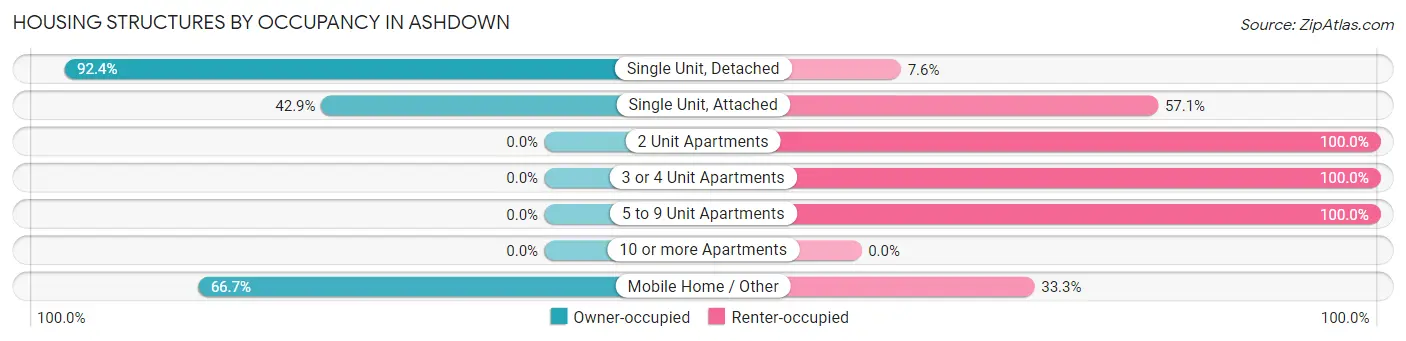
| Structure Type | Owner-occupied | Renter-occupied |
| Single Unit, Detached | 1,299 (92.4%) | 107 (7.6%) |
| Single Unit, Attached | 6 (42.9%) | 8 (57.1%) |
| 2 Unit Apartments | 0 (0.0%) | 24 (100.0%) |
| 3 or 4 Unit Apartments | 0 (0.0%) | 65 (100.0%) |
| 5 to 9 Unit Apartments | 0 (0.0%) | 6 (100.0%) |
| 10 or more Apartments | 0 (0.0%) | 0 (0.0%) |
| Mobile Home / Other | 54 (66.7%) | 27 (33.3%) |
| Total | 1,359 (85.2%) | 237 (14.8%) |
Housing Structures by Number of Rooms in Ashdown
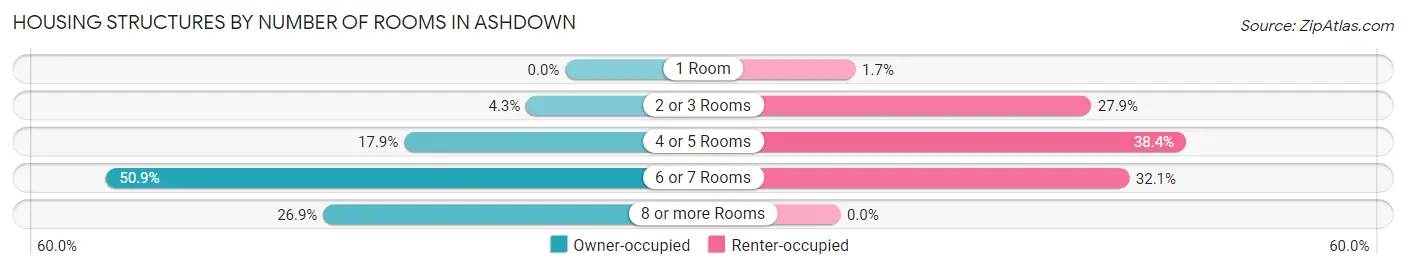
| Number of Rooms | Owner-occupied | Renter-occupied |
| 1 Room | 0 (0.0%) | 4 (1.7%) |
| 2 or 3 Rooms | 59 (4.3%) | 66 (27.9%) |
| 4 or 5 Rooms | 243 (17.9%) | 91 (38.4%) |
| 6 or 7 Rooms | 692 (50.9%) | 76 (32.1%) |
| 8 or more Rooms | 365 (26.9%) | 0 (0.0%) |
| Total | 1,359 (100.0%) | 237 (100.0%) |
Housing Structure by Heating Type in Ashdown
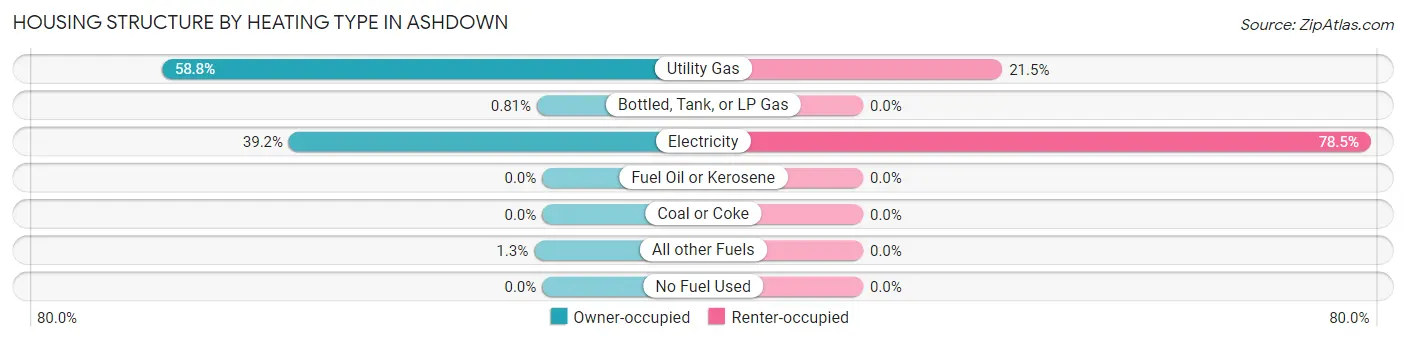
| Heating Type | Owner-occupied | Renter-occupied |
| Utility Gas | 799 (58.8%) | 51 (21.5%) |
| Bottled, Tank, or LP Gas | 11 (0.8%) | 0 (0.0%) |
| Electricity | 532 (39.2%) | 186 (78.5%) |
| Fuel Oil or Kerosene | 0 (0.0%) | 0 (0.0%) |
| Coal or Coke | 0 (0.0%) | 0 (0.0%) |
| All other Fuels | 17 (1.3%) | 0 (0.0%) |
| No Fuel Used | 0 (0.0%) | 0 (0.0%) |
| Total | 1,359 (100.0%) | 237 (100.0%) |
Household Vehicle Usage in Ashdown
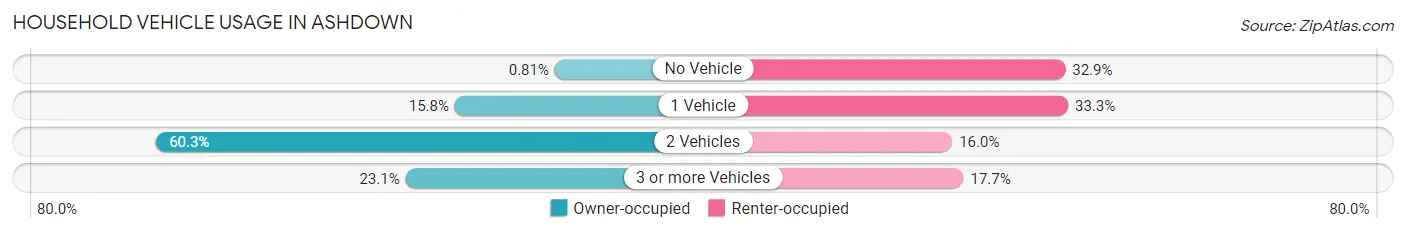
| Vehicles per Household | Owner-occupied | Renter-occupied |
| No Vehicle | 11 (0.8%) | 78 (32.9%) |
| 1 Vehicle | 214 (15.8%) | 79 (33.3%) |
| 2 Vehicles | 820 (60.3%) | 38 (16.0%) |
| 3 or more Vehicles | 314 (23.1%) | 42 (17.7%) |
| Total | 1,359 (100.0%) | 237 (100.0%) |
Real Estate & Mortgages in Ashdown
Real Estate and Mortgage Overview in Ashdown
| Characteristic | Without Mortgage | With Mortgage |
| Housing Units | 716 | 643 |
| Median Property Value | $160,200 | $119,200 |
| Median Household Income | $39,805 | $70 |
| Monthly Housing Costs | $460 | $0 |
| Real Estate Taxes | $562 | $71 |
Property Value by Mortgage Status in Ashdown
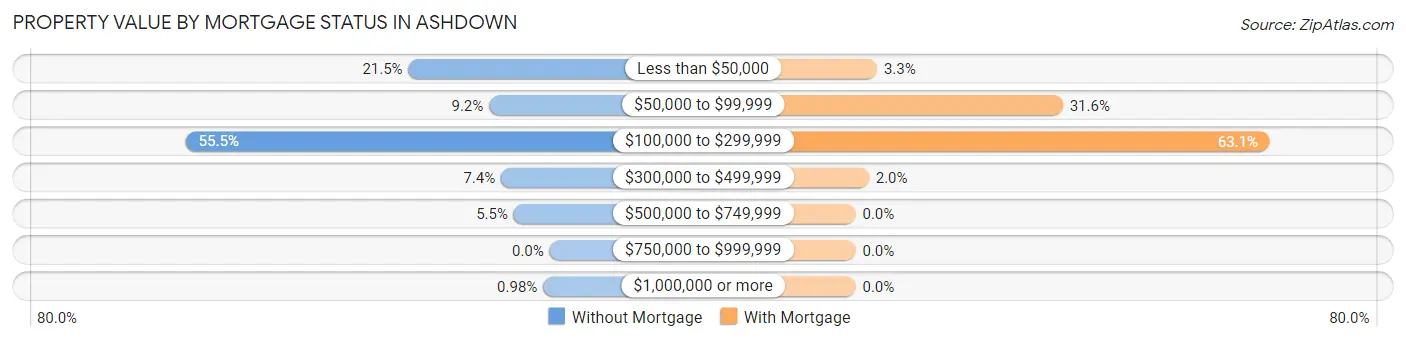
| Property Value | Without Mortgage | With Mortgage |
| Less than $50,000 | 154 (21.5%) | 21 (3.3%) |
| $50,000 to $99,999 | 66 (9.2%) | 203 (31.6%) |
| $100,000 to $299,999 | 397 (55.4%) | 406 (63.1%) |
| $300,000 to $499,999 | 53 (7.4%) | 13 (2.0%) |
| $500,000 to $749,999 | 39 (5.4%) | 0 (0.0%) |
| $750,000 to $999,999 | 0 (0.0%) | 0 (0.0%) |
| $1,000,000 or more | 7 (1.0%) | 0 (0.0%) |
| Total | 716 (100.0%) | 643 (100.0%) |
Household Income by Mortgage Status in Ashdown
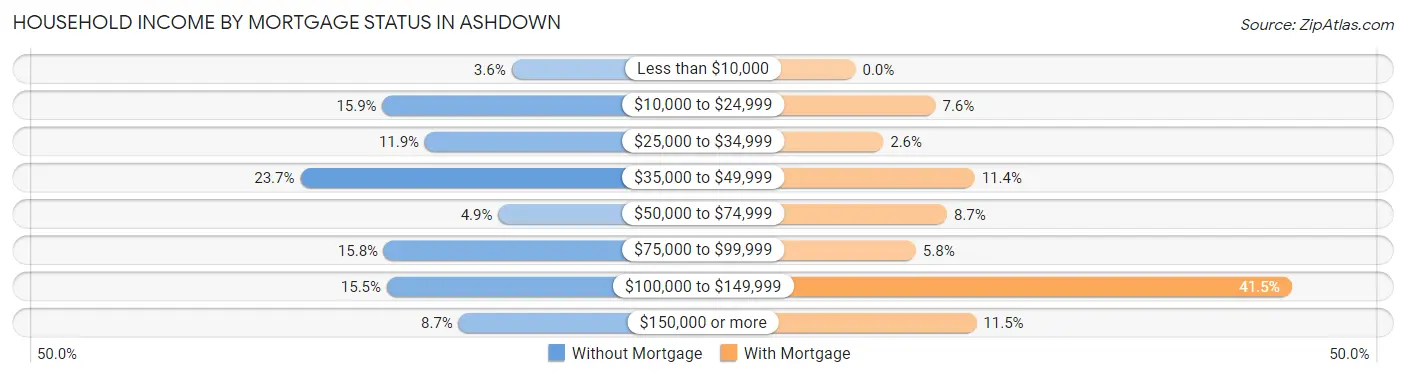
| Household Income | Without Mortgage | With Mortgage |
| Less than $10,000 | 26 (3.6%) | 0 (0.0%) |
| $10,000 to $24,999 | 114 (15.9%) | 49 (7.6%) |
| $25,000 to $34,999 | 85 (11.9%) | 17 (2.6%) |
| $35,000 to $49,999 | 170 (23.7%) | 73 (11.4%) |
| $50,000 to $74,999 | 35 (4.9%) | 56 (8.7%) |
| $75,000 to $99,999 | 113 (15.8%) | 37 (5.8%) |
| $100,000 to $149,999 | 111 (15.5%) | 267 (41.5%) |
| $150,000 or more | 62 (8.7%) | 74 (11.5%) |
| Total | 716 (100.0%) | 643 (100.0%) |
Property Value to Household Income Ratio in Ashdown
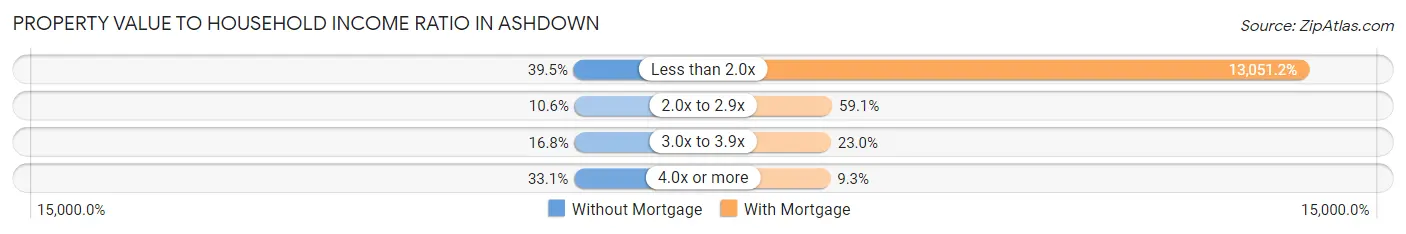
| Value-to-Income Ratio | Without Mortgage | With Mortgage |
| Less than 2.0x | 283 (39.5%) | 83,919 (13,051.2%) |
| 2.0x to 2.9x | 76 (10.6%) | 380 (59.1%) |
| 3.0x to 3.9x | 120 (16.8%) | 148 (23.0%) |
| 4.0x or more | 237 (33.1%) | 60 (9.3%) |
| Total | 716 (100.0%) | 643 (100.0%) |
Real Estate Taxes by Mortgage Status in Ashdown
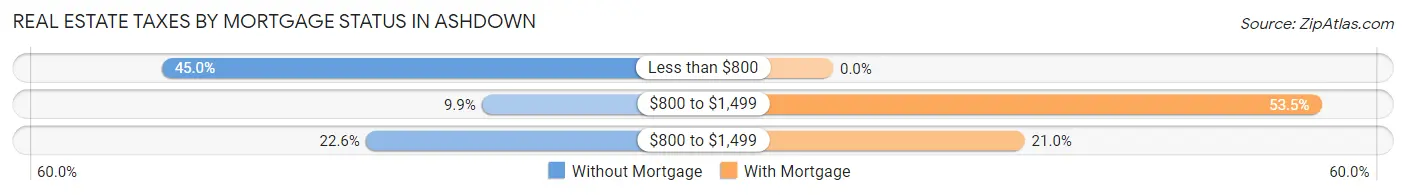
| Property Taxes | Without Mortgage | With Mortgage |
| Less than $800 | 322 (45.0%) | 0 (0.0%) |
| $800 to $1,499 | 71 (9.9%) | 344 (53.5%) |
| $800 to $1,499 | 162 (22.6%) | 135 (21.0%) |
| Total | 716 (100.0%) | 643 (100.0%) |
Health & Disability in Ashdown
Health Insurance Coverage by Age in Ashdown

| Age Bracket | With Coverage | Without Coverage |
| Under 6 Years | 220 (100.0%) | 0 (0.0%) |
| 6 to 18 Years | 795 (98.8%) | 10 (1.2%) |
| 19 to 25 Years | 410 (86.0%) | 67 (14.1%) |
| 26 to 34 Years | 339 (100.0%) | 0 (0.0%) |
| 35 to 44 Years | 413 (81.0%) | 97 (19.0%) |
| 45 to 54 Years | 430 (97.3%) | 12 (2.7%) |
| 55 to 64 Years | 582 (96.4%) | 22 (3.6%) |
| 65 to 74 Years | 409 (100.0%) | 0 (0.0%) |
| 75 Years and older | 300 (100.0%) | 0 (0.0%) |
| Total | 3,898 (94.9%) | 208 (5.1%) |
Health Insurance Coverage by Citizenship Status in Ashdown
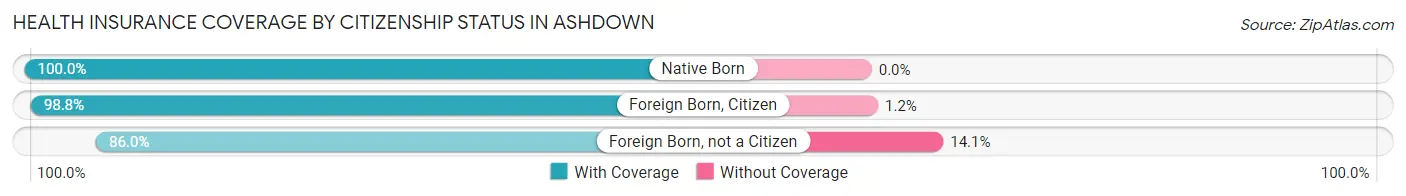
| Citizenship Status | With Coverage | Without Coverage |
| Native Born | 220 (100.0%) | 0 (0.0%) |
| Foreign Born, Citizen | 795 (98.8%) | 10 (1.2%) |
| Foreign Born, not a Citizen | 410 (86.0%) | 67 (14.1%) |
Health Insurance Coverage by Household Income in Ashdown
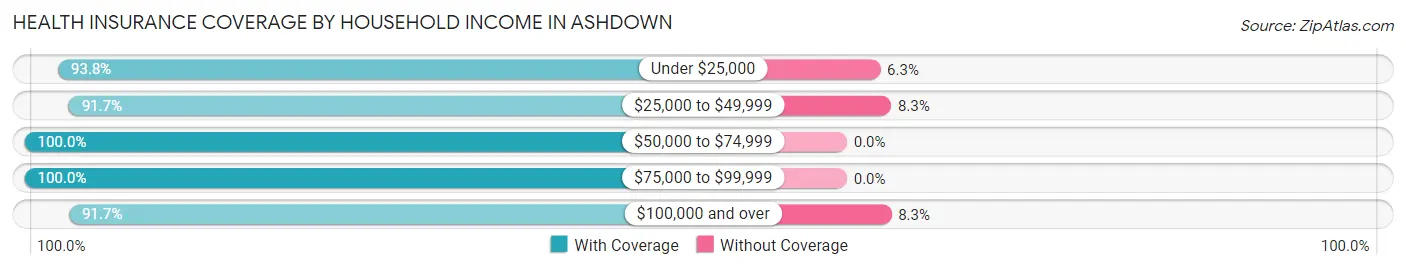
| Household Income | With Coverage | Without Coverage |
| Under $25,000 | 600 (93.8%) | 40 (6.2%) |
| $25,000 to $49,999 | 865 (91.7%) | 78 (8.3%) |
| $50,000 to $74,999 | 305 (100.0%) | 0 (0.0%) |
| $75,000 to $99,999 | 1,128 (100.0%) | 0 (0.0%) |
| $100,000 and over | 992 (91.7%) | 90 (8.3%) |
Public vs Private Health Insurance Coverage by Age in Ashdown
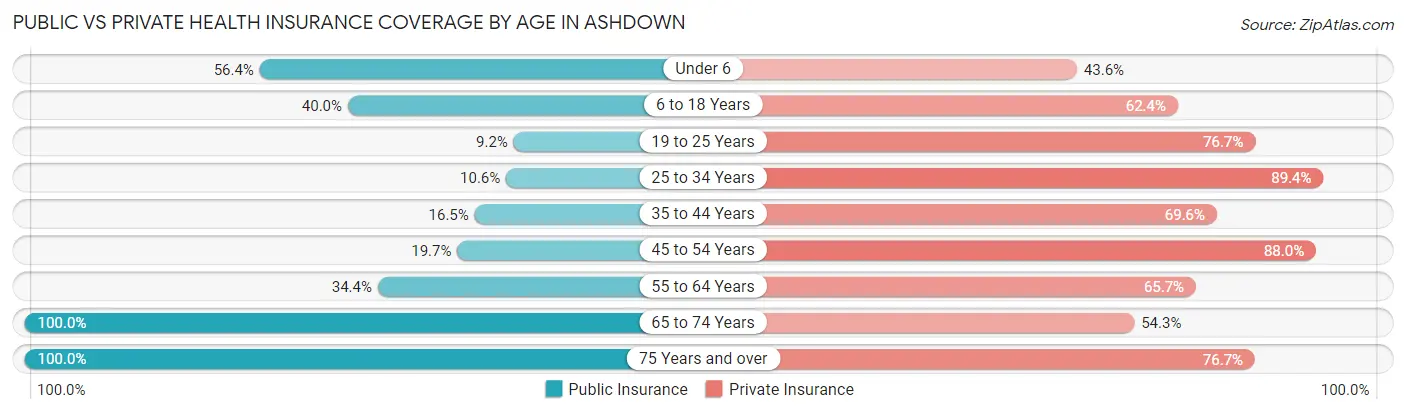
| Age Bracket | Public Insurance | Private Insurance |
| Under 6 | 124 (56.4%) | 96 (43.6%) |
| 6 to 18 Years | 322 (40.0%) | 502 (62.4%) |
| 19 to 25 Years | 44 (9.2%) | 366 (76.7%) |
| 25 to 34 Years | 36 (10.6%) | 303 (89.4%) |
| 35 to 44 Years | 84 (16.5%) | 355 (69.6%) |
| 45 to 54 Years | 87 (19.7%) | 389 (88.0%) |
| 55 to 64 Years | 208 (34.4%) | 397 (65.7%) |
| 65 to 74 Years | 409 (100.0%) | 222 (54.3%) |
| 75 Years and over | 300 (100.0%) | 230 (76.7%) |
| Total | 1,614 (39.3%) | 2,860 (69.7%) |
Disability Status by Sex by Age in Ashdown
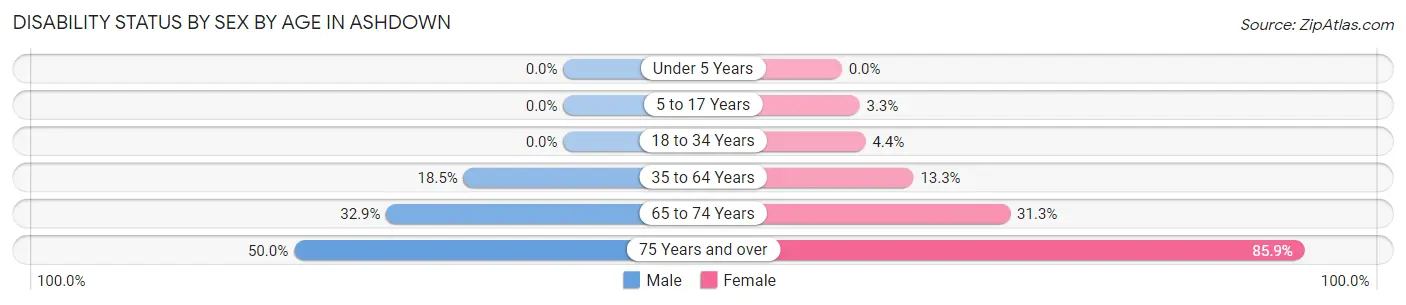
| Age Bracket | Male | Female |
| Under 5 Years | 0 (0.0%) | 0 (0.0%) |
| 5 to 17 Years | 0 (0.0%) | 12 (3.3%) |
| 18 to 34 Years | 0 (0.0%) | 18 (4.4%) |
| 35 to 64 Years | 121 (18.5%) | 120 (13.3%) |
| 65 to 74 Years | 45 (32.9%) | 85 (31.2%) |
| 75 Years and over | 40 (50.0%) | 189 (85.9%) |
Disability Class by Sex by Age in Ashdown
Disability Class: Hearing Difficulty
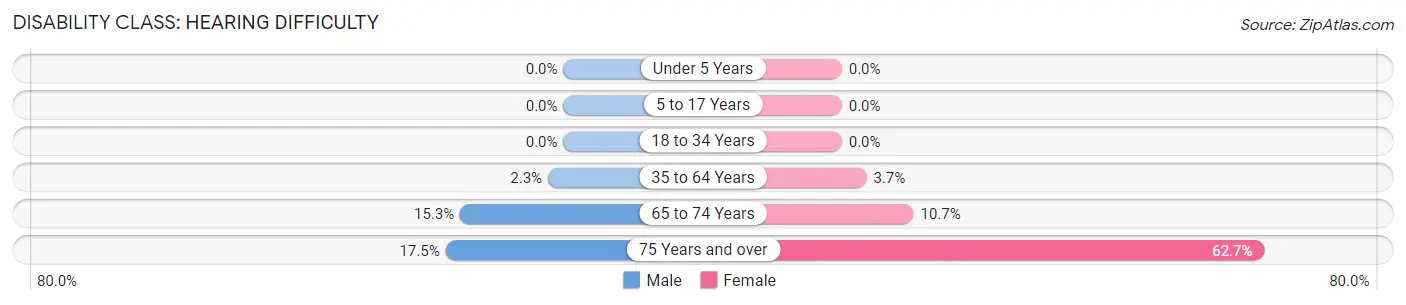
| Age Bracket | Male | Female |
| Under 5 Years | 0 (0.0%) | 0 (0.0%) |
| 5 to 17 Years | 0 (0.0%) | 0 (0.0%) |
| 18 to 34 Years | 0 (0.0%) | 0 (0.0%) |
| 35 to 64 Years | 15 (2.3%) | 33 (3.7%) |
| 65 to 74 Years | 21 (15.3%) | 29 (10.7%) |
| 75 Years and over | 14 (17.5%) | 138 (62.7%) |
Disability Class: Vision Difficulty
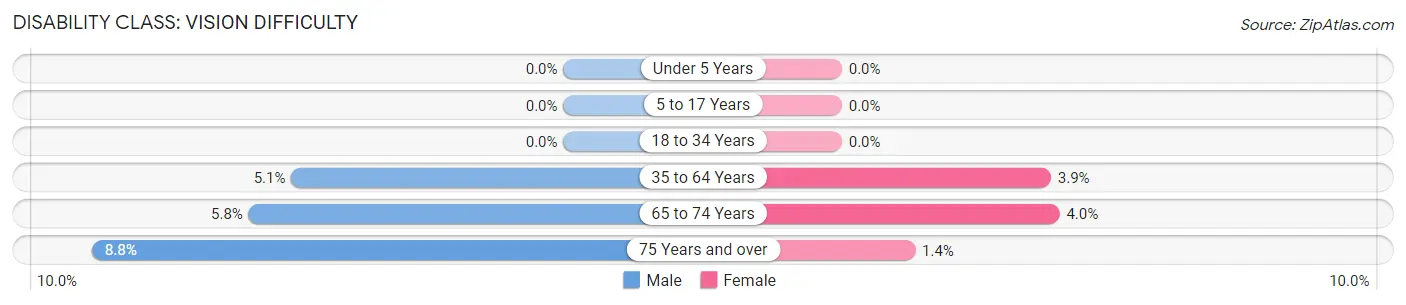
| Age Bracket | Male | Female |
| Under 5 Years | 0 (0.0%) | 0 (0.0%) |
| 5 to 17 Years | 0 (0.0%) | 0 (0.0%) |
| 18 to 34 Years | 0 (0.0%) | 0 (0.0%) |
| 35 to 64 Years | 33 (5.1%) | 35 (3.9%) |
| 65 to 74 Years | 8 (5.8%) | 11 (4.0%) |
| 75 Years and over | 7 (8.7%) | 3 (1.4%) |
Disability Class: Cognitive Difficulty

| Age Bracket | Male | Female |
| 5 to 17 Years | 0 (0.0%) | 12 (3.3%) |
| 18 to 34 Years | 0 (0.0%) | 18 (4.4%) |
| 35 to 64 Years | 51 (7.8%) | 35 (3.9%) |
| 65 to 74 Years | 0 (0.0%) | 12 (4.4%) |
| 75 Years and over | 13 (16.3%) | 34 (15.4%) |
Disability Class: Ambulatory Difficulty
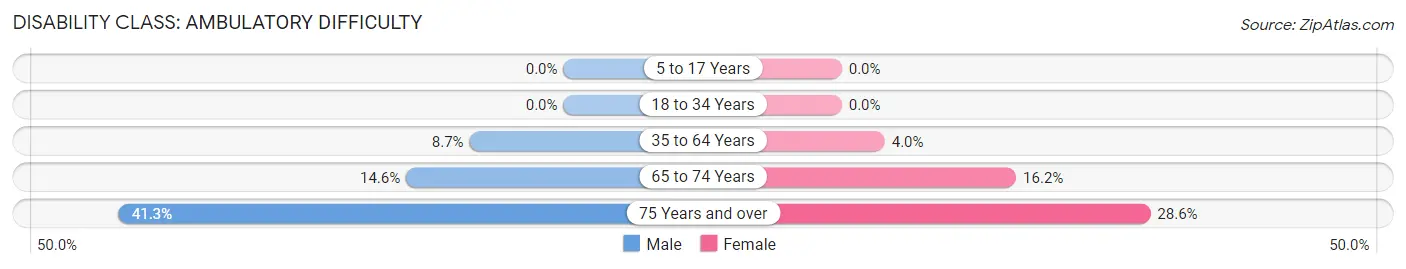
| Age Bracket | Male | Female |
| 5 to 17 Years | 0 (0.0%) | 0 (0.0%) |
| 18 to 34 Years | 0 (0.0%) | 0 (0.0%) |
| 35 to 64 Years | 57 (8.7%) | 36 (4.0%) |
| 65 to 74 Years | 20 (14.6%) | 44 (16.2%) |
| 75 Years and over | 33 (41.2%) | 63 (28.6%) |
Disability Class: Self-Care Difficulty
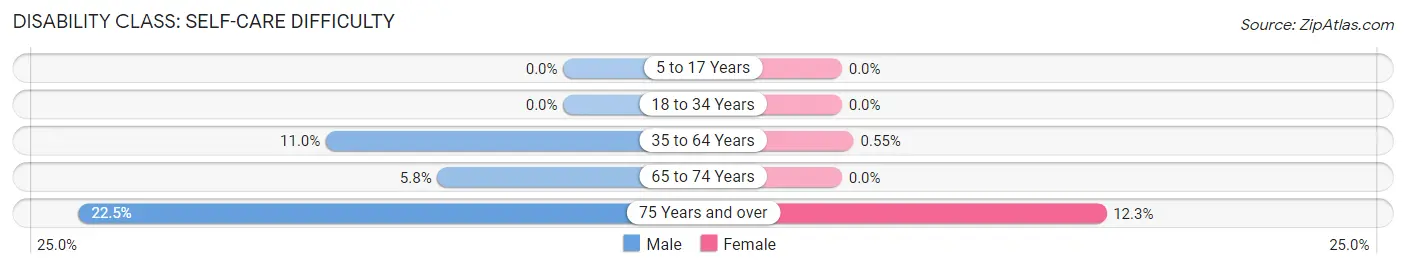
| Age Bracket | Male | Female |
| 5 to 17 Years | 0 (0.0%) | 0 (0.0%) |
| 18 to 34 Years | 0 (0.0%) | 0 (0.0%) |
| 35 to 64 Years | 72 (11.0%) | 5 (0.5%) |
| 65 to 74 Years | 8 (5.8%) | 0 (0.0%) |
| 75 Years and over | 18 (22.5%) | 27 (12.3%) |
Technology Access in Ashdown
Computing Device Access in Ashdown
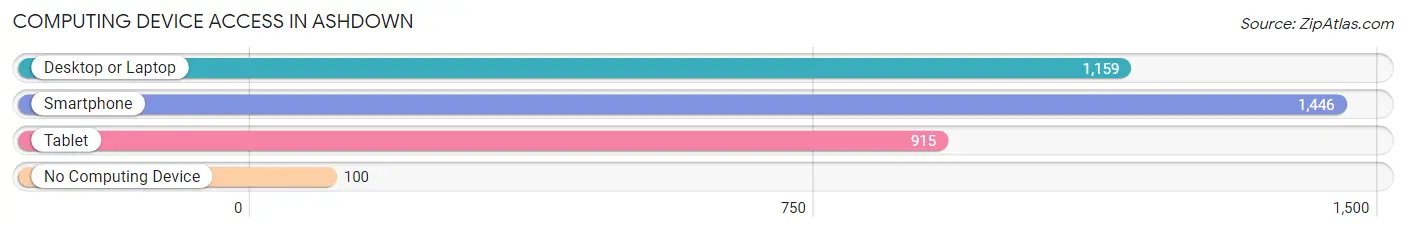
| Device Type | # Households | % Households |
| Desktop or Laptop | 1,159 | 72.6% |
| Smartphone | 1,446 | 90.6% |
| Tablet | 915 | 57.3% |
| No Computing Device | 100 | 6.3% |
| Total | 1,596 | 100.0% |
Internet Access in Ashdown
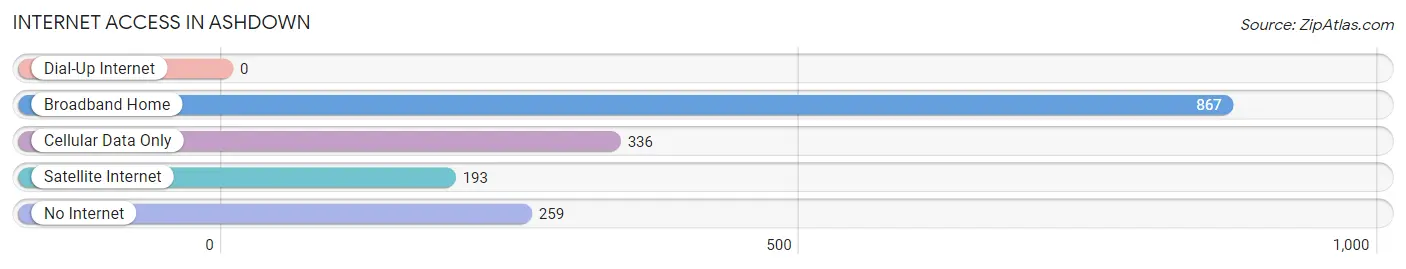
| Internet Type | # Households | % Households |
| Dial-Up Internet | 0 | 0.0% |
| Broadband Home | 867 | 54.3% |
| Cellular Data Only | 336 | 21.0% |
| Satellite Internet | 193 | 12.1% |
| No Internet | 259 | 16.2% |
| Total | 1,596 | 100.0% |
Ashdown Summary
Ashdown, Arkansas is a small city located in Little River County in the southwestern corner of the state. It is situated on the banks of the Little River, near the Texas border. The city has a population of approximately 4,000 people and is the county seat of Little River County.
History
The area that is now Ashdown was first settled in the early 1800s by settlers from the Choctaw Nation. The town was originally known as “Little River” and was established in 1872. The town was renamed Ashdown in 1882, after a nearby creek. The name was chosen to honor the first postmaster, William Ashdown.
The town was incorporated in 1883 and quickly became a center of commerce and industry. The first railroad line was built in 1885, connecting Ashdown to nearby towns and cities. This allowed the town to become a major shipping hub for the region.
In the early 1900s, the town experienced a period of growth and prosperity. The population increased from 1,000 in 1900 to over 4,000 by the mid-1920s. During this time, the town was home to several businesses, including a cotton gin, a sawmill, and a brick factory.
Geography
Ashdown is located in the southwestern corner of Arkansas, near the Texas border. The city is situated on the banks of the Little River, which flows through the city. The city is surrounded by rolling hills and forests, and is located in the foothills of the Ouachita Mountains.
The climate in Ashdown is humid subtropical, with hot summers and mild winters. The average annual temperature is around 65 degrees Fahrenheit. The average annual precipitation is around 45 inches.
Economy
The economy of Ashdown is largely based on agriculture and manufacturing. The city is home to several large farms, which produce cotton, soybeans, and other crops. The city is also home to several manufacturing companies, which produce a variety of products, including furniture, clothing, and electronics.
The city is also home to several retail stores, restaurants, and other businesses. The city is served by several major highways, which connect it to nearby towns and cities.
Demographics
As of the 2010 census, the population of Ashdown was 4,084. The racial makeup of the city was 79.3% White, 17.2% African American, 0.7% Native American, 0.3% Asian, 0.1% Pacific Islander, and 2.4% from other races. Hispanic or Latino of any race were 2.7% of the population.
The median household income in Ashdown was $30,938, and the median family income was $37,813. The per capita income was $17,845. About 17.2% of the population was below the poverty line.
Ashdown is served by the Little River County School District. The city is home to several churches, including Baptist, Methodist, and Catholic. The city is also home to several parks and recreational facilities, including a golf course, a swimming pool, and a tennis court.
Common Questions
What is Per Capita Income in Ashdown?
Per Capita income in Ashdown is $26,596.
What is the Median Family Income in Ashdown?
Median Family Income in Ashdown is $80,186.
What is the Median Household income in Ashdown?
Median Household Income in Ashdown is $60,909.
What is Income or Wage Gap in Ashdown?
Income or Wage Gap in Ashdown is 8.5%.
Women in Ashdown earn 91.5 cents for every dollar earned by a man.
What is Inequality or Gini Index in Ashdown?
Inequality or Gini Index in Ashdown is 0.40.
What is the Total Population of Ashdown?
Total Population of Ashdown is 4,264.
What is the Total Male Population of Ashdown?
Total Male Population of Ashdown is 1,859.
What is the Total Female Population of Ashdown?
Total Female Population of Ashdown is 2,405.
What is the Ratio of Males per 100 Females in Ashdown?
There are 77.30 Males per 100 Females in Ashdown.
What is the Ratio of Females per 100 Males in Ashdown?
There are 129.37 Females per 100 Males in Ashdown.
What is the Median Population Age in Ashdown?
Median Population Age in Ashdown is 42.1 Years.
What is the Average Family Size in Ashdown
Average Family Size in Ashdown is 3.1 People.
What is the Average Household Size in Ashdown
Average Household Size in Ashdown is 2.6 People.
How Large is the Labor Force in Ashdown?
There are 1,970 People in the Labor Forcein in Ashdown.
What is the Percentage of People in the Labor Force in Ashdown?
57.8% of People are in the Labor Force in Ashdown.
What is the Unemployment Rate in Ashdown?
Unemployment Rate in Ashdown is 10.5%.