Cherokee Village, AR Map & Demographics
Cherokee Village Map
Cherokee Village Overview
$23,247
PER CAPITA INCOME
$53,561
AVG FAMILY INCOME
$35,257
AVG HOUSEHOLD INCOME
14.0%
WAGE / INCOME GAP [ % ]
86.0¢/ $1
WAGE / INCOME GAP [ $ ]
0.43
INEQUALITY / GINI INDEX
5,061
TOTAL POPULATION
2,667
MALE POPULATION
2,394
FEMALE POPULATION
111.40
MALES / 100 FEMALES
89.76
FEMALES / 100 MALES
49.0
MEDIAN AGE
3.1
AVG FAMILY SIZE
2.4
AVG HOUSEHOLD SIZE
1,717
LABOR FORCE [ PEOPLE ]
42.1%
PERCENT IN LABOR FORCE
12.0%
UNEMPLOYMENT RATE
Cherokee Village Zip Codes
Cherokee Village Area Codes
Income in Cherokee Village
Income Overview in Cherokee Village
Per Capita Income in Cherokee Village is $23,247, while median incomes of families and households are $53,561 and $35,257 respectively.
| Characteristic | Number | Measure |
| Per Capita Income | 5,061 | $23,247 |
| Median Family Income | 1,294 | $53,561 |
| Mean Family Income | 1,294 | $66,023 |
| Median Household Income | 2,083 | $35,257 |
| Mean Household Income | 2,083 | $54,730 |
| Income Deficit | 1,294 | $0 |
| Wage / Income Gap (%) | 5,061 | 13.99% |
| Wage / Income Gap ($) | 5,061 | 86.01¢ per $1 |
| Gini / Inequality Index | 5,061 | 0.43 |
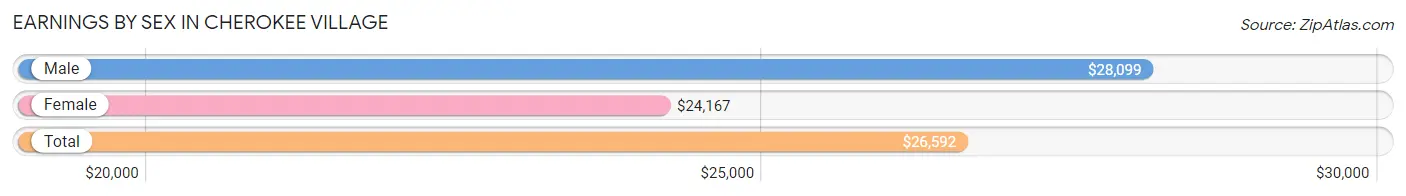
Earnings by Sex in Cherokee Village
Average Earnings in Cherokee Village are $26,592, $28,099 for men and $24,167 for women, a difference of 14.0%.
| Sex | Number | Average Earnings |
| Male | 1,045 (58.7%) | $28,099 |
| Female | 734 (41.3%) | $24,167 |
| Total | 1,779 (100.0%) | $26,592 |
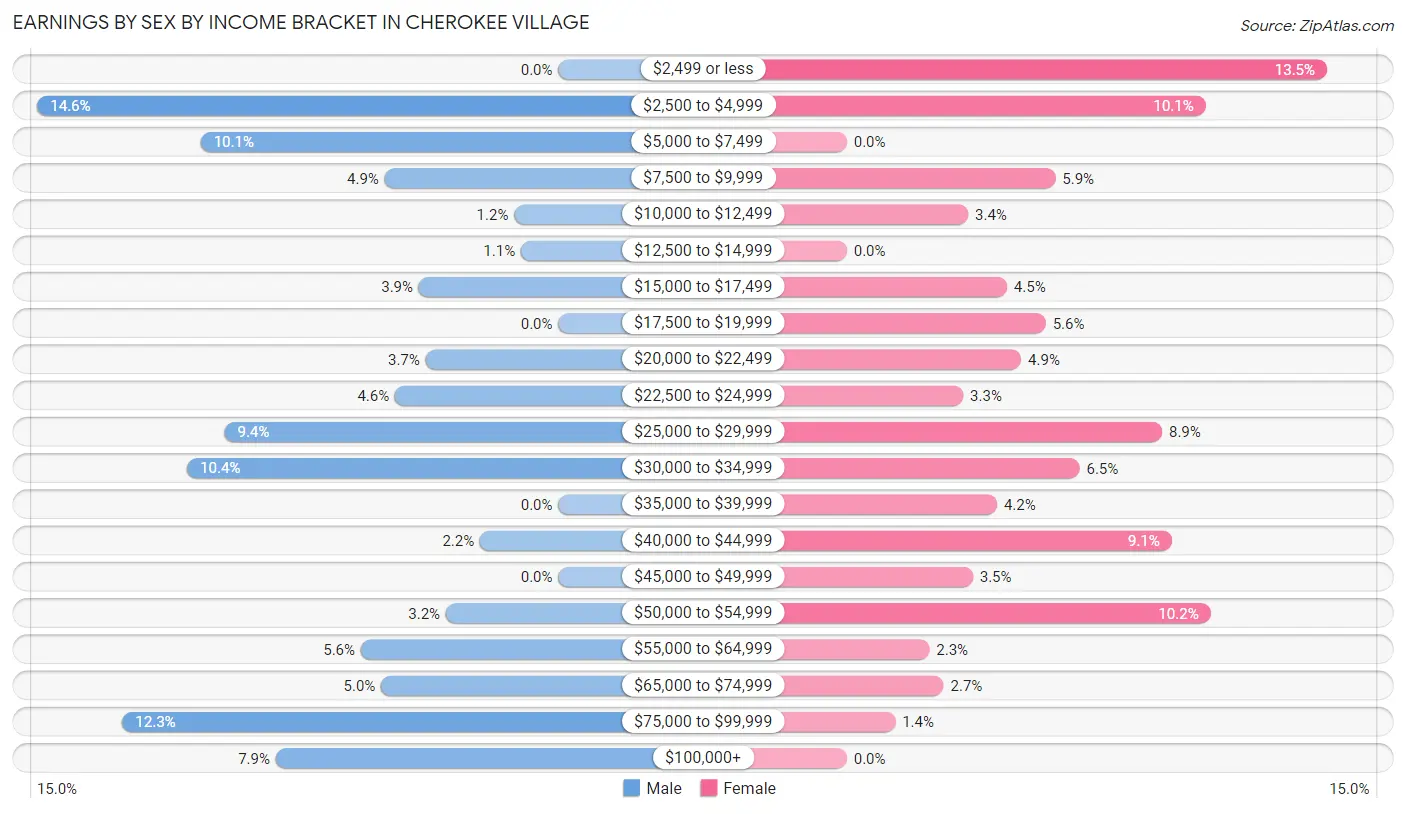
Earnings by Sex by Income Bracket in Cherokee Village
The most common earnings brackets in Cherokee Village are $2,500 to $4,999 for men (153 | 14.6%) and $2,499 or less for women (99 | 13.5%).
| Income | Male | Female |
| $2,499 or less | 0 (0.0%) | 99 (13.5%) |
| $2,500 to $4,999 | 153 (14.6%) | 74 (10.1%) |
| $5,000 to $7,499 | 105 (10.1%) | 0 (0.0%) |
| $7,500 to $9,999 | 51 (4.9%) | 43 (5.9%) |
| $10,000 to $12,499 | 13 (1.2%) | 25 (3.4%) |
| $12,500 to $14,999 | 11 (1.1%) | 0 (0.0%) |
| $15,000 to $17,499 | 41 (3.9%) | 33 (4.5%) |
| $17,500 to $19,999 | 0 (0.0%) | 41 (5.6%) |
| $20,000 to $22,499 | 39 (3.7%) | 36 (4.9%) |
| $22,500 to $24,999 | 48 (4.6%) | 24 (3.3%) |
| $25,000 to $29,999 | 98 (9.4%) | 65 (8.9%) |
| $30,000 to $34,999 | 109 (10.4%) | 48 (6.5%) |
| $35,000 to $39,999 | 0 (0.0%) | 31 (4.2%) |
| $40,000 to $44,999 | 23 (2.2%) | 67 (9.1%) |
| $45,000 to $49,999 | 0 (0.0%) | 26 (3.5%) |
| $50,000 to $54,999 | 33 (3.2%) | 75 (10.2%) |
| $55,000 to $64,999 | 58 (5.6%) | 17 (2.3%) |
| $65,000 to $74,999 | 52 (5.0%) | 20 (2.7%) |
| $75,000 to $99,999 | 128 (12.2%) | 10 (1.4%) |
| $100,000+ | 83 (7.9%) | 0 (0.0%) |
| Total | 1,045 (100.0%) | 734 (100.0%) |
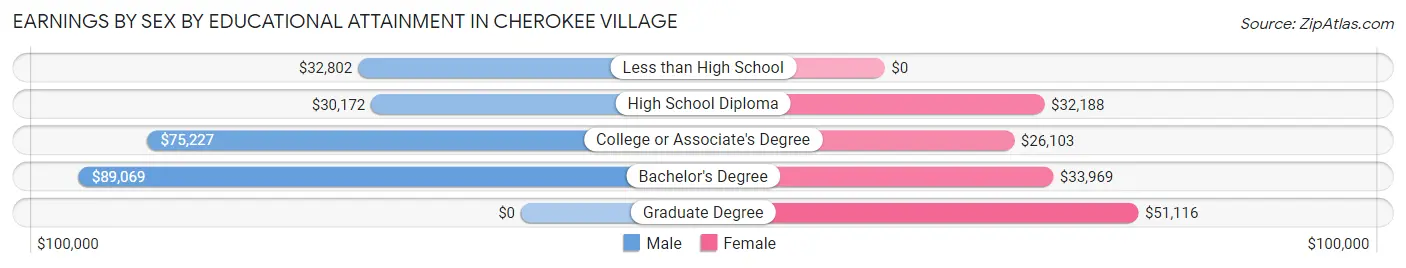
Earnings by Sex by Educational Attainment in Cherokee Village
Average earnings in Cherokee Village are $43,424 for men and $29,919 for women, a difference of 31.1%. Men with an educational attainment of bachelor's degree enjoy the highest average annual earnings of $89,069, while those with high school diploma education earn the least with $30,172. Women with an educational attainment of graduate degree earn the most with the average annual earnings of $51,116, while those with college or associate's degree education have the smallest earnings of $26,103.
| Educational Attainment | Male Income | Female Income |
| Less than High School | $32,802 | $0 |
| High School Diploma | $30,172 | $32,188 |
| College or Associate's Degree | $75,227 | $26,103 |
| Bachelor's Degree | $89,069 | $33,969 |
| Graduate Degree | - | - |
| Total | $43,424 | $29,919 |
Family Income in Cherokee Village
Family Income Brackets in Cherokee Village
According to the Cherokee Village family income data, there are 230 families falling into the $25,000 to $34,999 income range, which is the most common income bracket and makes up 17.8% of all families. Conversely, the $200,000+ income bracket is the least frequent group with only 16 families (1.2%) belonging to this category.
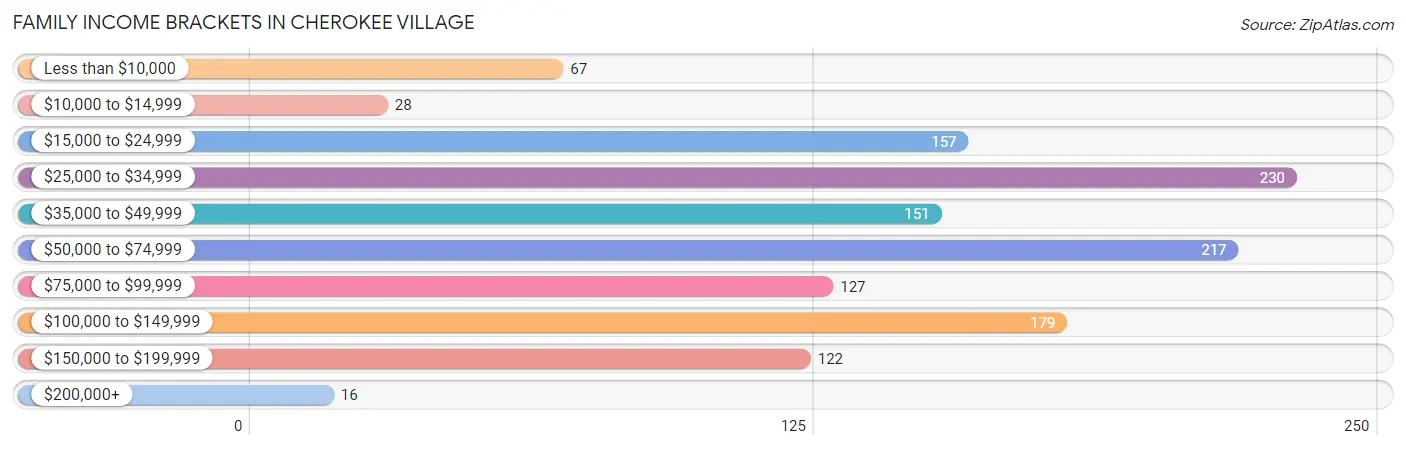
| Income Bracket | # Families | % Families |
| Less than $10,000 | 67 | 5.2% |
| $10,000 to $14,999 | 28 | 2.2% |
| $15,000 to $24,999 | 157 | 12.1% |
| $25,000 to $34,999 | 230 | 17.8% |
| $35,000 to $49,999 | 151 | 11.7% |
| $50,000 to $74,999 | 217 | 16.8% |
| $75,000 to $99,999 | 127 | 9.8% |
| $100,000 to $149,999 | 179 | 13.8% |
| $150,000 to $199,999 | 122 | 9.4% |
| $200,000+ | 16 | 1.2% |
Family Income by Famaliy Size in Cherokee Village
4-person families (151 | 11.7%) account for the highest median family income in Cherokee Village with $104,388 per family, while 4-person families (151 | 11.7%) have the highest median income of $26,097 per family member.
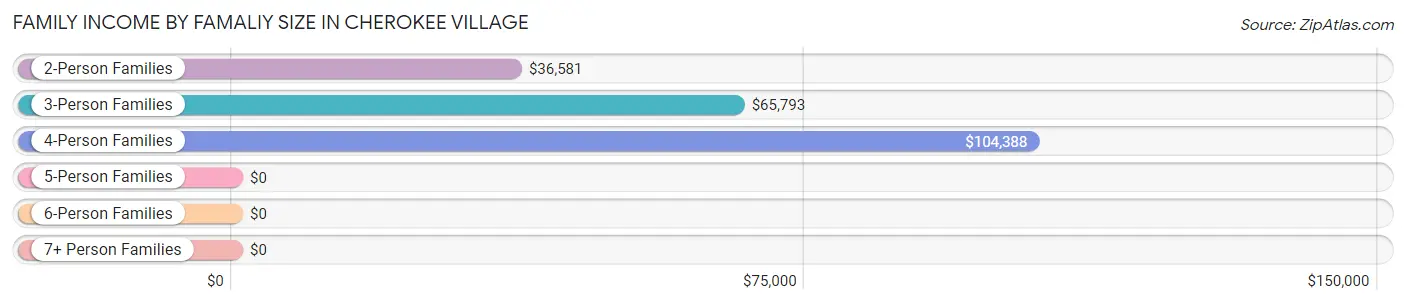
| Income Bracket | # Families | Median Income |
| 2-Person Families | 735 (56.8%) | $36,581 |
| 3-Person Families | 219 (16.9%) | $65,793 |
| 4-Person Families | 151 (11.7%) | $104,388 |
| 5-Person Families | 156 (12.1%) | $0 |
| 6-Person Families | 24 (1.8%) | $0 |
| 7+ Person Families | 9 (0.7%) | $0 |
| Total | 1,294 (100.0%) | $53,561 |
Family Income by Number of Earners in Cherokee Village
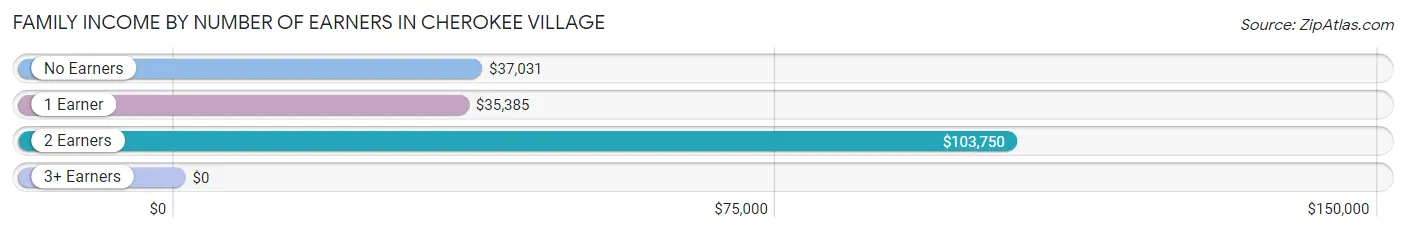
| Number of Earners | # Families | Median Income |
| No Earners | 449 (34.7%) | $37,031 |
| 1 Earner | 466 (36.0%) | $35,385 |
| 2 Earners | 339 (26.2%) | $103,750 |
| 3+ Earners | 40 (3.1%) | $0 |
| Total | 1,294 (100.0%) | $53,561 |
Household Income in Cherokee Village
Household Income Brackets in Cherokee Village
With 444 households falling in the category, the $25,000 to $34,999 income range is the most frequent in Cherokee Village, accounting for 21.3% of all households. In contrast, only 15 households (0.7%) fall into the $200,000+ income bracket, making it the least populous group.
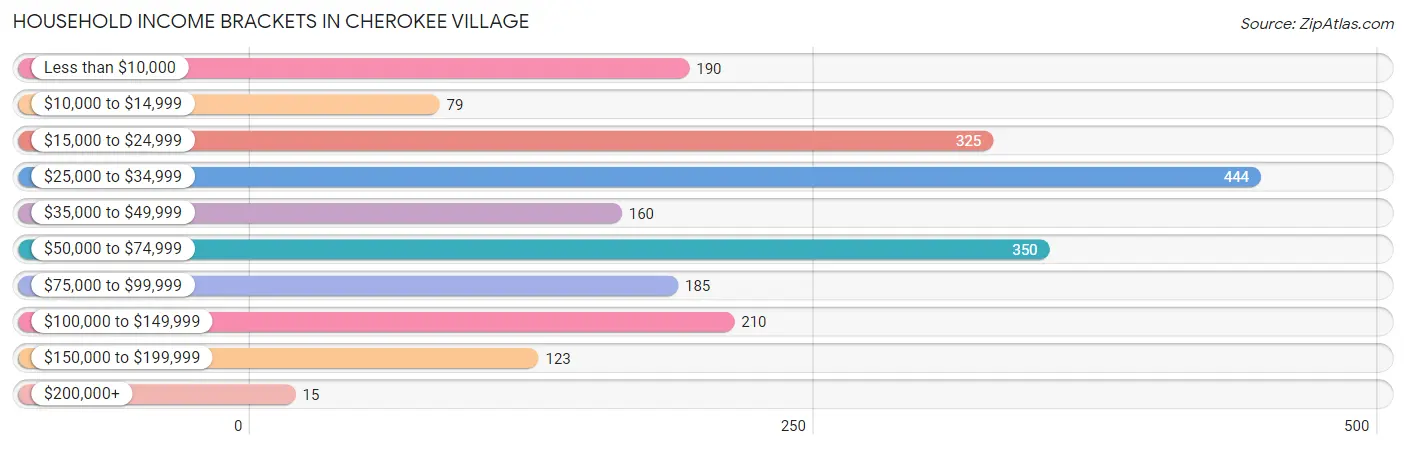
| Income Bracket | # Households | % Households |
| Less than $10,000 | 190 | 9.1% |
| $10,000 to $14,999 | 79 | 3.8% |
| $15,000 to $24,999 | 325 | 15.6% |
| $25,000 to $34,999 | 444 | 21.3% |
| $35,000 to $49,999 | 160 | 7.7% |
| $50,000 to $74,999 | 350 | 16.8% |
| $75,000 to $99,999 | 185 | 8.9% |
| $100,000 to $149,999 | 210 | 10.1% |
| $150,000 to $199,999 | 123 | 5.9% |
| $200,000+ | 15 | 0.7% |
Household Income by Householder Age in Cherokee Village
The median household income in Cherokee Village is $35,257, with the highest median household income of $57,727 found in the 25 to 44 years age bracket for the primary householder. A total of 448 households (21.5%) fall into this category. Meanwhile, the 15 to 24 years age bracket for the primary householder has the lowest median household income of $0, with 50 households (2.4%) in this group.
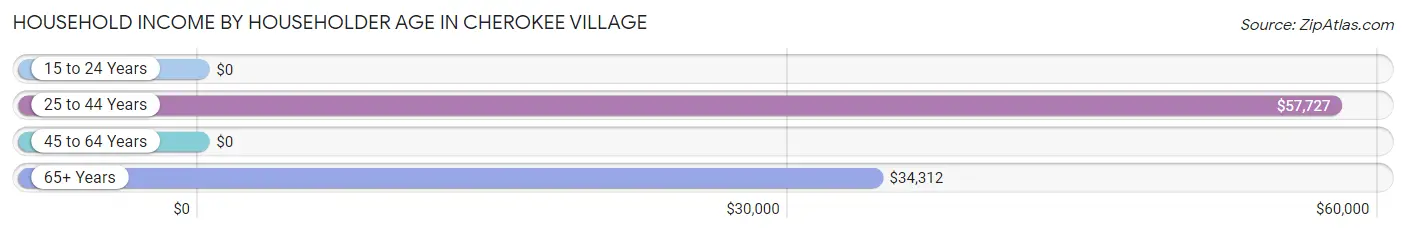
| Income Bracket | # Households | Median Income |
| 15 to 24 Years | 50 (2.4%) | $0 |
| 25 to 44 Years | 448 (21.5%) | $57,727 |
| 45 to 64 Years | 710 (34.1%) | $0 |
| 65+ Years | 875 (42.0%) | $34,312 |
| Total | 2,083 (100.0%) | $35,257 |
Poverty in Cherokee Village
Income Below Poverty by Sex and Age in Cherokee Village
With 12.2% poverty level for males and 17.8% for females among the residents of Cherokee Village, under 5 year old males and 16 and 17 year old females are the most vulnerable to poverty, with 114 males (53.5%) and 37 females (100.0%) in their respective age groups living below the poverty level.
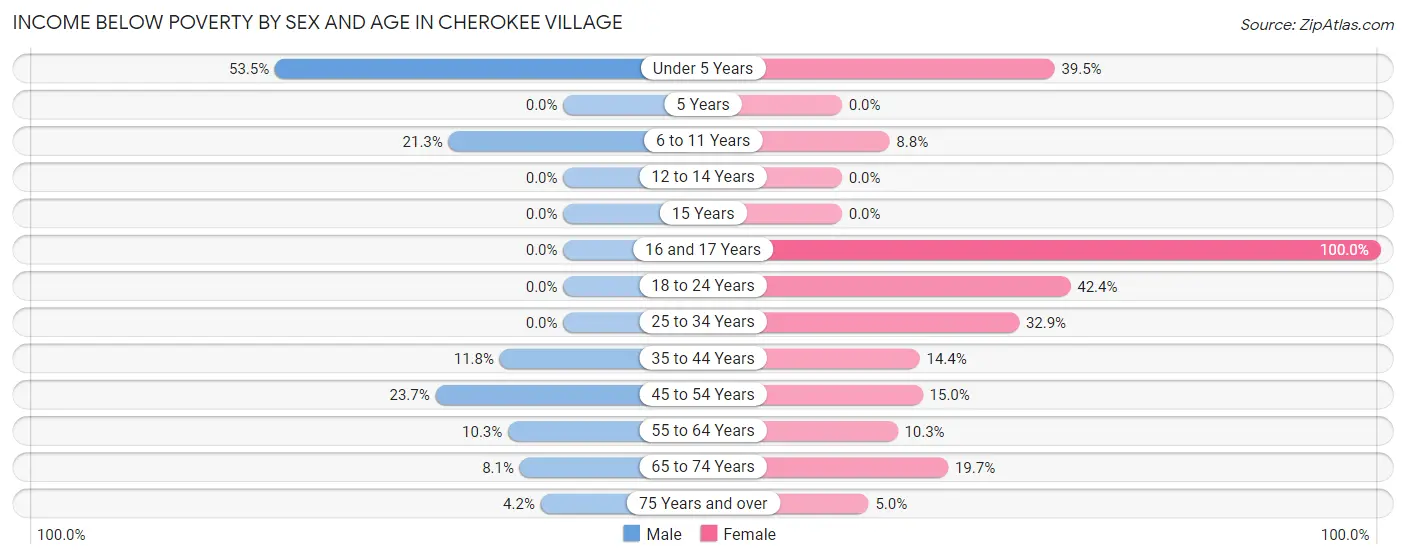
| Age Bracket | Male | Female |
| Under 5 Years | 114 (53.5%) | 30 (39.5%) |
| 5 Years | 0 (0.0%) | 0 (0.0%) |
| 6 to 11 Years | 23 (21.3%) | 19 (8.8%) |
| 12 to 14 Years | 0 (0.0%) | 0 (0.0%) |
| 15 Years | 0 (0.0%) | 0 (0.0%) |
| 16 and 17 Years | 0 (0.0%) | 37 (100.0%) |
| 18 to 24 Years | 0 (0.0%) | 67 (42.4%) |
| 25 to 34 Years | 0 (0.0%) | 73 (32.9%) |
| 35 to 44 Years | 38 (11.8%) | 28 (14.4%) |
| 45 to 54 Years | 65 (23.7%) | 18 (15.0%) |
| 55 to 64 Years | 41 (10.2%) | 44 (10.3%) |
| 65 to 74 Years | 31 (8.1%) | 82 (19.7%) |
| 75 Years and over | 14 (4.2%) | 18 (5.0%) |
| Total | 326 (12.2%) | 416 (17.8%) |
Income Above Poverty by Sex and Age in Cherokee Village
According to the poverty statistics in Cherokee Village, males aged 5 years and females aged 5 years are the age groups that are most secure financially, with 100.0% of males and 100.0% of females in these age groups living above the poverty line.
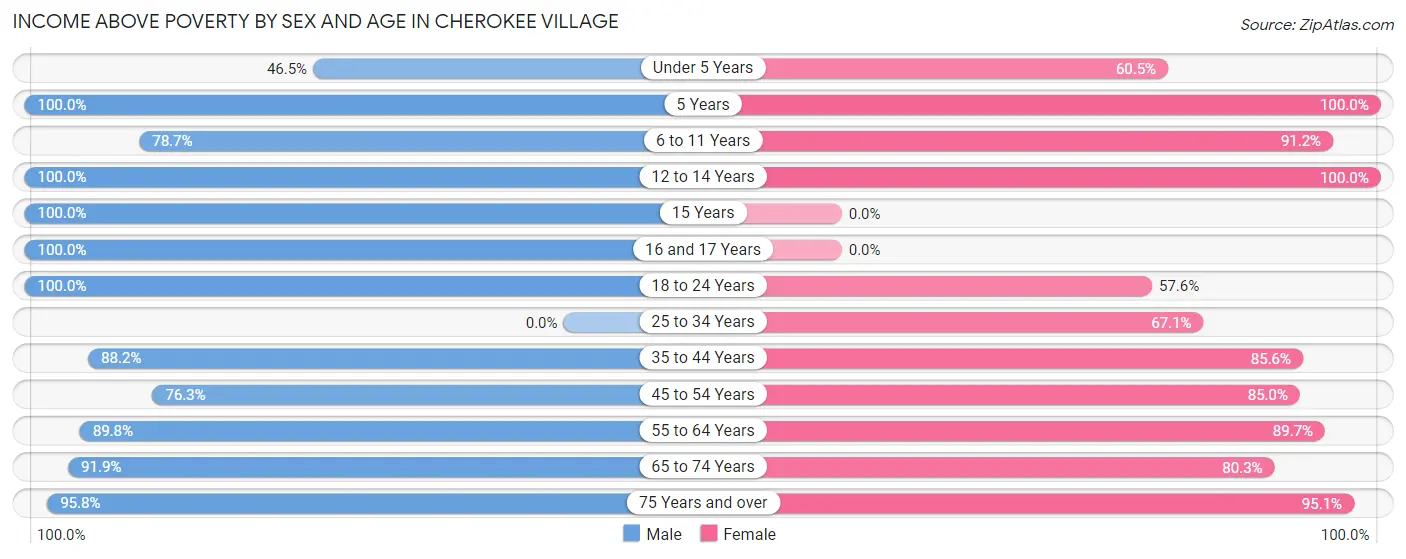
| Age Bracket | Male | Female |
| Under 5 Years | 99 (46.5%) | 46 (60.5%) |
| 5 Years | 72 (100.0%) | 22 (100.0%) |
| 6 to 11 Years | 85 (78.7%) | 196 (91.2%) |
| 12 to 14 Years | 79 (100.0%) | 82 (100.0%) |
| 15 Years | 53 (100.0%) | 0 (0.0%) |
| 16 and 17 Years | 65 (100.0%) | 0 (0.0%) |
| 18 to 24 Years | 365 (100.0%) | 91 (57.6%) |
| 25 to 34 Years | 0 (0.0%) | 149 (67.1%) |
| 35 to 44 Years | 284 (88.2%) | 166 (85.6%) |
| 45 to 54 Years | 209 (76.3%) | 102 (85.0%) |
| 55 to 64 Years | 359 (89.7%) | 382 (89.7%) |
| 65 to 74 Years | 352 (91.9%) | 334 (80.3%) |
| 75 Years and over | 319 (95.8%) | 346 (95.1%) |
| Total | 2,341 (87.8%) | 1,916 (82.2%) |
Income Below Poverty Among Married-Couple Families in Cherokee Village
The poverty statistics for married-couple families in Cherokee Village show that 1.2% or 10 of the total 839 families live below the poverty line. Families with no children have the highest poverty rate of 1.6%, comprising of 10 families. On the other hand, families with 1 or 2 children have the lowest poverty rate of 0.0%, which includes 0 families.
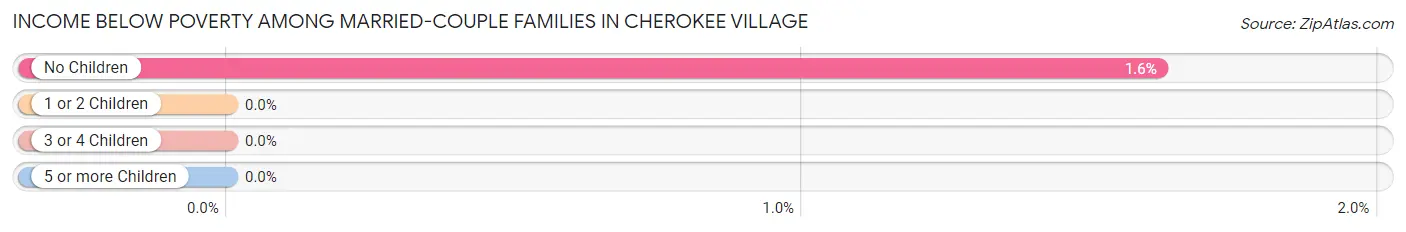
| Children | Above Poverty | Below Poverty |
| No Children | 608 (98.4%) | 10 (1.6%) |
| 1 or 2 Children | 92 (100.0%) | 0 (0.0%) |
| 3 or 4 Children | 129 (100.0%) | 0 (0.0%) |
| 5 or more Children | 0 (0.0%) | 0 (0.0%) |
| Total | 829 (98.8%) | 10 (1.2%) |
Income Below Poverty Among Single-Parent Households in Cherokee Village
According to the poverty data in Cherokee Village, 7.4% or 12 single-father households and 44.6% or 131 single-mother households are living below the poverty line. Among single-father households, those with no children have the highest poverty rate, with 12 households (19.1%) experiencing poverty. Likewise, among single-mother households, those with 1 or 2 children have the highest poverty rate, with 45 households (69.2%) falling below the poverty line.
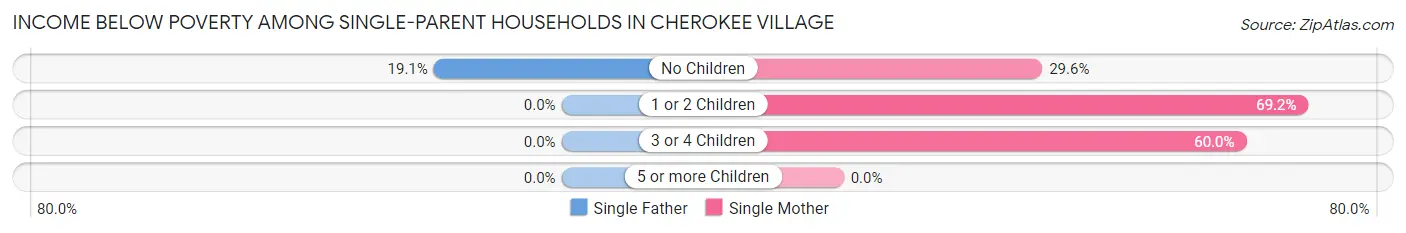
| Children | Single Father | Single Mother |
| No Children | 12 (19.1%) | 50 (29.6%) |
| 1 or 2 Children | 0 (0.0%) | 45 (69.2%) |
| 3 or 4 Children | 0 (0.0%) | 36 (60.0%) |
| 5 or more Children | 0 (0.0%) | 0 (0.0%) |
| Total | 12 (7.4%) | 131 (44.6%) |
Income Below Poverty Among Married-Couple vs Single-Parent Households in Cherokee Village
The poverty data for Cherokee Village shows that 10 of the married-couple family households (1.2%) and 143 of the single-parent households (31.4%) are living below the poverty level. Within the married-couple family households, those with no children have the highest poverty rate, with 10 households (1.6%) falling below the poverty line. Among the single-parent households, those with 3 or 4 children have the highest poverty rate, with 36 household (60.0%) living below poverty.
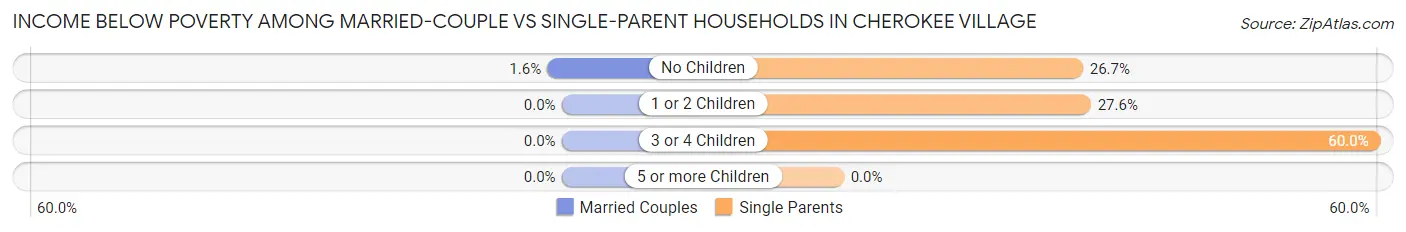
| Children | Married-Couple Families | Single-Parent Households |
| No Children | 10 (1.6%) | 62 (26.7%) |
| 1 or 2 Children | 0 (0.0%) | 45 (27.6%) |
| 3 or 4 Children | 0 (0.0%) | 36 (60.0%) |
| 5 or more Children | 0 (0.0%) | 0 (0.0%) |
| Total | 10 (1.2%) | 143 (31.4%) |
Race in Cherokee Village
The most populous races in Cherokee Village are White / Caucasian (4,635 | 91.6%), Two or more Races (351 | 6.9%), and Hispanic or Latino (126 | 2.5%).
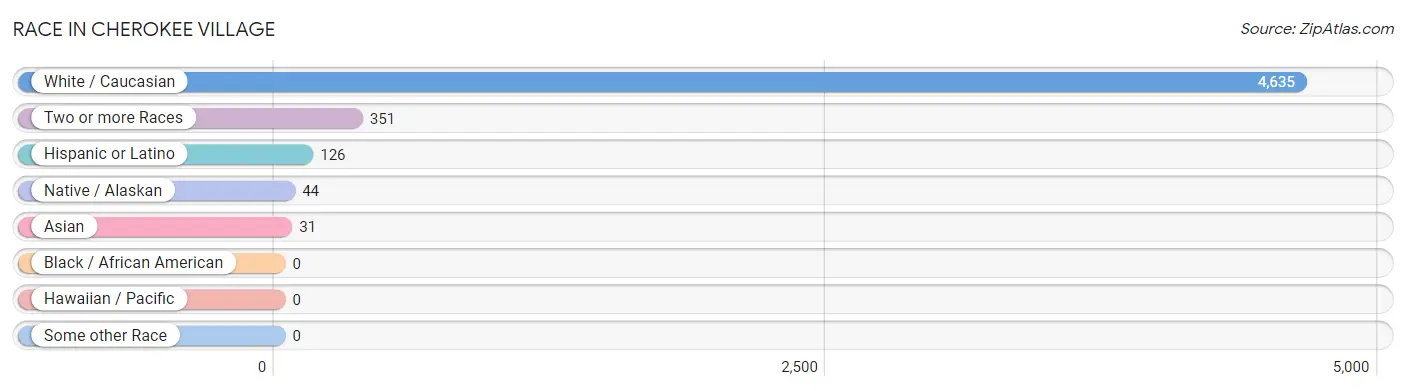
| Race | # Population | % Population |
| Asian | 31 | 0.6% |
| Black / African American | 0 | 0.0% |
| Hawaiian / Pacific | 0 | 0.0% |
| Hispanic or Latino | 126 | 2.5% |
| Native / Alaskan | 44 | 0.9% |
| White / Caucasian | 4,635 | 91.6% |
| Two or more Races | 351 | 6.9% |
| Some other Race | 0 | 0.0% |
| Total | 5,061 | 100.0% |
Ancestry in Cherokee Village
The most populous ancestries reported in Cherokee Village are German (814 | 16.1%), English (812 | 16.0%), Irish (699 | 13.8%), American (623 | 12.3%), and Cherokee (227 | 4.5%), together accounting for 62.7% of all Cherokee Village residents.
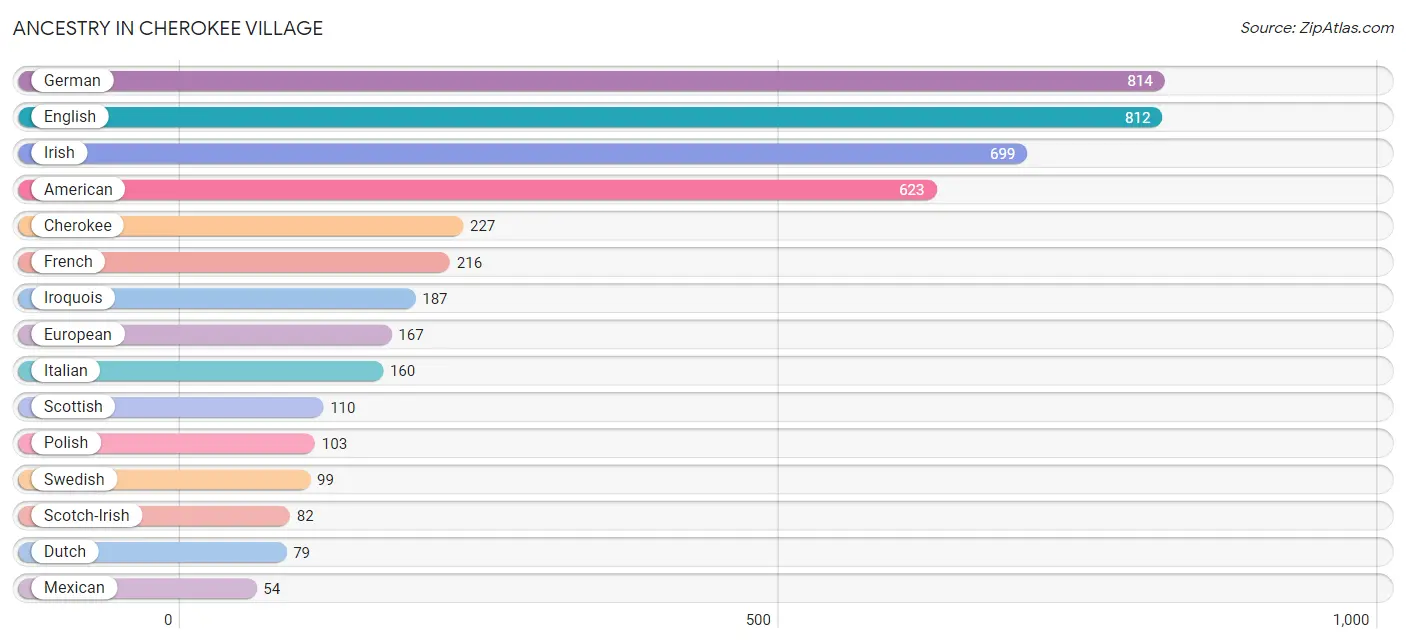
| Ancestry | # Population | % Population |
| American | 623 | 12.3% |
| Austrian | 18 | 0.4% |
| British | 18 | 0.4% |
| Cherokee | 227 | 4.5% |
| Choctaw | 18 | 0.4% |
| Cuban | 28 | 0.5% |
| Czech | 23 | 0.4% |
| Danish | 7 | 0.1% |
| Dutch | 79 | 1.6% |
| English | 812 | 16.0% |
| European | 167 | 3.3% |
| Finnish | 42 | 0.8% |
| French | 216 | 4.3% |
| German | 814 | 16.1% |
| Hungarian | 9 | 0.2% |
| Indian (Asian) | 31 | 0.6% |
| Irish | 699 | 13.8% |
| Iroquois | 187 | 3.7% |
| Italian | 160 | 3.2% |
| Korean | 31 | 0.6% |
| Mexican | 54 | 1.1% |
| Norwegian | 43 | 0.9% |
| Polish | 103 | 2.0% |
| Russian | 27 | 0.5% |
| Scandinavian | 34 | 0.7% |
| Scotch-Irish | 82 | 1.6% |
| Scottish | 110 | 2.2% |
| Sri Lankan | 25 | 0.5% |
| Swedish | 99 | 2.0% |
| Welsh | 12 | 0.2% | View All 30 Rows |
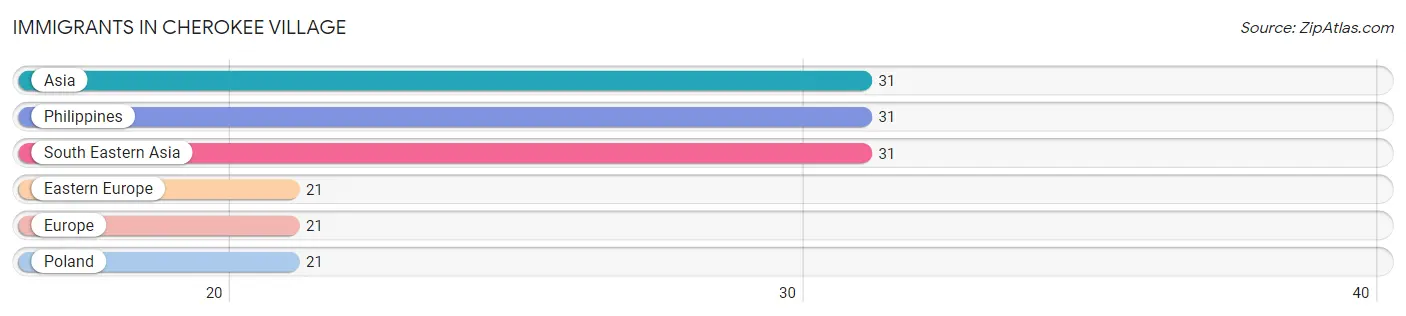
Immigrants in Cherokee Village
The most numerous immigrant groups reported in Cherokee Village came from Asia (31 | 0.6%), Philippines (31 | 0.6%), South Eastern Asia (31 | 0.6%), Eastern Europe (21 | 0.4%), and Europe (21 | 0.4%), together accounting for 2.6% of all Cherokee Village residents.
| Immigration Origin | # Population | % Population |
| Asia | 31 | 0.6% |
| Eastern Europe | 21 | 0.4% |
| Europe | 21 | 0.4% |
| Philippines | 31 | 0.6% |
| Poland | 21 | 0.4% |
| South Eastern Asia | 31 | 0.6% | View All 6 Rows |
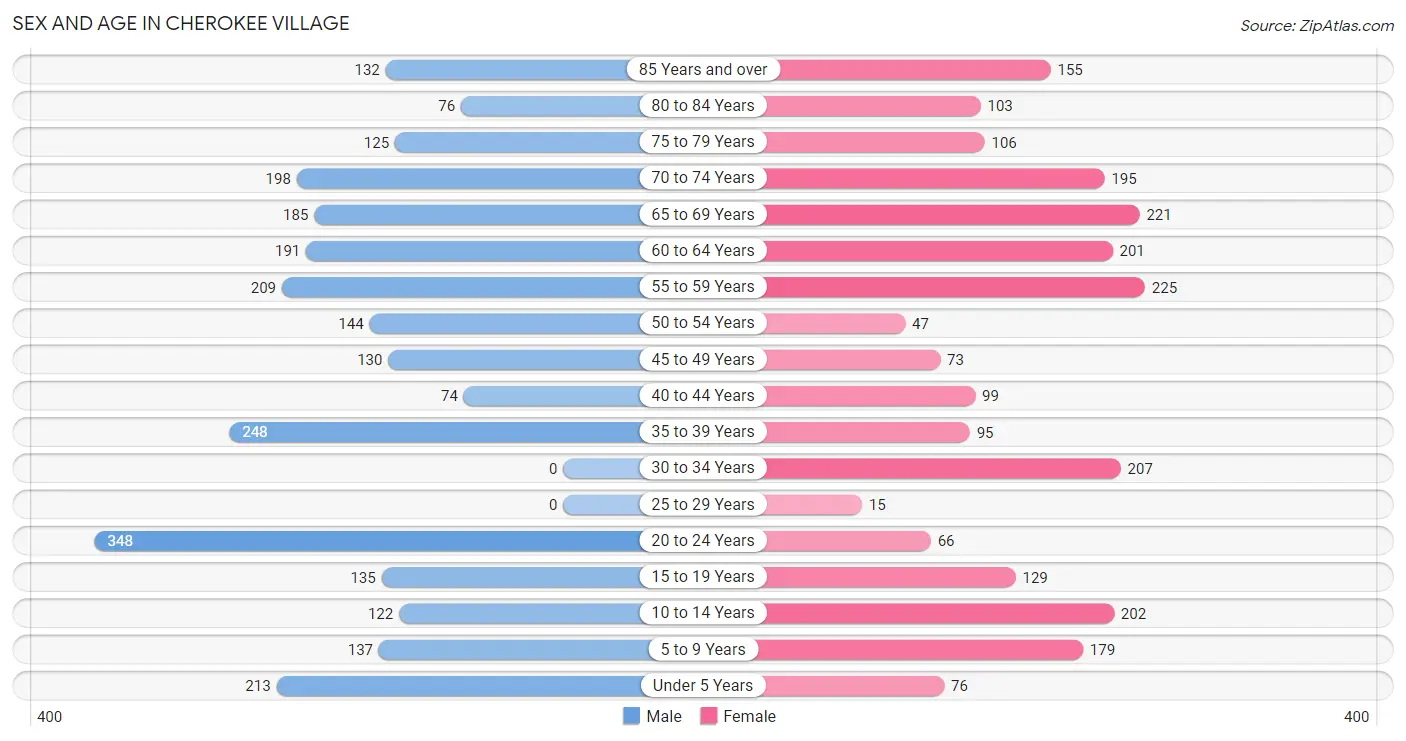
Sex and Age in Cherokee Village
Sex and Age in Cherokee Village
The most populous age groups in Cherokee Village are 20 to 24 Years (348 | 13.1%) for men and 55 to 59 Years (225 | 9.4%) for women.
| Age Bracket | Male | Female |
| Under 5 Years | 213 (8.0%) | 76 (3.2%) |
| 5 to 9 Years | 137 (5.1%) | 179 (7.5%) |
| 10 to 14 Years | 122 (4.6%) | 202 (8.4%) |
| 15 to 19 Years | 135 (5.1%) | 129 (5.4%) |
| 20 to 24 Years | 348 (13.1%) | 66 (2.8%) |
| 25 to 29 Years | 0 (0.0%) | 15 (0.6%) |
| 30 to 34 Years | 0 (0.0%) | 207 (8.6%) |
| 35 to 39 Years | 248 (9.3%) | 95 (4.0%) |
| 40 to 44 Years | 74 (2.8%) | 99 (4.1%) |
| 45 to 49 Years | 130 (4.9%) | 73 (3.0%) |
| 50 to 54 Years | 144 (5.4%) | 47 (2.0%) |
| 55 to 59 Years | 209 (7.8%) | 225 (9.4%) |
| 60 to 64 Years | 191 (7.2%) | 201 (8.4%) |
| 65 to 69 Years | 185 (6.9%) | 221 (9.2%) |
| 70 to 74 Years | 198 (7.4%) | 195 (8.2%) |
| 75 to 79 Years | 125 (4.7%) | 106 (4.4%) |
| 80 to 84 Years | 76 (2.9%) | 103 (4.3%) |
| 85 Years and over | 132 (5.0%) | 155 (6.5%) |
| Total | 2,667 (100.0%) | 2,394 (100.0%) |
Families and Households in Cherokee Village
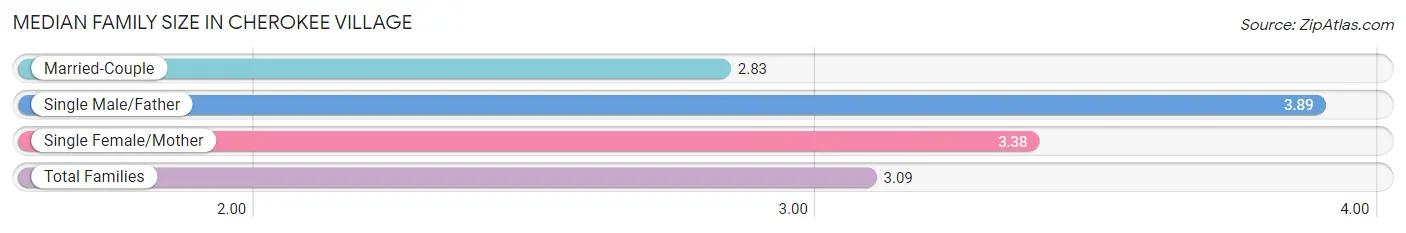
Median Family Size in Cherokee Village
The median family size in Cherokee Village is 3.09 persons per family, with single male/father families (161 | 12.4%) accounting for the largest median family size of 3.89 persons per family. On the other hand, married-couple families (839 | 64.8%) represent the smallest median family size with 2.83 persons per family.
| Family Type | # Families | Family Size |
| Married-Couple | 839 (64.8%) | 2.83 |
| Single Male/Father | 161 (12.4%) | 3.89 |
| Single Female/Mother | 294 (22.7%) | 3.38 |
| Total Families | 1,294 (100.0%) | 3.09 |
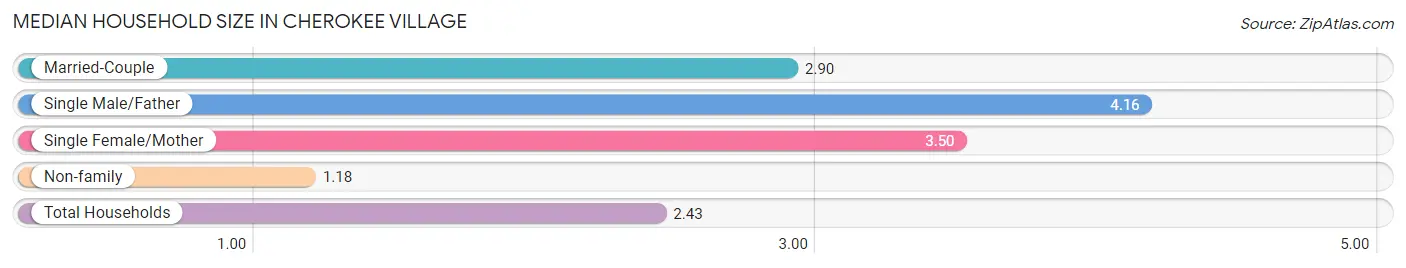
Median Household Size in Cherokee Village
The median household size in Cherokee Village is 2.43 persons per household, with single male/father households (161 | 7.7%) accounting for the largest median household size of 4.16 persons per household. non-family households (789 | 37.9%) represent the smallest median household size with 1.18 persons per household.
| Household Type | # Households | Household Size |
| Married-Couple | 839 (40.3%) | 2.90 |
| Single Male/Father | 161 (7.7%) | 4.16 |
| Single Female/Mother | 294 (14.1%) | 3.50 |
| Non-family | 789 (37.9%) | 1.18 |
| Total Households | 2,083 (100.0%) | 2.43 |
Household Size by Marriage Status in Cherokee Village
Out of a total of 2,083 households in Cherokee Village, 1,294 (62.1%) are family households, while 789 (37.9%) are nonfamily households. The most numerous type of family households are 2-person households, comprising 678, and the most common type of nonfamily households are 1-person households, comprising 687.
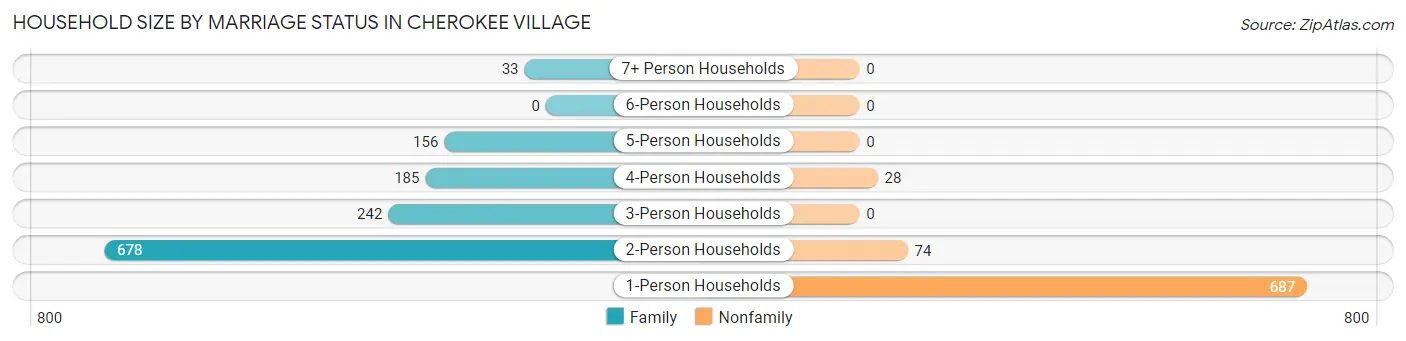
| Household Size | Family Households | Nonfamily Households |
| 1-Person Households | - | 687 (33.0%) |
| 2-Person Households | 678 (32.6%) | 74 (3.5%) |
| 3-Person Households | 242 (11.6%) | 0 (0.0%) |
| 4-Person Households | 185 (8.9%) | 28 (1.3%) |
| 5-Person Households | 156 (7.5%) | 0 (0.0%) |
| 6-Person Households | 0 (0.0%) | 0 (0.0%) |
| 7+ Person Households | 33 (1.6%) | 0 (0.0%) |
| Total | 1,294 (62.1%) | 789 (37.9%) |
Female Fertility in Cherokee Village
Fertility by Age in Cherokee Village
Average fertility rate in Cherokee Village is 88.0 births per 1,000 women. Women in the age bracket of 15 to 19 years have the highest fertility rate with 186.0 births per 1,000 women. Women in the age bracket of 20 to 34 years acount for 60.0% of all women with births.
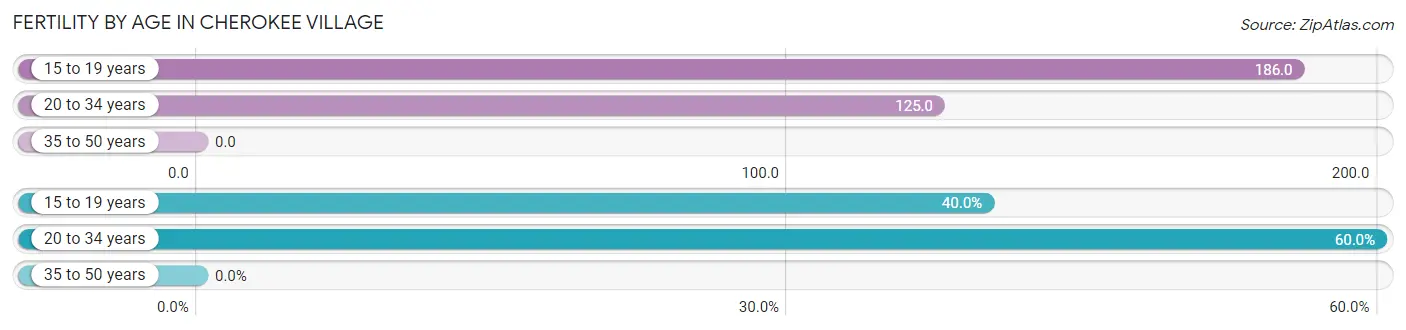
| Age Bracket | Women with Births | Births / 1,000 Women |
| 15 to 19 years | 24 (40.0%) | 186.0 |
| 20 to 34 years | 36 (60.0%) | 125.0 |
| 35 to 50 years | 0 (0.0%) | 0.0 |
| Total | 60 (100.0%) | 88.0 |
Fertility by Age by Marriage Status in Cherokee Village
60.0% of women with births (60) in Cherokee Village are married. The highest percentage of unmarried women with births falls into 15 to 19 years age bracket with 100.0% of them unmarried at the time of birth, while the lowest percentage of unmarried women with births belong to 20 to 34 years age bracket with 0.0% of them unmarried.
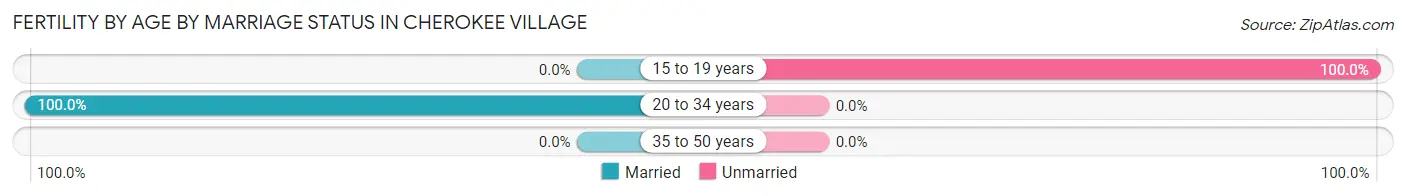
| Age Bracket | Married | Unmarried |
| 15 to 19 years | 0 (0.0%) | 24 (100.0%) |
| 20 to 34 years | 36 (100.0%) | 0 (0.0%) |
| 35 to 50 years | 0 (0.0%) | 0 (0.0%) |
| Total | 36 (60.0%) | 24 (40.0%) |
Fertility by Education in Cherokee Village
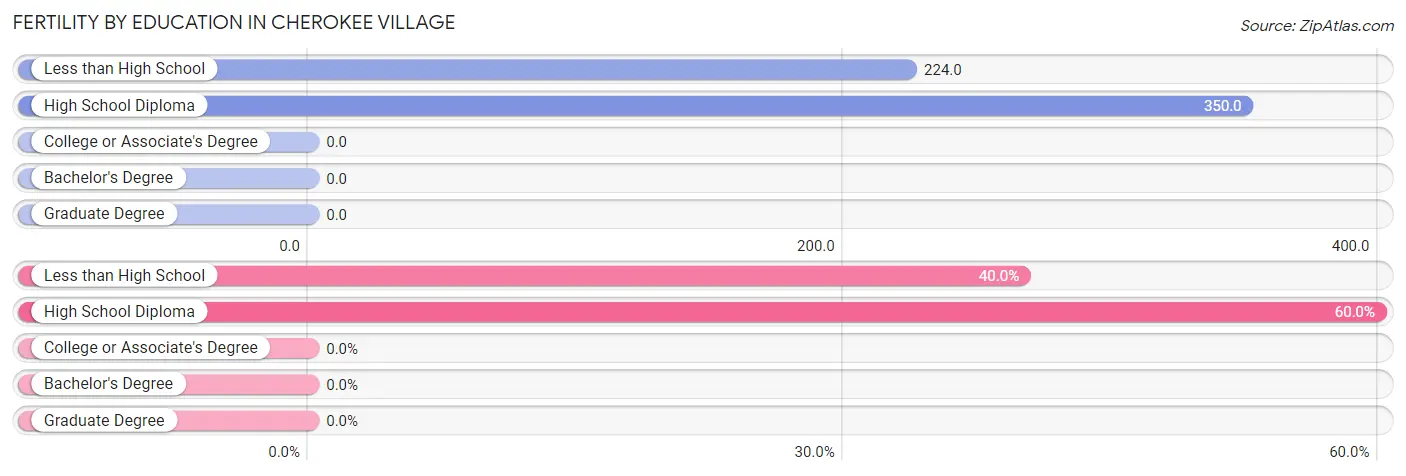
| Educational Attainment | Women with Births | Births / 1,000 Women |
| Less than High School | 24 (40.0%) | 224.0 |
| High School Diploma | 36 (60.0%) | 350.0 |
| College or Associate's Degree | 0 (0.0%) | 0.0 |
| Bachelor's Degree | 0 (0.0%) | 0.0 |
| Graduate Degree | 0 (0.0%) | 0.0 |
| Total | 60 (100.0%) | 88.0 |
Fertility by Education by Marriage Status in Cherokee Village
40.0% of women with births in Cherokee Village are unmarried. Women with the educational attainment of high school diploma are most likely to be married with 100.0% of them married at childbirth, while women with the educational attainment of less than high school are least likely to be married with 100.0% of them unmarried at childbirth.
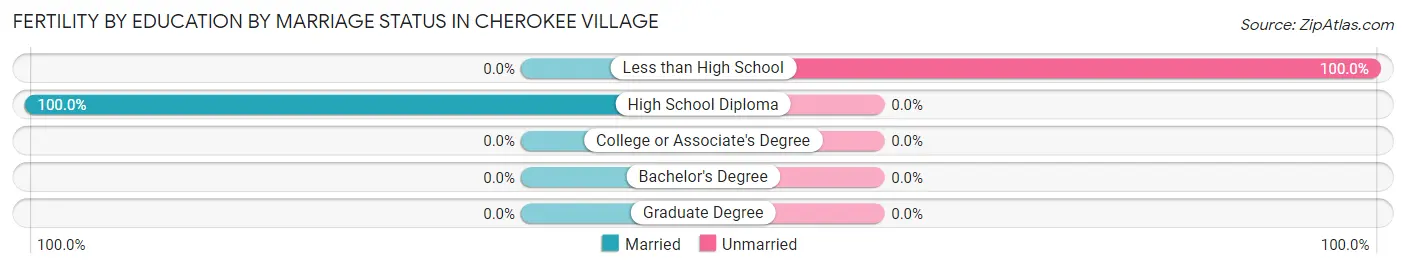
| Educational Attainment | Married | Unmarried |
| Less than High School | 0 (0.0%) | 24 (100.0%) |
| High School Diploma | 36 (100.0%) | 0 (0.0%) |
| College or Associate's Degree | 0 (0.0%) | 0 (0.0%) |
| Bachelor's Degree | 0 (0.0%) | 0 (0.0%) |
| Graduate Degree | 0 (0.0%) | 0 (0.0%) |
| Total | 36 (60.0%) | 24 (40.0%) |
Employment Characteristics in Cherokee Village
Employment by Class of Employer in Cherokee Village
Among the 1,486 employed individuals in Cherokee Village, private company employees (1,089 | 73.3%), self-employed (not incorporated) (144 | 9.7%), and state government employees (102 | 6.9%) make up the most common classes of employment.
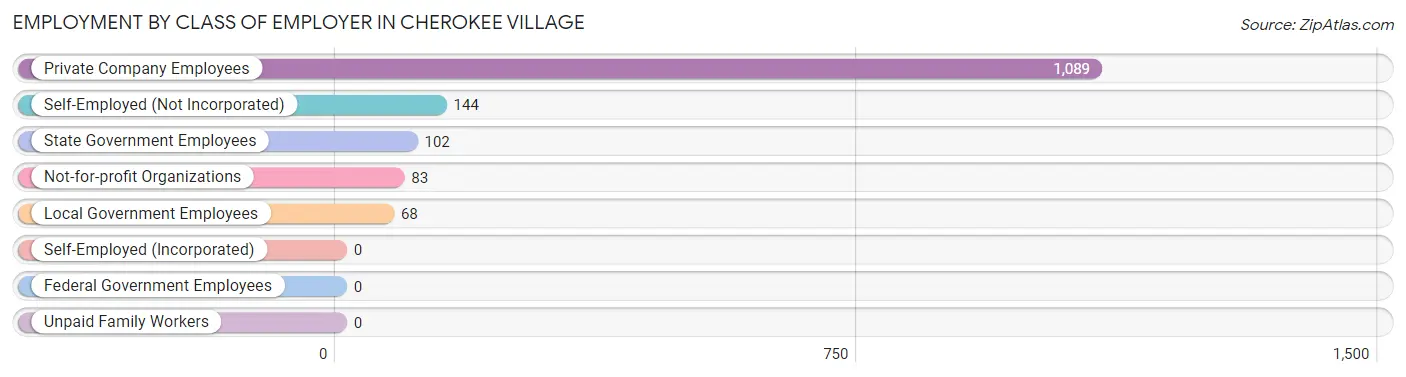
| Employer Class | # Employees | % Employees |
| Private Company Employees | 1,089 | 73.3% |
| Self-Employed (Incorporated) | 0 | 0.0% |
| Self-Employed (Not Incorporated) | 144 | 9.7% |
| Not-for-profit Organizations | 83 | 5.6% |
| Local Government Employees | 68 | 4.6% |
| State Government Employees | 102 | 6.9% |
| Federal Government Employees | 0 | 0.0% |
| Unpaid Family Workers | 0 | 0.0% |
| Total | 1,486 | 100.0% |
Employment Status by Age in Cherokee Village
According to the labor force statistics for Cherokee Village, out of the total population over 16 years of age (4,079), 42.1% or 1,717 individuals are in the labor force, with 12.0% or 206 of them unemployed. The age group with the highest labor force participation rate is 25 to 29 years, with 100.0% or 15 individuals in the labor force. Within the labor force, the 60 to 64 years age range has the highest percentage of unemployed individuals, with 40.4% or 42 of them being unemployed.
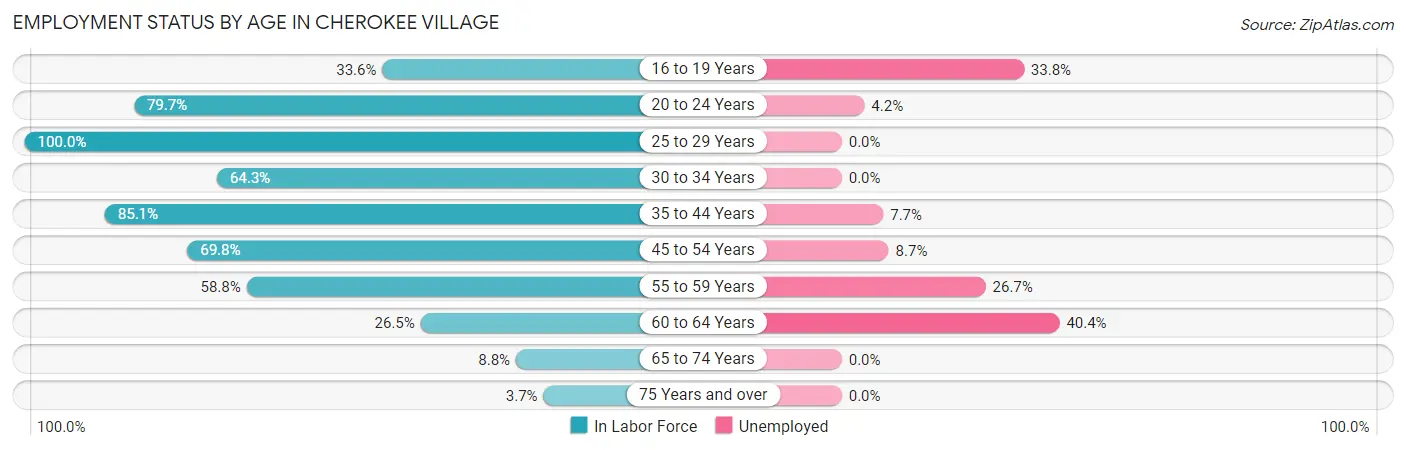
| Age Bracket | In Labor Force | Unemployed |
| 16 to 19 Years | 71 (33.6%) | 24 (33.8%) |
| 20 to 24 Years | 330 (79.7%) | 14 (4.2%) |
| 25 to 29 Years | 15 (100.0%) | 0 (0.0%) |
| 30 to 34 Years | 133 (64.3%) | 0 (0.0%) |
| 35 to 44 Years | 439 (85.1%) | 34 (7.7%) |
| 45 to 54 Years | 275 (69.8%) | 24 (8.7%) |
| 55 to 59 Years | 255 (58.8%) | 68 (26.7%) |
| 60 to 64 Years | 104 (26.5%) | 42 (40.4%) |
| 65 to 74 Years | 70 (8.8%) | 0 (0.0%) |
| 75 Years and over | 26 (3.7%) | 0 (0.0%) |
| Total | 1,717 (42.1%) | 206 (12.0%) |
Employment Status by Educational Attainment in Cherokee Village
According to labor force statistics for Cherokee Village, 62.4% of individuals (1,222) out of the total population between 25 and 64 years of age (1,958) are in the labor force, with 13.8% or 169 of them being unemployed. The group with the highest labor force participation rate are those with the educational attainment of bachelor's degree or higher, with 78.0% or 341 individuals in the labor force. Within the labor force, individuals with bachelor's degree or higher education have the highest percentage of unemployment, with 19.9% or 68 of them being unemployed.
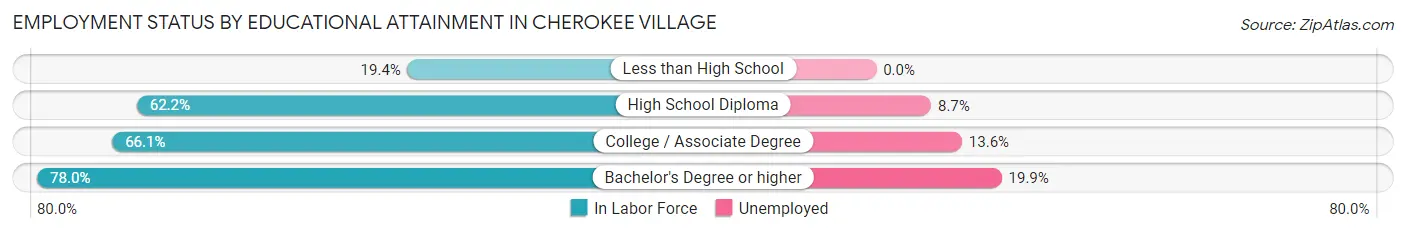
| Educational Attainment | In Labor Force | Unemployed |
| Less than High School | 45 (19.4%) | 0 (0.0%) |
| High School Diploma | 275 (62.2%) | 38 (8.7%) |
| College / Associate Degree | 560 (66.1%) | 115 (13.6%) |
| Bachelor's Degree or higher | 341 (78.0%) | 87 (19.9%) |
| Total | 1,222 (62.4%) | 270 (13.8%) |
Employment Occupations by Sex in Cherokee Village
Management, Business, Science and Arts Occupations
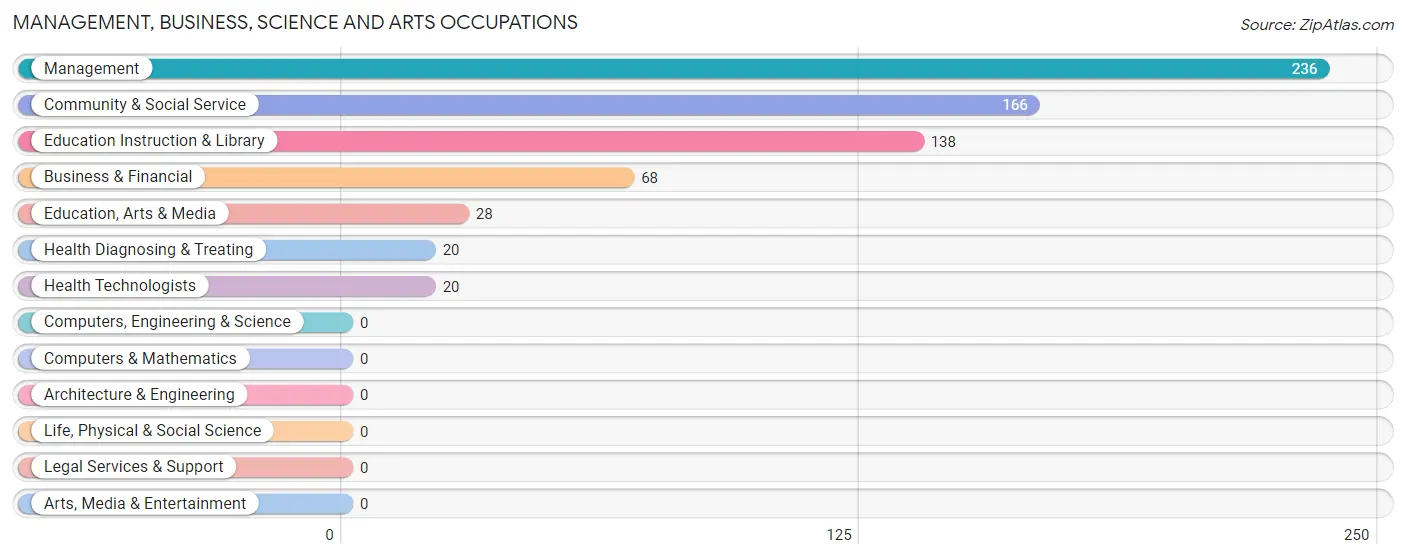
The most common Management, Business, Science and Arts occupations in Cherokee Village are Management (236 | 15.6%), Community & Social Service (166 | 11.0%), Education Instruction & Library (138 | 9.1%), Business & Financial (68 | 4.5%), and Education, Arts & Media (28 | 1.8%).
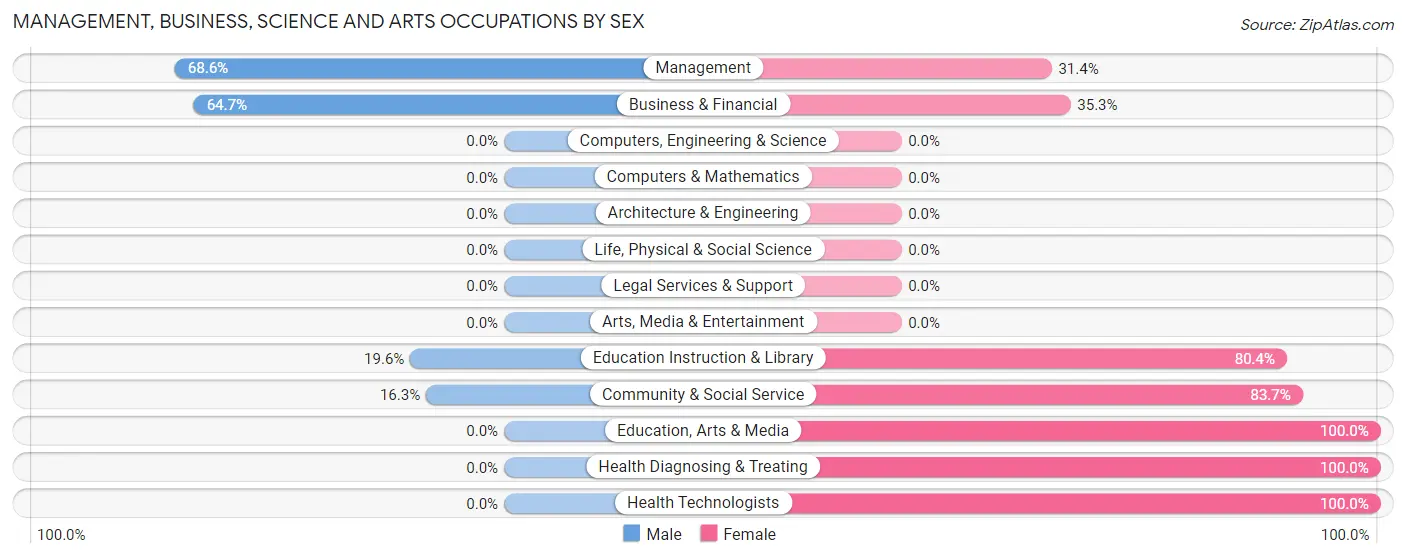
Management, Business, Science and Arts Occupations by Sex
Within the Management, Business, Science and Arts occupations in Cherokee Village, the most male-oriented occupations are Management (68.6%), Business & Financial (64.7%), and Education Instruction & Library (19.6%), while the most female-oriented occupations are Education, Arts & Media (100.0%), Health Diagnosing & Treating (100.0%), and Health Technologists (100.0%).
| Occupation | Male | Female |
| Management | 162 (68.6%) | 74 (31.4%) |
| Business & Financial | 44 (64.7%) | 24 (35.3%) |
| Computers, Engineering & Science | 0 (0.0%) | 0 (0.0%) |
| Computers & Mathematics | 0 (0.0%) | 0 (0.0%) |
| Architecture & Engineering | 0 (0.0%) | 0 (0.0%) |
| Life, Physical & Social Science | 0 (0.0%) | 0 (0.0%) |
| Community & Social Service | 27 (16.3%) | 139 (83.7%) |
| Education, Arts & Media | 0 (0.0%) | 28 (100.0%) |
| Legal Services & Support | 0 (0.0%) | 0 (0.0%) |
| Education Instruction & Library | 27 (19.6%) | 111 (80.4%) |
| Arts, Media & Entertainment | 0 (0.0%) | 0 (0.0%) |
| Health Diagnosing & Treating | 0 (0.0%) | 20 (100.0%) |
| Health Technologists | 0 (0.0%) | 20 (100.0%) |
| Total (Category) | 233 (47.5%) | 257 (52.4%) |
| Total (Overall) | 929 (61.4%) | 583 (38.6%) |
Services Occupations
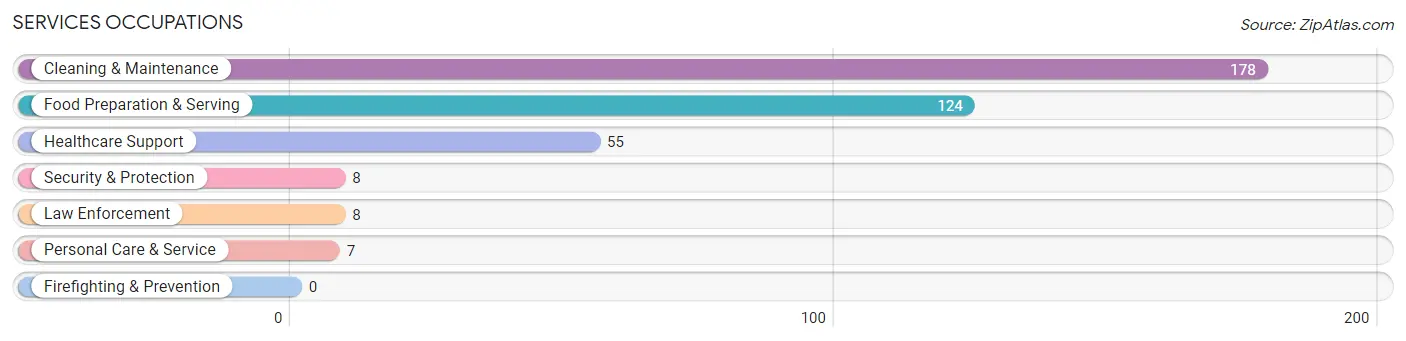
The most common Services occupations in Cherokee Village are Cleaning & Maintenance (178 | 11.8%), Food Preparation & Serving (124 | 8.2%), Healthcare Support (55 | 3.6%), Security & Protection (8 | 0.5%), and Law Enforcement (8 | 0.5%).
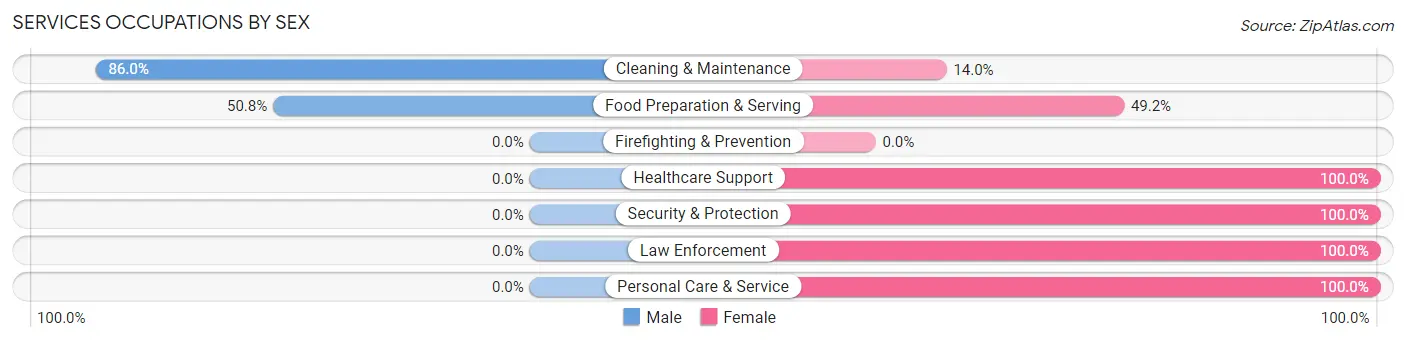
Services Occupations by Sex
Within the Services occupations in Cherokee Village, the most male-oriented occupations are Cleaning & Maintenance (86.0%), and Food Preparation & Serving (50.8%), while the most female-oriented occupations are Healthcare Support (100.0%), Security & Protection (100.0%), and Law Enforcement (100.0%).
| Occupation | Male | Female |
| Healthcare Support | 0 (0.0%) | 55 (100.0%) |
| Security & Protection | 0 (0.0%) | 8 (100.0%) |
| Firefighting & Prevention | 0 (0.0%) | 0 (0.0%) |
| Law Enforcement | 0 (0.0%) | 8 (100.0%) |
| Food Preparation & Serving | 63 (50.8%) | 61 (49.2%) |
| Cleaning & Maintenance | 153 (86.0%) | 25 (14.0%) |
| Personal Care & Service | 0 (0.0%) | 7 (100.0%) |
| Total (Category) | 216 (58.1%) | 156 (41.9%) |
| Total (Overall) | 929 (61.4%) | 583 (38.6%) |
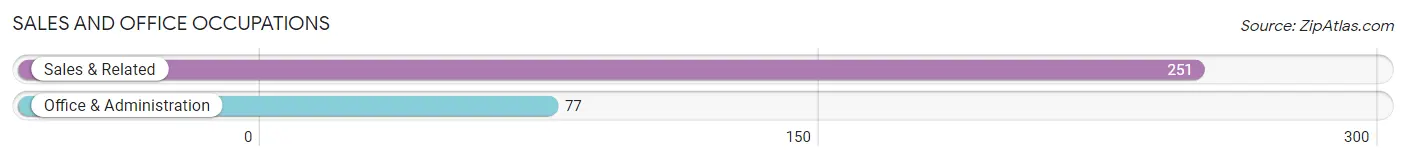
Sales and Office Occupations
The most common Sales and Office occupations in Cherokee Village are Sales & Related (251 | 16.6%), and Office & Administration (77 | 5.1%).
Sales and Office Occupations by Sex
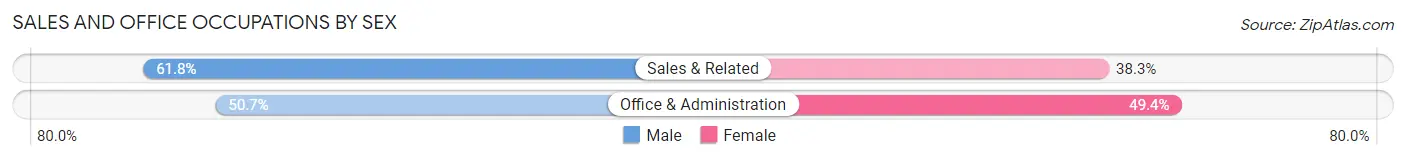
| Occupation | Male | Female |
| Sales & Related | 155 (61.8%) | 96 (38.3%) |
| Office & Administration | 39 (50.6%) | 38 (49.3%) |
| Total (Category) | 194 (59.2%) | 134 (40.8%) |
| Total (Overall) | 929 (61.4%) | 583 (38.6%) |
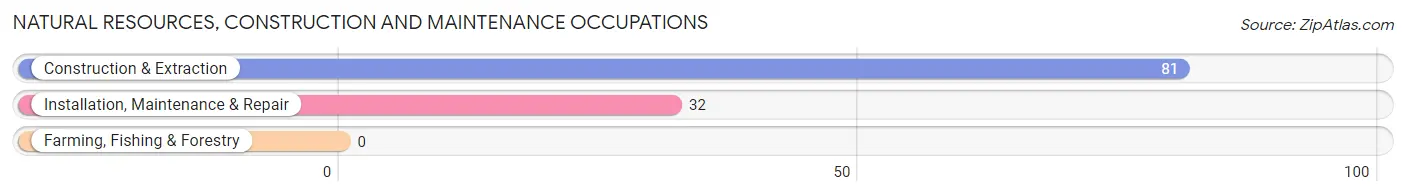
Natural Resources, Construction and Maintenance Occupations
The most common Natural Resources, Construction and Maintenance occupations in Cherokee Village are Construction & Extraction (81 | 5.4%), and Installation, Maintenance & Repair (32 | 2.1%).
Natural Resources, Construction and Maintenance Occupations by Sex
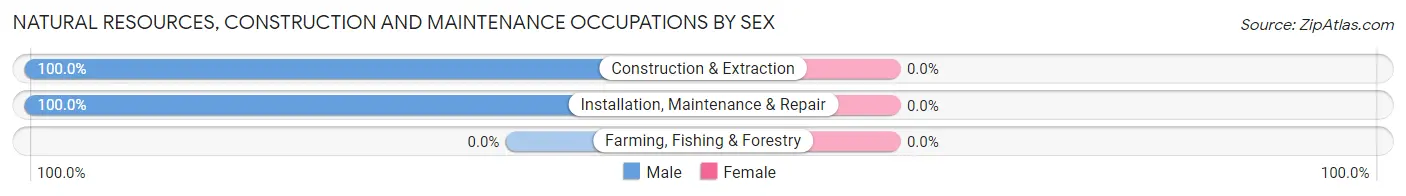
| Occupation | Male | Female |
| Farming, Fishing & Forestry | 0 (0.0%) | 0 (0.0%) |
| Construction & Extraction | 81 (100.0%) | 0 (0.0%) |
| Installation, Maintenance & Repair | 32 (100.0%) | 0 (0.0%) |
| Total (Category) | 113 (100.0%) | 0 (0.0%) |
| Total (Overall) | 929 (61.4%) | 583 (38.6%) |
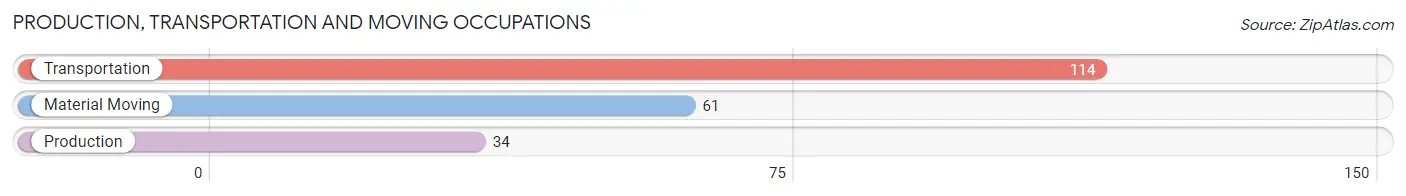
Production, Transportation and Moving Occupations
The most common Production, Transportation and Moving occupations in Cherokee Village are Transportation (114 | 7.5%), Material Moving (61 | 4.0%), and Production (34 | 2.2%).
Production, Transportation and Moving Occupations by Sex
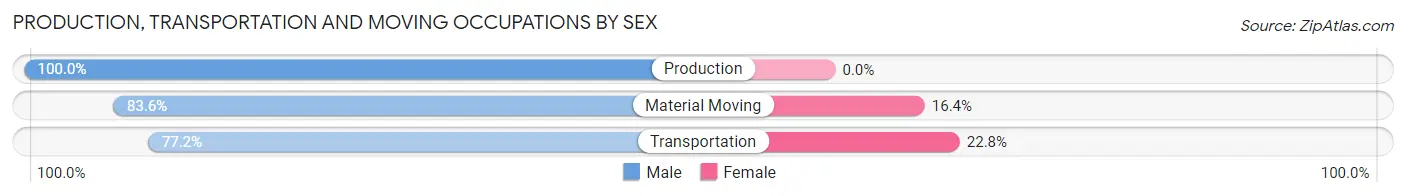
| Occupation | Male | Female |
| Production | 34 (100.0%) | 0 (0.0%) |
| Transportation | 88 (77.2%) | 26 (22.8%) |
| Material Moving | 51 (83.6%) | 10 (16.4%) |
| Total (Category) | 173 (82.8%) | 36 (17.2%) |
| Total (Overall) | 929 (61.4%) | 583 (38.6%) |
Employment Industries by Sex in Cherokee Village
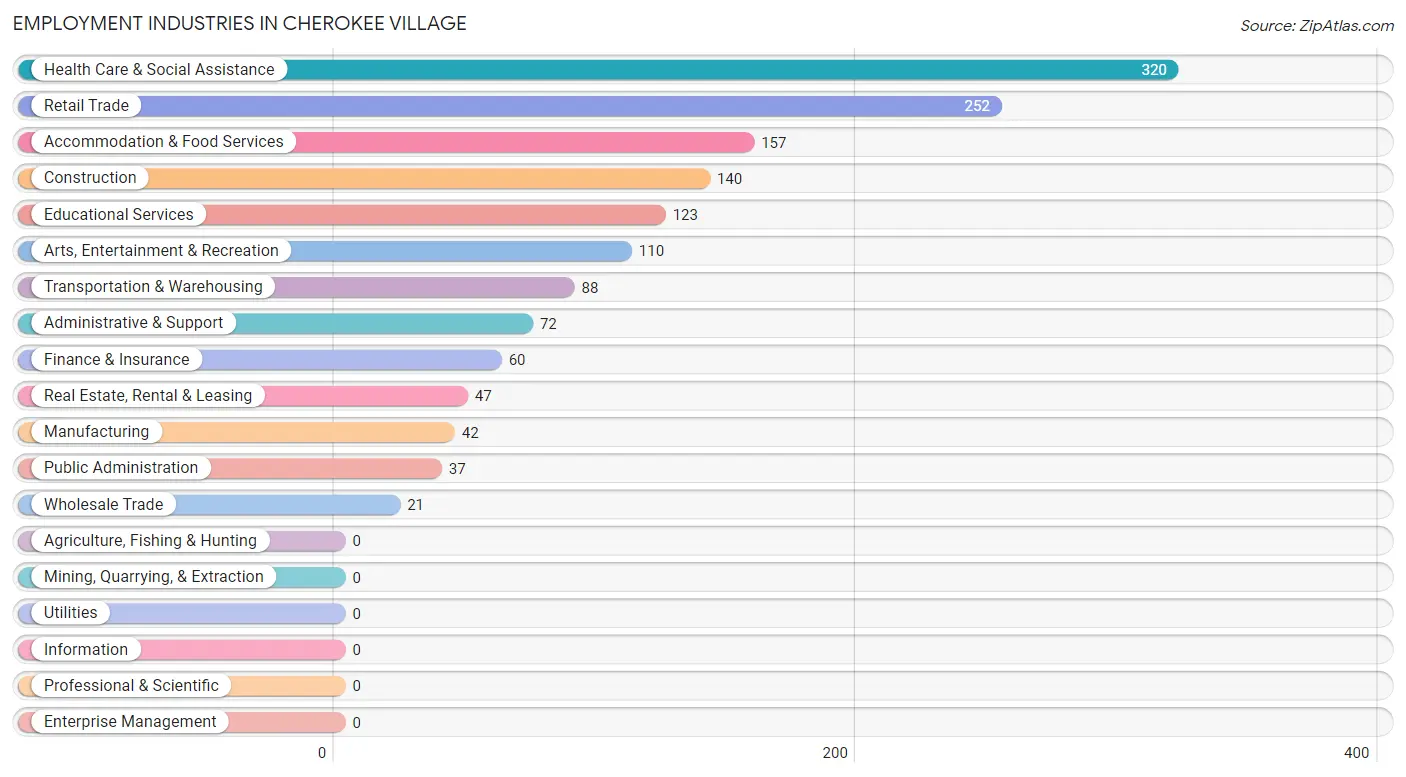
Employment Industries in Cherokee Village
The major employment industries in Cherokee Village include Health Care & Social Assistance (320 | 21.2%), Retail Trade (252 | 16.7%), Accommodation & Food Services (157 | 10.4%), Construction (140 | 9.3%), and Educational Services (123 | 8.1%).
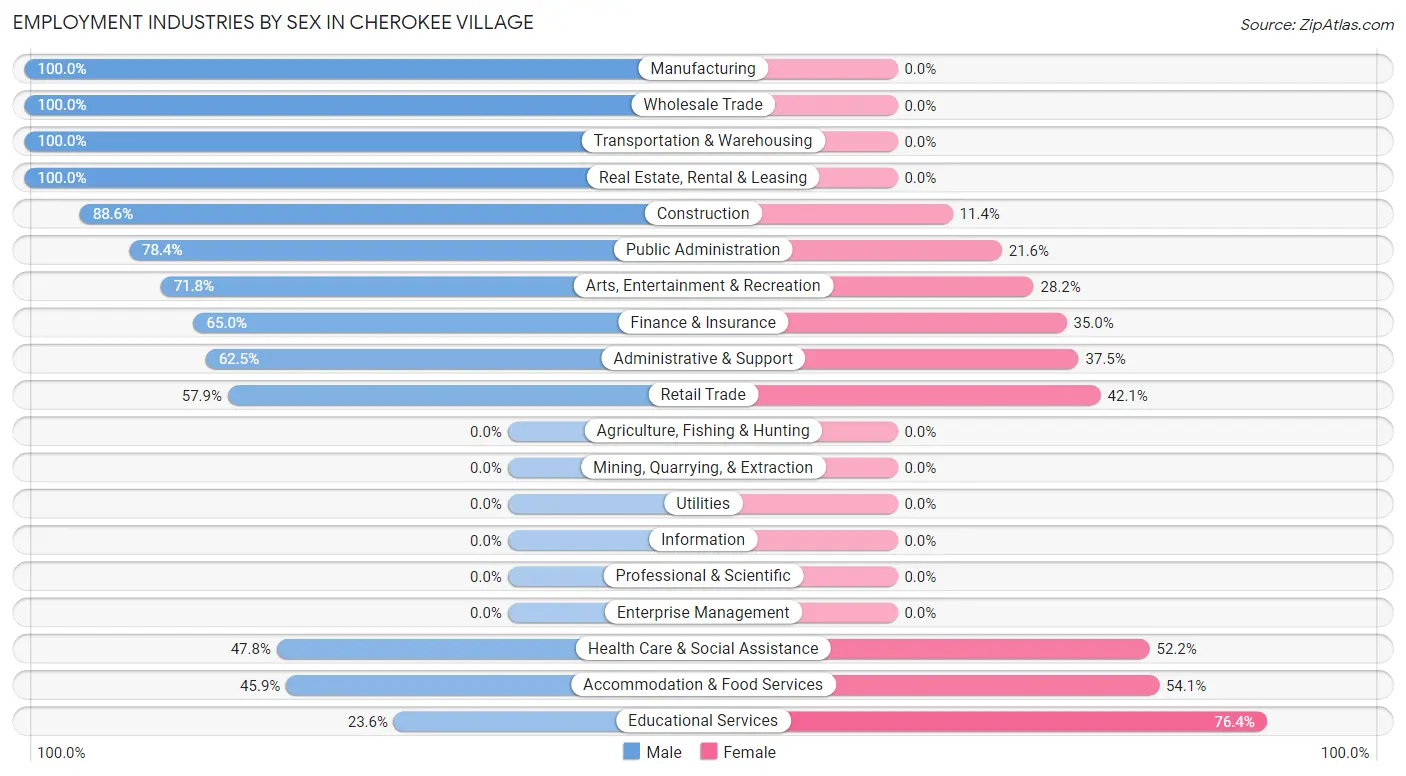
Employment Industries by Sex in Cherokee Village
The Cherokee Village industries that see more men than women are Manufacturing (100.0%), Wholesale Trade (100.0%), and Transportation & Warehousing (100.0%), whereas the industries that tend to have a higher number of women are Educational Services (76.4%), Accommodation & Food Services (54.1%), and Health Care & Social Assistance (52.2%).
| Industry | Male | Female |
| Agriculture, Fishing & Hunting | 0 (0.0%) | 0 (0.0%) |
| Mining, Quarrying, & Extraction | 0 (0.0%) | 0 (0.0%) |
| Construction | 124 (88.6%) | 16 (11.4%) |
| Manufacturing | 42 (100.0%) | 0 (0.0%) |
| Wholesale Trade | 21 (100.0%) | 0 (0.0%) |
| Retail Trade | 146 (57.9%) | 106 (42.1%) |
| Transportation & Warehousing | 88 (100.0%) | 0 (0.0%) |
| Utilities | 0 (0.0%) | 0 (0.0%) |
| Information | 0 (0.0%) | 0 (0.0%) |
| Finance & Insurance | 39 (65.0%) | 21 (35.0%) |
| Real Estate, Rental & Leasing | 47 (100.0%) | 0 (0.0%) |
| Professional & Scientific | 0 (0.0%) | 0 (0.0%) |
| Enterprise Management | 0 (0.0%) | 0 (0.0%) |
| Administrative & Support | 45 (62.5%) | 27 (37.5%) |
| Educational Services | 29 (23.6%) | 94 (76.4%) |
| Health Care & Social Assistance | 153 (47.8%) | 167 (52.2%) |
| Arts, Entertainment & Recreation | 79 (71.8%) | 31 (28.2%) |
| Accommodation & Food Services | 72 (45.9%) | 85 (54.1%) |
| Public Administration | 29 (78.4%) | 8 (21.6%) |
| Total | 929 (61.4%) | 583 (38.6%) |
Education in Cherokee Village
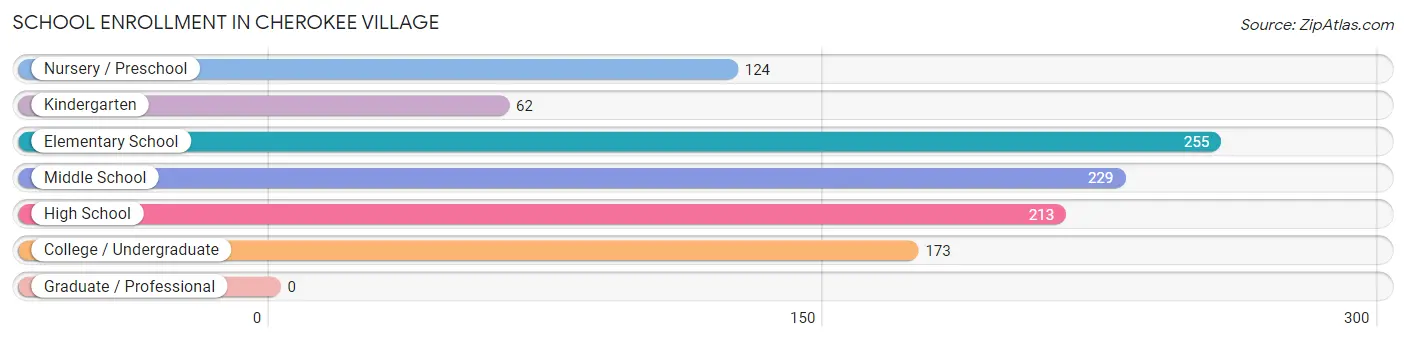
School Enrollment in Cherokee Village
The most common levels of schooling among the 1,056 students in Cherokee Village are elementary school (255 | 24.1%), middle school (229 | 21.7%), and high school (213 | 20.2%).
| School Level | # Students | % Students |
| Nursery / Preschool | 124 | 11.7% |
| Kindergarten | 62 | 5.9% |
| Elementary School | 255 | 24.1% |
| Middle School | 229 | 21.7% |
| High School | 213 | 20.2% |
| College / Undergraduate | 173 | 16.4% |
| Graduate / Professional | 0 | 0.0% |
| Total | 1,056 | 100.0% |
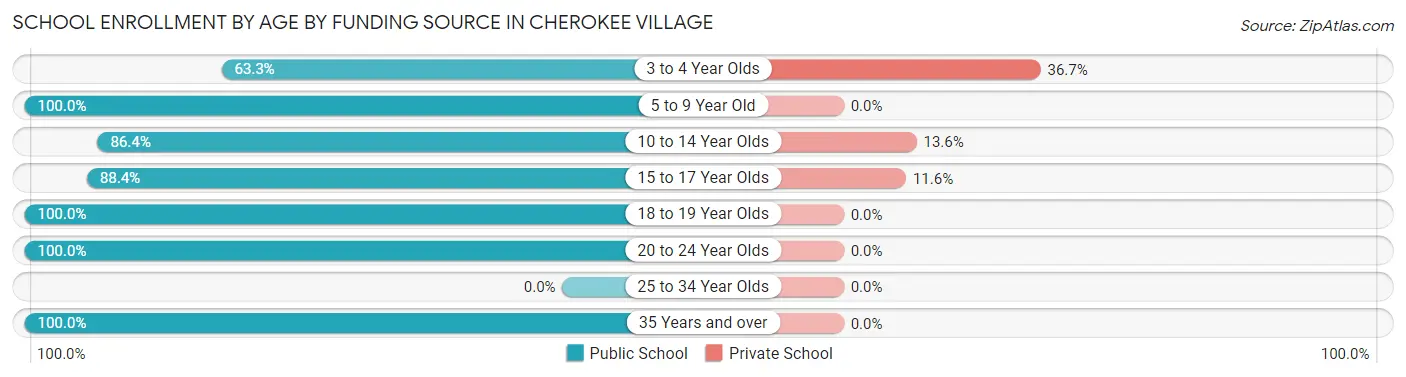
School Enrollment by Age by Funding Source in Cherokee Village
Out of a total of 1,056 students who are enrolled in schools in Cherokee Village, 95 (9.0%) attend a private institution, while the remaining 961 (91.0%) are enrolled in public schools. The age group of 3 to 4 year olds has the highest likelihood of being enrolled in private schools, with 33 (36.7% in the age bracket) enrolled. Conversely, the age group of 5 to 9 year old has the lowest likelihood of being enrolled in a private school, with 299 (100.0% in the age bracket) attending a public institution.
| Age Bracket | Public School | Private School |
| 3 to 4 Year Olds | 57 (63.3%) | 33 (36.7%) |
| 5 to 9 Year Old | 299 (100.0%) | 0 (0.0%) |
| 10 to 14 Year Olds | 280 (86.4%) | 44 (13.6%) |
| 15 to 17 Year Olds | 137 (88.4%) | 18 (11.6%) |
| 18 to 19 Year Olds | 70 (100.0%) | 0 (0.0%) |
| 20 to 24 Year Olds | 104 (100.0%) | 0 (0.0%) |
| 25 to 34 Year Olds | 0 (0.0%) | 0 (0.0%) |
| 35 Years and over | 14 (100.0%) | 0 (0.0%) |
| Total | 961 (91.0%) | 95 (9.0%) |
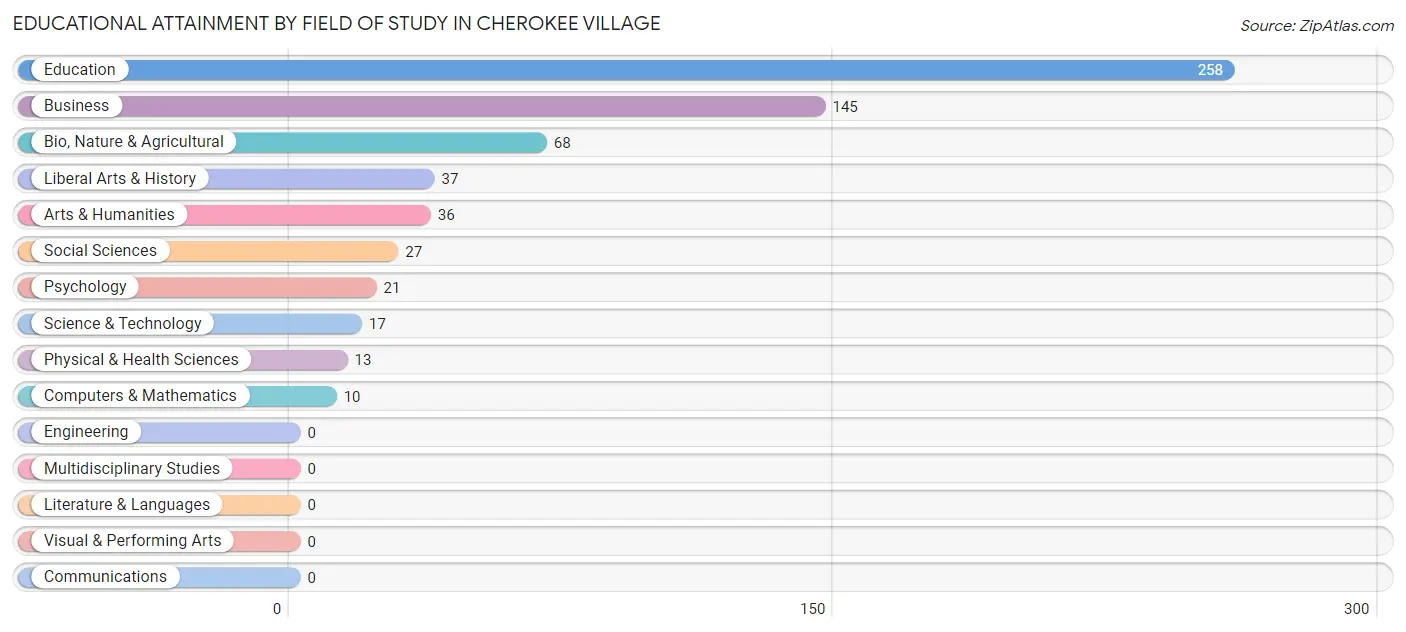
Educational Attainment by Field of Study in Cherokee Village
Education (258 | 40.8%), business (145 | 22.9%), bio, nature & agricultural (68 | 10.8%), liberal arts & history (37 | 5.9%), and arts & humanities (36 | 5.7%) are the most common fields of study among 632 individuals in Cherokee Village who have obtained a bachelor's degree or higher.
| Field of Study | # Graduates | % Graduates |
| Computers & Mathematics | 10 | 1.6% |
| Bio, Nature & Agricultural | 68 | 10.8% |
| Physical & Health Sciences | 13 | 2.1% |
| Psychology | 21 | 3.3% |
| Social Sciences | 27 | 4.3% |
| Engineering | 0 | 0.0% |
| Multidisciplinary Studies | 0 | 0.0% |
| Science & Technology | 17 | 2.7% |
| Business | 145 | 22.9% |
| Education | 258 | 40.8% |
| Literature & Languages | 0 | 0.0% |
| Liberal Arts & History | 37 | 5.9% |
| Visual & Performing Arts | 0 | 0.0% |
| Communications | 0 | 0.0% |
| Arts & Humanities | 36 | 5.7% |
| Total | 632 | 100.0% |
Transportation & Commute in Cherokee Village
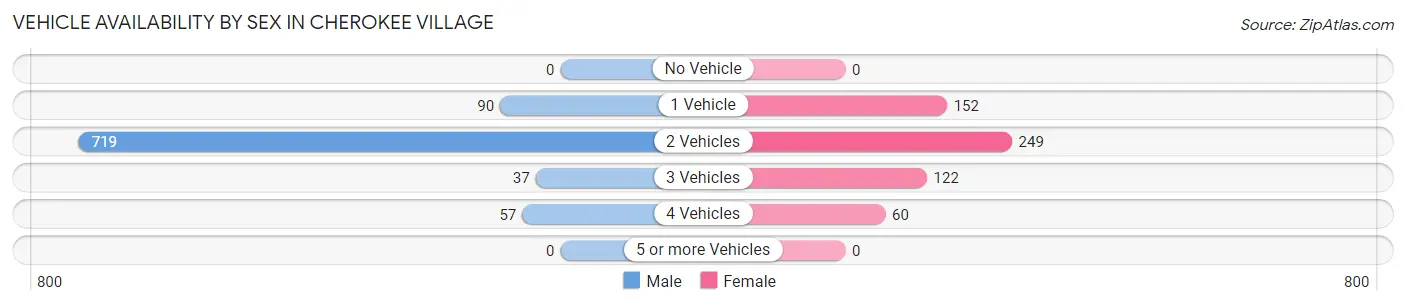
Vehicle Availability by Sex in Cherokee Village
The most prevalent vehicle ownership categories in Cherokee Village are males with 2 vehicles (719, accounting for 79.6%) and females with 2 vehicles (249, making up 123.3%).
| Vehicles Available | Male | Female |
| No Vehicle | 0 (0.0%) | 0 (0.0%) |
| 1 Vehicle | 90 (10.0%) | 152 (26.1%) |
| 2 Vehicles | 719 (79.6%) | 249 (42.7%) |
| 3 Vehicles | 37 (4.1%) | 122 (20.9%) |
| 4 Vehicles | 57 (6.3%) | 60 (10.3%) |
| 5 or more Vehicles | 0 (0.0%) | 0 (0.0%) |
| Total | 903 (100.0%) | 583 (100.0%) |
Commute Time in Cherokee Village
The most frequently occuring commute durations in Cherokee Village are 10 to 14 minutes (430 commuters, 31.2%), 15 to 19 minutes (313 commuters, 22.7%), and 5 to 9 minutes (225 commuters, 16.3%).
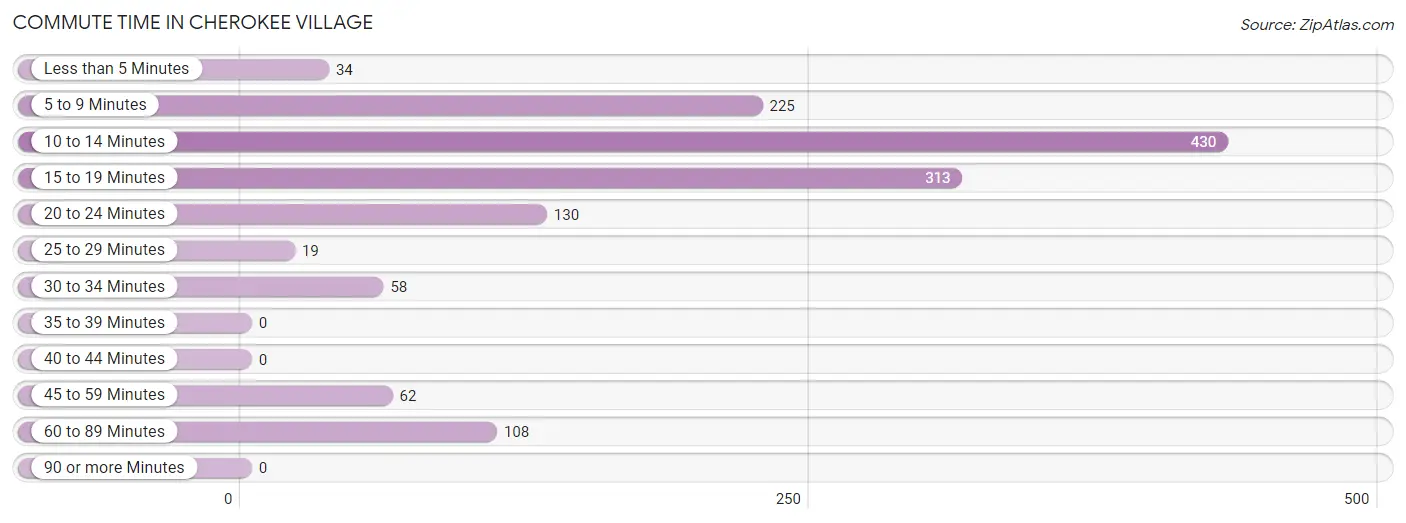
| Commute Time | # Commuters | % Commuters |
| Less than 5 Minutes | 34 | 2.5% |
| 5 to 9 Minutes | 225 | 16.3% |
| 10 to 14 Minutes | 430 | 31.2% |
| 15 to 19 Minutes | 313 | 22.7% |
| 20 to 24 Minutes | 130 | 9.4% |
| 25 to 29 Minutes | 19 | 1.4% |
| 30 to 34 Minutes | 58 | 4.2% |
| 35 to 39 Minutes | 0 | 0.0% |
| 40 to 44 Minutes | 0 | 0.0% |
| 45 to 59 Minutes | 62 | 4.5% |
| 60 to 89 Minutes | 108 | 7.8% |
| 90 or more Minutes | 0 | 0.0% |
Commute Time by Sex in Cherokee Village
The most common commute times in Cherokee Village are 10 to 14 minutes (292 commuters, 33.3%) for males and 10 to 14 minutes (138 commuters, 27.4%) for females.
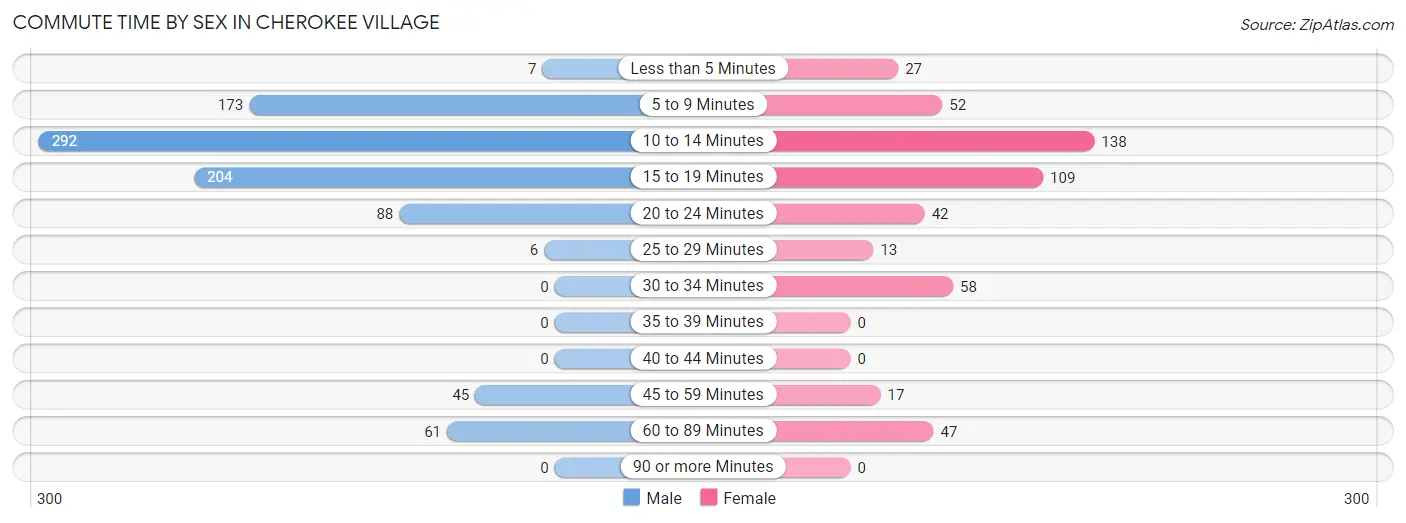
| Commute Time | Male | Female |
| Less than 5 Minutes | 7 (0.8%) | 27 (5.4%) |
| 5 to 9 Minutes | 173 (19.8%) | 52 (10.3%) |
| 10 to 14 Minutes | 292 (33.3%) | 138 (27.4%) |
| 15 to 19 Minutes | 204 (23.3%) | 109 (21.7%) |
| 20 to 24 Minutes | 88 (10.1%) | 42 (8.4%) |
| 25 to 29 Minutes | 6 (0.7%) | 13 (2.6%) |
| 30 to 34 Minutes | 0 (0.0%) | 58 (11.5%) |
| 35 to 39 Minutes | 0 (0.0%) | 0 (0.0%) |
| 40 to 44 Minutes | 0 (0.0%) | 0 (0.0%) |
| 45 to 59 Minutes | 45 (5.1%) | 17 (3.4%) |
| 60 to 89 Minutes | 61 (7.0%) | 47 (9.3%) |
| 90 or more Minutes | 0 (0.0%) | 0 (0.0%) |
Time of Departure to Work by Sex in Cherokee Village
The most frequent times of departure to work in Cherokee Village are 7:30 AM to 7:59 AM (183, 20.9%) for males and 7:00 AM to 7:29 AM (110, 21.9%) for females.
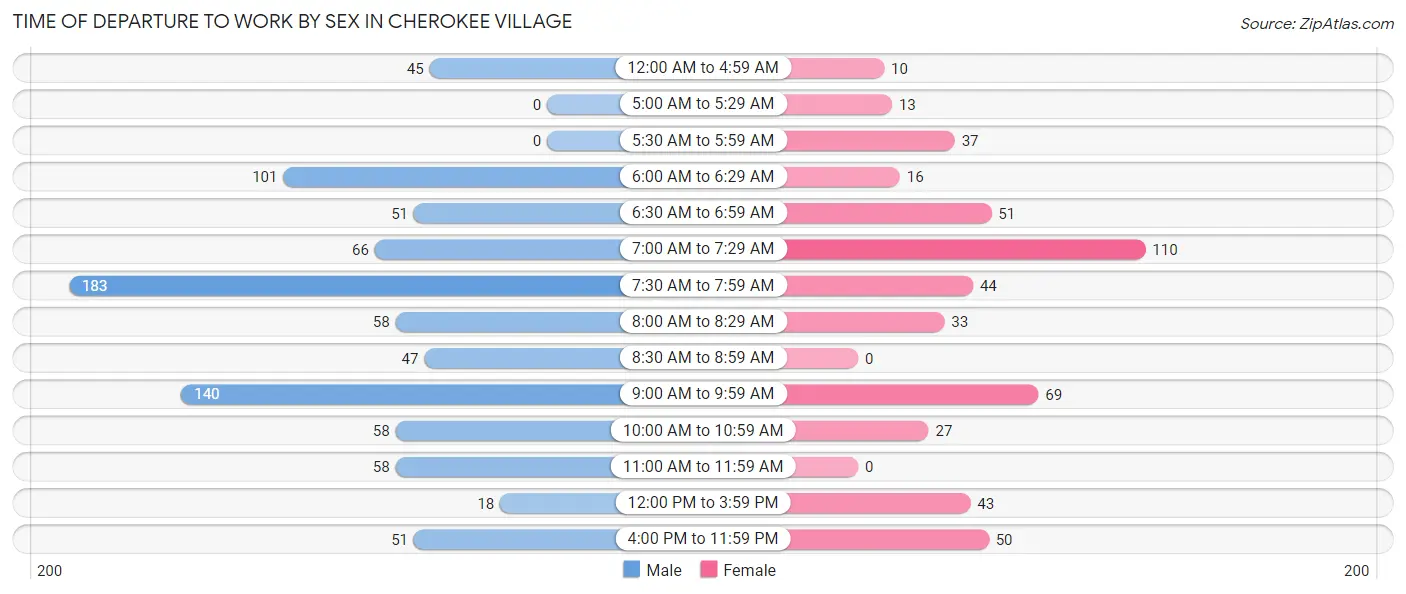
| Time of Departure | Male | Female |
| 12:00 AM to 4:59 AM | 45 (5.1%) | 10 (2.0%) |
| 5:00 AM to 5:29 AM | 0 (0.0%) | 13 (2.6%) |
| 5:30 AM to 5:59 AM | 0 (0.0%) | 37 (7.4%) |
| 6:00 AM to 6:29 AM | 101 (11.5%) | 16 (3.2%) |
| 6:30 AM to 6:59 AM | 51 (5.8%) | 51 (10.1%) |
| 7:00 AM to 7:29 AM | 66 (7.5%) | 110 (21.9%) |
| 7:30 AM to 7:59 AM | 183 (20.9%) | 44 (8.7%) |
| 8:00 AM to 8:29 AM | 58 (6.6%) | 33 (6.6%) |
| 8:30 AM to 8:59 AM | 47 (5.4%) | 0 (0.0%) |
| 9:00 AM to 9:59 AM | 140 (16.0%) | 69 (13.7%) |
| 10:00 AM to 10:59 AM | 58 (6.6%) | 27 (5.4%) |
| 11:00 AM to 11:59 AM | 58 (6.6%) | 0 (0.0%) |
| 12:00 PM to 3:59 PM | 18 (2.1%) | 43 (8.6%) |
| 4:00 PM to 11:59 PM | 51 (5.8%) | 50 (9.9%) |
| Total | 876 (100.0%) | 503 (100.0%) |
Housing Occupancy in Cherokee Village
Occupancy by Ownership in Cherokee Village
Of the total 2,083 dwellings in Cherokee Village, owner-occupied units account for 1,822 (87.5%), while renter-occupied units make up 261 (12.5%).
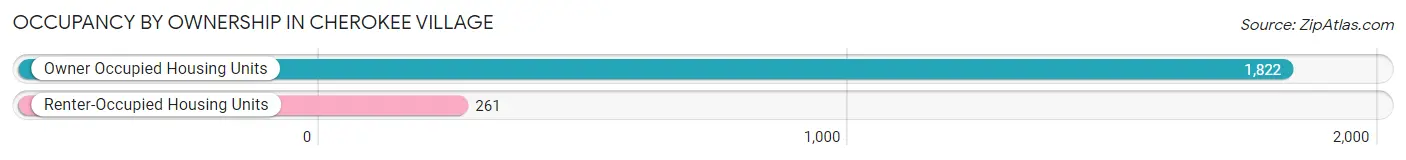
| Occupancy | # Housing Units | % Housing Units |
| Owner Occupied Housing Units | 1,822 | 87.5% |
| Renter-Occupied Housing Units | 261 | 12.5% |
| Total Occupied Housing Units | 2,083 | 100.0% |
Occupancy by Household Size in Cherokee Village
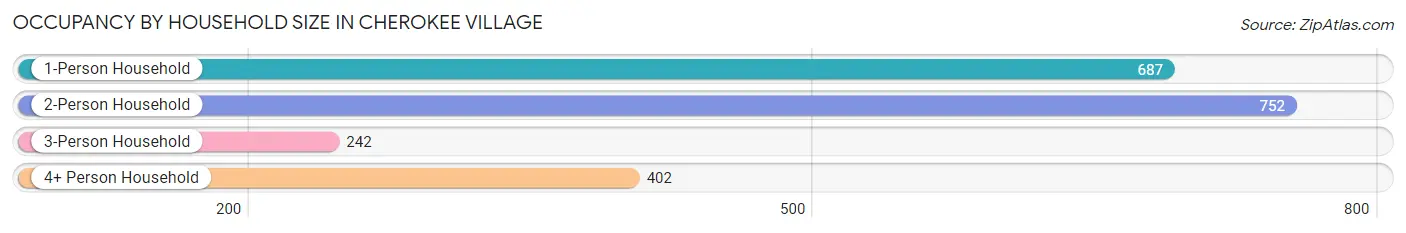
| Household Size | # Housing Units | % Housing Units |
| 1-Person Household | 687 | 33.0% |
| 2-Person Household | 752 | 36.1% |
| 3-Person Household | 242 | 11.6% |
| 4+ Person Household | 402 | 19.3% |
| Total Housing Units | 2,083 | 100.0% |
Occupancy by Ownership by Household Size in Cherokee Village
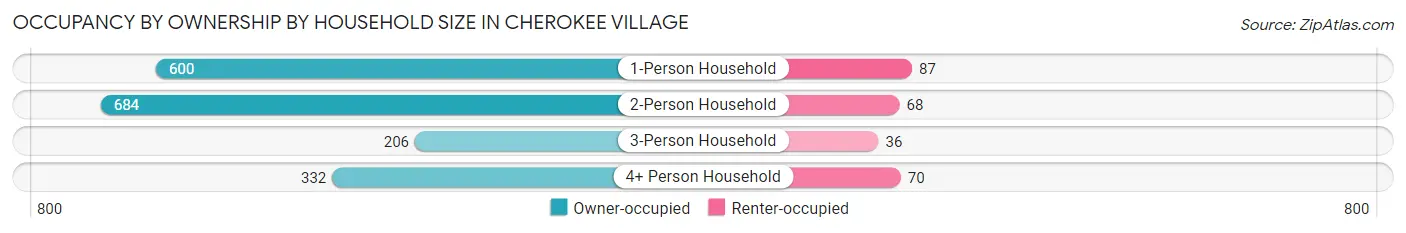
| Household Size | Owner-occupied | Renter-occupied |
| 1-Person Household | 600 (87.3%) | 87 (12.7%) |
| 2-Person Household | 684 (91.0%) | 68 (9.0%) |
| 3-Person Household | 206 (85.1%) | 36 (14.9%) |
| 4+ Person Household | 332 (82.6%) | 70 (17.4%) |
| Total Housing Units | 1,822 (87.5%) | 261 (12.5%) |
Occupancy by Educational Attainment in Cherokee Village
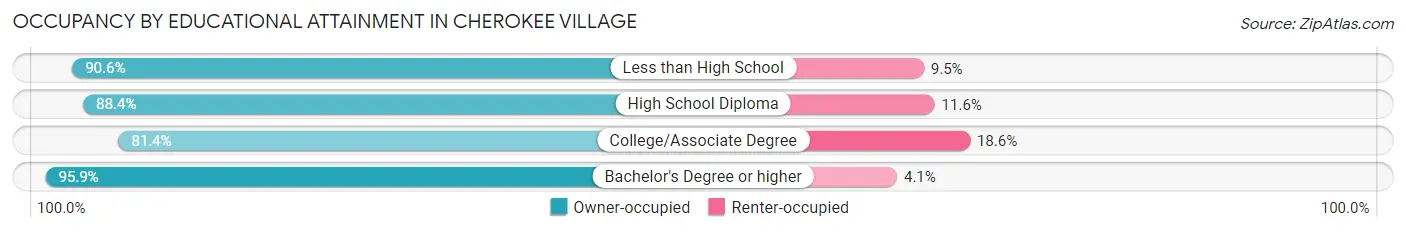
| Household Size | Owner-occupied | Renter-occupied |
| Less than High School | 230 (90.5%) | 24 (9.5%) |
| High School Diploma | 641 (88.4%) | 84 (11.6%) |
| College/Associate Degree | 604 (81.4%) | 138 (18.6%) |
| Bachelor's Degree or higher | 347 (95.9%) | 15 (4.1%) |
Occupancy by Age of Householder in Cherokee Village
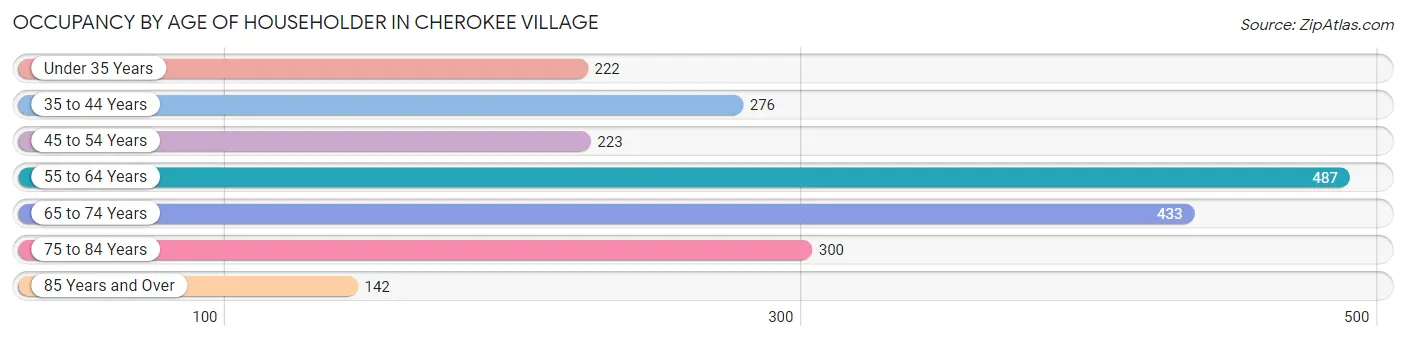
| Age Bracket | # Households | % Households |
| Under 35 Years | 222 | 10.7% |
| 35 to 44 Years | 276 | 13.3% |
| 45 to 54 Years | 223 | 10.7% |
| 55 to 64 Years | 487 | 23.4% |
| 65 to 74 Years | 433 | 20.8% |
| 75 to 84 Years | 300 | 14.4% |
| 85 Years and Over | 142 | 6.8% |
| Total | 2,083 | 100.0% |
Housing Finances in Cherokee Village
Median Income by Occupancy in Cherokee Village
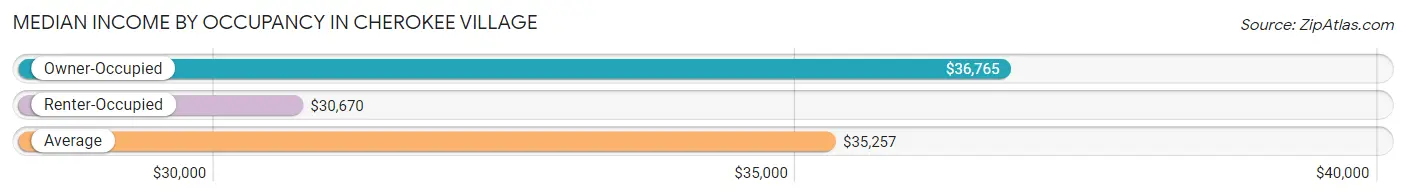
| Occupancy Type | # Households | Median Income |
| Owner-Occupied | 1,822 (87.5%) | $36,765 |
| Renter-Occupied | 261 (12.5%) | $30,670 |
| Average | 2,083 (100.0%) | $35,257 |
Occupancy by Householder Income Bracket in Cherokee Village
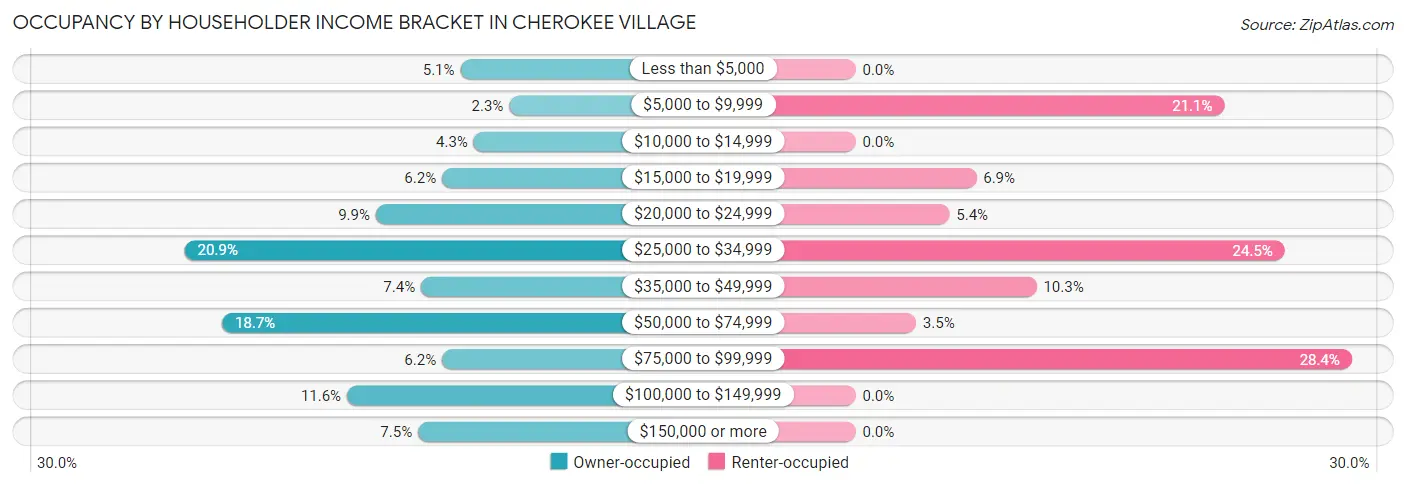
| Income Bracket | Owner-occupied | Renter-occupied |
| Less than $5,000 | 93 (5.1%) | 0 (0.0%) |
| $5,000 to $9,999 | 42 (2.3%) | 55 (21.1%) |
| $10,000 to $14,999 | 79 (4.3%) | 0 (0.0%) |
| $15,000 to $19,999 | 112 (6.1%) | 18 (6.9%) |
| $20,000 to $24,999 | 181 (9.9%) | 14 (5.4%) |
| $25,000 to $34,999 | 380 (20.9%) | 64 (24.5%) |
| $35,000 to $49,999 | 134 (7.3%) | 27 (10.3%) |
| $50,000 to $74,999 | 341 (18.7%) | 9 (3.5%) |
| $75,000 to $99,999 | 112 (6.1%) | 74 (28.3%) |
| $100,000 to $149,999 | 211 (11.6%) | 0 (0.0%) |
| $150,000 or more | 137 (7.5%) | 0 (0.0%) |
| Total | 1,822 (100.0%) | 261 (100.0%) |
Monthly Housing Cost Tiers in Cherokee Village
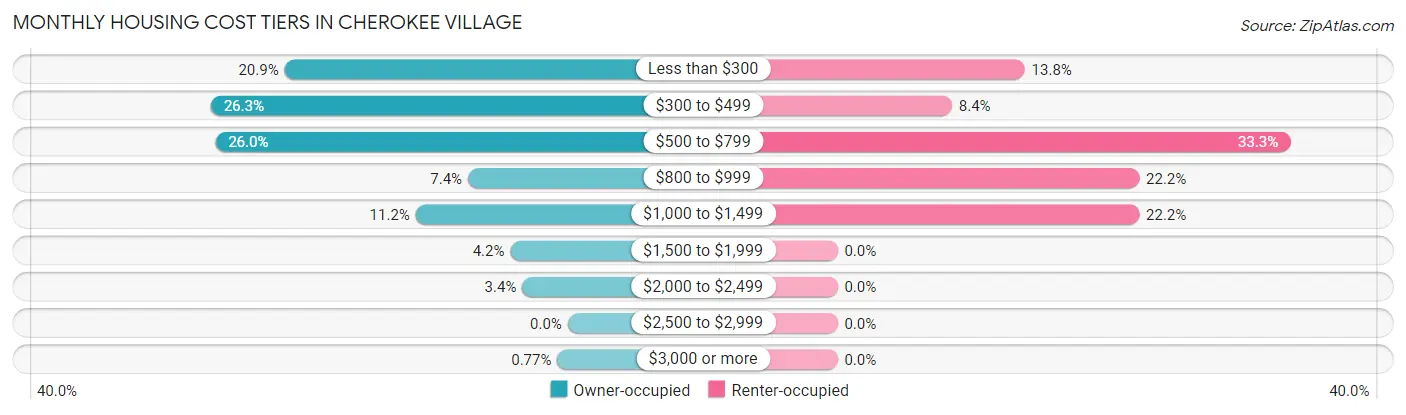
| Monthly Cost | Owner-occupied | Renter-occupied |
| Less than $300 | 380 (20.9%) | 36 (13.8%) |
| $300 to $499 | 479 (26.3%) | 22 (8.4%) |
| $500 to $799 | 473 (26.0%) | 87 (33.3%) |
| $800 to $999 | 134 (7.3%) | 58 (22.2%) |
| $1,000 to $1,499 | 204 (11.2%) | 58 (22.2%) |
| $1,500 to $1,999 | 77 (4.2%) | 0 (0.0%) |
| $2,000 to $2,499 | 61 (3.4%) | 0 (0.0%) |
| $2,500 to $2,999 | 0 (0.0%) | 0 (0.0%) |
| $3,000 or more | 14 (0.8%) | 0 (0.0%) |
| Total | 1,822 (100.0%) | 261 (100.0%) |
Physical Housing Characteristics in Cherokee Village
Housing Structures in Cherokee Village
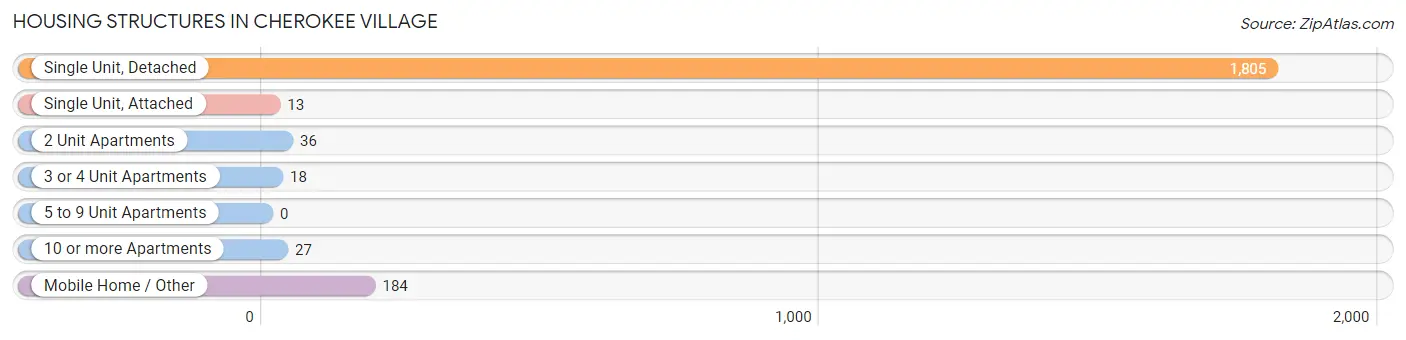
| Structure Type | # Housing Units | % Housing Units |
| Single Unit, Detached | 1,805 | 86.7% |
| Single Unit, Attached | 13 | 0.6% |
| 2 Unit Apartments | 36 | 1.7% |
| 3 or 4 Unit Apartments | 18 | 0.9% |
| 5 to 9 Unit Apartments | 0 | 0.0% |
| 10 or more Apartments | 27 | 1.3% |
| Mobile Home / Other | 184 | 8.8% |
| Total | 2,083 | 100.0% |
Housing Structures by Occupancy in Cherokee Village
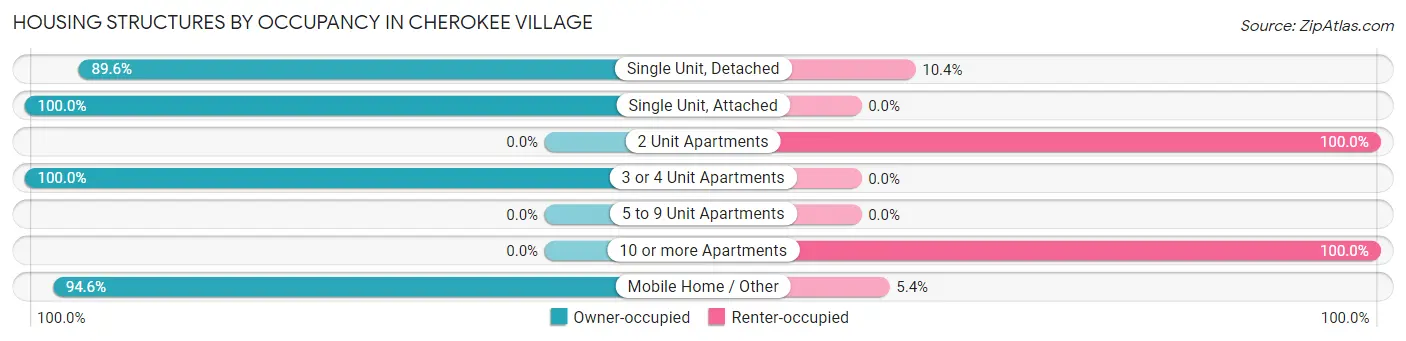
| Structure Type | Owner-occupied | Renter-occupied |
| Single Unit, Detached | 1,617 (89.6%) | 188 (10.4%) |
| Single Unit, Attached | 13 (100.0%) | 0 (0.0%) |
| 2 Unit Apartments | 0 (0.0%) | 36 (100.0%) |
| 3 or 4 Unit Apartments | 18 (100.0%) | 0 (0.0%) |
| 5 to 9 Unit Apartments | 0 (0.0%) | 0 (0.0%) |
| 10 or more Apartments | 0 (0.0%) | 27 (100.0%) |
| Mobile Home / Other | 174 (94.6%) | 10 (5.4%) |
| Total | 1,822 (87.5%) | 261 (12.5%) |
Housing Structures by Number of Rooms in Cherokee Village
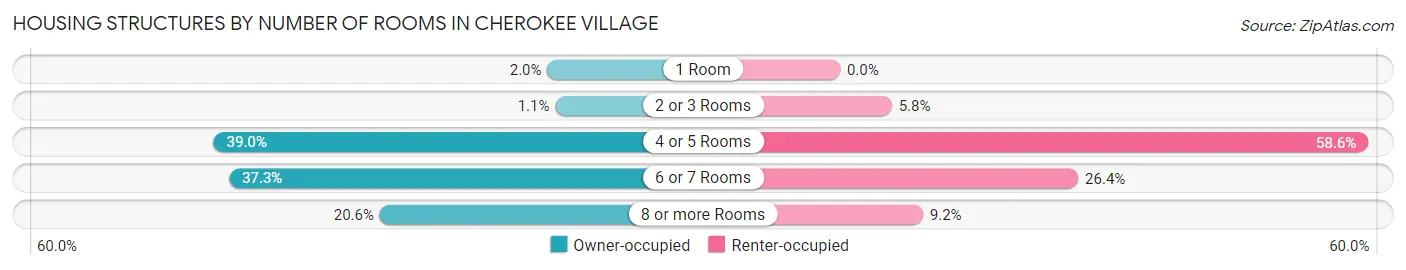
| Number of Rooms | Owner-occupied | Renter-occupied |
| 1 Room | 36 (2.0%) | 0 (0.0%) |
| 2 or 3 Rooms | 20 (1.1%) | 15 (5.8%) |
| 4 or 5 Rooms | 711 (39.0%) | 153 (58.6%) |
| 6 or 7 Rooms | 680 (37.3%) | 69 (26.4%) |
| 8 or more Rooms | 375 (20.6%) | 24 (9.2%) |
| Total | 1,822 (100.0%) | 261 (100.0%) |
Housing Structure by Heating Type in Cherokee Village
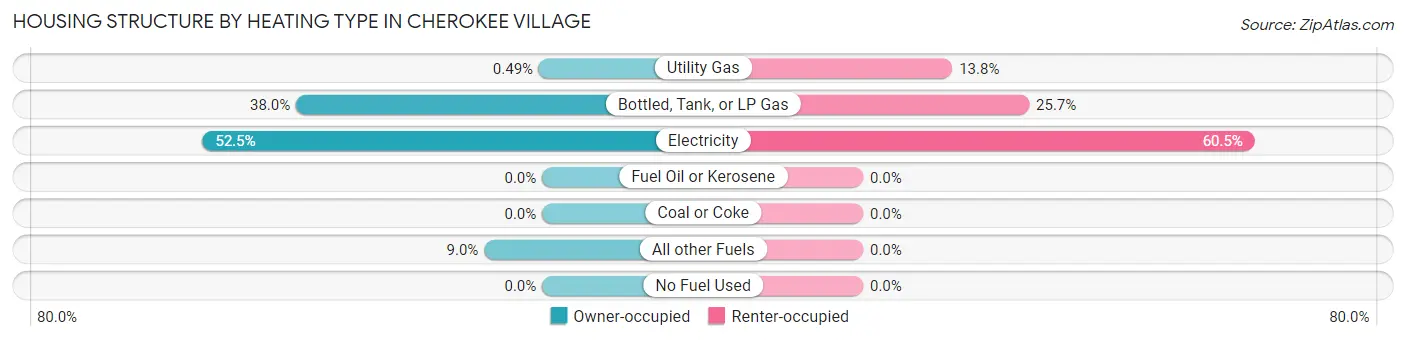
| Heating Type | Owner-occupied | Renter-occupied |
| Utility Gas | 9 (0.5%) | 36 (13.8%) |
| Bottled, Tank, or LP Gas | 693 (38.0%) | 67 (25.7%) |
| Electricity | 957 (52.5%) | 158 (60.5%) |
| Fuel Oil or Kerosene | 0 (0.0%) | 0 (0.0%) |
| Coal or Coke | 0 (0.0%) | 0 (0.0%) |
| All other Fuels | 163 (8.9%) | 0 (0.0%) |
| No Fuel Used | 0 (0.0%) | 0 (0.0%) |
| Total | 1,822 (100.0%) | 261 (100.0%) |
Household Vehicle Usage in Cherokee Village
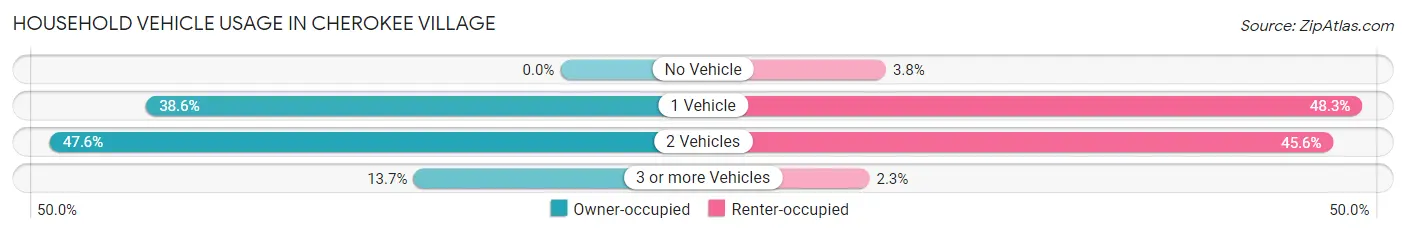
| Vehicles per Household | Owner-occupied | Renter-occupied |
| No Vehicle | 0 (0.0%) | 10 (3.8%) |
| 1 Vehicle | 704 (38.6%) | 126 (48.3%) |
| 2 Vehicles | 868 (47.6%) | 119 (45.6%) |
| 3 or more Vehicles | 250 (13.7%) | 6 (2.3%) |
| Total | 1,822 (100.0%) | 261 (100.0%) |
Real Estate & Mortgages in Cherokee Village
Real Estate and Mortgage Overview in Cherokee Village
| Characteristic | Without Mortgage | With Mortgage |
| Housing Units | 1,015 | 807 |
| Median Property Value | $79,200 | $92,700 |
| Median Household Income | $34,421 | $120 |
| Monthly Housing Costs | $353 | $14 |
| Real Estate Taxes | $623 | $10 |
Property Value by Mortgage Status in Cherokee Village
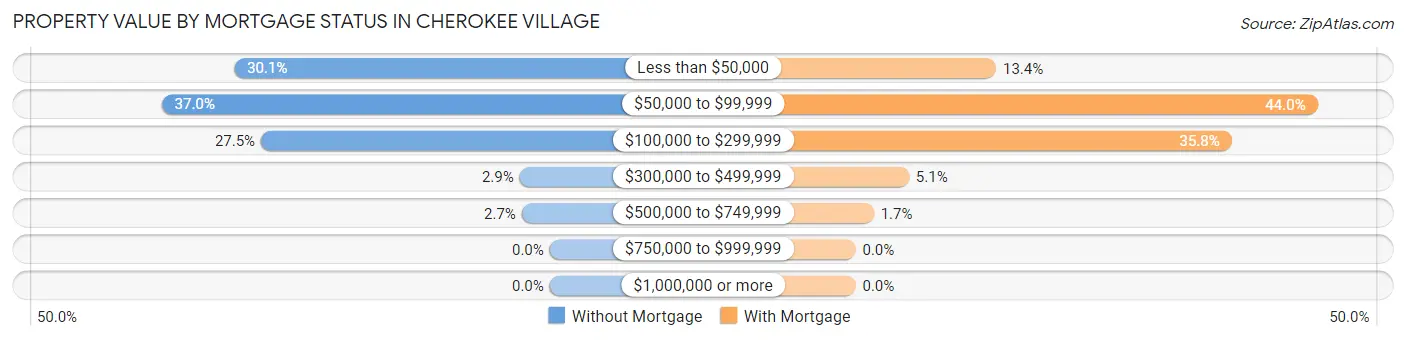
| Property Value | Without Mortgage | With Mortgage |
| Less than $50,000 | 305 (30.0%) | 108 (13.4%) |
| $50,000 to $99,999 | 375 (36.9%) | 355 (44.0%) |
| $100,000 to $299,999 | 279 (27.5%) | 289 (35.8%) |
| $300,000 to $499,999 | 29 (2.9%) | 41 (5.1%) |
| $500,000 to $749,999 | 27 (2.7%) | 14 (1.7%) |
| $750,000 to $999,999 | 0 (0.0%) | 0 (0.0%) |
| $1,000,000 or more | 0 (0.0%) | 0 (0.0%) |
| Total | 1,015 (100.0%) | 807 (100.0%) |
Household Income by Mortgage Status in Cherokee Village
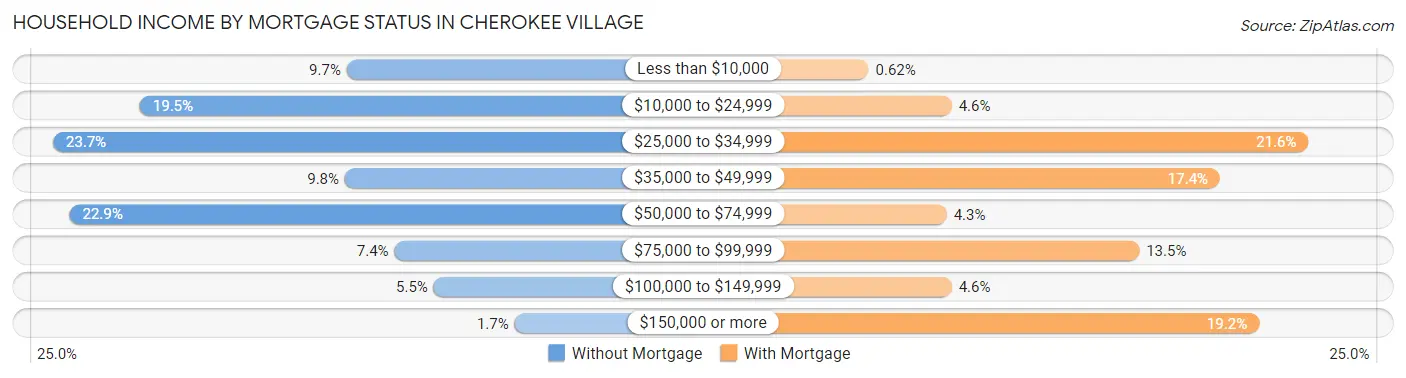
| Household Income | Without Mortgage | With Mortgage |
| Less than $10,000 | 98 (9.7%) | 5 (0.6%) |
| $10,000 to $24,999 | 198 (19.5%) | 37 (4.6%) |
| $25,000 to $34,999 | 240 (23.6%) | 174 (21.6%) |
| $35,000 to $49,999 | 99 (9.8%) | 140 (17.3%) |
| $50,000 to $74,999 | 232 (22.9%) | 35 (4.3%) |
| $75,000 to $99,999 | 75 (7.4%) | 109 (13.5%) |
| $100,000 to $149,999 | 56 (5.5%) | 37 (4.6%) |
| $150,000 or more | 17 (1.7%) | 155 (19.2%) |
| Total | 1,015 (100.0%) | 807 (100.0%) |
Property Value to Household Income Ratio in Cherokee Village
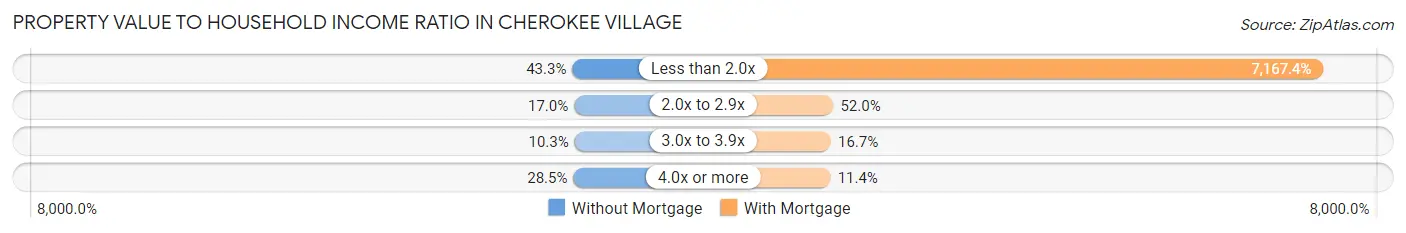
| Value-to-Income Ratio | Without Mortgage | With Mortgage |
| Less than 2.0x | 439 (43.2%) | 57,841 (7,167.4%) |
| 2.0x to 2.9x | 172 (17.0%) | 420 (52.0%) |
| 3.0x to 3.9x | 104 (10.2%) | 135 (16.7%) |
| 4.0x or more | 289 (28.5%) | 92 (11.4%) |
| Total | 1,015 (100.0%) | 807 (100.0%) |
Real Estate Taxes by Mortgage Status in Cherokee Village
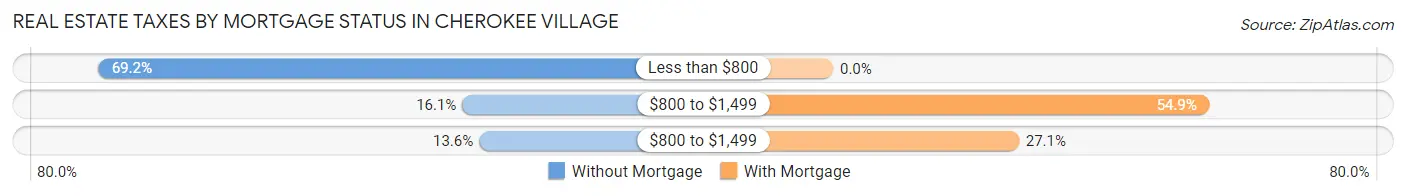
| Property Taxes | Without Mortgage | With Mortgage |
| Less than $800 | 702 (69.2%) | 0 (0.0%) |
| $800 to $1,499 | 163 (16.1%) | 443 (54.9%) |
| $800 to $1,499 | 138 (13.6%) | 219 (27.1%) |
| Total | 1,015 (100.0%) | 807 (100.0%) |
Health & Disability in Cherokee Village
Health Insurance Coverage by Age in Cherokee Village
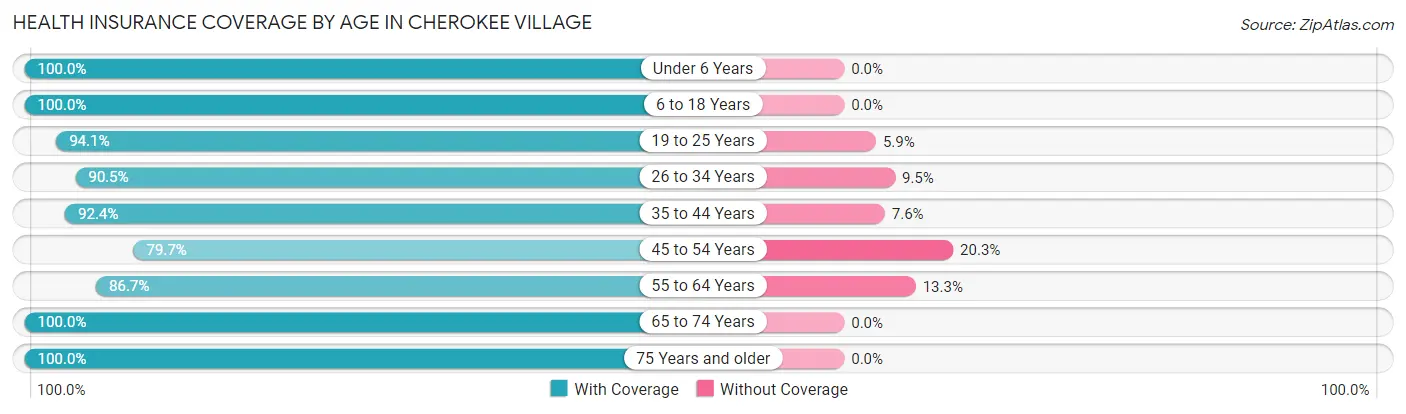
| Age Bracket | With Coverage | Without Coverage |
| Under 6 Years | 383 (100.0%) | 0 (0.0%) |
| 6 to 18 Years | 716 (100.0%) | 0 (0.0%) |
| 19 to 25 Years | 478 (94.1%) | 30 (5.9%) |
| 26 to 34 Years | 201 (90.5%) | 21 (9.5%) |
| 35 to 44 Years | 477 (92.4%) | 39 (7.6%) |
| 45 to 54 Years | 314 (79.7%) | 80 (20.3%) |
| 55 to 64 Years | 716 (86.7%) | 110 (13.3%) |
| 65 to 74 Years | 799 (100.0%) | 0 (0.0%) |
| 75 Years and older | 697 (100.0%) | 0 (0.0%) |
| Total | 4,781 (94.5%) | 280 (5.5%) |
Health Insurance Coverage by Citizenship Status in Cherokee Village
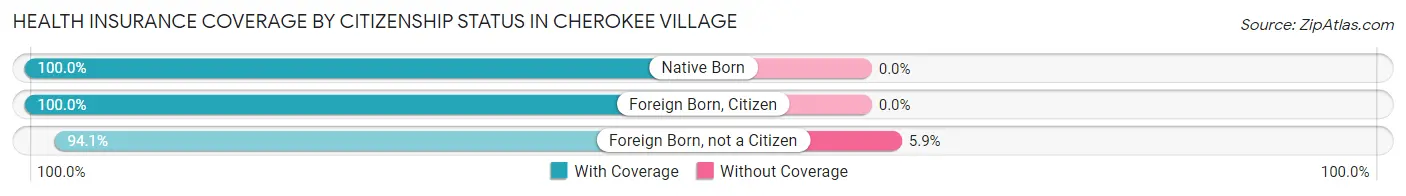
| Citizenship Status | With Coverage | Without Coverage |
| Native Born | 383 (100.0%) | 0 (0.0%) |
| Foreign Born, Citizen | 716 (100.0%) | 0 (0.0%) |
| Foreign Born, not a Citizen | 478 (94.1%) | 30 (5.9%) |
Health Insurance Coverage by Household Income in Cherokee Village
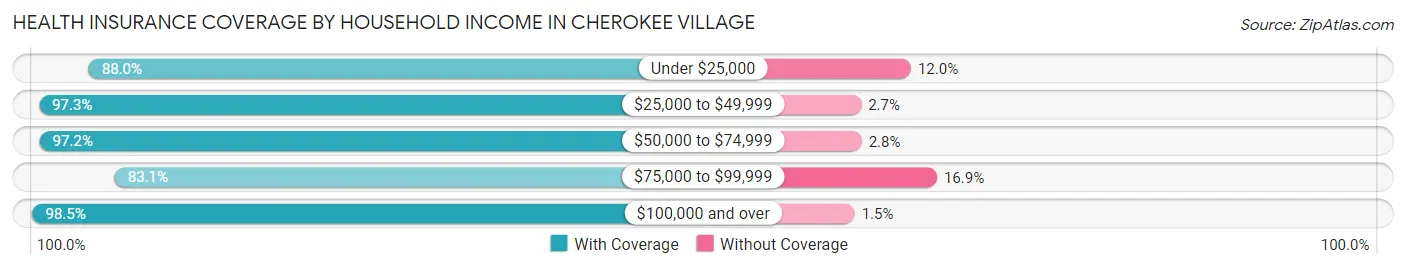
| Household Income | With Coverage | Without Coverage |
| Under $25,000 | 929 (88.0%) | 127 (12.0%) |
| $25,000 to $49,999 | 1,367 (97.3%) | 38 (2.7%) |
| $50,000 to $74,999 | 799 (97.2%) | 23 (2.8%) |
| $75,000 to $99,999 | 354 (83.1%) | 72 (16.9%) |
| $100,000 and over | 1,332 (98.5%) | 20 (1.5%) |
Public vs Private Health Insurance Coverage by Age in Cherokee Village
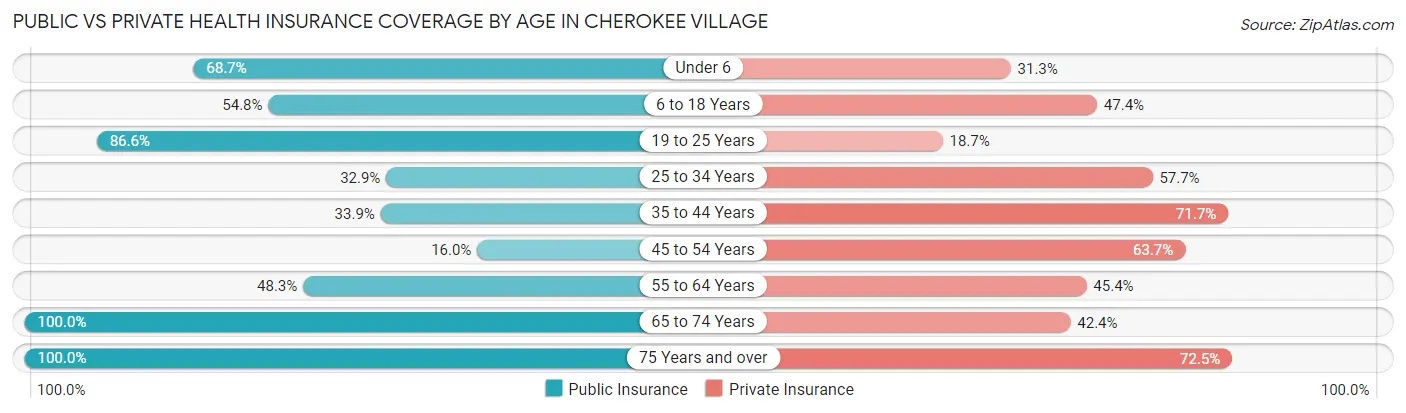
| Age Bracket | Public Insurance | Private Insurance |
| Under 6 | 263 (68.7%) | 120 (31.3%) |
| 6 to 18 Years | 392 (54.7%) | 339 (47.3%) |
| 19 to 25 Years | 440 (86.6%) | 95 (18.7%) |
| 25 to 34 Years | 73 (32.9%) | 128 (57.7%) |
| 35 to 44 Years | 175 (33.9%) | 370 (71.7%) |
| 45 to 54 Years | 63 (16.0%) | 251 (63.7%) |
| 55 to 64 Years | 399 (48.3%) | 375 (45.4%) |
| 65 to 74 Years | 799 (100.0%) | 339 (42.4%) |
| 75 Years and over | 697 (100.0%) | 505 (72.5%) |
| Total | 3,301 (65.2%) | 2,522 (49.8%) |
Disability Status by Sex by Age in Cherokee Village
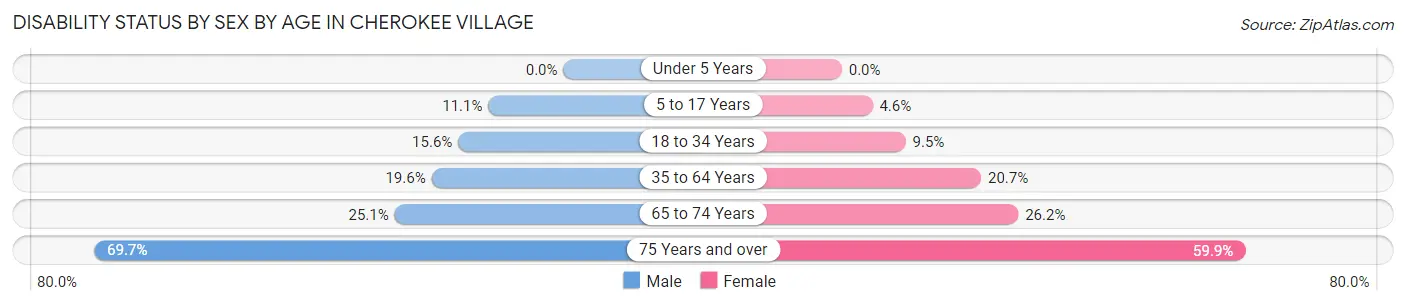
| Age Bracket | Male | Female |
| Under 5 Years | 0 (0.0%) | 0 (0.0%) |
| 5 to 17 Years | 42 (11.1%) | 19 (4.5%) |
| 18 to 34 Years | 57 (15.6%) | 36 (9.5%) |
| 35 to 64 Years | 195 (19.6%) | 153 (20.7%) |
| 65 to 74 Years | 96 (25.1%) | 109 (26.2%) |
| 75 Years and over | 232 (69.7%) | 218 (59.9%) |
Disability Class by Sex by Age in Cherokee Village
Disability Class: Hearing Difficulty
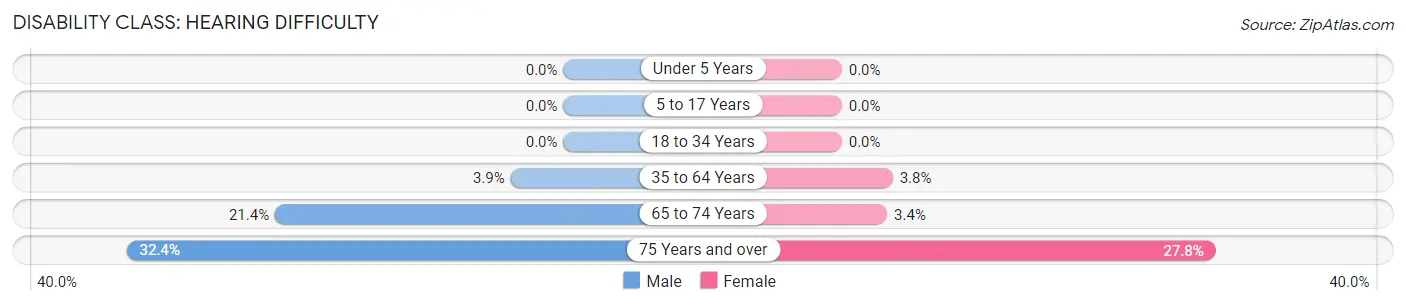
| Age Bracket | Male | Female |
| Under 5 Years | 0 (0.0%) | 0 (0.0%) |
| 5 to 17 Years | 0 (0.0%) | 0 (0.0%) |
| 18 to 34 Years | 0 (0.0%) | 0 (0.0%) |
| 35 to 64 Years | 39 (3.9%) | 28 (3.8%) |
| 65 to 74 Years | 82 (21.4%) | 14 (3.4%) |
| 75 Years and over | 108 (32.4%) | 101 (27.8%) |
Disability Class: Vision Difficulty
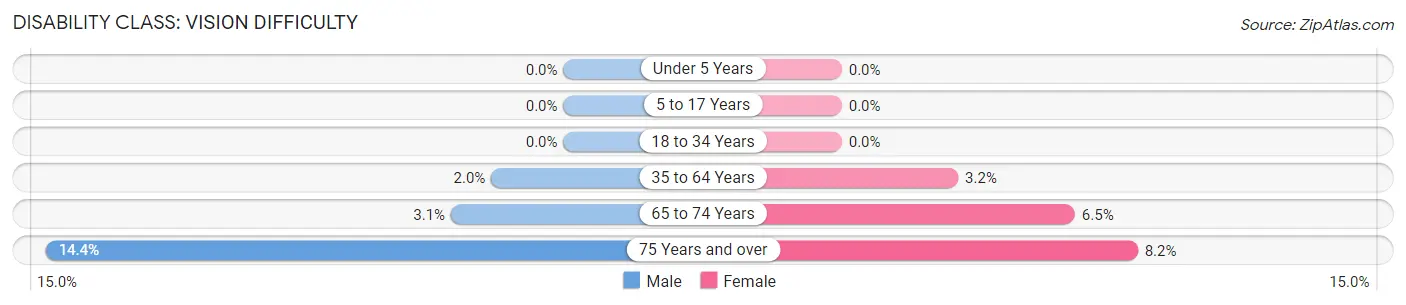
| Age Bracket | Male | Female |
| Under 5 Years | 0 (0.0%) | 0 (0.0%) |
| 5 to 17 Years | 0 (0.0%) | 0 (0.0%) |
| 18 to 34 Years | 0 (0.0%) | 0 (0.0%) |
| 35 to 64 Years | 20 (2.0%) | 24 (3.2%) |
| 65 to 74 Years | 12 (3.1%) | 27 (6.5%) |
| 75 Years and over | 48 (14.4%) | 30 (8.2%) |
Disability Class: Cognitive Difficulty
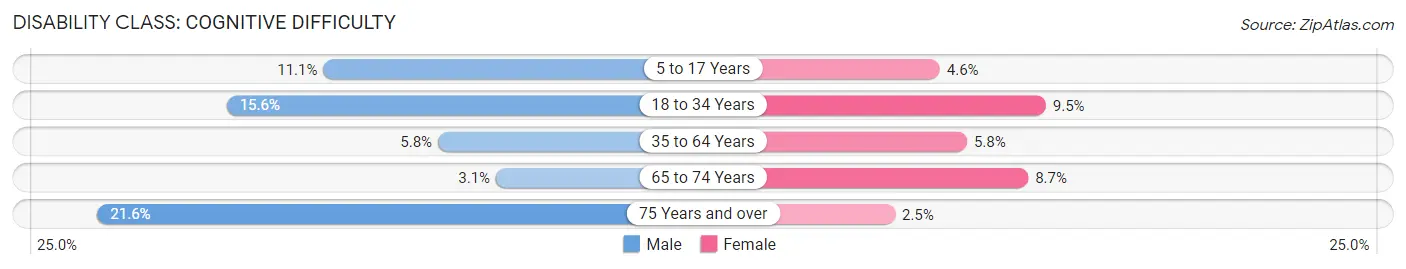
| Age Bracket | Male | Female |
| 5 to 17 Years | 42 (11.1%) | 19 (4.5%) |
| 18 to 34 Years | 57 (15.6%) | 36 (9.5%) |
| 35 to 64 Years | 58 (5.8%) | 43 (5.8%) |
| 65 to 74 Years | 12 (3.1%) | 36 (8.6%) |
| 75 Years and over | 72 (21.6%) | 9 (2.5%) |
Disability Class: Ambulatory Difficulty
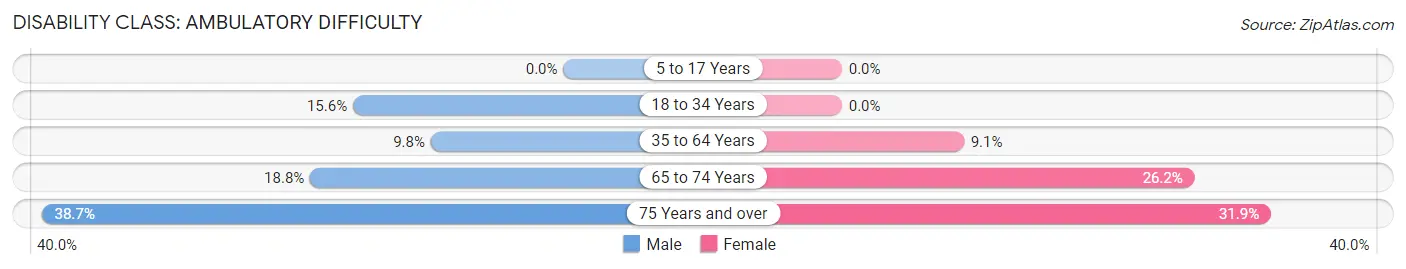
| Age Bracket | Male | Female |
| 5 to 17 Years | 0 (0.0%) | 0 (0.0%) |
| 18 to 34 Years | 57 (15.6%) | 0 (0.0%) |
| 35 to 64 Years | 98 (9.8%) | 67 (9.0%) |
| 65 to 74 Years | 72 (18.8%) | 109 (26.2%) |
| 75 Years and over | 129 (38.7%) | 116 (31.9%) |
Disability Class: Self-Care Difficulty
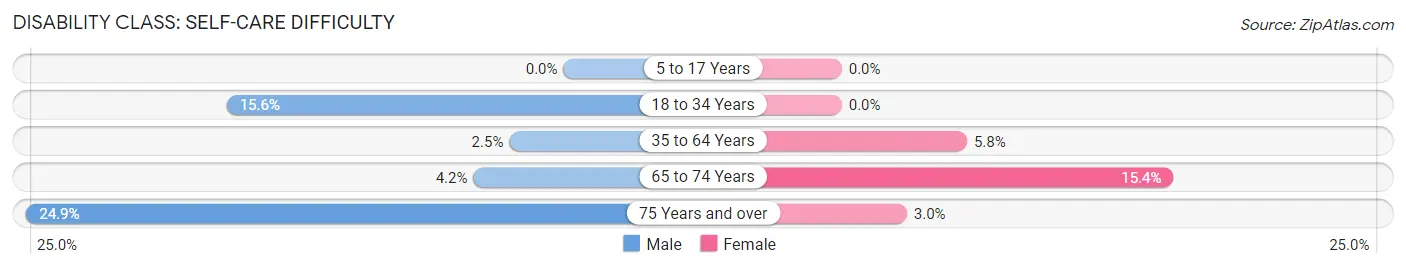
| Age Bracket | Male | Female |
| 5 to 17 Years | 0 (0.0%) | 0 (0.0%) |
| 18 to 34 Years | 57 (15.6%) | 0 (0.0%) |
| 35 to 64 Years | 25 (2.5%) | 43 (5.8%) |
| 65 to 74 Years | 16 (4.2%) | 64 (15.4%) |
| 75 Years and over | 83 (24.9%) | 11 (3.0%) |
Technology Access in Cherokee Village
Computing Device Access in Cherokee Village
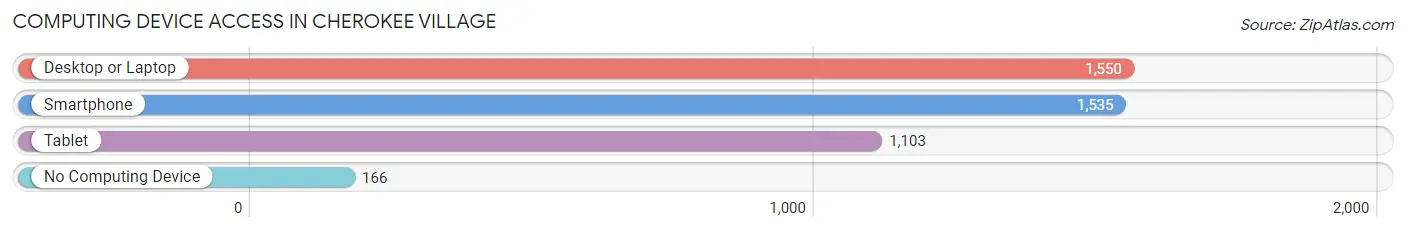
| Device Type | # Households | % Households |
| Desktop or Laptop | 1,550 | 74.4% |
| Smartphone | 1,535 | 73.7% |
| Tablet | 1,103 | 52.9% |
| No Computing Device | 166 | 8.0% |
| Total | 2,083 | 100.0% |
Internet Access in Cherokee Village
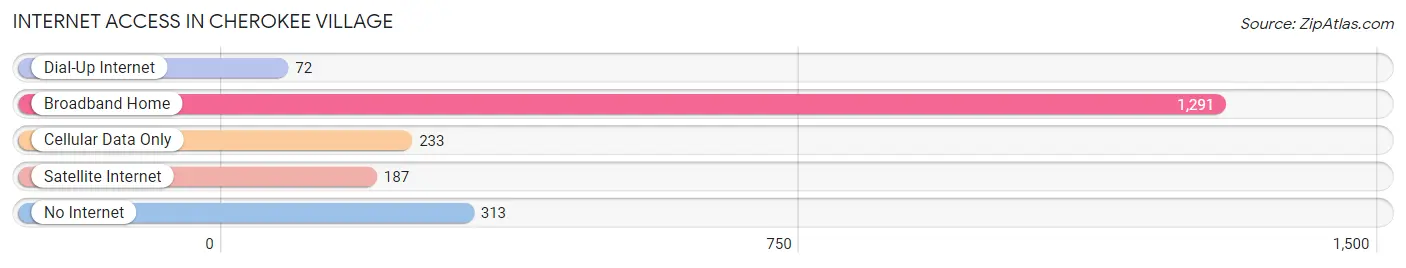
| Internet Type | # Households | % Households |
| Dial-Up Internet | 72 | 3.5% |
| Broadband Home | 1,291 | 62.0% |
| Cellular Data Only | 233 | 11.2% |
| Satellite Internet | 187 | 9.0% |
| No Internet | 313 | 15.0% |
| Total | 2,083 | 100.0% |
Cherokee Village Summary
Cherokee Village is a city located in Sharp and Fulton counties in the state of Arkansas. It is situated in the foothills of the Ozark Mountains and is part of the Ozark-St. Francis National Forest. The city was founded in 1954 and is home to approximately 5,000 people.
History
Cherokee Village was founded in 1954 by the Cherokee Village Development Corporation. The corporation was formed by a group of investors from Little Rock, Arkansas, who wanted to create a retirement community in the Ozark Mountains. The city was named after the Cherokee Indians who once lived in the area.
The city was designed to be a retirement community and was marketed as such. The city was designed with a variety of amenities, including golf courses, lakes, and parks. The city was also designed to be a self-contained community, with its own schools, shopping centers, and medical facilities.
The city has grown steadily since its founding and is now home to over 5,000 people. The city has also become a popular tourist destination, with many visitors coming to enjoy the natural beauty of the Ozark Mountains.
Geography
Cherokee Village is located in the foothills of the Ozark Mountains in Sharp and Fulton counties. The city is situated on the Spring River, which is a tributary of the Black River. The city is surrounded by the Ozark-St. Francis National Forest, which provides a variety of outdoor activities, including hiking, camping, and fishing.
The city has a total area of 8.3 square miles, of which 8.2 square miles is land and 0.1 square miles is water. The city has a humid subtropical climate, with hot, humid summers and mild winters.
Economy
The economy of Cherokee Village is largely based on tourism and retirement. The city is home to several golf courses, which attract visitors from all over the country. The city also has a variety of shops and restaurants, which cater to both tourists and residents.
The city is also home to several manufacturing companies, including a furniture factory and a plastics factory. The city is also home to a variety of service-based businesses, including medical and legal services.
Demographics
As of the 2010 census, the population of Cherokee Village was 5,039. The racial makeup of the city was 95.3% White, 0.7% African American, 0.3% Native American, 0.4% Asian, 0.1% Pacific Islander, 1.2% from other races, and 2.0% from two or more races. Hispanic or Latino of any race were 3.2% of the population.
The median income for a household in the city was $37,917, and the median income for a family was $45,938. The per capita income for the city was $20,945. About 11.2% of families and 14.2% of the population were below the poverty line, including 19.2% of those under age 18 and 8.2% of those age 65 or over.
Common Questions
What is Per Capita Income in Cherokee Village?
Per Capita income in Cherokee Village is $23,247.
What is the Median Family Income in Cherokee Village?
Median Family Income in Cherokee Village is $53,561.
What is the Median Household income in Cherokee Village?
Median Household Income in Cherokee Village is $35,257.
What is Income or Wage Gap in Cherokee Village?
Income or Wage Gap in Cherokee Village is 14.0%.
Women in Cherokee Village earn 86.0 cents for every dollar earned by a man.
What is Inequality or Gini Index in Cherokee Village?
Inequality or Gini Index in Cherokee Village is 0.43.
What is the Total Population of Cherokee Village?
Total Population of Cherokee Village is 5,061.
What is the Total Male Population of Cherokee Village?
Total Male Population of Cherokee Village is 2,667.
What is the Total Female Population of Cherokee Village?
Total Female Population of Cherokee Village is 2,394.
What is the Ratio of Males per 100 Females in Cherokee Village?
There are 111.40 Males per 100 Females in Cherokee Village.
What is the Ratio of Females per 100 Males in Cherokee Village?
There are 89.76 Females per 100 Males in Cherokee Village.
What is the Median Population Age in Cherokee Village?
Median Population Age in Cherokee Village is 49.0 Years.
What is the Average Family Size in Cherokee Village
Average Family Size in Cherokee Village is 3.1 People.
What is the Average Household Size in Cherokee Village
Average Household Size in Cherokee Village is 2.4 People.
How Large is the Labor Force in Cherokee Village?
There are 1,717 People in the Labor Forcein in Cherokee Village.
What is the Percentage of People in the Labor Force in Cherokee Village?
42.1% of People are in the Labor Force in Cherokee Village.
What is the Unemployment Rate in Cherokee Village?
Unemployment Rate in Cherokee Village is 12.0%.