Batesville, AR Map & Demographics
Batesville Map
Batesville Overview
$27,445
PER CAPITA INCOME
$64,899
AVG FAMILY INCOME
$52,304
AVG HOUSEHOLD INCOME
19.6%
WAGE / INCOME GAP [ % ]
80.4¢/ $1
WAGE / INCOME GAP [ $ ]
0.47
INEQUALITY / GINI INDEX
11,163
TOTAL POPULATION
5,528
MALE POPULATION
5,635
FEMALE POPULATION
98.10
MALES / 100 FEMALES
101.94
FEMALES / 100 MALES
35.5
MEDIAN AGE
3.4
AVG FAMILY SIZE
2.5
AVG HOUSEHOLD SIZE
4,712
LABOR FORCE [ PEOPLE ]
54.7%
PERCENT IN LABOR FORCE
5.1%
UNEMPLOYMENT RATE
Batesville Zip Codes
Batesville Area Codes
Income in Batesville
Income Overview in Batesville
Per Capita Income in Batesville is $27,445, while median incomes of families and households are $64,899 and $52,304 respectively.
| Characteristic | Number | Measure |
| Per Capita Income | 11,163 | $27,445 |
| Median Family Income | 2,328 | $64,899 |
| Mean Family Income | 2,328 | $83,802 |
| Median Household Income | 4,149 | $52,304 |
| Mean Household Income | 4,149 | $70,095 |
| Income Deficit | 2,328 | $0 |
| Wage / Income Gap (%) | 11,163 | 19.56% |
| Wage / Income Gap ($) | 11,163 | 80.44¢ per $1 |
| Gini / Inequality Index | 11,163 | 0.47 |
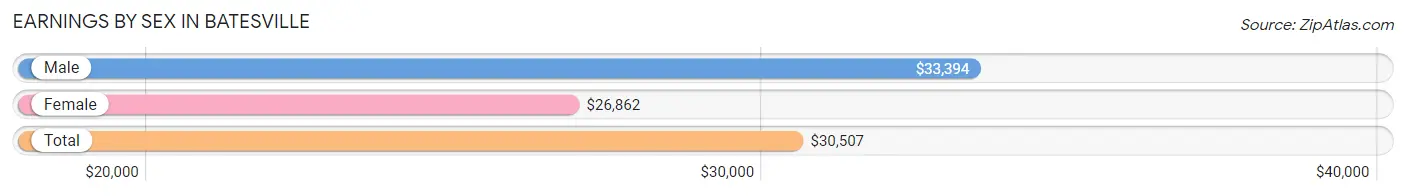
Earnings by Sex in Batesville
Average Earnings in Batesville are $30,507, $33,394 for men and $26,862 for women, a difference of 19.6%.
| Sex | Number | Average Earnings |
| Male | 3,025 (58.8%) | $33,394 |
| Female | 2,121 (41.2%) | $26,862 |
| Total | 5,146 (100.0%) | $30,507 |
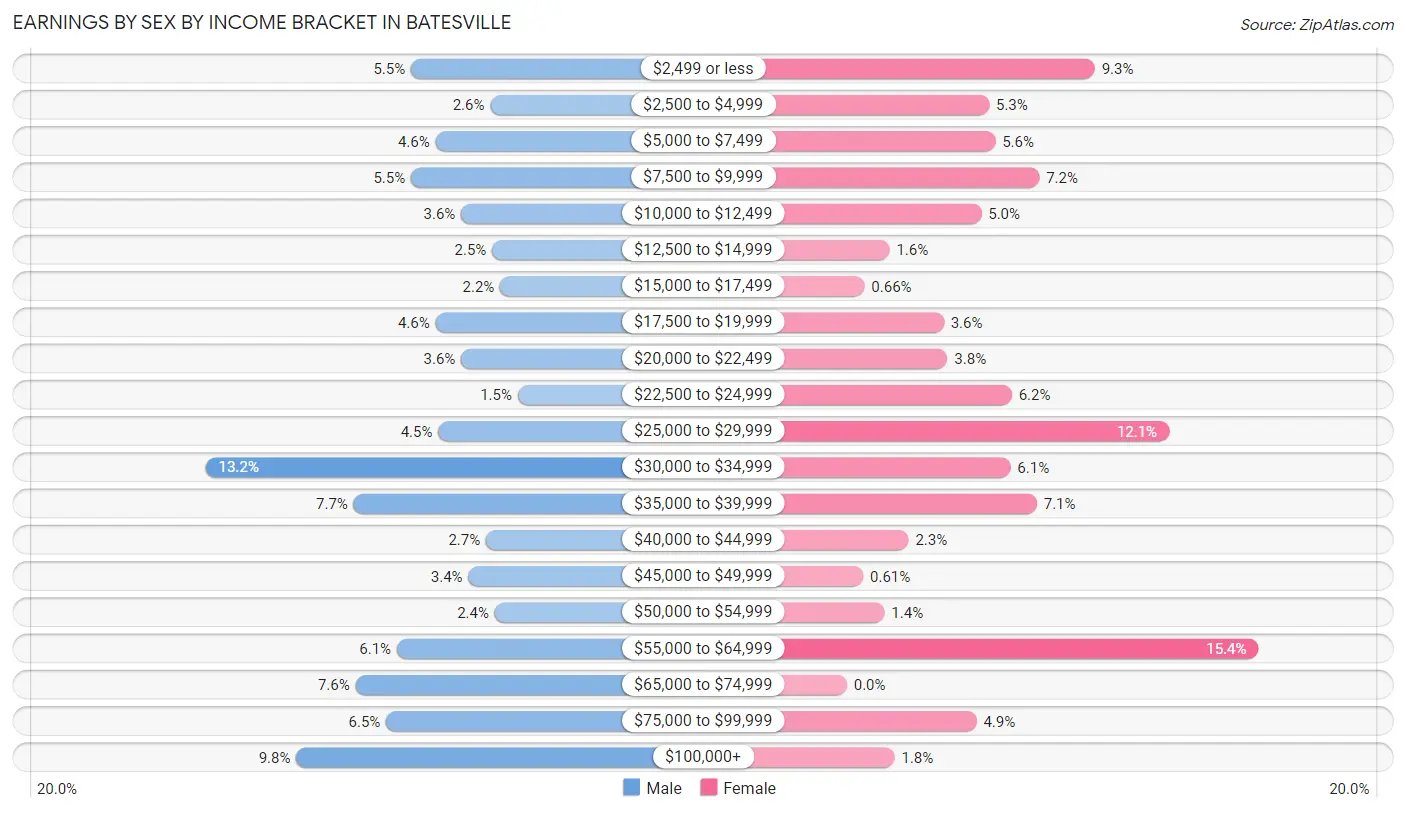
Earnings by Sex by Income Bracket in Batesville
The most common earnings brackets in Batesville are $30,000 to $34,999 for men (400 | 13.2%) and $55,000 to $64,999 for women (327 | 15.4%).
| Income | Male | Female |
| $2,499 or less | 167 (5.5%) | 197 (9.3%) |
| $2,500 to $4,999 | 77 (2.5%) | 113 (5.3%) |
| $5,000 to $7,499 | 139 (4.6%) | 118 (5.6%) |
| $7,500 to $9,999 | 167 (5.5%) | 153 (7.2%) |
| $10,000 to $12,499 | 110 (3.6%) | 107 (5.0%) |
| $12,500 to $14,999 | 75 (2.5%) | 34 (1.6%) |
| $15,000 to $17,499 | 66 (2.2%) | 14 (0.7%) |
| $17,500 to $19,999 | 139 (4.6%) | 77 (3.6%) |
| $20,000 to $22,499 | 110 (3.6%) | 80 (3.8%) |
| $22,500 to $24,999 | 46 (1.5%) | 131 (6.2%) |
| $25,000 to $29,999 | 136 (4.5%) | 256 (12.1%) |
| $30,000 to $34,999 | 400 (13.2%) | 130 (6.1%) |
| $35,000 to $39,999 | 232 (7.7%) | 151 (7.1%) |
| $40,000 to $44,999 | 82 (2.7%) | 49 (2.3%) |
| $45,000 to $49,999 | 102 (3.4%) | 13 (0.6%) |
| $50,000 to $54,999 | 72 (2.4%) | 30 (1.4%) |
| $55,000 to $64,999 | 183 (6.0%) | 327 (15.4%) |
| $65,000 to $74,999 | 230 (7.6%) | 0 (0.0%) |
| $75,000 to $99,999 | 195 (6.5%) | 103 (4.9%) |
| $100,000+ | 297 (9.8%) | 38 (1.8%) |
| Total | 3,025 (100.0%) | 2,121 (100.0%) |
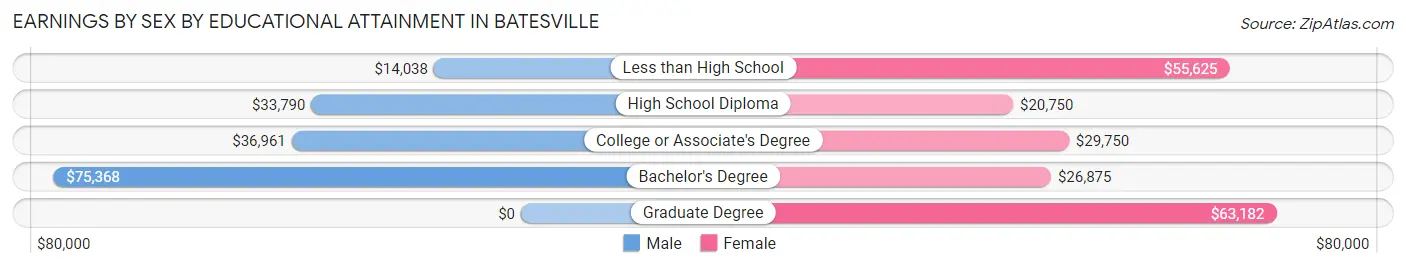
Earnings by Sex by Educational Attainment in Batesville
Average earnings in Batesville are $39,063 for men and $29,810 for women, a difference of 23.7%. Men with an educational attainment of bachelor's degree enjoy the highest average annual earnings of $75,368, while those with less than high school education earn the least with $14,038. Women with an educational attainment of graduate degree earn the most with the average annual earnings of $63,182, while those with high school diploma education have the smallest earnings of $20,750.
| Educational Attainment | Male Income | Female Income |
| Less than High School | $14,038 | $55,625 |
| High School Diploma | $33,790 | $20,750 |
| College or Associate's Degree | $36,961 | $29,750 |
| Bachelor's Degree | $75,368 | $26,875 |
| Graduate Degree | - | - |
| Total | $39,063 | $29,810 |
Family Income in Batesville
Family Income Brackets in Batesville
According to the Batesville family income data, there are 533 families falling into the $50,000 to $74,999 income range, which is the most common income bracket and makes up 22.9% of all families. Conversely, the $10,000 to $14,999 income bracket is the least frequent group with only 30 families (1.3%) belonging to this category.
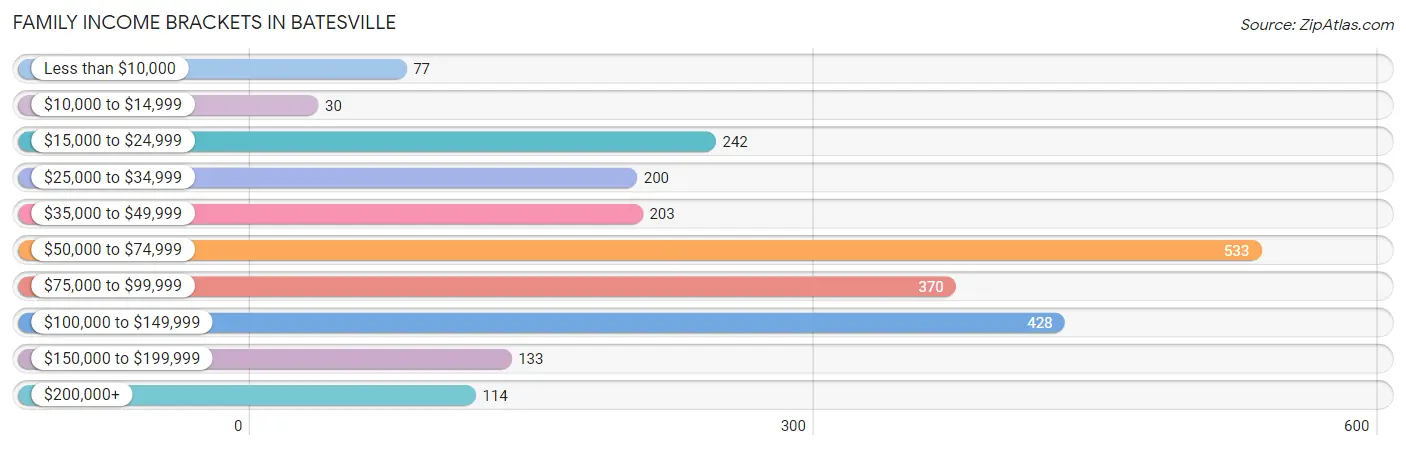
| Income Bracket | # Families | % Families |
| Less than $10,000 | 77 | 3.3% |
| $10,000 to $14,999 | 30 | 1.3% |
| $15,000 to $24,999 | 242 | 10.4% |
| $25,000 to $34,999 | 200 | 8.6% |
| $35,000 to $49,999 | 203 | 8.7% |
| $50,000 to $74,999 | 533 | 22.9% |
| $75,000 to $99,999 | 370 | 15.9% |
| $100,000 to $149,999 | 428 | 18.4% |
| $150,000 to $199,999 | 133 | 5.7% |
| $200,000+ | 114 | 4.9% |
Family Income by Famaliy Size in Batesville
4-person families (454 | 19.5%) account for the highest median family income in Batesville with $99,643 per family, while 2-person families (1,010 | 43.4%) have the highest median income of $35,000 per family member.
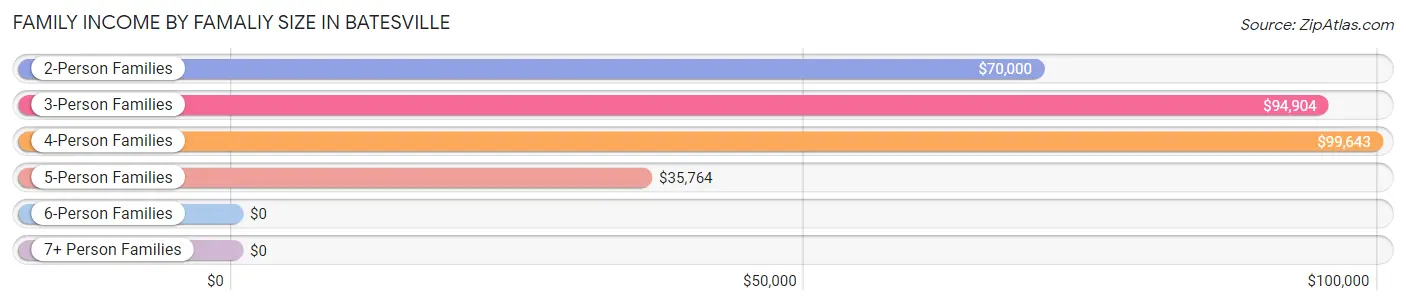
| Income Bracket | # Families | Median Income |
| 2-Person Families | 1,010 (43.4%) | $70,000 |
| 3-Person Families | 395 (17.0%) | $94,904 |
| 4-Person Families | 454 (19.5%) | $99,643 |
| 5-Person Families | 393 (16.9%) | $35,764 |
| 6-Person Families | 41 (1.8%) | $0 |
| 7+ Person Families | 35 (1.5%) | $0 |
| Total | 2,328 (100.0%) | $64,899 |
Family Income by Number of Earners in Batesville
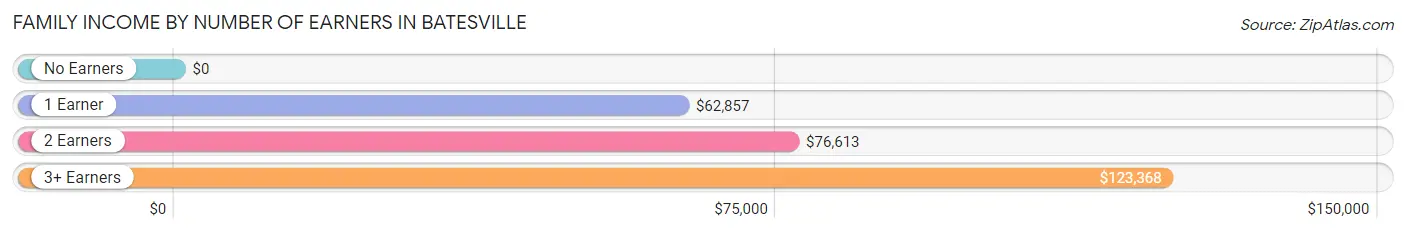
| Number of Earners | # Families | Median Income |
| No Earners | 403 (17.3%) | $0 |
| 1 Earner | 910 (39.1%) | $62,857 |
| 2 Earners | 778 (33.4%) | $76,613 |
| 3+ Earners | 237 (10.2%) | $123,368 |
| Total | 2,328 (100.0%) | $64,899 |
Household Income in Batesville
Household Income Brackets in Batesville
With 830 households falling in the category, the $50,000 to $74,999 income range is the most frequent in Batesville, accounting for 20.0% of all households. In contrast, only 137 households (3.3%) fall into the $200,000+ income bracket, making it the least populous group.
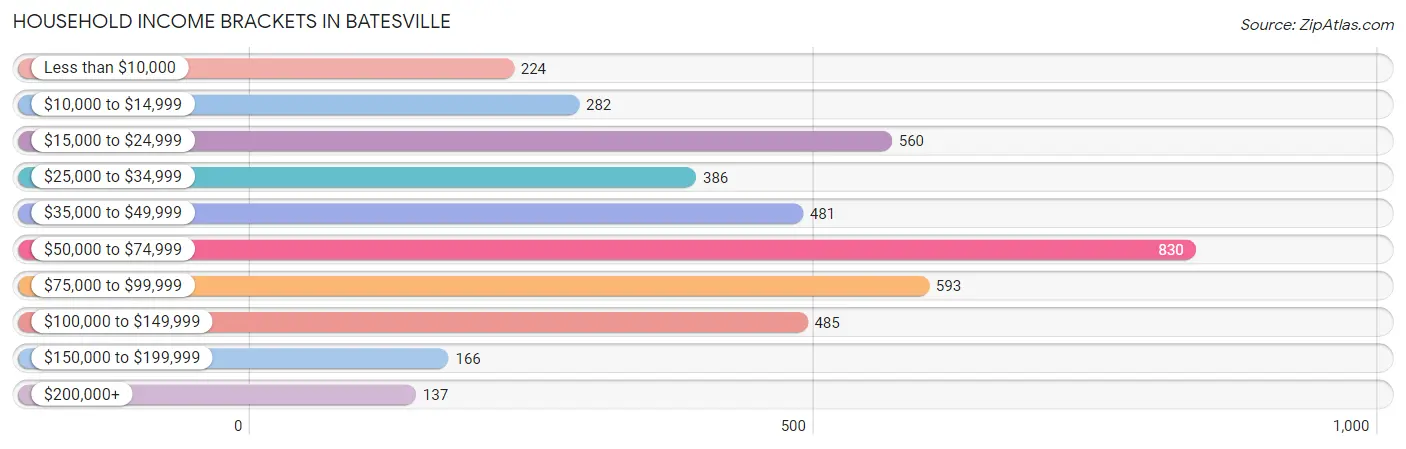
| Income Bracket | # Households | % Households |
| Less than $10,000 | 224 | 5.4% |
| $10,000 to $14,999 | 282 | 6.8% |
| $15,000 to $24,999 | 560 | 13.5% |
| $25,000 to $34,999 | 386 | 9.3% |
| $35,000 to $49,999 | 481 | 11.6% |
| $50,000 to $74,999 | 830 | 20.0% |
| $75,000 to $99,999 | 593 | 14.3% |
| $100,000 to $149,999 | 485 | 11.7% |
| $150,000 to $199,999 | 166 | 4.0% |
| $200,000+ | 137 | 3.3% |
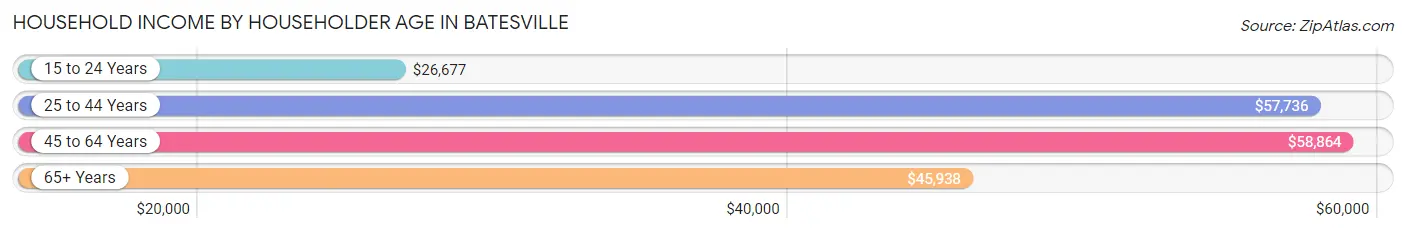
Household Income by Householder Age in Batesville
The median household income in Batesville is $52,304, with the highest median household income of $58,864 found in the 45 to 64 years age bracket for the primary householder. A total of 1,066 households (25.7%) fall into this category. Meanwhile, the 15 to 24 years age bracket for the primary householder has the lowest median household income of $26,677, with 235 households (5.7%) in this group.
| Income Bracket | # Households | Median Income |
| 15 to 24 Years | 235 (5.7%) | $26,677 |
| 25 to 44 Years | 1,638 (39.5%) | $57,736 |
| 45 to 64 Years | 1,066 (25.7%) | $58,864 |
| 65+ Years | 1,210 (29.2%) | $45,938 |
| Total | 4,149 (100.0%) | $52,304 |
Poverty in Batesville
Income Below Poverty by Sex and Age in Batesville
With 24.0% poverty level for males and 18.0% for females among the residents of Batesville, 16 and 17 year old males and 12 to 14 year old females are the most vulnerable to poverty, with 91 males (79.8%) and 98 females (37.0%) in their respective age groups living below the poverty level.
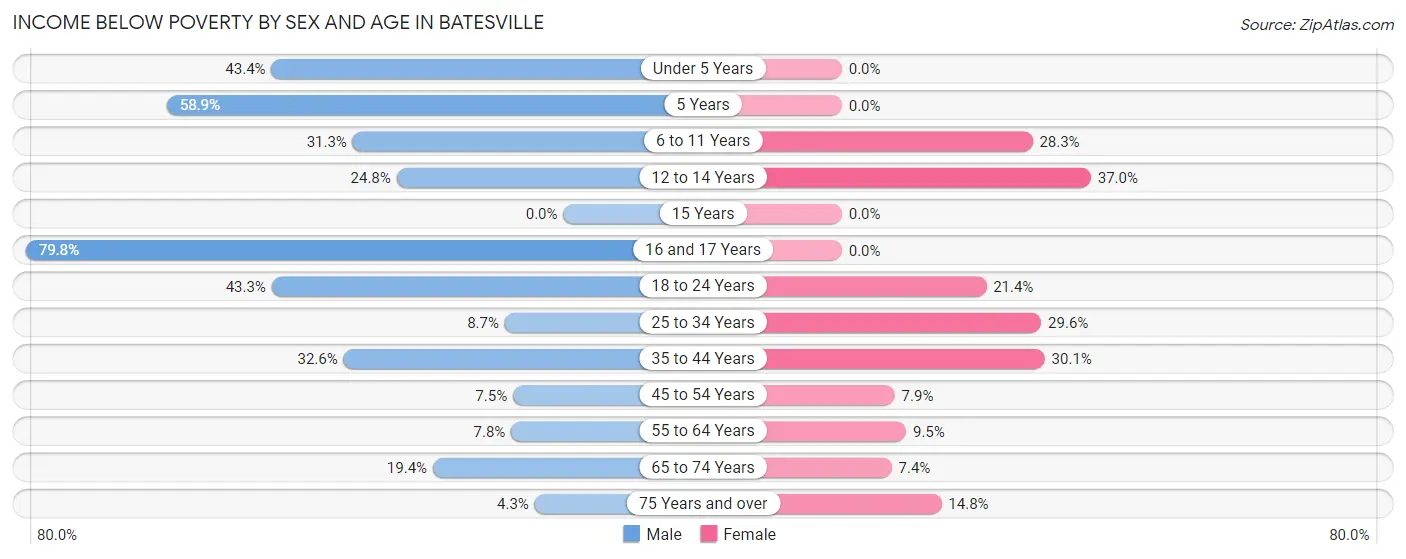
| Age Bracket | Male | Female |
| Under 5 Years | 202 (43.3%) | 0 (0.0%) |
| 5 Years | 63 (58.9%) | 0 (0.0%) |
| 6 to 11 Years | 137 (31.3%) | 139 (28.3%) |
| 12 to 14 Years | 26 (24.8%) | 98 (37.0%) |
| 15 Years | 0 (0.0%) | 0 (0.0%) |
| 16 and 17 Years | 91 (79.8%) | 0 (0.0%) |
| 18 to 24 Years | 207 (43.3%) | 101 (21.4%) |
| 25 to 34 Years | 68 (8.7%) | 161 (29.6%) |
| 35 to 44 Years | 282 (32.6%) | 250 (30.1%) |
| 45 to 54 Years | 35 (7.5%) | 27 (7.9%) |
| 55 to 64 Years | 45 (7.7%) | 56 (9.5%) |
| 65 to 74 Years | 68 (19.4%) | 41 (7.4%) |
| 75 Years and over | 15 (4.3%) | 71 (14.8%) |
| Total | 1,239 (24.0%) | 944 (18.0%) |
Income Above Poverty by Sex and Age in Batesville
According to the poverty statistics in Batesville, males aged 15 years and females aged under 5 years are the age groups that are most secure financially, with 100.0% of males and 100.0% of females in these age groups living above the poverty line.
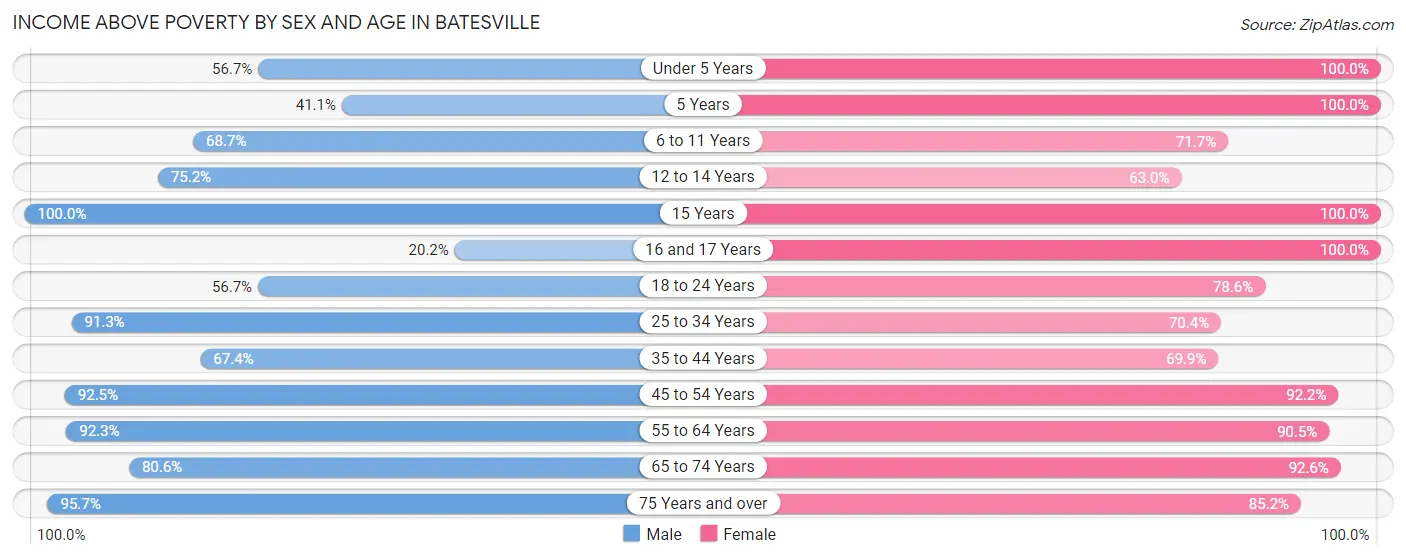
| Age Bracket | Male | Female |
| Under 5 Years | 264 (56.7%) | 455 (100.0%) |
| 5 Years | 44 (41.1%) | 122 (100.0%) |
| 6 to 11 Years | 301 (68.7%) | 352 (71.7%) |
| 12 to 14 Years | 79 (75.2%) | 167 (63.0%) |
| 15 Years | 48 (100.0%) | 46 (100.0%) |
| 16 and 17 Years | 23 (20.2%) | 55 (100.0%) |
| 18 to 24 Years | 271 (56.7%) | 370 (78.6%) |
| 25 to 34 Years | 714 (91.3%) | 383 (70.4%) |
| 35 to 44 Years | 582 (67.4%) | 580 (69.9%) |
| 45 to 54 Years | 433 (92.5%) | 317 (92.1%) |
| 55 to 64 Years | 536 (92.2%) | 531 (90.5%) |
| 65 to 74 Years | 283 (80.6%) | 513 (92.6%) |
| 75 Years and over | 337 (95.7%) | 409 (85.2%) |
| Total | 3,915 (76.0%) | 4,300 (82.0%) |
Income Below Poverty Among Married-Couple Families in Batesville
The poverty statistics for married-couple families in Batesville show that 14.1% or 251 of the total 1,780 families live below the poverty line. Families with 3 or 4 children have the highest poverty rate of 73.4%, comprising of 226 families. On the other hand, families with 1 or 2 children have the lowest poverty rate of 0.0%, which includes 0 families.
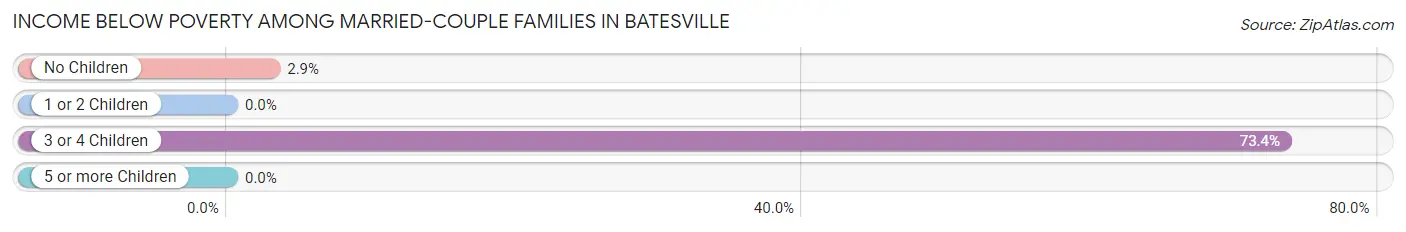
| Children | Above Poverty | Below Poverty |
| No Children | 824 (97.1%) | 25 (2.9%) |
| 1 or 2 Children | 600 (100.0%) | 0 (0.0%) |
| 3 or 4 Children | 82 (26.6%) | 226 (73.4%) |
| 5 or more Children | 23 (100.0%) | 0 (0.0%) |
| Total | 1,529 (85.9%) | 251 (14.1%) |
Income Below Poverty Among Single-Parent Households in Batesville
According to the poverty data in Batesville, 11.6% or 13 single-father households and 39.0% or 170 single-mother households are living below the poverty line. Among single-father households, those with 3 or 4 children have the highest poverty rate, with 13 households (33.3%) experiencing poverty. Likewise, among single-mother households, those with 1 or 2 children have the highest poverty rate, with 160 households (59.0%) falling below the poverty line.
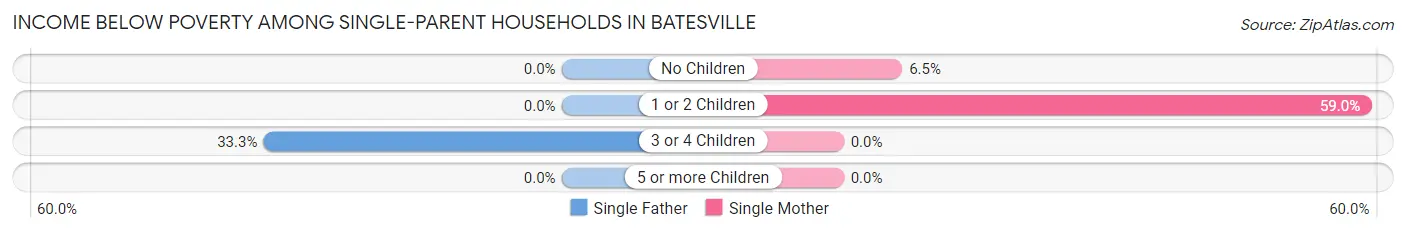
| Children | Single Father | Single Mother |
| No Children | 0 (0.0%) | 10 (6.5%) |
| 1 or 2 Children | 0 (0.0%) | 160 (59.0%) |
| 3 or 4 Children | 13 (33.3%) | 0 (0.0%) |
| 5 or more Children | 0 (0.0%) | 0 (0.0%) |
| Total | 13 (11.6%) | 170 (39.0%) |
Income Below Poverty Among Married-Couple vs Single-Parent Households in Batesville
The poverty data for Batesville shows that 251 of the married-couple family households (14.1%) and 183 of the single-parent households (33.4%) are living below the poverty level. Within the married-couple family households, those with 3 or 4 children have the highest poverty rate, with 226 households (73.4%) falling below the poverty line. Among the single-parent households, those with 1 or 2 children have the highest poverty rate, with 160 household (47.8%) living below poverty.
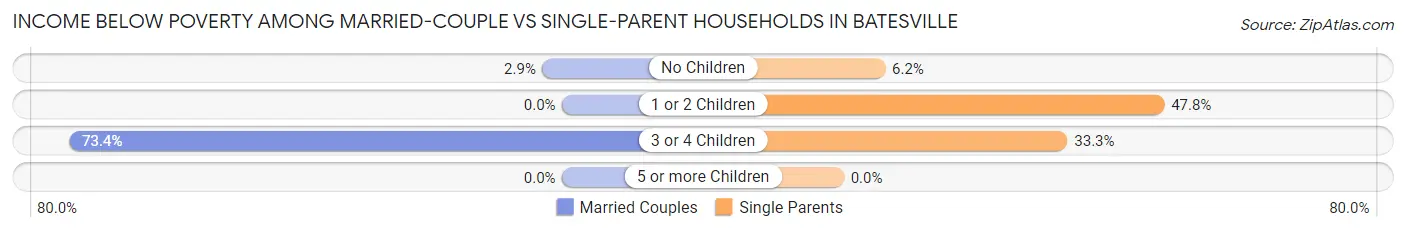
| Children | Married-Couple Families | Single-Parent Households |
| No Children | 25 (2.9%) | 10 (6.2%) |
| 1 or 2 Children | 0 (0.0%) | 160 (47.8%) |
| 3 or 4 Children | 226 (73.4%) | 13 (33.3%) |
| 5 or more Children | 0 (0.0%) | 0 (0.0%) |
| Total | 251 (14.1%) | 183 (33.4%) |
Race in Batesville
The most populous races in Batesville are White / Caucasian (8,307 | 74.4%), Hispanic or Latino (2,075 | 18.6%), and Some other Race (1,212 | 10.9%).
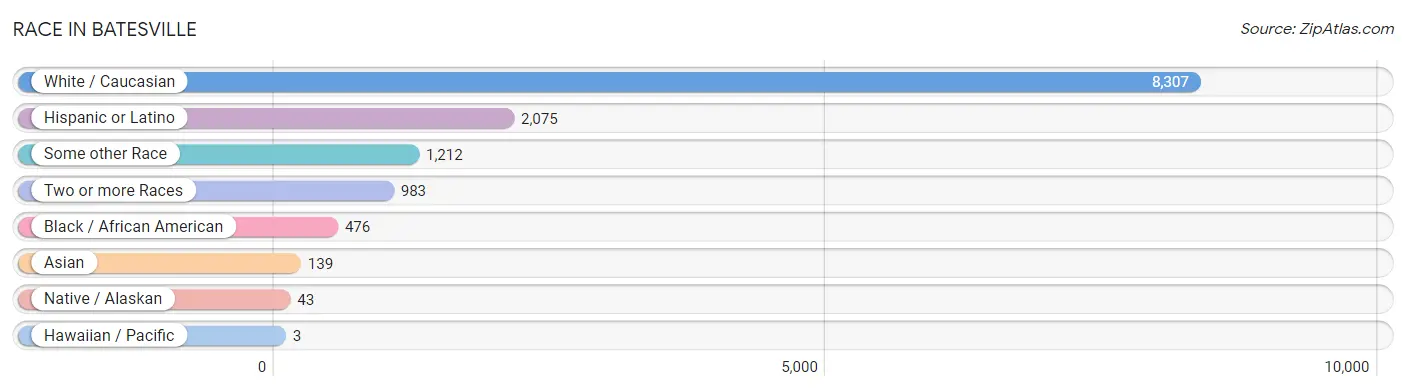
| Race | # Population | % Population |
| Asian | 139 | 1.3% |
| Black / African American | 476 | 4.3% |
| Hawaiian / Pacific | 3 | 0.0% |
| Hispanic or Latino | 2,075 | 18.6% |
| Native / Alaskan | 43 | 0.4% |
| White / Caucasian | 8,307 | 74.4% |
| Two or more Races | 983 | 8.8% |
| Some other Race | 1,212 | 10.9% |
| Total | 11,163 | 100.0% |
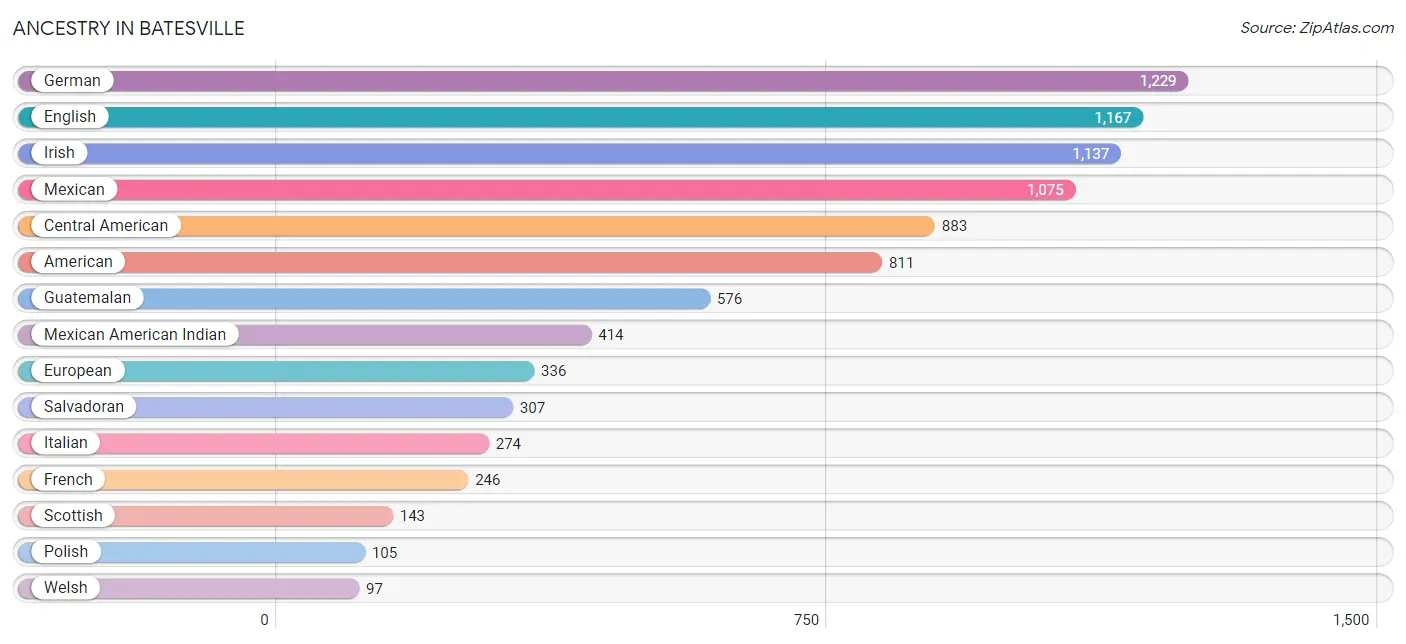
Ancestry in Batesville
The most populous ancestries reported in Batesville are German (1,229 | 11.0%), English (1,167 | 10.4%), Irish (1,137 | 10.2%), Mexican (1,075 | 9.6%), and Central American (883 | 7.9%), together accounting for 49.2% of all Batesville residents.
| Ancestry | # Population | % Population |
| American | 811 | 7.3% |
| Argentinean | 4 | 0.0% |
| Austrian | 7 | 0.1% |
| Bhutanese | 14 | 0.1% |
| Blackfeet | 8 | 0.1% |
| British | 19 | 0.2% |
| Burmese | 12 | 0.1% |
| Central American | 883 | 7.9% |
| Central American Indian | 26 | 0.2% |
| Cherokee | 7 | 0.1% |
| Chippewa | 20 | 0.2% |
| Cuban | 42 | 0.4% |
| Dutch | 13 | 0.1% |
| Eastern European | 3 | 0.0% |
| English | 1,167 | 10.4% |
| European | 336 | 3.0% |
| Finnish | 32 | 0.3% |
| French | 246 | 2.2% |
| German | 1,229 | 11.0% |
| Greek | 60 | 0.5% |
| Guatemalan | 576 | 5.2% |
| Indian (Asian) | 42 | 0.4% |
| Irish | 1,137 | 10.2% |
| Italian | 274 | 2.5% |
| Korean | 68 | 0.6% |
| Mexican | 1,075 | 9.6% |
| Mexican American Indian | 414 | 3.7% |
| Native Hawaiian | 3 | 0.0% |
| Navajo | 1 | 0.0% |
| Norwegian | 71 | 0.6% |
| Polish | 105 | 0.9% |
| Puerto Rican | 12 | 0.1% |
| Salvadoran | 307 | 2.8% |
| Scandinavian | 57 | 0.5% |
| Scotch-Irish | 48 | 0.4% |
| Scottish | 143 | 1.3% |
| South American | 4 | 0.0% |
| Spaniard | 19 | 0.2% |
| Sri Lankan | 2 | 0.0% |
| Swedish | 2 | 0.0% |
| Swiss | 9 | 0.1% |
| Thai | 27 | 0.2% |
| Welsh | 97 | 0.9% | View All 43 Rows |
Immigrants in Batesville
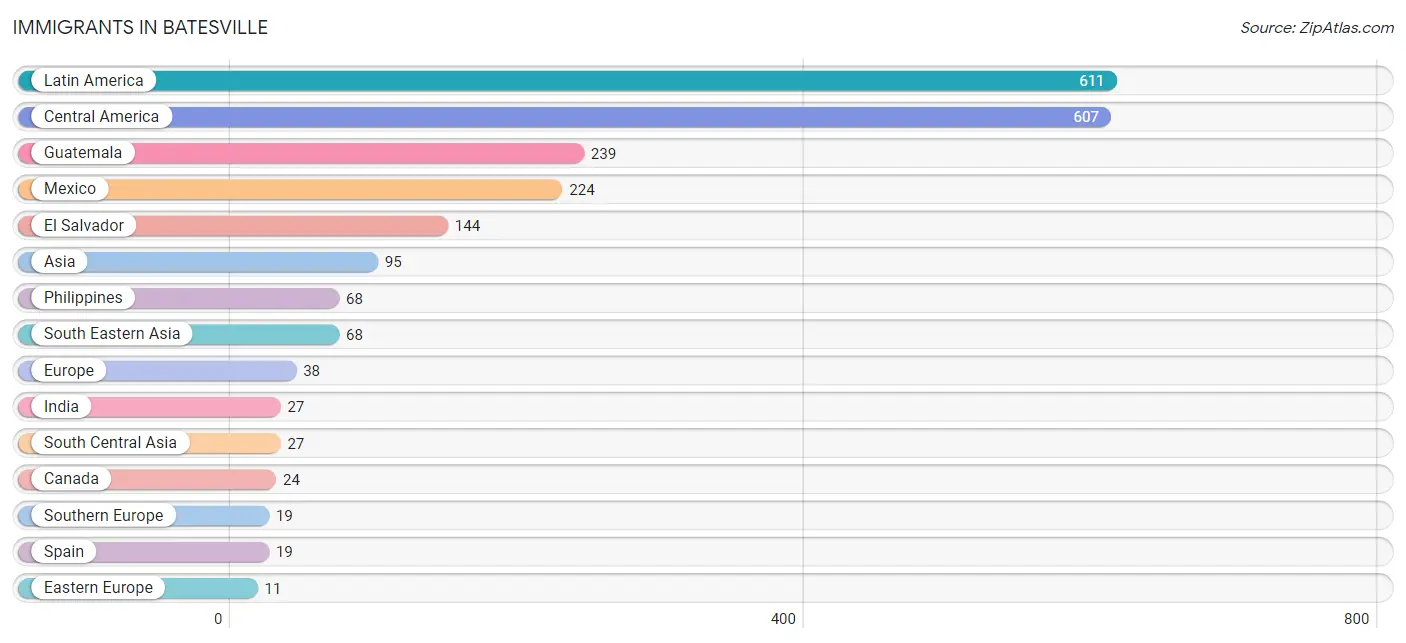
The most numerous immigrant groups reported in Batesville came from Latin America (611 | 5.5%), Central America (607 | 5.4%), Guatemala (239 | 2.1%), Mexico (224 | 2.0%), and El Salvador (144 | 1.3%), together accounting for 16.4% of all Batesville residents.
| Immigration Origin | # Population | % Population |
| Argentina | 4 | 0.0% |
| Asia | 95 | 0.9% |
| Canada | 24 | 0.2% |
| Central America | 607 | 5.4% |
| Eastern Europe | 11 | 0.1% |
| El Salvador | 144 | 1.3% |
| Europe | 38 | 0.3% |
| Guatemala | 239 | 2.1% |
| India | 27 | 0.2% |
| Ireland | 8 | 0.1% |
| Latin America | 611 | 5.5% |
| Mexico | 224 | 2.0% |
| Northern Europe | 8 | 0.1% |
| Philippines | 68 | 0.6% |
| Poland | 11 | 0.1% |
| South America | 4 | 0.0% |
| South Central Asia | 27 | 0.2% |
| South Eastern Asia | 68 | 0.6% |
| Southern Europe | 19 | 0.2% |
| Spain | 19 | 0.2% | View All 20 Rows |
Sex and Age in Batesville
Sex and Age in Batesville
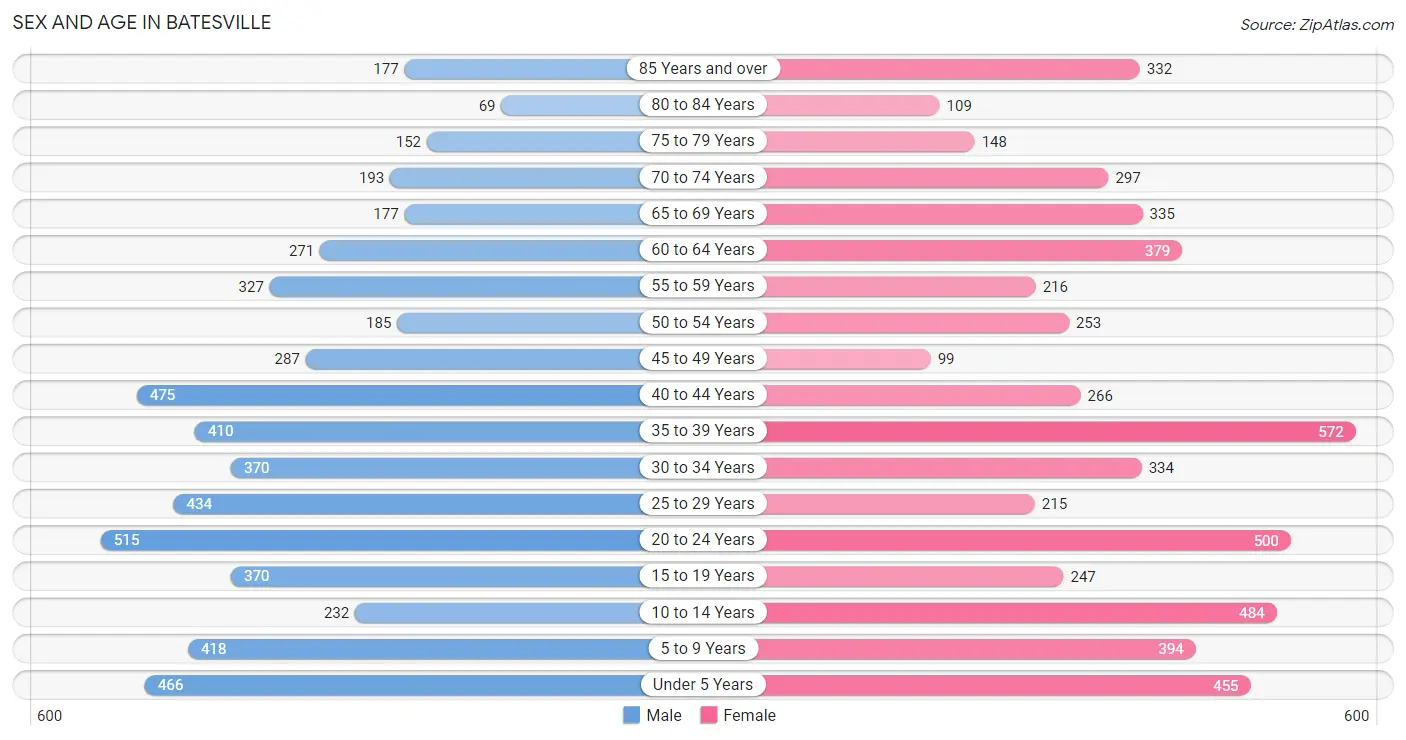
The most populous age groups in Batesville are 20 to 24 Years (515 | 9.3%) for men and 35 to 39 Years (572 | 10.2%) for women.
| Age Bracket | Male | Female |
| Under 5 Years | 466 (8.4%) | 455 (8.1%) |
| 5 to 9 Years | 418 (7.6%) | 394 (7.0%) |
| 10 to 14 Years | 232 (4.2%) | 484 (8.6%) |
| 15 to 19 Years | 370 (6.7%) | 247 (4.4%) |
| 20 to 24 Years | 515 (9.3%) | 500 (8.9%) |
| 25 to 29 Years | 434 (7.9%) | 215 (3.8%) |
| 30 to 34 Years | 370 (6.7%) | 334 (5.9%) |
| 35 to 39 Years | 410 (7.4%) | 572 (10.2%) |
| 40 to 44 Years | 475 (8.6%) | 266 (4.7%) |
| 45 to 49 Years | 287 (5.2%) | 99 (1.8%) |
| 50 to 54 Years | 185 (3.4%) | 253 (4.5%) |
| 55 to 59 Years | 327 (5.9%) | 216 (3.8%) |
| 60 to 64 Years | 271 (4.9%) | 379 (6.7%) |
| 65 to 69 Years | 177 (3.2%) | 335 (5.9%) |
| 70 to 74 Years | 193 (3.5%) | 297 (5.3%) |
| 75 to 79 Years | 152 (2.8%) | 148 (2.6%) |
| 80 to 84 Years | 69 (1.3%) | 109 (1.9%) |
| 85 Years and over | 177 (3.2%) | 332 (5.9%) |
| Total | 5,528 (100.0%) | 5,635 (100.0%) |
Families and Households in Batesville
Median Family Size in Batesville
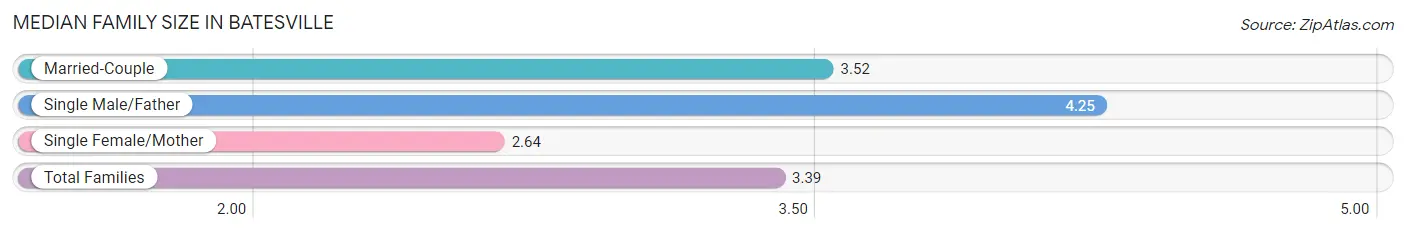
The median family size in Batesville is 3.39 persons per family, with single male/father families (112 | 4.8%) accounting for the largest median family size of 4.25 persons per family. On the other hand, single female/mother families (436 | 18.7%) represent the smallest median family size with 2.64 persons per family.
| Family Type | # Families | Family Size |
| Married-Couple | 1,780 (76.5%) | 3.52 |
| Single Male/Father | 112 (4.8%) | 4.25 |
| Single Female/Mother | 436 (18.7%) | 2.64 |
| Total Families | 2,328 (100.0%) | 3.39 |
Median Household Size in Batesville
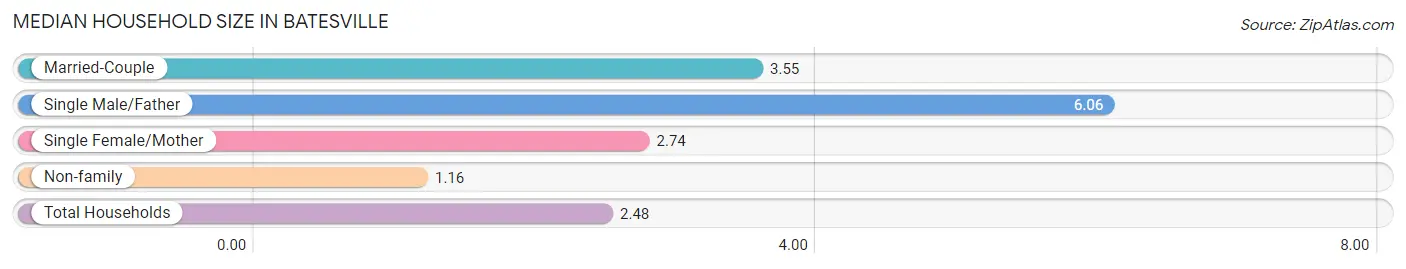
The median household size in Batesville is 2.48 persons per household, with single male/father households (112 | 2.7%) accounting for the largest median household size of 6.06 persons per household. non-family households (1,821 | 43.9%) represent the smallest median household size with 1.16 persons per household.
| Household Type | # Households | Household Size |
| Married-Couple | 1,780 (42.9%) | 3.55 |
| Single Male/Father | 112 (2.7%) | 6.06 |
| Single Female/Mother | 436 (10.5%) | 2.74 |
| Non-family | 1,821 (43.9%) | 1.16 |
| Total Households | 4,149 (100.0%) | 2.48 |
Household Size by Marriage Status in Batesville
Out of a total of 4,149 households in Batesville, 2,328 (56.1%) are family households, while 1,821 (43.9%) are nonfamily households. The most numerous type of family households are 2-person households, comprising 949, and the most common type of nonfamily households are 1-person households, comprising 1,557.
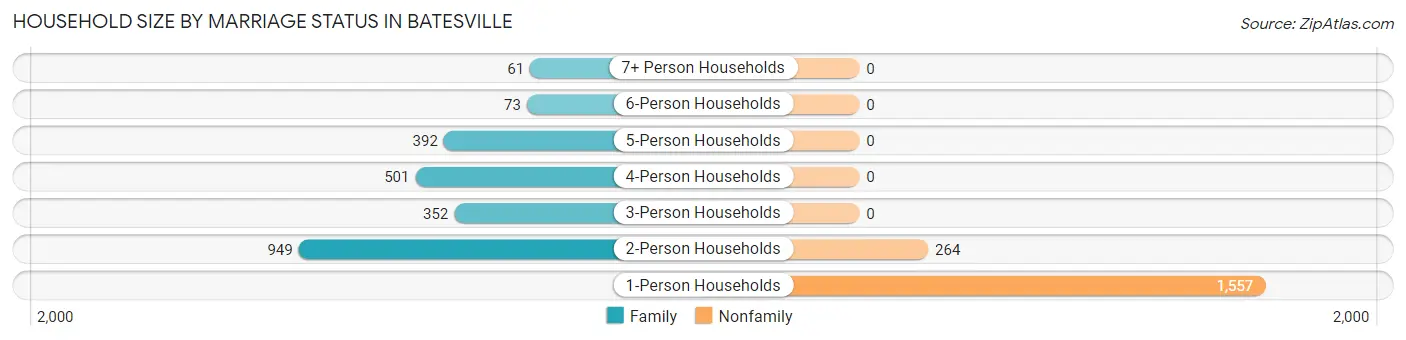
| Household Size | Family Households | Nonfamily Households |
| 1-Person Households | - | 1,557 (37.5%) |
| 2-Person Households | 949 (22.9%) | 264 (6.4%) |
| 3-Person Households | 352 (8.5%) | 0 (0.0%) |
| 4-Person Households | 501 (12.1%) | 0 (0.0%) |
| 5-Person Households | 392 (9.5%) | 0 (0.0%) |
| 6-Person Households | 73 (1.8%) | 0 (0.0%) |
| 7+ Person Households | 61 (1.5%) | 0 (0.0%) |
| Total | 2,328 (56.1%) | 1,821 (43.9%) |
Female Fertility in Batesville
Fertility by Age in Batesville
Average fertility rate in Batesville is 65.0 births per 1,000 women. Women in the age bracket of 20 to 34 years have the highest fertility rate with 89.0 births per 1,000 women. Women in the age bracket of 20 to 34 years acount for 63.3% of all women with births.
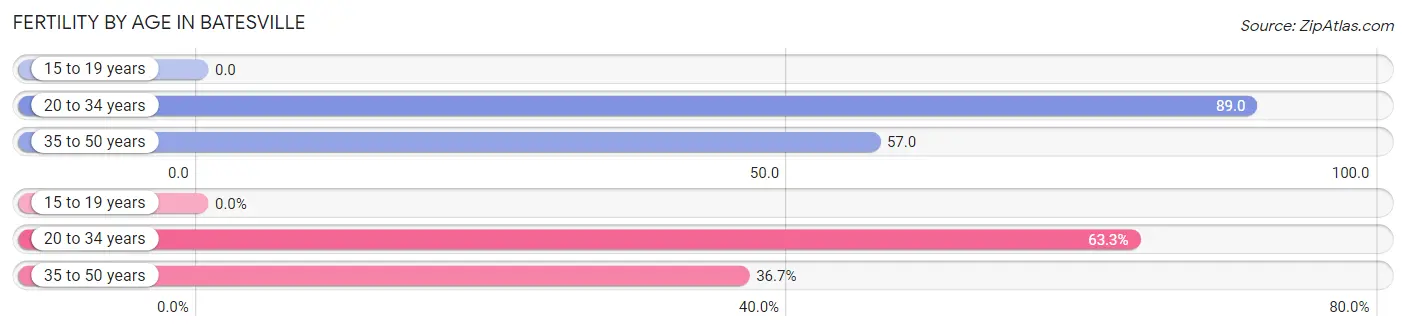
| Age Bracket | Women with Births | Births / 1,000 Women |
| 15 to 19 years | 0 (0.0%) | 0.0 |
| 20 to 34 years | 93 (63.3%) | 89.0 |
| 35 to 50 years | 54 (36.7%) | 57.0 |
| Total | 147 (100.0%) | 65.0 |
Fertility by Age by Marriage Status in Batesville
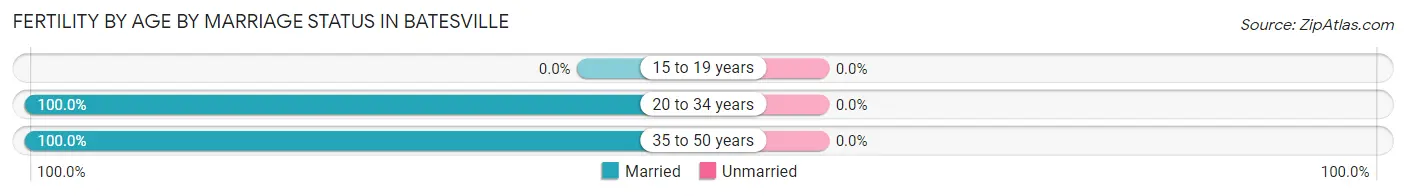
| Age Bracket | Married | Unmarried |
| 15 to 19 years | 0 (0.0%) | 0 (0.0%) |
| 20 to 34 years | 93 (100.0%) | 0 (0.0%) |
| 35 to 50 years | 54 (100.0%) | 0 (0.0%) |
| Total | 147 (100.0%) | 0 (0.0%) |
Fertility by Education in Batesville
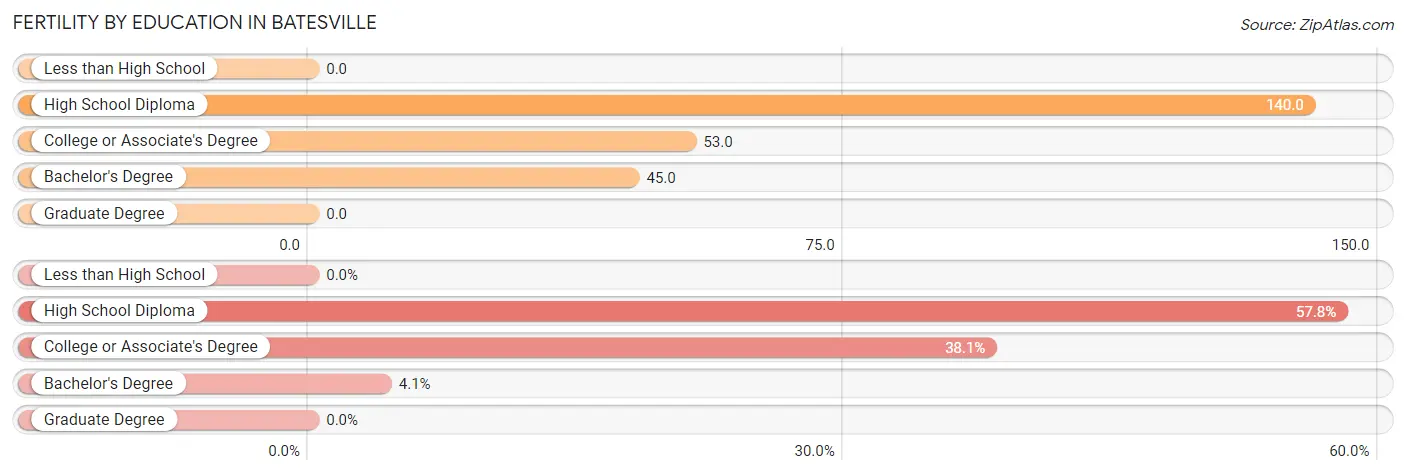
| Educational Attainment | Women with Births | Births / 1,000 Women |
| Less than High School | 0 (0.0%) | 0.0 |
| High School Diploma | 85 (57.8%) | 140.0 |
| College or Associate's Degree | 56 (38.1%) | 53.0 |
| Bachelor's Degree | 6 (4.1%) | 45.0 |
| Graduate Degree | 0 (0.0%) | 0.0 |
| Total | 147 (100.0%) | 65.0 |
Fertility by Education by Marriage Status in Batesville
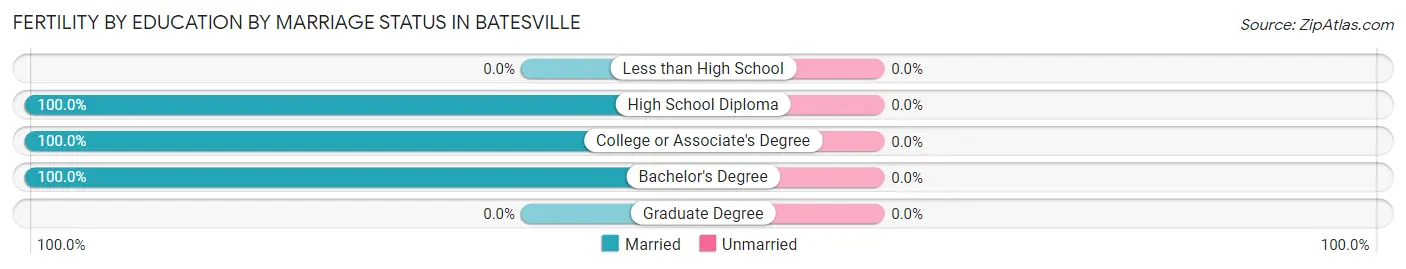
| Educational Attainment | Married | Unmarried |
| Less than High School | 0 (0.0%) | 0 (0.0%) |
| High School Diploma | 85 (100.0%) | 0 (0.0%) |
| College or Associate's Degree | 56 (100.0%) | 0 (0.0%) |
| Bachelor's Degree | 6 (100.0%) | 0 (0.0%) |
| Graduate Degree | 0 (0.0%) | 0 (0.0%) |
| Total | 147 (100.0%) | 0 (0.0%) |
Employment Characteristics in Batesville
Employment by Class of Employer in Batesville
Among the 4,460 employed individuals in Batesville, private company employees (3,092 | 69.3%), not-for-profit organizations (499 | 11.2%), and state government employees (359 | 8.1%) make up the most common classes of employment.
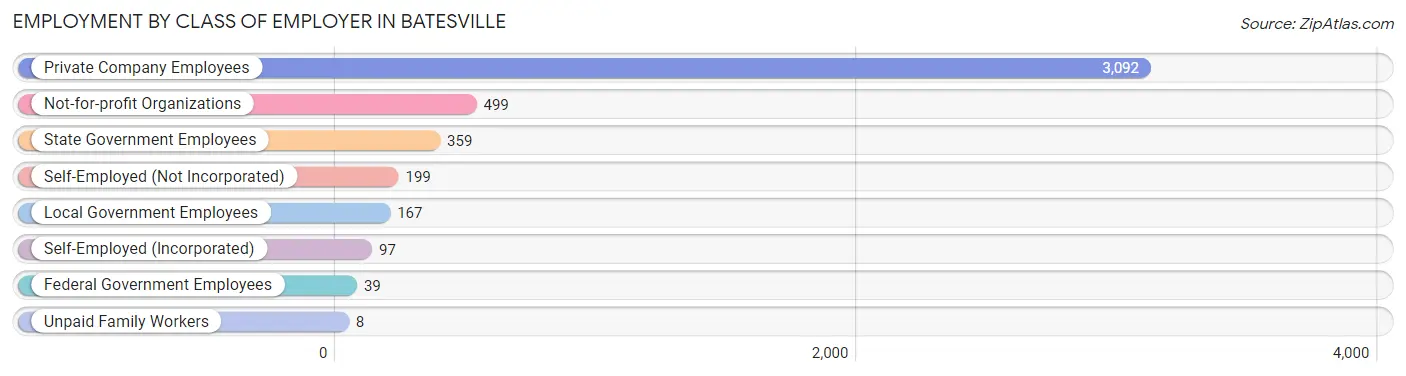
| Employer Class | # Employees | % Employees |
| Private Company Employees | 3,092 | 69.3% |
| Self-Employed (Incorporated) | 97 | 2.2% |
| Self-Employed (Not Incorporated) | 199 | 4.5% |
| Not-for-profit Organizations | 499 | 11.2% |
| Local Government Employees | 167 | 3.7% |
| State Government Employees | 359 | 8.1% |
| Federal Government Employees | 39 | 0.9% |
| Unpaid Family Workers | 8 | 0.2% |
| Total | 4,460 | 100.0% |
Employment Status by Age in Batesville
According to the labor force statistics for Batesville, out of the total population over 16 years of age (8,614), 54.7% or 4,712 individuals are in the labor force, with 5.1% or 240 of them unemployed. The age group with the highest labor force participation rate is 25 to 29 years, with 82.1% or 533 individuals in the labor force. Within the labor force, the 20 to 24 years age range has the highest percentage of unemployed individuals, with 13.2% or 99 of them being unemployed.
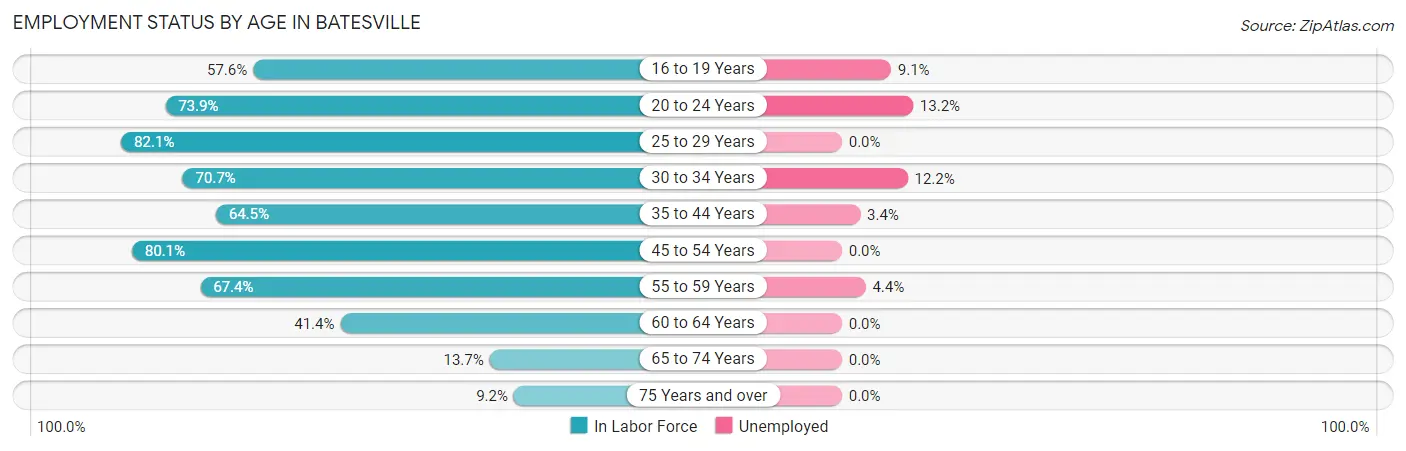
| Age Bracket | In Labor Force | Unemployed |
| 16 to 19 Years | 298 (57.6%) | 27 (9.1%) |
| 20 to 24 Years | 750 (73.9%) | 99 (13.2%) |
| 25 to 29 Years | 533 (82.1%) | 0 (0.0%) |
| 30 to 34 Years | 498 (70.7%) | 61 (12.2%) |
| 35 to 44 Years | 1,111 (64.5%) | 38 (3.4%) |
| 45 to 54 Years | 660 (80.1%) | 0 (0.0%) |
| 55 to 59 Years | 366 (67.4%) | 16 (4.4%) |
| 60 to 64 Years | 269 (41.4%) | 0 (0.0%) |
| 65 to 74 Years | 137 (13.7%) | 0 (0.0%) |
| 75 Years and over | 91 (9.2%) | 0 (0.0%) |
| Total | 4,712 (54.7%) | 240 (5.1%) |
Employment Status by Educational Attainment in Batesville
According to labor force statistics for Batesville, 67.5% of individuals (3,438) out of the total population between 25 and 64 years of age (5,093) are in the labor force, with 3.3% or 113 of them being unemployed. The group with the highest labor force participation rate are those with the educational attainment of bachelor's degree or higher, with 84.3% or 887 individuals in the labor force. Within the labor force, individuals with less than high school education have the highest percentage of unemployment, with 10.4% or 30 of them being unemployed.
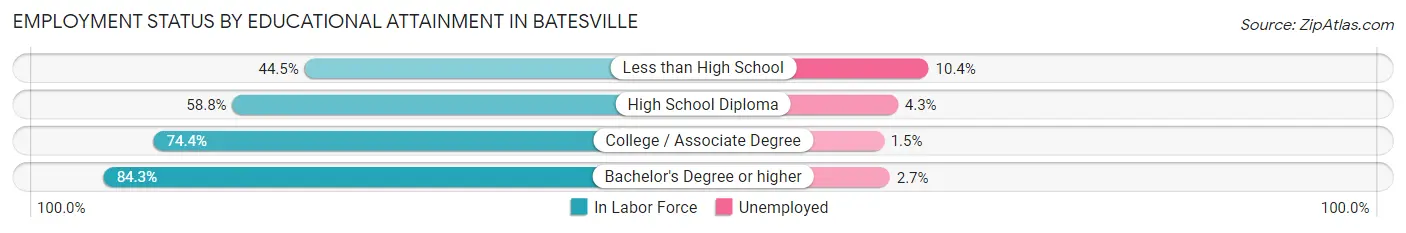
| Educational Attainment | In Labor Force | Unemployed |
| Less than High School | 289 (44.5%) | 67 (10.4%) |
| High School Diploma | 986 (58.8%) | 72 (4.3%) |
| College / Associate Degree | 1,276 (74.4%) | 26 (1.5%) |
| Bachelor's Degree or higher | 887 (84.3%) | 28 (2.7%) |
| Total | 3,438 (67.5%) | 168 (3.3%) |
Employment Occupations by Sex in Batesville
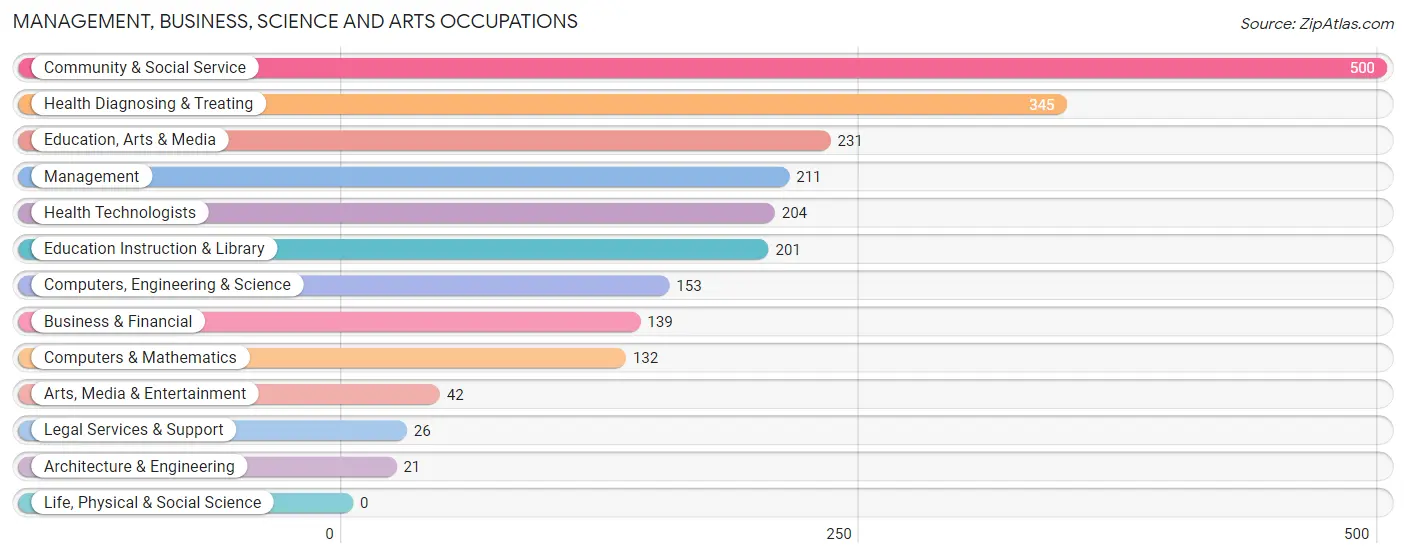
Management, Business, Science and Arts Occupations
The most common Management, Business, Science and Arts occupations in Batesville are Community & Social Service (500 | 11.2%), Health Diagnosing & Treating (345 | 7.7%), Education, Arts & Media (231 | 5.2%), Management (211 | 4.7%), and Health Technologists (204 | 4.6%).
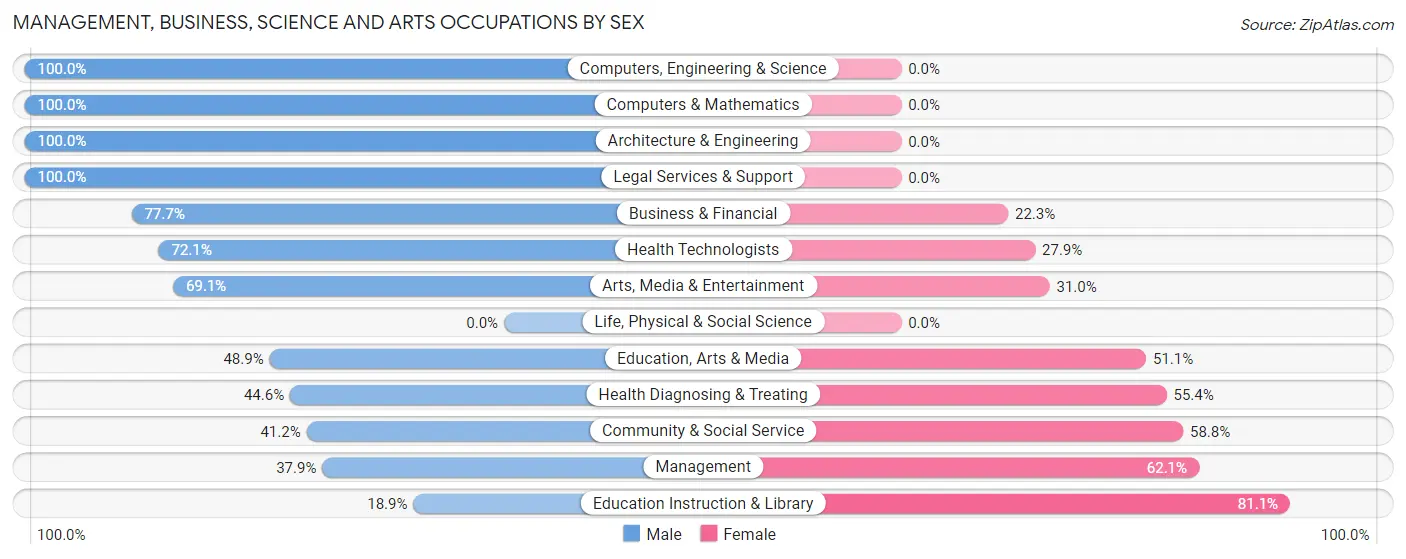
Management, Business, Science and Arts Occupations by Sex
Within the Management, Business, Science and Arts occupations in Batesville, the most male-oriented occupations are Computers, Engineering & Science (100.0%), Computers & Mathematics (100.0%), and Architecture & Engineering (100.0%), while the most female-oriented occupations are Education Instruction & Library (81.1%), Management (62.1%), and Community & Social Service (58.8%).
| Occupation | Male | Female |
| Management | 80 (37.9%) | 131 (62.1%) |
| Business & Financial | 108 (77.7%) | 31 (22.3%) |
| Computers, Engineering & Science | 153 (100.0%) | 0 (0.0%) |
| Computers & Mathematics | 132 (100.0%) | 0 (0.0%) |
| Architecture & Engineering | 21 (100.0%) | 0 (0.0%) |
| Life, Physical & Social Science | 0 (0.0%) | 0 (0.0%) |
| Community & Social Service | 206 (41.2%) | 294 (58.8%) |
| Education, Arts & Media | 113 (48.9%) | 118 (51.1%) |
| Legal Services & Support | 26 (100.0%) | 0 (0.0%) |
| Education Instruction & Library | 38 (18.9%) | 163 (81.1%) |
| Arts, Media & Entertainment | 29 (69.1%) | 13 (30.9%) |
| Health Diagnosing & Treating | 154 (44.6%) | 191 (55.4%) |
| Health Technologists | 147 (72.1%) | 57 (27.9%) |
| Total (Category) | 701 (52.0%) | 647 (48.0%) |
| Total (Overall) | 2,653 (59.3%) | 1,820 (40.7%) |
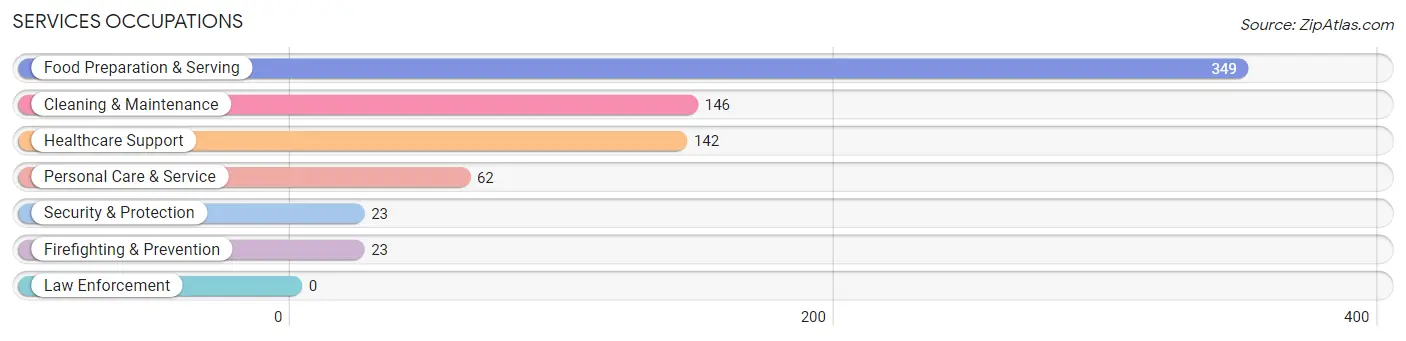
Services Occupations
The most common Services occupations in Batesville are Food Preparation & Serving (349 | 7.8%), Cleaning & Maintenance (146 | 3.3%), Healthcare Support (142 | 3.2%), Personal Care & Service (62 | 1.4%), and Security & Protection (23 | 0.5%).
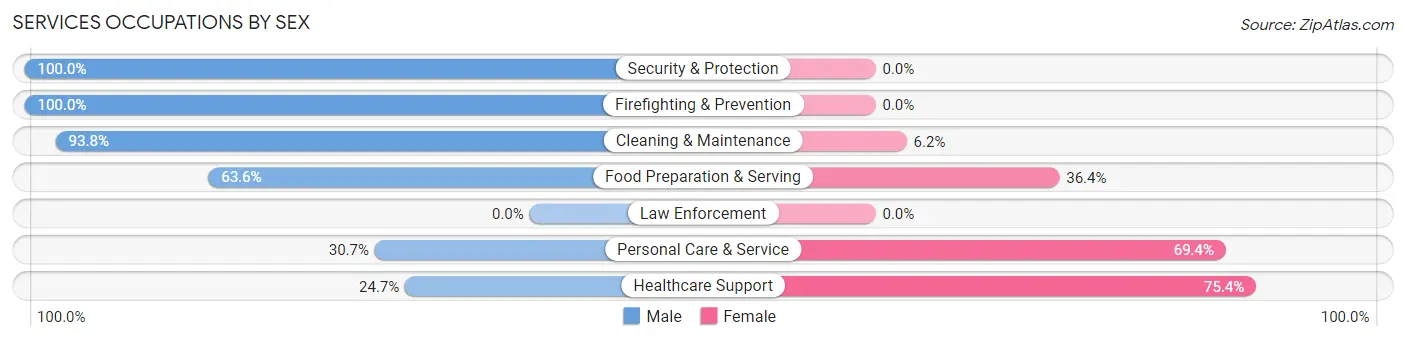
Services Occupations by Sex
Within the Services occupations in Batesville, the most male-oriented occupations are Security & Protection (100.0%), Firefighting & Prevention (100.0%), and Cleaning & Maintenance (93.8%), while the most female-oriented occupations are Healthcare Support (75.3%), Personal Care & Service (69.4%), and Food Preparation & Serving (36.4%).
| Occupation | Male | Female |
| Healthcare Support | 35 (24.6%) | 107 (75.3%) |
| Security & Protection | 23 (100.0%) | 0 (0.0%) |
| Firefighting & Prevention | 23 (100.0%) | 0 (0.0%) |
| Law Enforcement | 0 (0.0%) | 0 (0.0%) |
| Food Preparation & Serving | 222 (63.6%) | 127 (36.4%) |
| Cleaning & Maintenance | 137 (93.8%) | 9 (6.2%) |
| Personal Care & Service | 19 (30.6%) | 43 (69.4%) |
| Total (Category) | 436 (60.4%) | 286 (39.6%) |
| Total (Overall) | 2,653 (59.3%) | 1,820 (40.7%) |
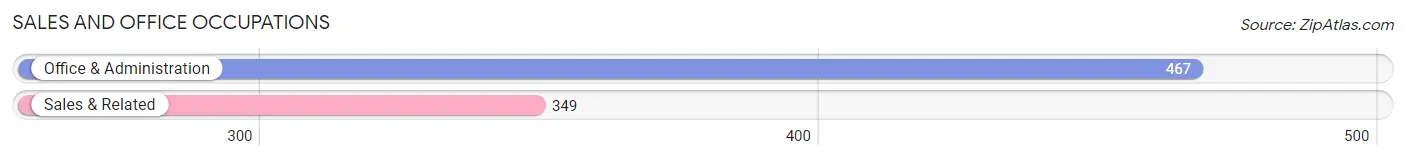
Sales and Office Occupations
The most common Sales and Office occupations in Batesville are Office & Administration (467 | 10.4%), and Sales & Related (349 | 7.8%).
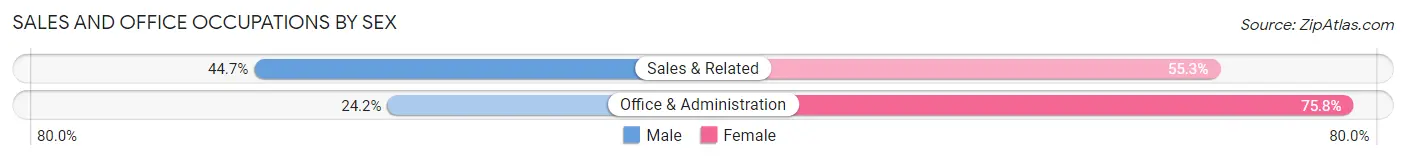
Sales and Office Occupations by Sex
| Occupation | Male | Female |
| Sales & Related | 156 (44.7%) | 193 (55.3%) |
| Office & Administration | 113 (24.2%) | 354 (75.8%) |
| Total (Category) | 269 (33.0%) | 547 (67.0%) |
| Total (Overall) | 2,653 (59.3%) | 1,820 (40.7%) |
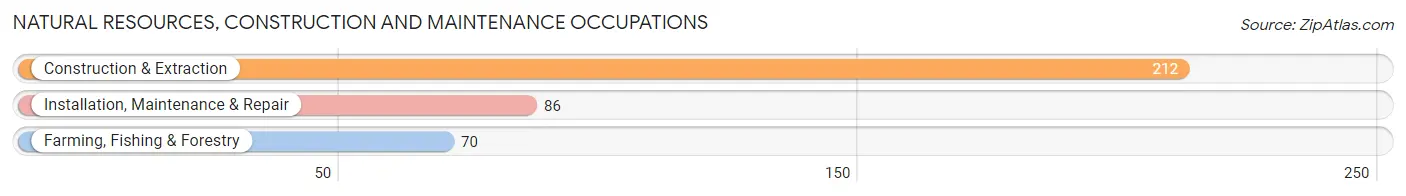
Natural Resources, Construction and Maintenance Occupations
The most common Natural Resources, Construction and Maintenance occupations in Batesville are Construction & Extraction (212 | 4.7%), Installation, Maintenance & Repair (86 | 1.9%), and Farming, Fishing & Forestry (70 | 1.6%).
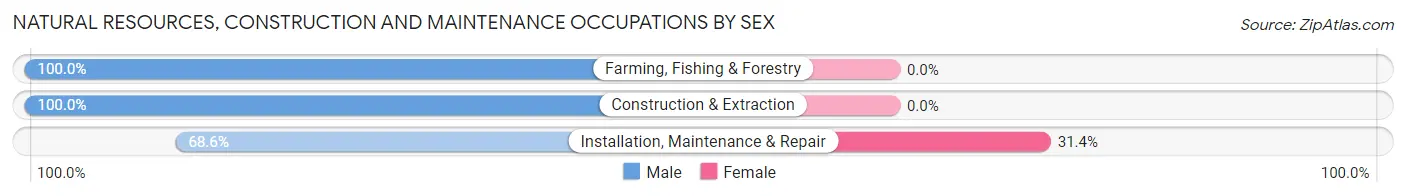
Natural Resources, Construction and Maintenance Occupations by Sex
| Occupation | Male | Female |
| Farming, Fishing & Forestry | 70 (100.0%) | 0 (0.0%) |
| Construction & Extraction | 212 (100.0%) | 0 (0.0%) |
| Installation, Maintenance & Repair | 59 (68.6%) | 27 (31.4%) |
| Total (Category) | 341 (92.7%) | 27 (7.3%) |
| Total (Overall) | 2,653 (59.3%) | 1,820 (40.7%) |
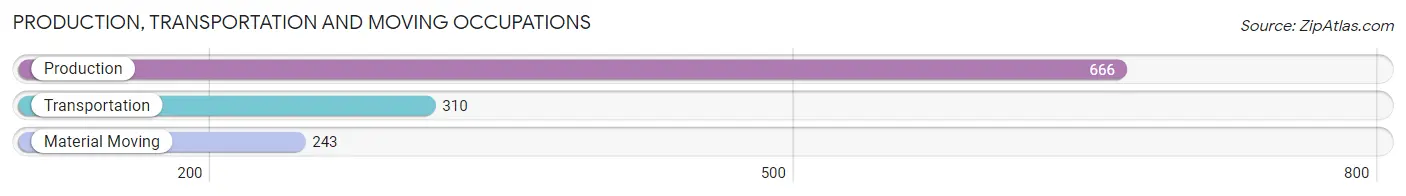
Production, Transportation and Moving Occupations
The most common Production, Transportation and Moving occupations in Batesville are Production (666 | 14.9%), Transportation (310 | 6.9%), and Material Moving (243 | 5.4%).
Production, Transportation and Moving Occupations by Sex
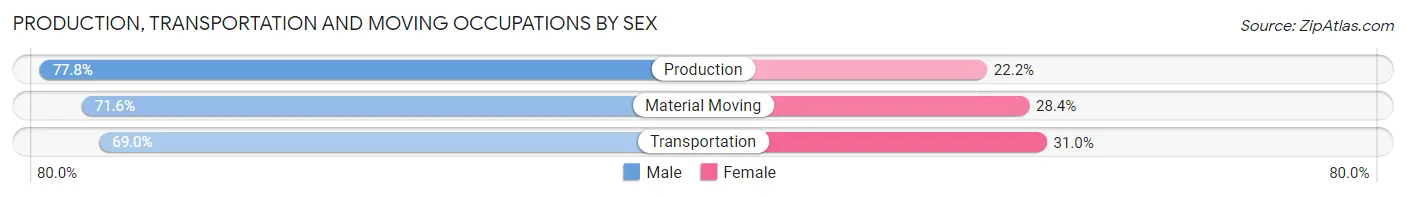
| Occupation | Male | Female |
| Production | 518 (77.8%) | 148 (22.2%) |
| Transportation | 214 (69.0%) | 96 (31.0%) |
| Material Moving | 174 (71.6%) | 69 (28.4%) |
| Total (Category) | 906 (74.3%) | 313 (25.7%) |
| Total (Overall) | 2,653 (59.3%) | 1,820 (40.7%) |
Employment Industries by Sex in Batesville
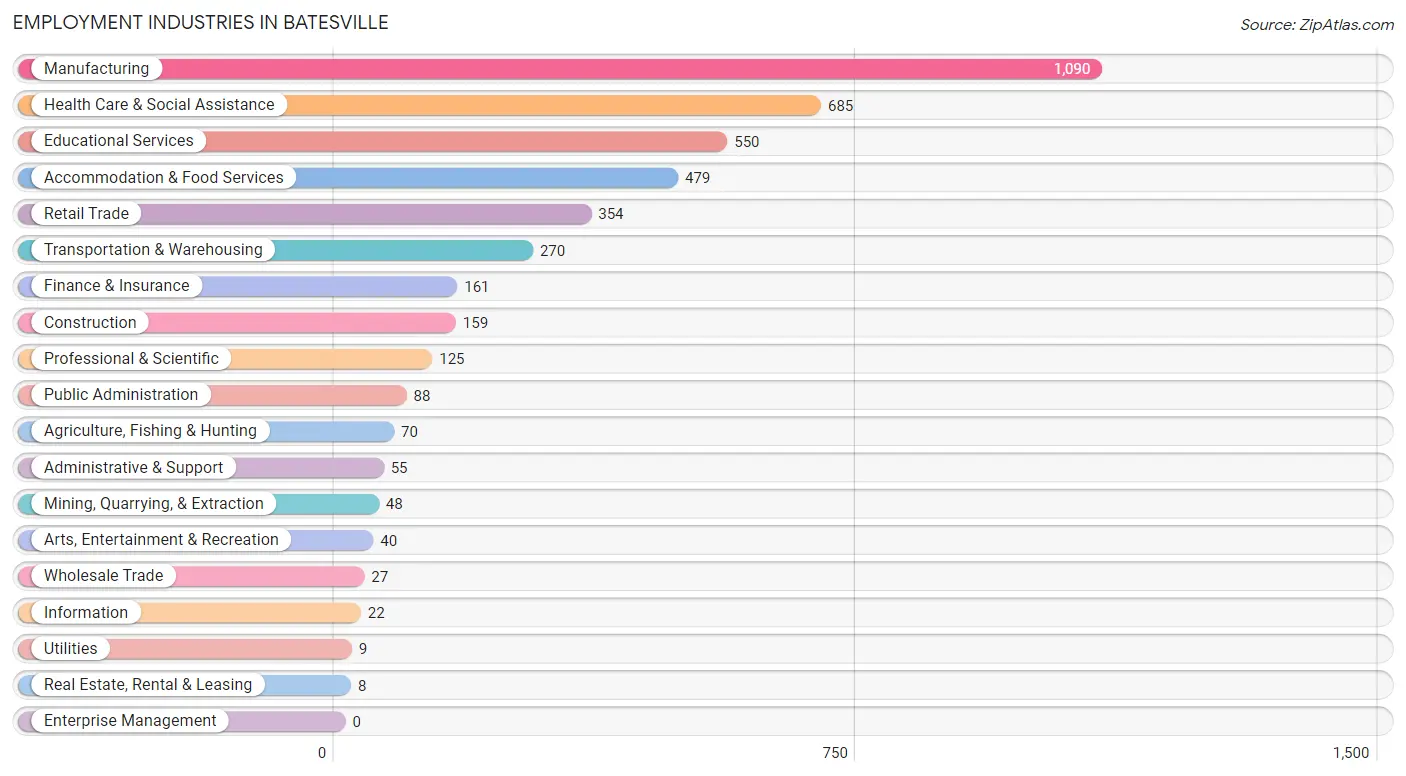
Employment Industries in Batesville
The major employment industries in Batesville include Manufacturing (1,090 | 24.4%), Health Care & Social Assistance (685 | 15.3%), Educational Services (550 | 12.3%), Accommodation & Food Services (479 | 10.7%), and Retail Trade (354 | 7.9%).
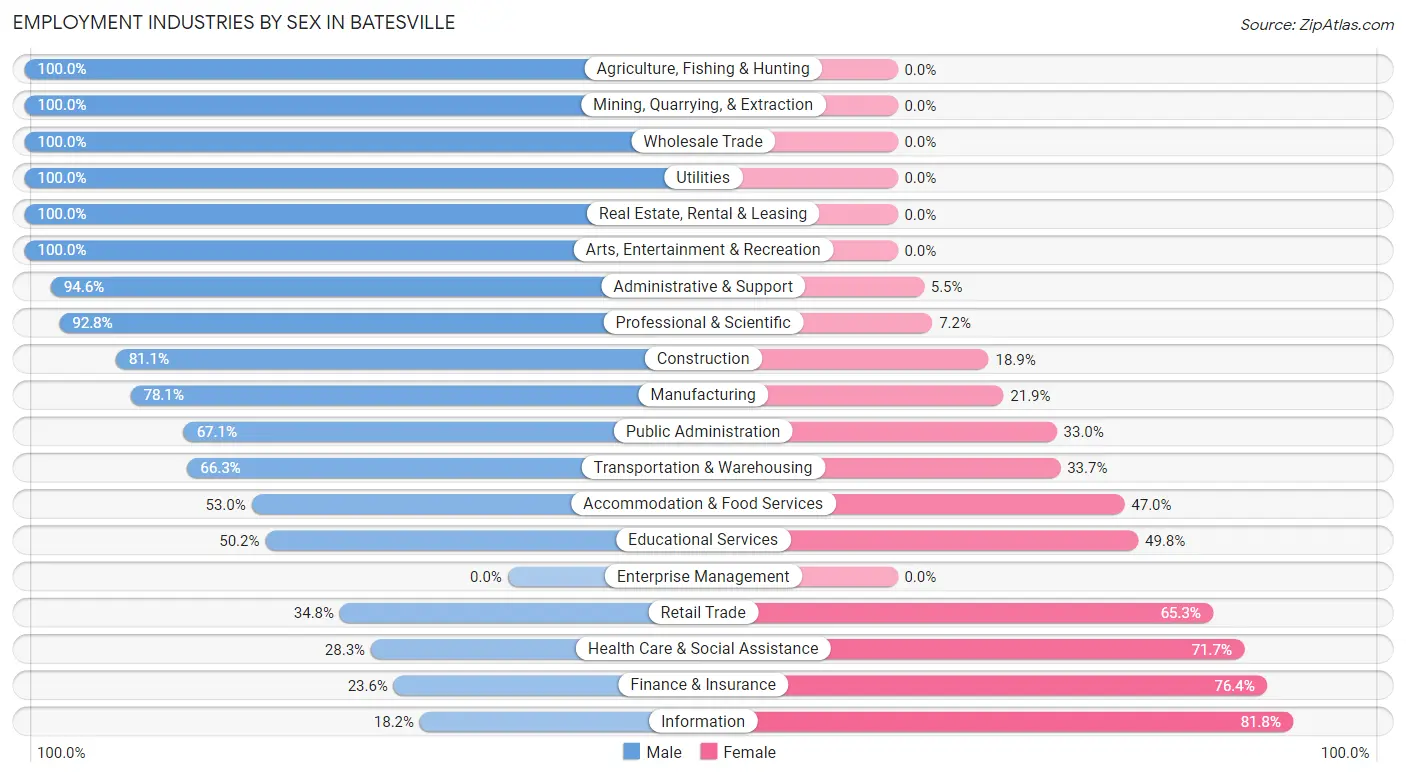
Employment Industries by Sex in Batesville
The Batesville industries that see more men than women are Agriculture, Fishing & Hunting (100.0%), Mining, Quarrying, & Extraction (100.0%), and Wholesale Trade (100.0%), whereas the industries that tend to have a higher number of women are Information (81.8%), Finance & Insurance (76.4%), and Health Care & Social Assistance (71.7%).
| Industry | Male | Female |
| Agriculture, Fishing & Hunting | 70 (100.0%) | 0 (0.0%) |
| Mining, Quarrying, & Extraction | 48 (100.0%) | 0 (0.0%) |
| Construction | 129 (81.1%) | 30 (18.9%) |
| Manufacturing | 851 (78.1%) | 239 (21.9%) |
| Wholesale Trade | 27 (100.0%) | 0 (0.0%) |
| Retail Trade | 123 (34.7%) | 231 (65.2%) |
| Transportation & Warehousing | 179 (66.3%) | 91 (33.7%) |
| Utilities | 9 (100.0%) | 0 (0.0%) |
| Information | 4 (18.2%) | 18 (81.8%) |
| Finance & Insurance | 38 (23.6%) | 123 (76.4%) |
| Real Estate, Rental & Leasing | 8 (100.0%) | 0 (0.0%) |
| Professional & Scientific | 116 (92.8%) | 9 (7.2%) |
| Enterprise Management | 0 (0.0%) | 0 (0.0%) |
| Administrative & Support | 52 (94.6%) | 3 (5.4%) |
| Educational Services | 276 (50.2%) | 274 (49.8%) |
| Health Care & Social Assistance | 194 (28.3%) | 491 (71.7%) |
| Arts, Entertainment & Recreation | 40 (100.0%) | 0 (0.0%) |
| Accommodation & Food Services | 254 (53.0%) | 225 (47.0%) |
| Public Administration | 59 (67.0%) | 29 (33.0%) |
| Total | 2,653 (59.3%) | 1,820 (40.7%) |
Education in Batesville
School Enrollment in Batesville
The most common levels of schooling among the 2,665 students in Batesville are college / undergraduate (794 | 29.8%), middle school (580 | 21.8%), and elementary school (512 | 19.2%).
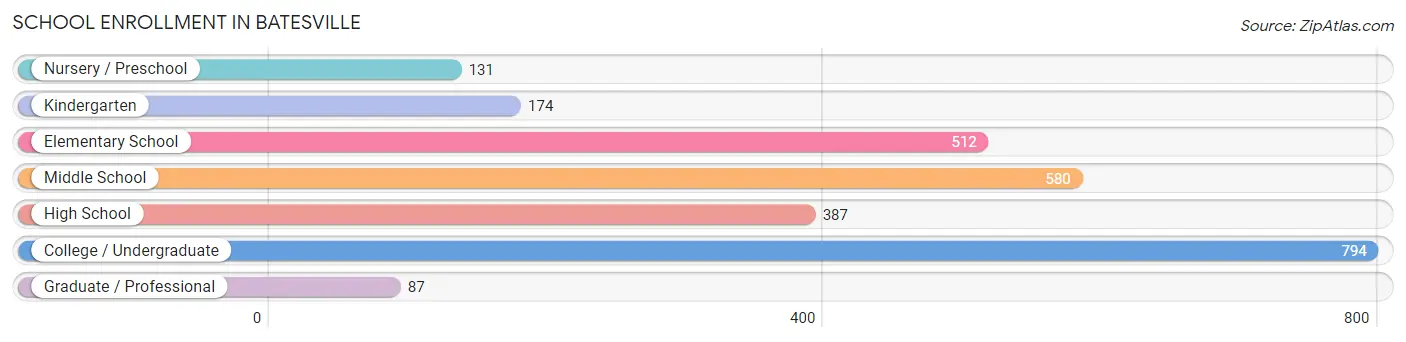
| School Level | # Students | % Students |
| Nursery / Preschool | 131 | 4.9% |
| Kindergarten | 174 | 6.5% |
| Elementary School | 512 | 19.2% |
| Middle School | 580 | 21.8% |
| High School | 387 | 14.5% |
| College / Undergraduate | 794 | 29.8% |
| Graduate / Professional | 87 | 3.3% |
| Total | 2,665 | 100.0% |
School Enrollment by Age by Funding Source in Batesville
Out of a total of 2,665 students who are enrolled in schools in Batesville, 381 (14.3%) attend a private institution, while the remaining 2,284 (85.7%) are enrolled in public schools. The age group of 35 years and over has the highest likelihood of being enrolled in private schools, with 25 (51.0% in the age bracket) enrolled. Conversely, the age group of 25 to 34 year olds has the lowest likelihood of being enrolled in a private school, with 159 (100.0% in the age bracket) attending a public institution.
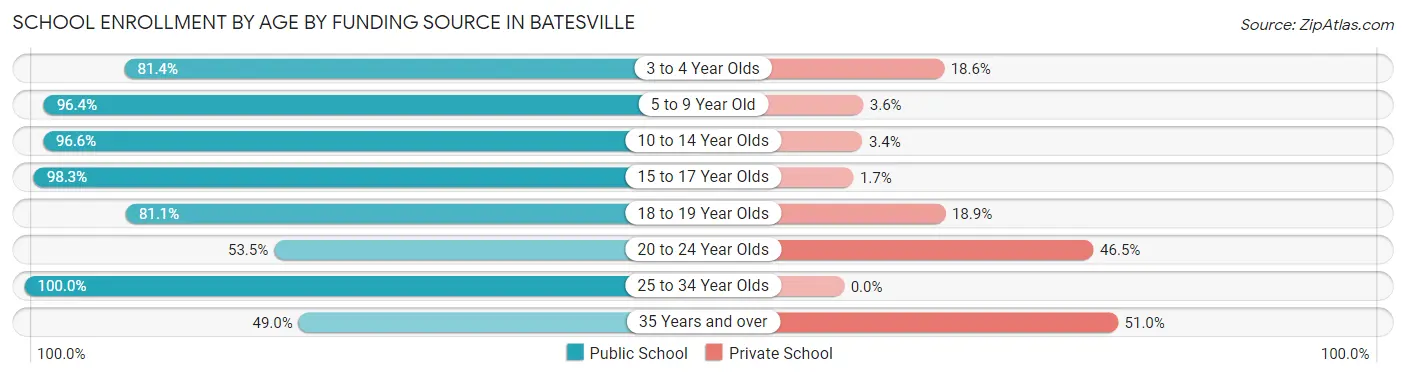
| Age Bracket | Public School | Private School |
| 3 to 4 Year Olds | 83 (81.4%) | 19 (18.6%) |
| 5 to 9 Year Old | 622 (96.4%) | 23 (3.6%) |
| 10 to 14 Year Olds | 680 (96.6%) | 24 (3.4%) |
| 15 to 17 Year Olds | 227 (98.3%) | 4 (1.7%) |
| 18 to 19 Year Olds | 215 (81.1%) | 50 (18.9%) |
| 20 to 24 Year Olds | 273 (53.5%) | 237 (46.5%) |
| 25 to 34 Year Olds | 159 (100.0%) | 0 (0.0%) |
| 35 Years and over | 24 (49.0%) | 25 (51.0%) |
| Total | 2,284 (85.7%) | 381 (14.3%) |
Educational Attainment by Field of Study in Batesville
Education (355 | 20.3%), business (241 | 13.8%), bio, nature & agricultural (204 | 11.6%), social sciences (168 | 9.6%), and psychology (117 | 6.7%) are the most common fields of study among 1,753 individuals in Batesville who have obtained a bachelor's degree or higher.
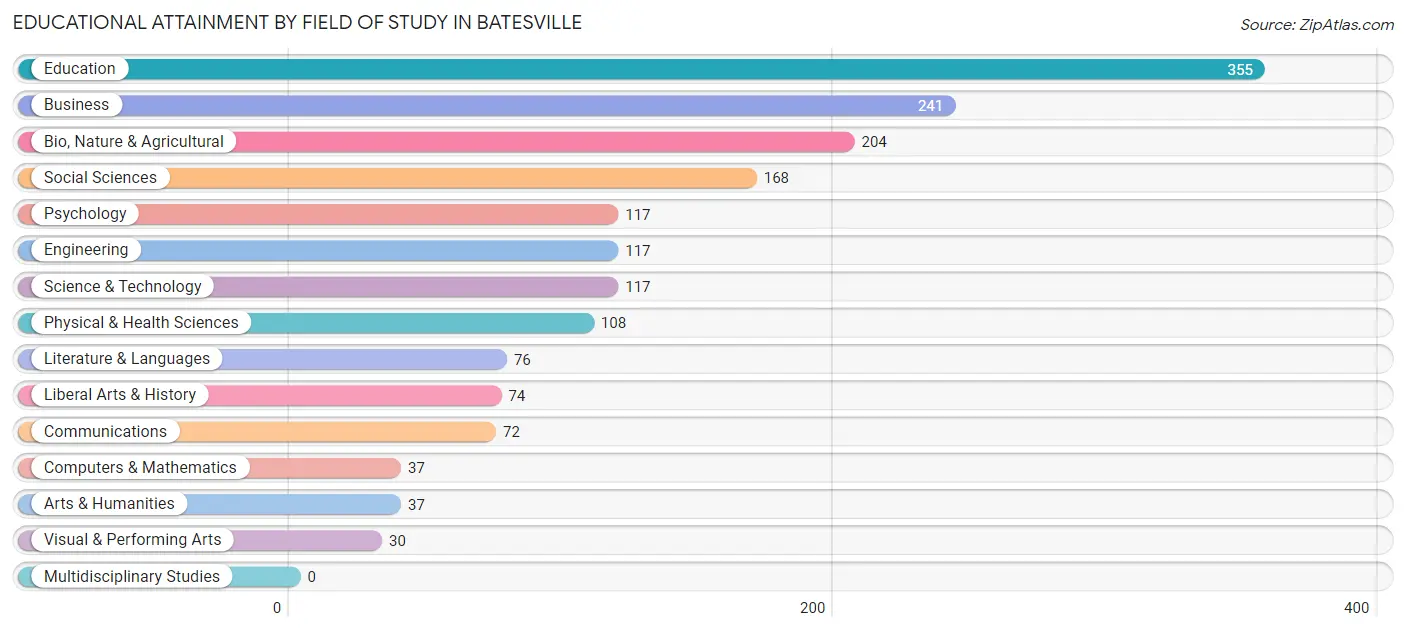
| Field of Study | # Graduates | % Graduates |
| Computers & Mathematics | 37 | 2.1% |
| Bio, Nature & Agricultural | 204 | 11.6% |
| Physical & Health Sciences | 108 | 6.2% |
| Psychology | 117 | 6.7% |
| Social Sciences | 168 | 9.6% |
| Engineering | 117 | 6.7% |
| Multidisciplinary Studies | 0 | 0.0% |
| Science & Technology | 117 | 6.7% |
| Business | 241 | 13.8% |
| Education | 355 | 20.3% |
| Literature & Languages | 76 | 4.3% |
| Liberal Arts & History | 74 | 4.2% |
| Visual & Performing Arts | 30 | 1.7% |
| Communications | 72 | 4.1% |
| Arts & Humanities | 37 | 2.1% |
| Total | 1,753 | 100.0% |
Transportation & Commute in Batesville
Vehicle Availability by Sex in Batesville
The most prevalent vehicle ownership categories in Batesville are males with 2 vehicles (1,008, accounting for 39.3%) and females with 2 vehicles (649, making up 57.6%).
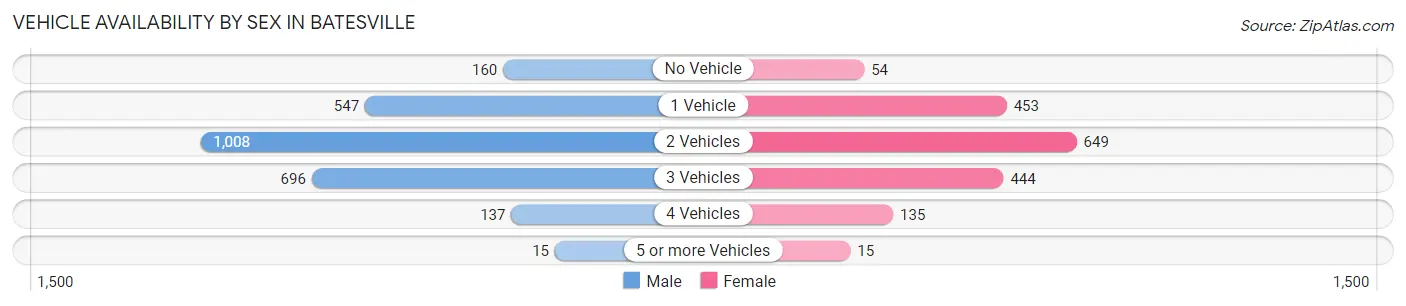
| Vehicles Available | Male | Female |
| No Vehicle | 160 (6.2%) | 54 (3.1%) |
| 1 Vehicle | 547 (21.3%) | 453 (25.9%) |
| 2 Vehicles | 1,008 (39.3%) | 649 (37.1%) |
| 3 Vehicles | 696 (27.2%) | 444 (25.4%) |
| 4 Vehicles | 137 (5.3%) | 135 (7.7%) |
| 5 or more Vehicles | 15 (0.6%) | 15 (0.9%) |
| Total | 2,563 (100.0%) | 1,750 (100.0%) |
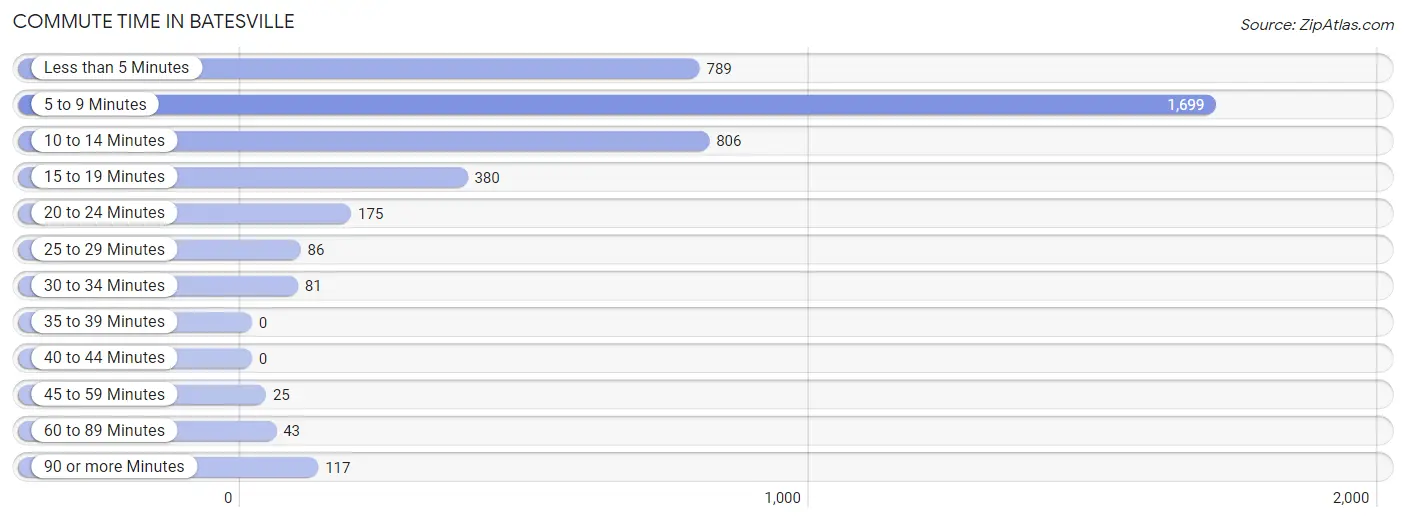
Commute Time in Batesville
The most frequently occuring commute durations in Batesville are 5 to 9 minutes (1,699 commuters, 40.4%), 10 to 14 minutes (806 commuters, 19.2%), and less than 5 minutes (789 commuters, 18.8%).
| Commute Time | # Commuters | % Commuters |
| Less than 5 Minutes | 789 | 18.8% |
| 5 to 9 Minutes | 1,699 | 40.4% |
| 10 to 14 Minutes | 806 | 19.2% |
| 15 to 19 Minutes | 380 | 9.0% |
| 20 to 24 Minutes | 175 | 4.2% |
| 25 to 29 Minutes | 86 | 2.1% |
| 30 to 34 Minutes | 81 | 1.9% |
| 35 to 39 Minutes | 0 | 0.0% |
| 40 to 44 Minutes | 0 | 0.0% |
| 45 to 59 Minutes | 25 | 0.6% |
| 60 to 89 Minutes | 43 | 1.0% |
| 90 or more Minutes | 117 | 2.8% |
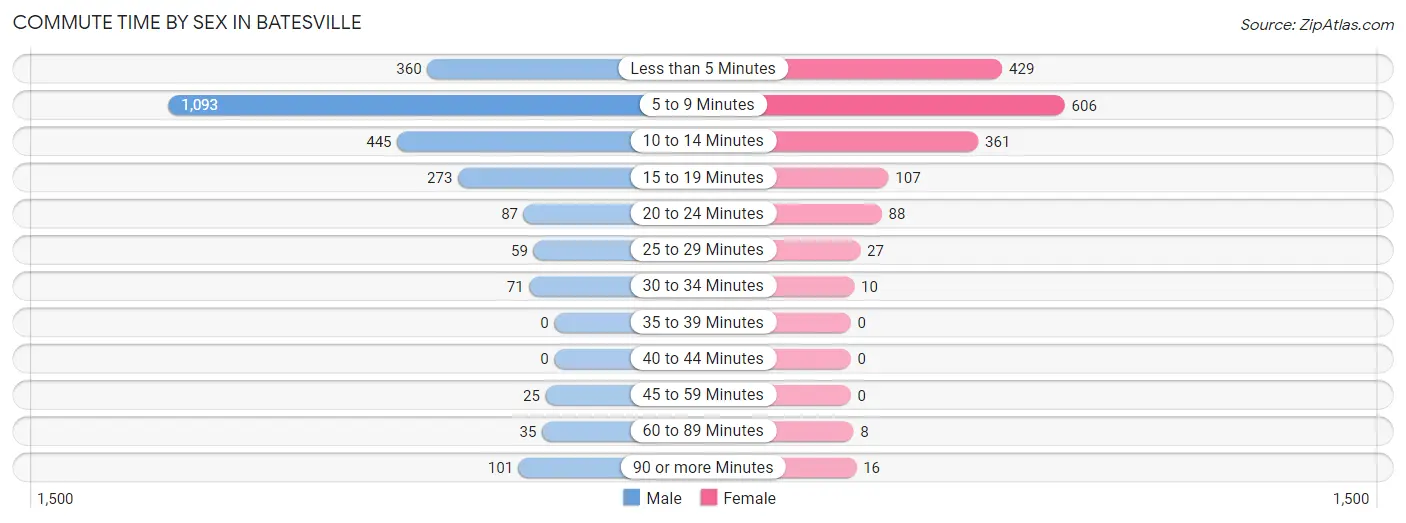
Commute Time by Sex in Batesville
The most common commute times in Batesville are 5 to 9 minutes (1,093 commuters, 42.9%) for males and 5 to 9 minutes (606 commuters, 36.7%) for females.
| Commute Time | Male | Female |
| Less than 5 Minutes | 360 (14.1%) | 429 (26.0%) |
| 5 to 9 Minutes | 1,093 (42.9%) | 606 (36.7%) |
| 10 to 14 Minutes | 445 (17.5%) | 361 (21.8%) |
| 15 to 19 Minutes | 273 (10.7%) | 107 (6.5%) |
| 20 to 24 Minutes | 87 (3.4%) | 88 (5.3%) |
| 25 to 29 Minutes | 59 (2.3%) | 27 (1.6%) |
| 30 to 34 Minutes | 71 (2.8%) | 10 (0.6%) |
| 35 to 39 Minutes | 0 (0.0%) | 0 (0.0%) |
| 40 to 44 Minutes | 0 (0.0%) | 0 (0.0%) |
| 45 to 59 Minutes | 25 (1.0%) | 0 (0.0%) |
| 60 to 89 Minutes | 35 (1.4%) | 8 (0.5%) |
| 90 or more Minutes | 101 (4.0%) | 16 (1.0%) |
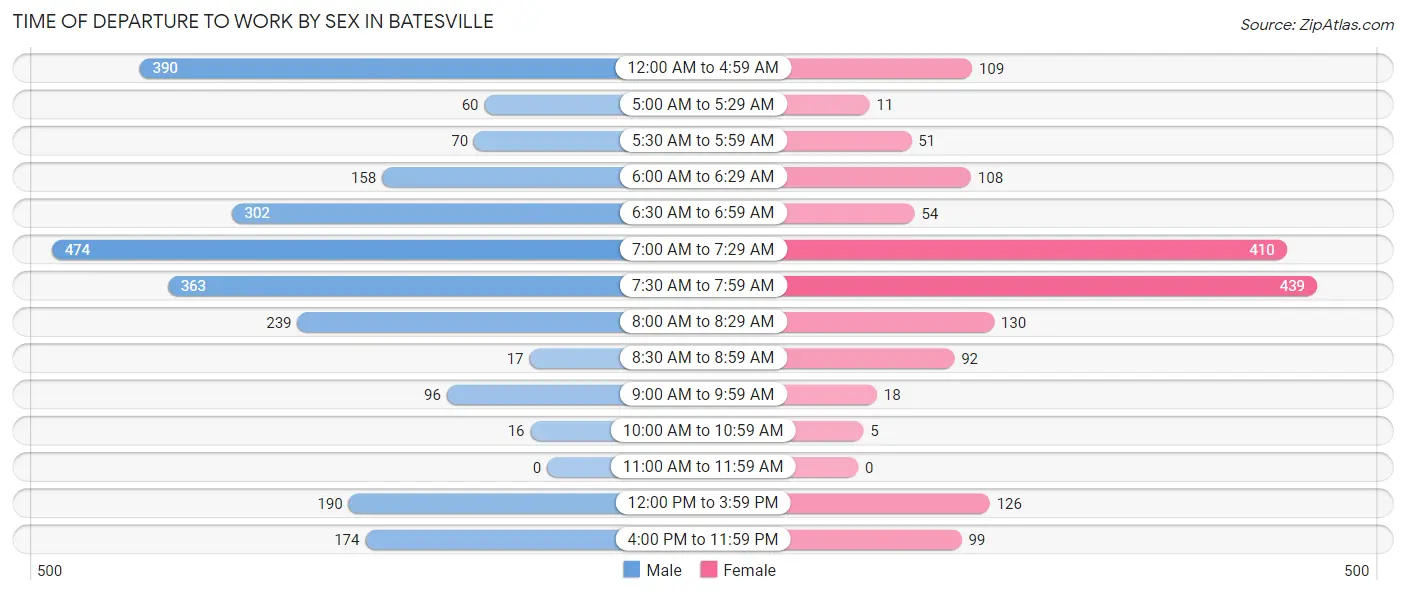
Time of Departure to Work by Sex in Batesville
The most frequent times of departure to work in Batesville are 7:00 AM to 7:29 AM (474, 18.6%) for males and 7:30 AM to 7:59 AM (439, 26.6%) for females.
| Time of Departure | Male | Female |
| 12:00 AM to 4:59 AM | 390 (15.3%) | 109 (6.6%) |
| 5:00 AM to 5:29 AM | 60 (2.4%) | 11 (0.7%) |
| 5:30 AM to 5:59 AM | 70 (2.8%) | 51 (3.1%) |
| 6:00 AM to 6:29 AM | 158 (6.2%) | 108 (6.5%) |
| 6:30 AM to 6:59 AM | 302 (11.8%) | 54 (3.3%) |
| 7:00 AM to 7:29 AM | 474 (18.6%) | 410 (24.8%) |
| 7:30 AM to 7:59 AM | 363 (14.2%) | 439 (26.6%) |
| 8:00 AM to 8:29 AM | 239 (9.4%) | 130 (7.9%) |
| 8:30 AM to 8:59 AM | 17 (0.7%) | 92 (5.6%) |
| 9:00 AM to 9:59 AM | 96 (3.8%) | 18 (1.1%) |
| 10:00 AM to 10:59 AM | 16 (0.6%) | 5 (0.3%) |
| 11:00 AM to 11:59 AM | 0 (0.0%) | 0 (0.0%) |
| 12:00 PM to 3:59 PM | 190 (7.4%) | 126 (7.6%) |
| 4:00 PM to 11:59 PM | 174 (6.8%) | 99 (6.0%) |
| Total | 2,549 (100.0%) | 1,652 (100.0%) |
Housing Occupancy in Batesville
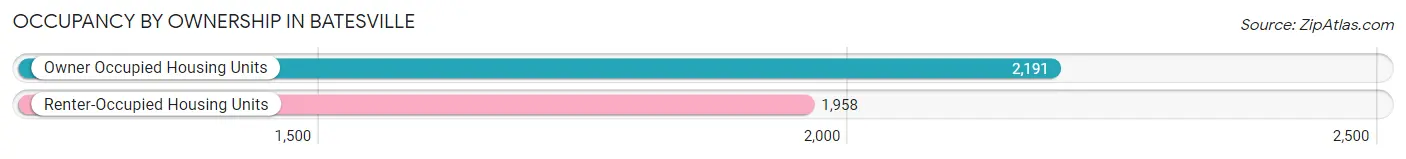
Occupancy by Ownership in Batesville
Of the total 4,149 dwellings in Batesville, owner-occupied units account for 2,191 (52.8%), while renter-occupied units make up 1,958 (47.2%).
| Occupancy | # Housing Units | % Housing Units |
| Owner Occupied Housing Units | 2,191 | 52.8% |
| Renter-Occupied Housing Units | 1,958 | 47.2% |
| Total Occupied Housing Units | 4,149 | 100.0% |
Occupancy by Household Size in Batesville
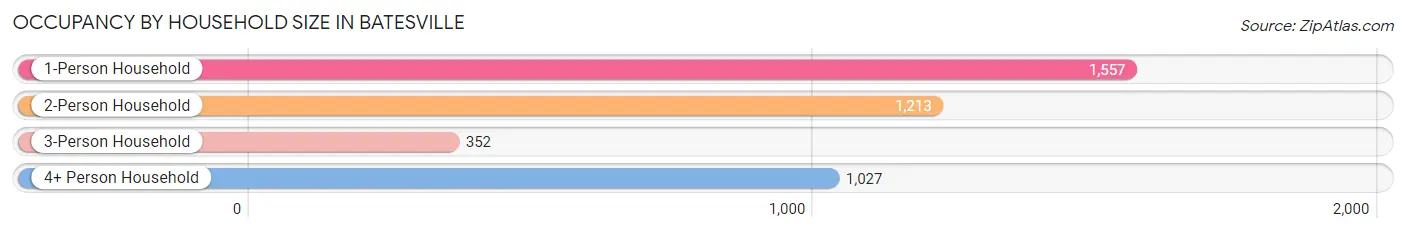
| Household Size | # Housing Units | % Housing Units |
| 1-Person Household | 1,557 | 37.5% |
| 2-Person Household | 1,213 | 29.2% |
| 3-Person Household | 352 | 8.5% |
| 4+ Person Household | 1,027 | 24.7% |
| Total Housing Units | 4,149 | 100.0% |
Occupancy by Ownership by Household Size in Batesville
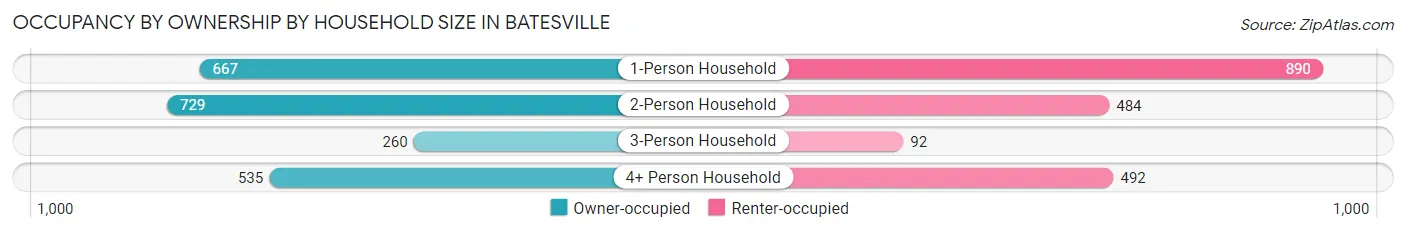
| Household Size | Owner-occupied | Renter-occupied |
| 1-Person Household | 667 (42.8%) | 890 (57.2%) |
| 2-Person Household | 729 (60.1%) | 484 (39.9%) |
| 3-Person Household | 260 (73.9%) | 92 (26.1%) |
| 4+ Person Household | 535 (52.1%) | 492 (47.9%) |
| Total Housing Units | 2,191 (52.8%) | 1,958 (47.2%) |
Occupancy by Educational Attainment in Batesville
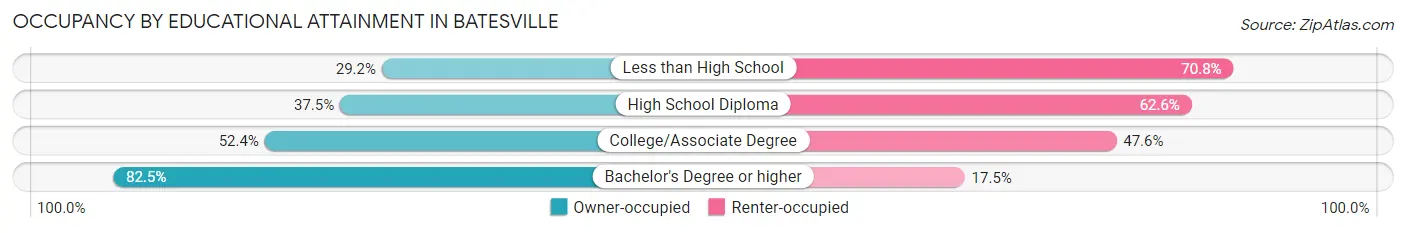
| Household Size | Owner-occupied | Renter-occupied |
| Less than High School | 138 (29.2%) | 335 (70.8%) |
| High School Diploma | 485 (37.4%) | 810 (62.5%) |
| College/Associate Degree | 689 (52.4%) | 626 (47.6%) |
| Bachelor's Degree or higher | 879 (82.5%) | 187 (17.5%) |
Occupancy by Age of Householder in Batesville
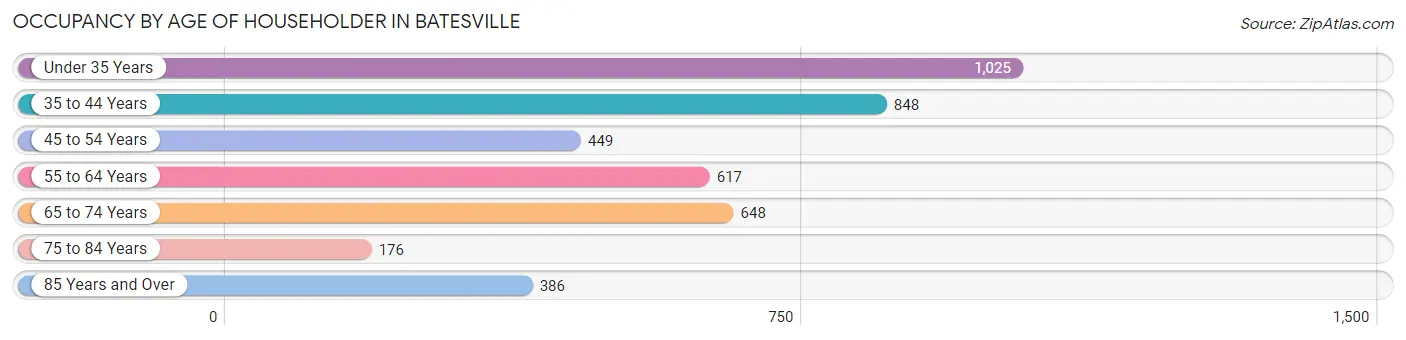
| Age Bracket | # Households | % Households |
| Under 35 Years | 1,025 | 24.7% |
| 35 to 44 Years | 848 | 20.4% |
| 45 to 54 Years | 449 | 10.8% |
| 55 to 64 Years | 617 | 14.9% |
| 65 to 74 Years | 648 | 15.6% |
| 75 to 84 Years | 176 | 4.2% |
| 85 Years and Over | 386 | 9.3% |
| Total | 4,149 | 100.0% |
Housing Finances in Batesville
Median Income by Occupancy in Batesville
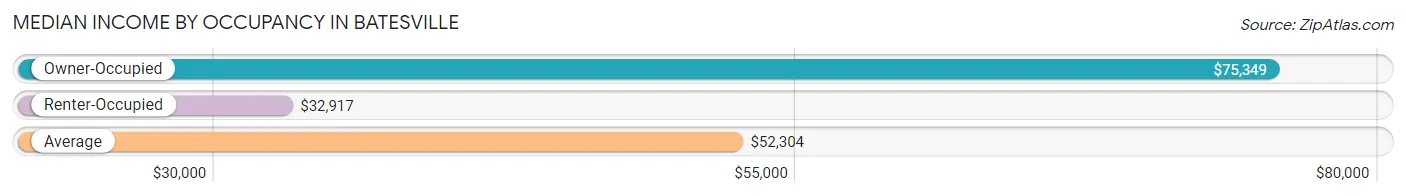
| Occupancy Type | # Households | Median Income |
| Owner-Occupied | 2,191 (52.8%) | $75,349 |
| Renter-Occupied | 1,958 (47.2%) | $32,917 |
| Average | 4,149 (100.0%) | $52,304 |
Occupancy by Householder Income Bracket in Batesville
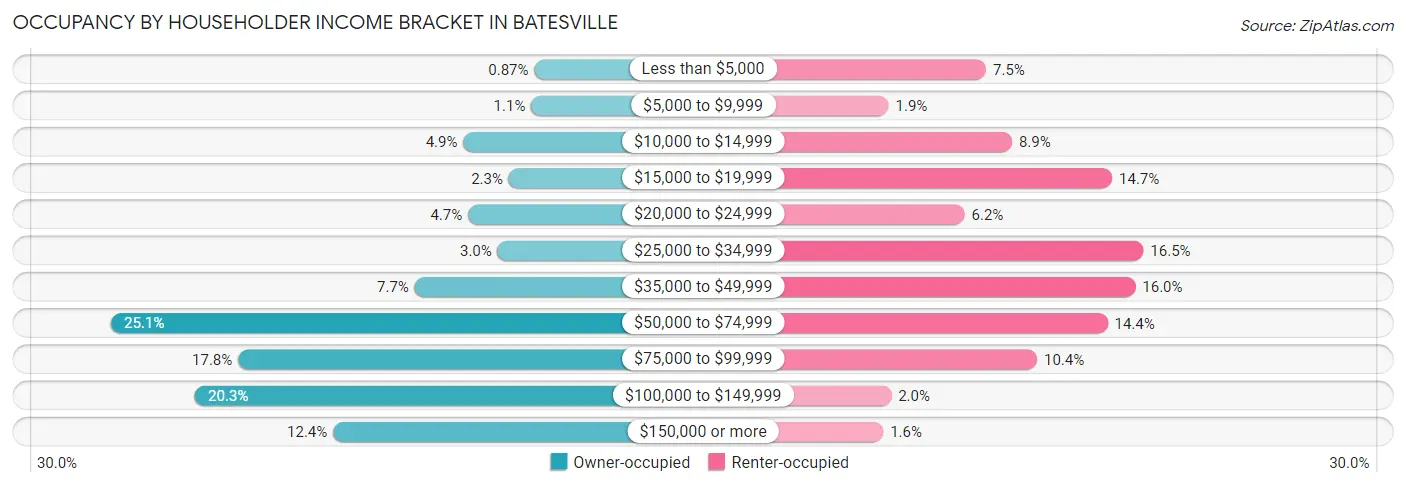
| Income Bracket | Owner-occupied | Renter-occupied |
| Less than $5,000 | 19 (0.9%) | 146 (7.5%) |
| $5,000 to $9,999 | 23 (1.1%) | 37 (1.9%) |
| $10,000 to $14,999 | 108 (4.9%) | 175 (8.9%) |
| $15,000 to $19,999 | 51 (2.3%) | 287 (14.7%) |
| $20,000 to $24,999 | 102 (4.7%) | 122 (6.2%) |
| $25,000 to $34,999 | 65 (3.0%) | 322 (16.5%) |
| $35,000 to $49,999 | 169 (7.7%) | 313 (16.0%) |
| $50,000 to $74,999 | 549 (25.1%) | 282 (14.4%) |
| $75,000 to $99,999 | 390 (17.8%) | 203 (10.4%) |
| $100,000 to $149,999 | 444 (20.3%) | 40 (2.0%) |
| $150,000 or more | 271 (12.4%) | 31 (1.6%) |
| Total | 2,191 (100.0%) | 1,958 (100.0%) |
Monthly Housing Cost Tiers in Batesville
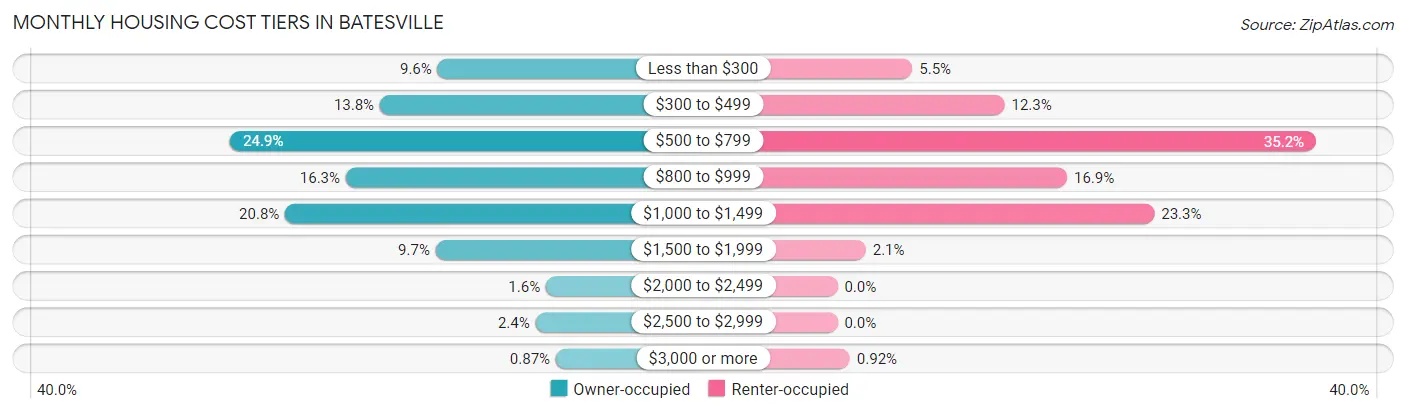
| Monthly Cost | Owner-occupied | Renter-occupied |
| Less than $300 | 210 (9.6%) | 108 (5.5%) |
| $300 to $499 | 303 (13.8%) | 241 (12.3%) |
| $500 to $799 | 545 (24.9%) | 690 (35.2%) |
| $800 to $999 | 358 (16.3%) | 331 (16.9%) |
| $1,000 to $1,499 | 456 (20.8%) | 457 (23.3%) |
| $1,500 to $1,999 | 213 (9.7%) | 41 (2.1%) |
| $2,000 to $2,499 | 35 (1.6%) | 0 (0.0%) |
| $2,500 to $2,999 | 52 (2.4%) | 0 (0.0%) |
| $3,000 or more | 19 (0.9%) | 18 (0.9%) |
| Total | 2,191 (100.0%) | 1,958 (100.0%) |
Physical Housing Characteristics in Batesville
Housing Structures in Batesville
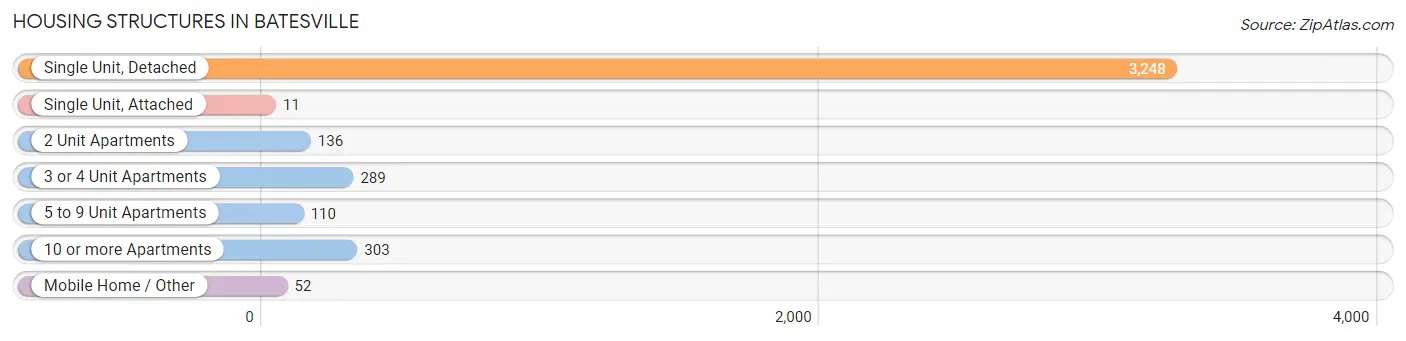
| Structure Type | # Housing Units | % Housing Units |
| Single Unit, Detached | 3,248 | 78.3% |
| Single Unit, Attached | 11 | 0.3% |
| 2 Unit Apartments | 136 | 3.3% |
| 3 or 4 Unit Apartments | 289 | 7.0% |
| 5 to 9 Unit Apartments | 110 | 2.6% |
| 10 or more Apartments | 303 | 7.3% |
| Mobile Home / Other | 52 | 1.3% |
| Total | 4,149 | 100.0% |
Housing Structures by Occupancy in Batesville
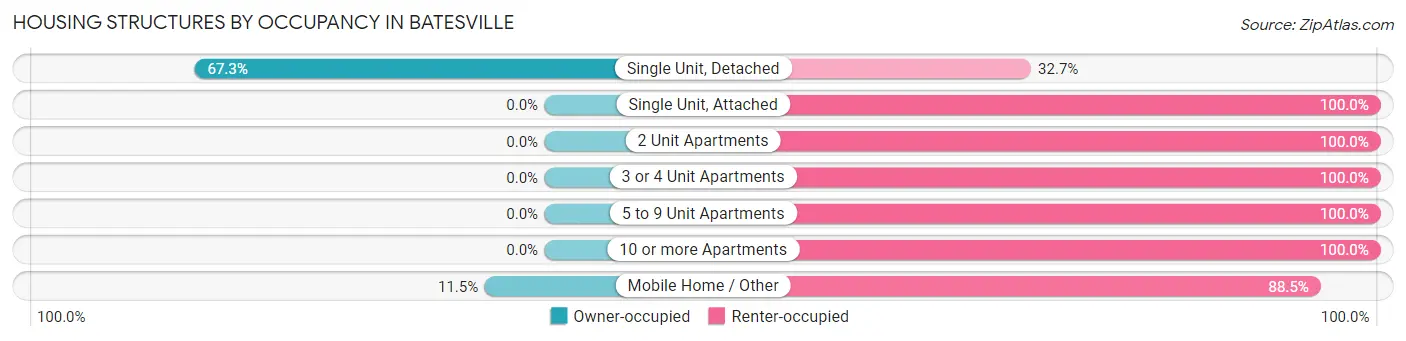
| Structure Type | Owner-occupied | Renter-occupied |
| Single Unit, Detached | 2,185 (67.3%) | 1,063 (32.7%) |
| Single Unit, Attached | 0 (0.0%) | 11 (100.0%) |
| 2 Unit Apartments | 0 (0.0%) | 136 (100.0%) |
| 3 or 4 Unit Apartments | 0 (0.0%) | 289 (100.0%) |
| 5 to 9 Unit Apartments | 0 (0.0%) | 110 (100.0%) |
| 10 or more Apartments | 0 (0.0%) | 303 (100.0%) |
| Mobile Home / Other | 6 (11.5%) | 46 (88.5%) |
| Total | 2,191 (52.8%) | 1,958 (47.2%) |
Housing Structures by Number of Rooms in Batesville
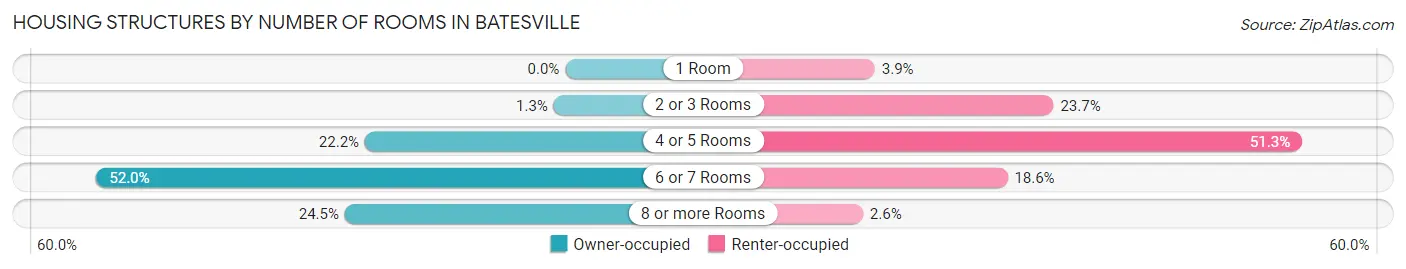
| Number of Rooms | Owner-occupied | Renter-occupied |
| 1 Room | 0 (0.0%) | 76 (3.9%) |
| 2 or 3 Rooms | 28 (1.3%) | 464 (23.7%) |
| 4 or 5 Rooms | 487 (22.2%) | 1,004 (51.3%) |
| 6 or 7 Rooms | 1,140 (52.0%) | 364 (18.6%) |
| 8 or more Rooms | 536 (24.5%) | 50 (2.5%) |
| Total | 2,191 (100.0%) | 1,958 (100.0%) |
Housing Structure by Heating Type in Batesville
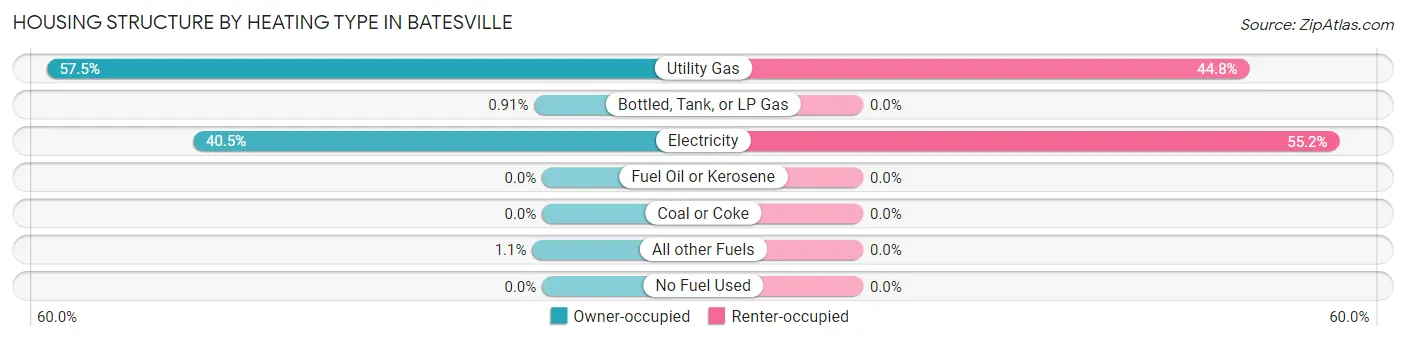
| Heating Type | Owner-occupied | Renter-occupied |
| Utility Gas | 1,259 (57.5%) | 877 (44.8%) |
| Bottled, Tank, or LP Gas | 20 (0.9%) | 0 (0.0%) |
| Electricity | 887 (40.5%) | 1,081 (55.2%) |
| Fuel Oil or Kerosene | 0 (0.0%) | 0 (0.0%) |
| Coal or Coke | 0 (0.0%) | 0 (0.0%) |
| All other Fuels | 25 (1.1%) | 0 (0.0%) |
| No Fuel Used | 0 (0.0%) | 0 (0.0%) |
| Total | 2,191 (100.0%) | 1,958 (100.0%) |
Household Vehicle Usage in Batesville
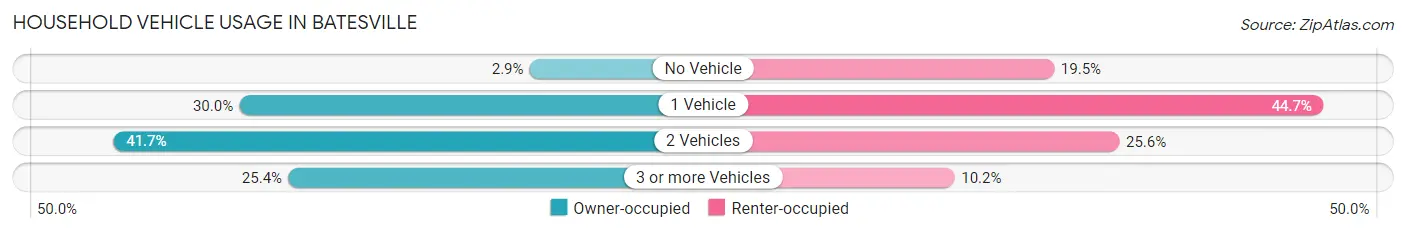
| Vehicles per Household | Owner-occupied | Renter-occupied |
| No Vehicle | 63 (2.9%) | 382 (19.5%) |
| 1 Vehicle | 657 (30.0%) | 875 (44.7%) |
| 2 Vehicles | 914 (41.7%) | 501 (25.6%) |
| 3 or more Vehicles | 557 (25.4%) | 200 (10.2%) |
| Total | 2,191 (100.0%) | 1,958 (100.0%) |
Real Estate & Mortgages in Batesville
Real Estate and Mortgage Overview in Batesville
| Characteristic | Without Mortgage | With Mortgage |
| Housing Units | 854 | 1,337 |
| Median Property Value | $140,200 | $151,600 |
| Median Household Income | $62,778 | $134 |
| Monthly Housing Costs | $448 | $19 |
| Real Estate Taxes | $879 | $98 |
Property Value by Mortgage Status in Batesville
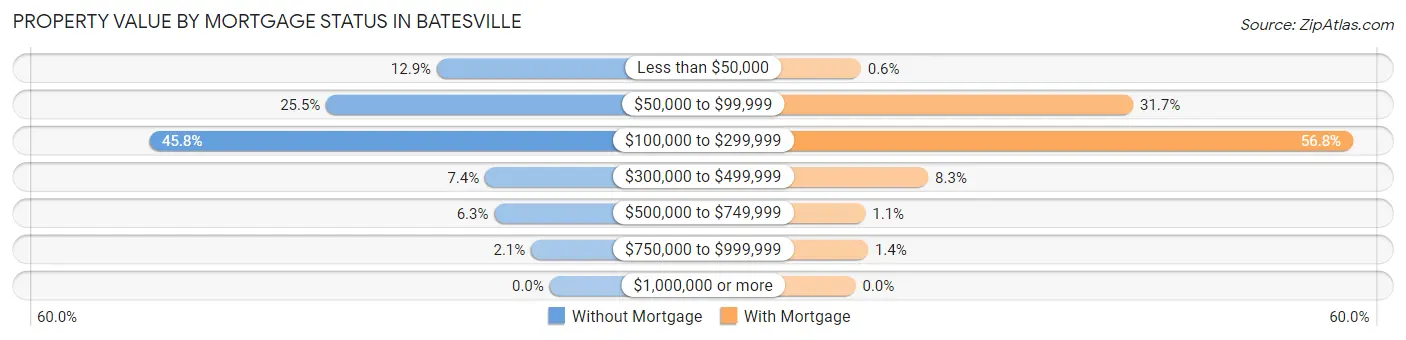
| Property Value | Without Mortgage | With Mortgage |
| Less than $50,000 | 110 (12.9%) | 8 (0.6%) |
| $50,000 to $99,999 | 218 (25.5%) | 424 (31.7%) |
| $100,000 to $299,999 | 391 (45.8%) | 760 (56.8%) |
| $300,000 to $499,999 | 63 (7.4%) | 111 (8.3%) |
| $500,000 to $749,999 | 54 (6.3%) | 15 (1.1%) |
| $750,000 to $999,999 | 18 (2.1%) | 19 (1.4%) |
| $1,000,000 or more | 0 (0.0%) | 0 (0.0%) |
| Total | 854 (100.0%) | 1,337 (100.0%) |
Household Income by Mortgage Status in Batesville
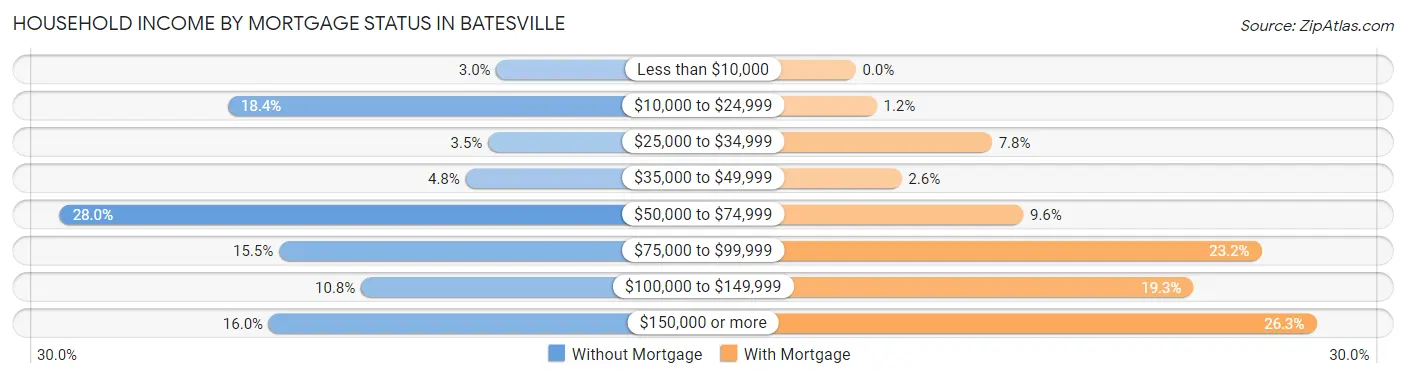
| Household Income | Without Mortgage | With Mortgage |
| Less than $10,000 | 26 (3.0%) | 0 (0.0%) |
| $10,000 to $24,999 | 157 (18.4%) | 16 (1.2%) |
| $25,000 to $34,999 | 30 (3.5%) | 104 (7.8%) |
| $35,000 to $49,999 | 41 (4.8%) | 35 (2.6%) |
| $50,000 to $74,999 | 239 (28.0%) | 128 (9.6%) |
| $75,000 to $99,999 | 132 (15.5%) | 310 (23.2%) |
| $100,000 to $149,999 | 92 (10.8%) | 258 (19.3%) |
| $150,000 or more | 137 (16.0%) | 352 (26.3%) |
| Total | 854 (100.0%) | 1,337 (100.0%) |
Property Value to Household Income Ratio in Batesville
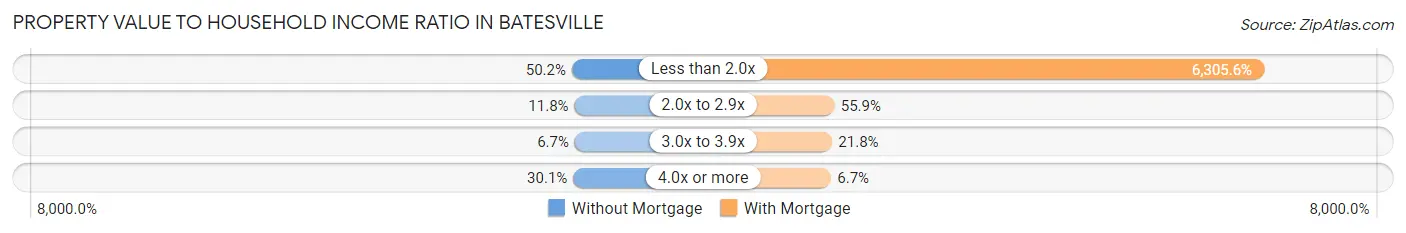
| Value-to-Income Ratio | Without Mortgage | With Mortgage |
| Less than 2.0x | 429 (50.2%) | 84,306 (6,305.6%) |
| 2.0x to 2.9x | 101 (11.8%) | 747 (55.9%) |
| 3.0x to 3.9x | 57 (6.7%) | 292 (21.8%) |
| 4.0x or more | 257 (30.1%) | 89 (6.7%) |
| Total | 854 (100.0%) | 1,337 (100.0%) |
Real Estate Taxes by Mortgage Status in Batesville
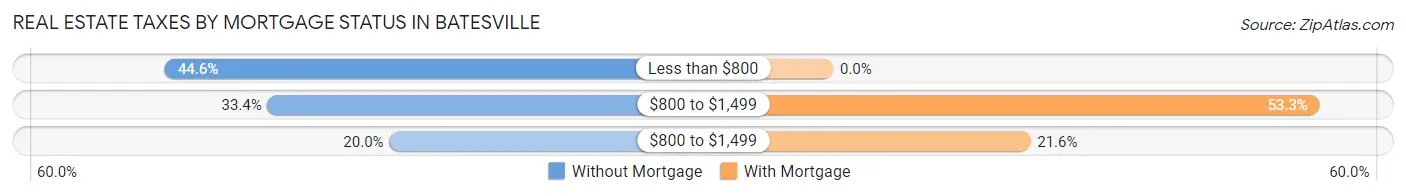
| Property Taxes | Without Mortgage | With Mortgage |
| Less than $800 | 381 (44.6%) | 0 (0.0%) |
| $800 to $1,499 | 285 (33.4%) | 713 (53.3%) |
| $800 to $1,499 | 171 (20.0%) | 289 (21.6%) |
| Total | 854 (100.0%) | 1,337 (100.0%) |
Health & Disability in Batesville
Health Insurance Coverage by Age in Batesville
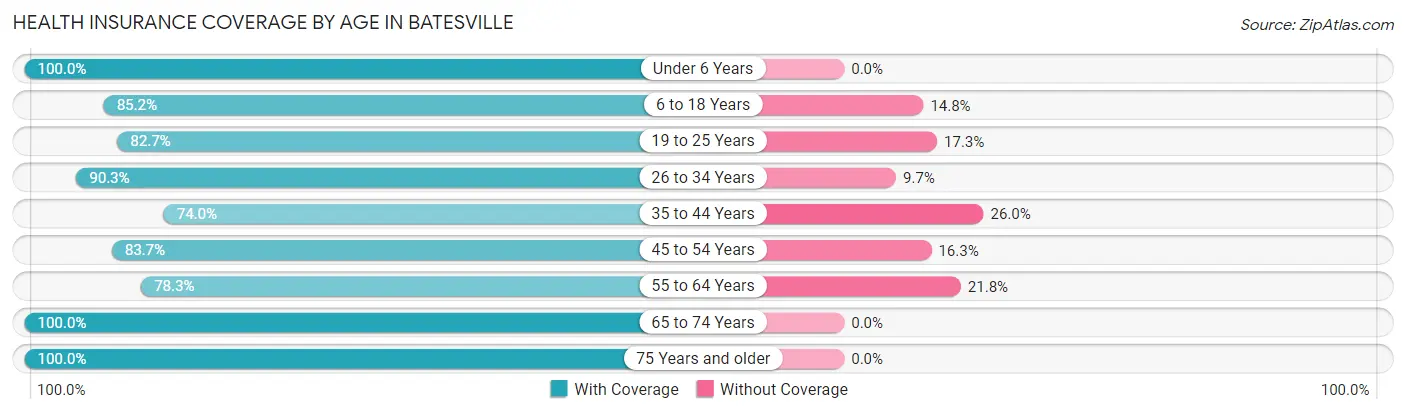
| Age Bracket | With Coverage | Without Coverage |
| Under 6 Years | 1,150 (100.0%) | 0 (0.0%) |
| 6 to 18 Years | 1,479 (85.2%) | 256 (14.8%) |
| 19 to 25 Years | 1,180 (82.7%) | 247 (17.3%) |
| 26 to 34 Years | 963 (90.3%) | 103 (9.7%) |
| 35 to 44 Years | 1,254 (74.0%) | 440 (26.0%) |
| 45 to 54 Years | 680 (83.7%) | 132 (16.3%) |
| 55 to 64 Years | 914 (78.2%) | 254 (21.7%) |
| 65 to 74 Years | 905 (100.0%) | 0 (0.0%) |
| 75 Years and older | 832 (100.0%) | 0 (0.0%) |
| Total | 9,357 (86.7%) | 1,432 (13.3%) |
Health Insurance Coverage by Citizenship Status in Batesville
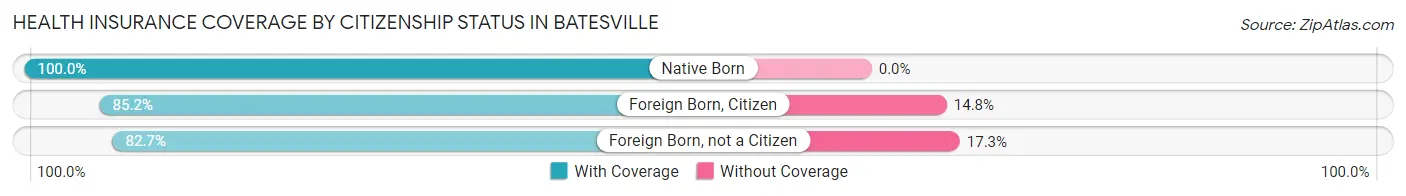
| Citizenship Status | With Coverage | Without Coverage |
| Native Born | 1,150 (100.0%) | 0 (0.0%) |
| Foreign Born, Citizen | 1,479 (85.2%) | 256 (14.8%) |
| Foreign Born, not a Citizen | 1,180 (82.7%) | 247 (17.3%) |
Health Insurance Coverage by Household Income in Batesville
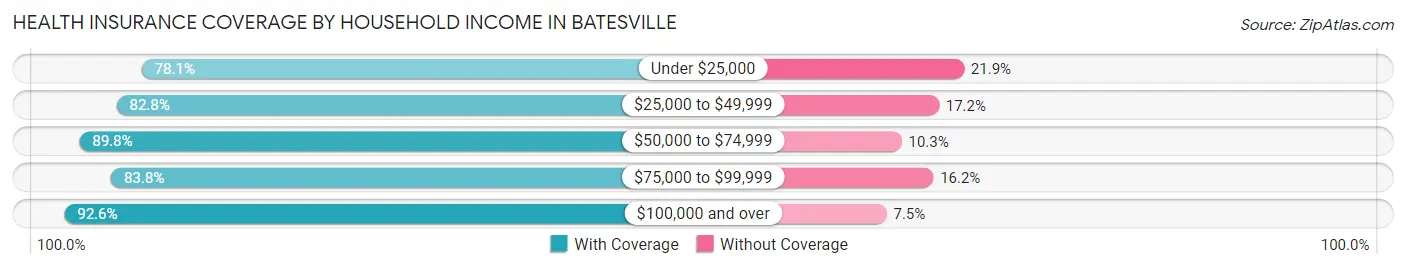
| Household Income | With Coverage | Without Coverage |
| Under $25,000 | 1,370 (78.1%) | 385 (21.9%) |
| $25,000 to $49,999 | 1,513 (82.8%) | 315 (17.2%) |
| $50,000 to $74,999 | 1,997 (89.7%) | 228 (10.2%) |
| $75,000 to $99,999 | 1,568 (83.8%) | 303 (16.2%) |
| $100,000 and over | 2,434 (92.5%) | 196 (7.4%) |
Public vs Private Health Insurance Coverage by Age in Batesville
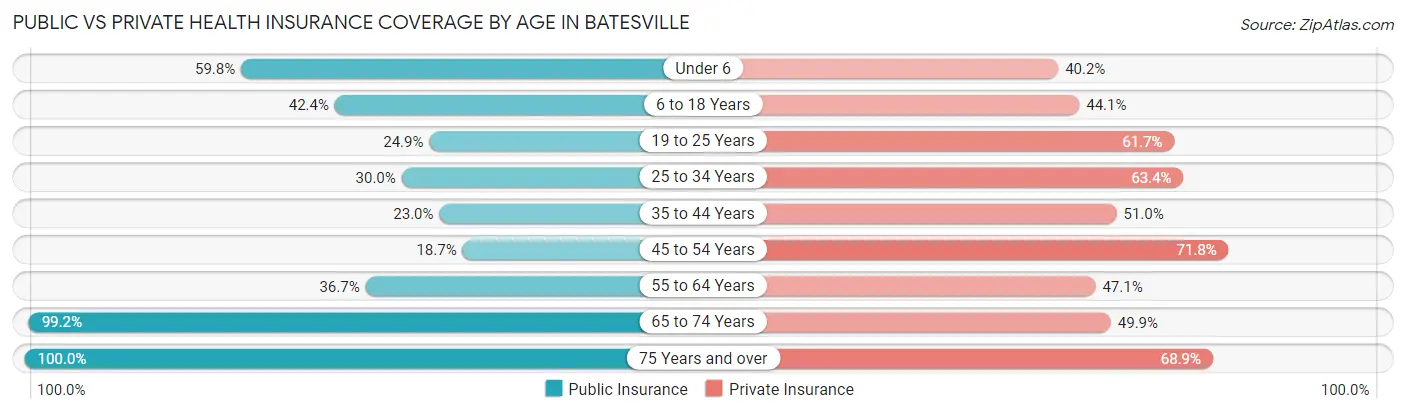
| Age Bracket | Public Insurance | Private Insurance |
| Under 6 | 688 (59.8%) | 462 (40.2%) |
| 6 to 18 Years | 736 (42.4%) | 765 (44.1%) |
| 19 to 25 Years | 355 (24.9%) | 881 (61.7%) |
| 25 to 34 Years | 320 (30.0%) | 676 (63.4%) |
| 35 to 44 Years | 390 (23.0%) | 864 (51.0%) |
| 45 to 54 Years | 152 (18.7%) | 583 (71.8%) |
| 55 to 64 Years | 429 (36.7%) | 550 (47.1%) |
| 65 to 74 Years | 898 (99.2%) | 452 (49.9%) |
| 75 Years and over | 832 (100.0%) | 573 (68.9%) |
| Total | 4,800 (44.5%) | 5,806 (53.8%) |
Disability Status by Sex by Age in Batesville
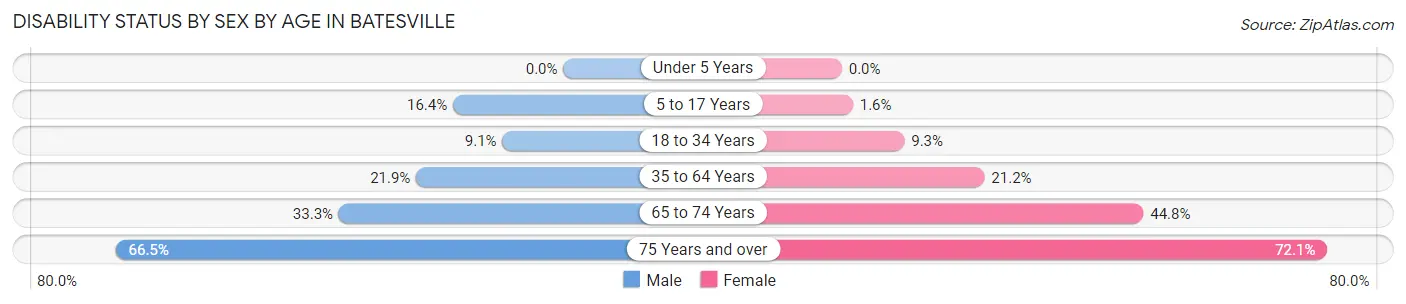
| Age Bracket | Male | Female |
| Under 5 Years | 0 (0.0%) | 0 (0.0%) |
| 5 to 17 Years | 133 (16.4%) | 16 (1.6%) |
| 18 to 34 Years | 134 (9.0%) | 110 (9.3%) |
| 35 to 64 Years | 418 (21.8%) | 373 (21.2%) |
| 65 to 74 Years | 117 (33.3%) | 248 (44.8%) |
| 75 Years and over | 234 (66.5%) | 346 (72.1%) |
Disability Class by Sex by Age in Batesville
Disability Class: Hearing Difficulty
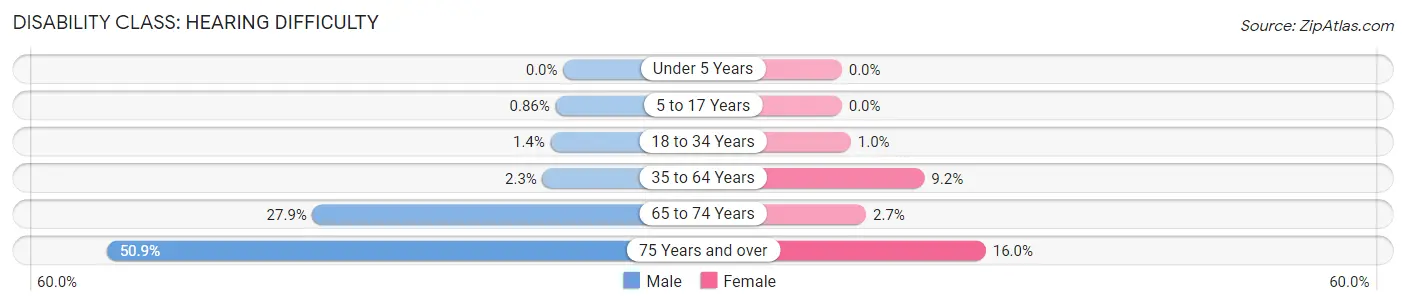
| Age Bracket | Male | Female |
| Under 5 Years | 0 (0.0%) | 0 (0.0%) |
| 5 to 17 Years | 7 (0.9%) | 0 (0.0%) |
| 18 to 34 Years | 21 (1.4%) | 12 (1.0%) |
| 35 to 64 Years | 44 (2.3%) | 162 (9.2%) |
| 65 to 74 Years | 98 (27.9%) | 15 (2.7%) |
| 75 Years and over | 179 (50.8%) | 77 (16.0%) |
Disability Class: Vision Difficulty
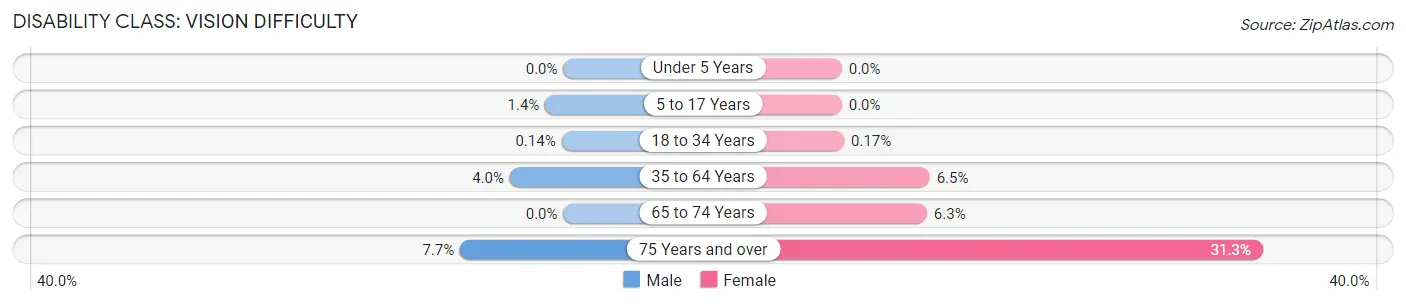
| Age Bracket | Male | Female |
| Under 5 Years | 0 (0.0%) | 0 (0.0%) |
| 5 to 17 Years | 11 (1.3%) | 0 (0.0%) |
| 18 to 34 Years | 2 (0.1%) | 2 (0.2%) |
| 35 to 64 Years | 76 (4.0%) | 115 (6.5%) |
| 65 to 74 Years | 0 (0.0%) | 35 (6.3%) |
| 75 Years and over | 27 (7.7%) | 150 (31.2%) |
Disability Class: Cognitive Difficulty
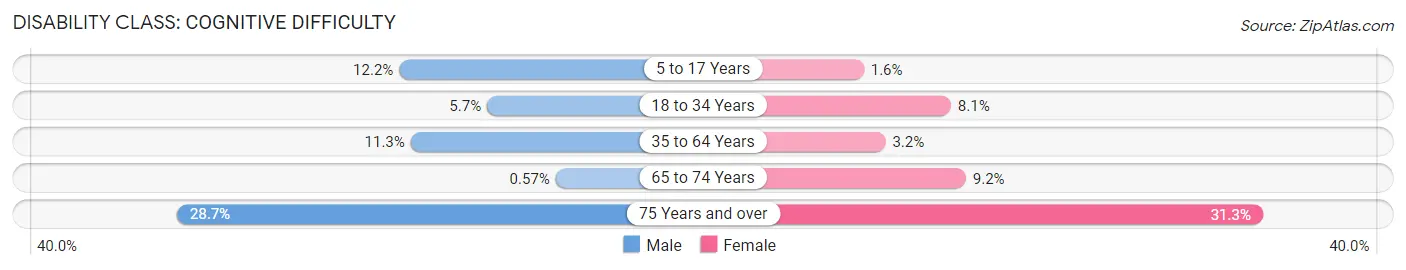
| Age Bracket | Male | Female |
| 5 to 17 Years | 99 (12.2%) | 16 (1.6%) |
| 18 to 34 Years | 84 (5.7%) | 96 (8.1%) |
| 35 to 64 Years | 217 (11.3%) | 57 (3.2%) |
| 65 to 74 Years | 2 (0.6%) | 51 (9.2%) |
| 75 Years and over | 101 (28.7%) | 150 (31.2%) |
Disability Class: Ambulatory Difficulty
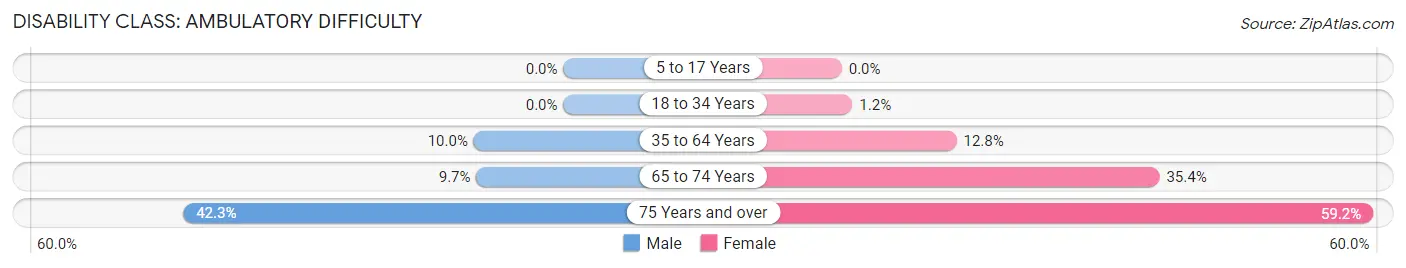
| Age Bracket | Male | Female |
| 5 to 17 Years | 0 (0.0%) | 0 (0.0%) |
| 18 to 34 Years | 0 (0.0%) | 14 (1.2%) |
| 35 to 64 Years | 191 (10.0%) | 225 (12.8%) |
| 65 to 74 Years | 34 (9.7%) | 196 (35.4%) |
| 75 Years and over | 149 (42.3%) | 284 (59.2%) |
Disability Class: Self-Care Difficulty
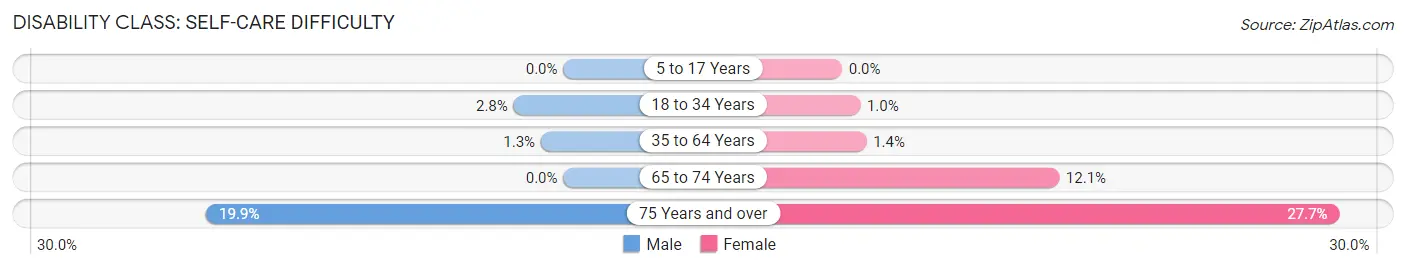
| Age Bracket | Male | Female |
| 5 to 17 Years | 0 (0.0%) | 0 (0.0%) |
| 18 to 34 Years | 41 (2.8%) | 12 (1.0%) |
| 35 to 64 Years | 24 (1.3%) | 24 (1.4%) |
| 65 to 74 Years | 0 (0.0%) | 67 (12.1%) |
| 75 Years and over | 70 (19.9%) | 133 (27.7%) |
Technology Access in Batesville
Computing Device Access in Batesville
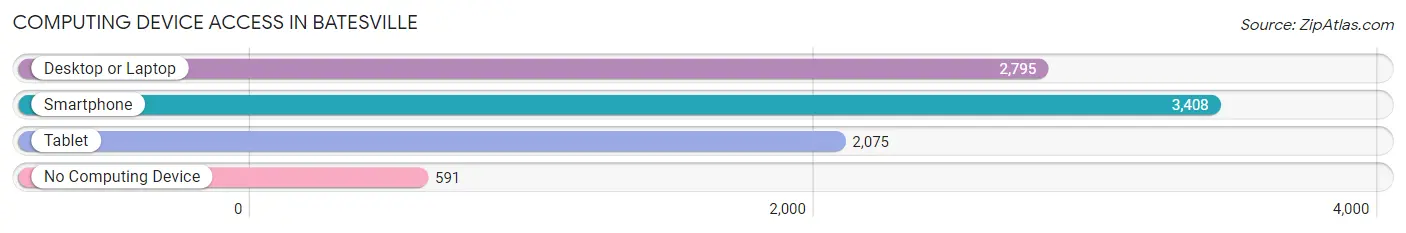
| Device Type | # Households | % Households |
| Desktop or Laptop | 2,795 | 67.4% |
| Smartphone | 3,408 | 82.1% |
| Tablet | 2,075 | 50.0% |
| No Computing Device | 591 | 14.2% |
| Total | 4,149 | 100.0% |
Internet Access in Batesville
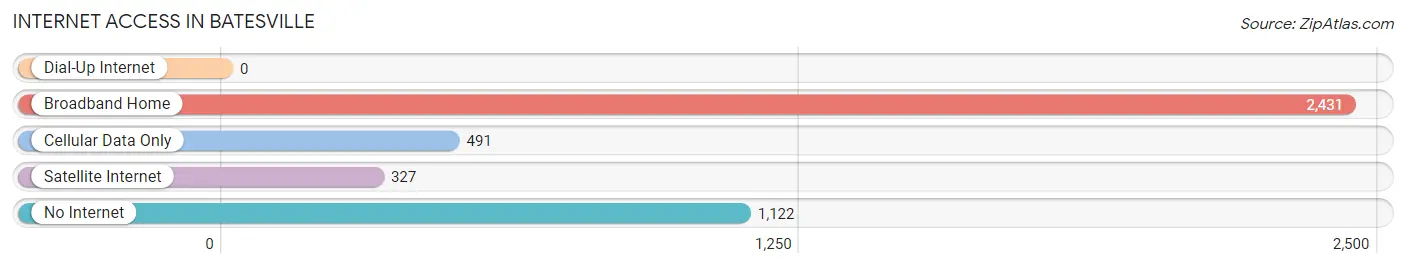
| Internet Type | # Households | % Households |
| Dial-Up Internet | 0 | 0.0% |
| Broadband Home | 2,431 | 58.6% |
| Cellular Data Only | 491 | 11.8% |
| Satellite Internet | 327 | 7.9% |
| No Internet | 1,122 | 27.0% |
| Total | 4,149 | 100.0% |
Batesville Summary
Batesville, Arkansas is a city located in the foothills of the Ozark Mountains in Independence County. It is the county seat and the largest city in the county. The city is located on the White River and is home to a population of approximately 10,000 people.
History
Batesville was founded in 1824 by William Harrison Bates, a settler from Tennessee. The city was named after him and was incorporated in 1836. The city was an important trading post for the surrounding area and was a major stop on the Butterfield Overland Mail route. During the Civil War, the city was the site of a major battle between Union and Confederate forces.
Geography
Batesville is located in the foothills of the Ozark Mountains in Independence County. The city is situated on the White River and is surrounded by rolling hills and forests. The city has a total area of 8.3 square miles, of which 8.2 square miles is land and 0.1 square miles is water.
Economy
Batesville’s economy is largely based on agriculture and manufacturing. The city is home to several large poultry processing plants, as well as a number of smaller businesses. The city is also home to a number of retail stores, restaurants, and other businesses.
Demographics
As of the 2010 census, Batesville had a population of 10,212 people. The racial makeup of the city was 79.2% White, 17.3% African American, 0.4% Native American, 0.7% Asian, 0.1% Pacific Islander, and 2.3% from other races. The median household income was $31,945 and the median family income was $41,945.
Conclusion
Batesville, Arkansas is a city located in the foothills of the Ozark Mountains in Independence County. It is the county seat and the largest city in the county. The city is located on the White River and is home to a population of approximately 10,000 people. The city’s economy is largely based on agriculture and manufacturing, and the city is home to several large poultry processing plants, as well as a number of smaller businesses. As of the 2010 census, Batesville had a population of 10,212 people, with a median household income of $31,945 and a median family income of $41,945.
Common Questions
What is Per Capita Income in Batesville?
Per Capita income in Batesville is $27,445.
What is the Median Family Income in Batesville?
Median Family Income in Batesville is $64,899.
What is the Median Household income in Batesville?
Median Household Income in Batesville is $52,304.
What is Income or Wage Gap in Batesville?
Income or Wage Gap in Batesville is 19.6%.
Women in Batesville earn 80.4 cents for every dollar earned by a man.
What is Inequality or Gini Index in Batesville?
Inequality or Gini Index in Batesville is 0.47.
What is the Total Population of Batesville?
Total Population of Batesville is 11,163.
What is the Total Male Population of Batesville?
Total Male Population of Batesville is 5,528.
What is the Total Female Population of Batesville?
Total Female Population of Batesville is 5,635.
What is the Ratio of Males per 100 Females in Batesville?
There are 98.10 Males per 100 Females in Batesville.
What is the Ratio of Females per 100 Males in Batesville?
There are 101.94 Females per 100 Males in Batesville.
What is the Median Population Age in Batesville?
Median Population Age in Batesville is 35.5 Years.
What is the Average Family Size in Batesville
Average Family Size in Batesville is 3.4 People.
What is the Average Household Size in Batesville
Average Household Size in Batesville is 2.5 People.
How Large is the Labor Force in Batesville?
There are 4,712 People in the Labor Forcein in Batesville.
What is the Percentage of People in the Labor Force in Batesville?
54.7% of People are in the Labor Force in Batesville.
What is the Unemployment Rate in Batesville?
Unemployment Rate in Batesville is 5.1%.