Midway, AR Map & Demographics
Midway Map
Midway Overview
$28,307
PER CAPITA INCOME
$82,500
AVG FAMILY INCOME
$76,161
AVG HOUSEHOLD INCOME
11.7%
WAGE / INCOME GAP [ % ]
88.3¢/ $1
WAGE / INCOME GAP [ $ ]
0.36
INEQUALITY / GINI INDEX
754
TOTAL POPULATION
444
MALE POPULATION
310
FEMALE POPULATION
143.23
MALES / 100 FEMALES
69.82
FEMALES / 100 MALES
43.3
MEDIAN AGE
3.5
AVG FAMILY SIZE
3.2
AVG HOUSEHOLD SIZE
426
LABOR FORCE [ PEOPLE ]
62.3%
PERCENT IN LABOR FORCE
Midway Zip Codes
Midway Area Codes
Income in Midway
Income Overview in Midway
Per Capita Income in Midway is $28,307, while median incomes of families and households are $82,500 and $76,161 respectively.
| Characteristic | Number | Measure |
| Per Capita Income | 754 | $28,307 |
| Median Family Income | 190 | $82,500 |
| Mean Family Income | 190 | $98,191 |
| Median Household Income | 234 | $76,161 |
| Mean Household Income | 234 | $88,097 |
| Income Deficit | 190 | $0 |
| Wage / Income Gap (%) | 754 | 11.70% |
| Wage / Income Gap ($) | 754 | 88.30¢ per $1 |
| Gini / Inequality Index | 754 | 0.36 |
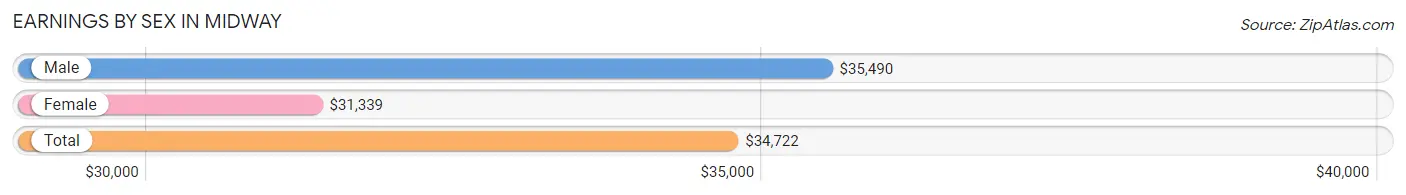
Earnings by Sex in Midway
Average Earnings in Midway are $34,722, $35,490 for men and $31,339 for women, a difference of 11.7%.
| Sex | Number | Average Earnings |
| Male | 306 (65.9%) | $35,490 |
| Female | 158 (34.1%) | $31,339 |
| Total | 464 (100.0%) | $34,722 |
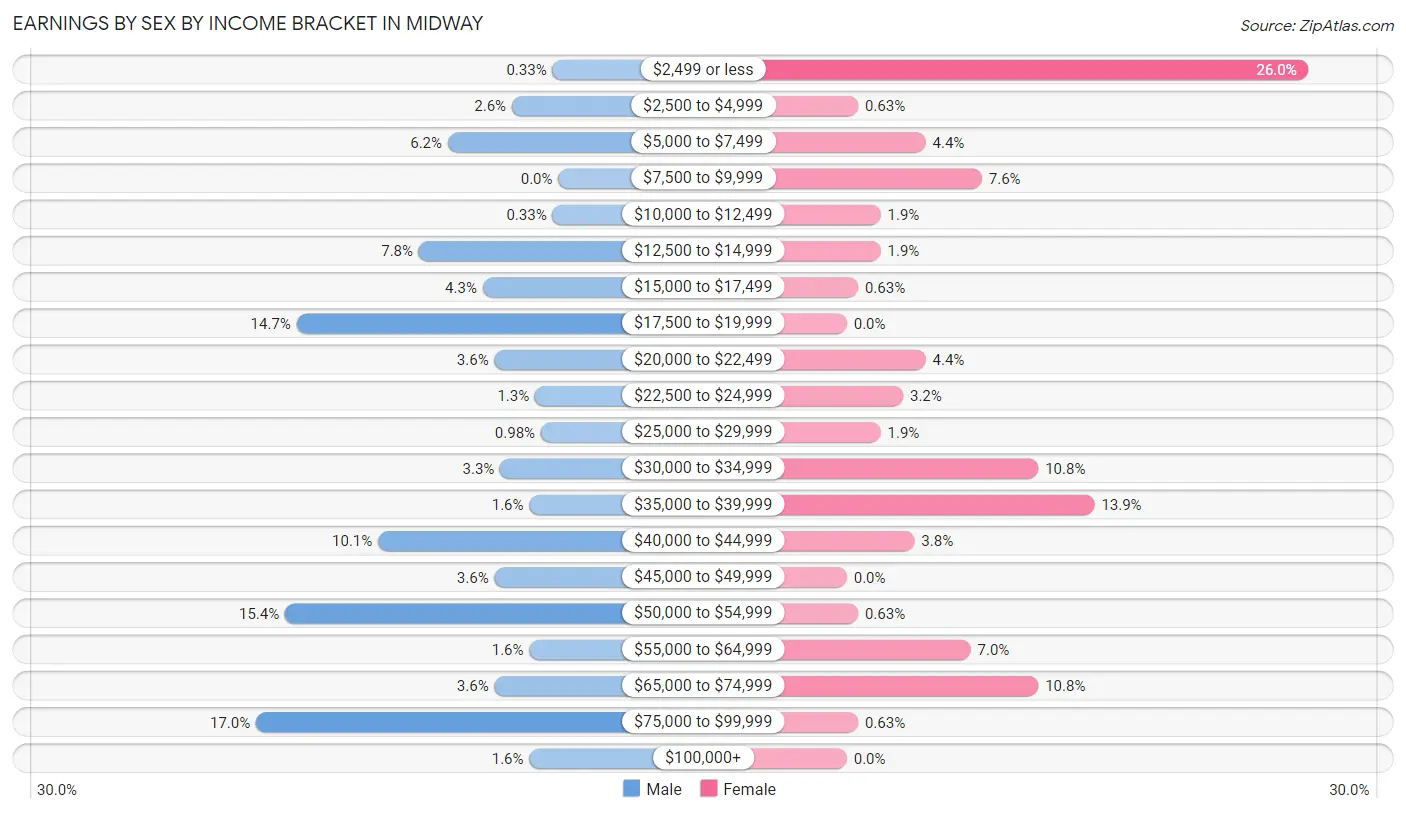
Earnings by Sex by Income Bracket in Midway
The most common earnings brackets in Midway are $75,000 to $99,999 for men (52 | 17.0%) and $2,499 or less for women (41 | 26.0%).
| Income | Male | Female |
| $2,499 or less | 1 (0.3%) | 41 (26.0%) |
| $2,500 to $4,999 | 8 (2.6%) | 1 (0.6%) |
| $5,000 to $7,499 | 19 (6.2%) | 7 (4.4%) |
| $7,500 to $9,999 | 0 (0.0%) | 12 (7.6%) |
| $10,000 to $12,499 | 1 (0.3%) | 3 (1.9%) |
| $12,500 to $14,999 | 24 (7.8%) | 3 (1.9%) |
| $15,000 to $17,499 | 13 (4.3%) | 1 (0.6%) |
| $17,500 to $19,999 | 45 (14.7%) | 0 (0.0%) |
| $20,000 to $22,499 | 11 (3.6%) | 7 (4.4%) |
| $22,500 to $24,999 | 4 (1.3%) | 5 (3.2%) |
| $25,000 to $29,999 | 3 (1.0%) | 3 (1.9%) |
| $30,000 to $34,999 | 10 (3.3%) | 17 (10.8%) |
| $35,000 to $39,999 | 5 (1.6%) | 22 (13.9%) |
| $40,000 to $44,999 | 31 (10.1%) | 6 (3.8%) |
| $45,000 to $49,999 | 11 (3.6%) | 0 (0.0%) |
| $50,000 to $54,999 | 47 (15.4%) | 1 (0.6%) |
| $55,000 to $64,999 | 5 (1.6%) | 11 (7.0%) |
| $65,000 to $74,999 | 11 (3.6%) | 17 (10.8%) |
| $75,000 to $99,999 | 52 (17.0%) | 1 (0.6%) |
| $100,000+ | 5 (1.6%) | 0 (0.0%) |
| Total | 306 (100.0%) | 158 (100.0%) |
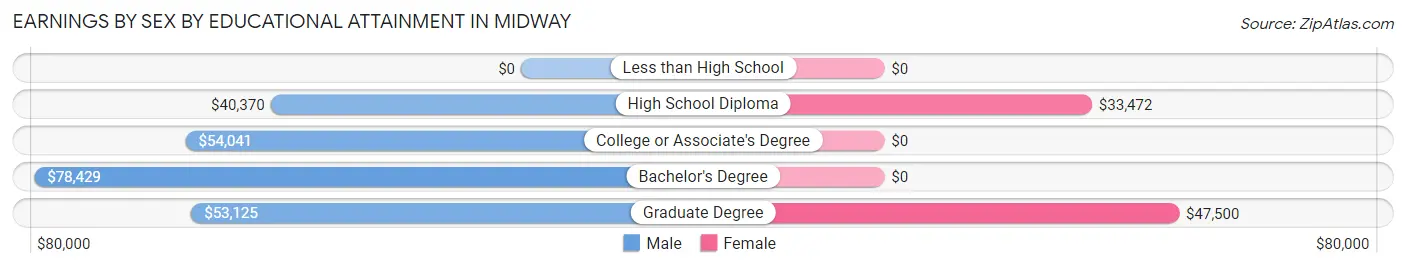
Earnings by Sex by Educational Attainment in Midway
Average earnings in Midway are $53,112 for men and $31,250 for women, a difference of 41.2%. Men with an educational attainment of bachelor's degree enjoy the highest average annual earnings of $78,429, while those with high school diploma education earn the least with $40,370. Women with an educational attainment of graduate degree earn the most with the average annual earnings of $47,500, while those with high school diploma education have the smallest earnings of $33,472.
| Educational Attainment | Male Income | Female Income |
| Less than High School | - | - |
| High School Diploma | $40,370 | $33,472 |
| College or Associate's Degree | $54,041 | $0 |
| Bachelor's Degree | $78,429 | $0 |
| Graduate Degree | $53,125 | $47,500 |
| Total | $53,112 | $31,250 |
Family Income in Midway
Family Income Brackets in Midway
According to the Midway family income data, there are 44 families falling into the $150,000 to $199,999 income range, which is the most common income bracket and makes up 23.2% of all families.
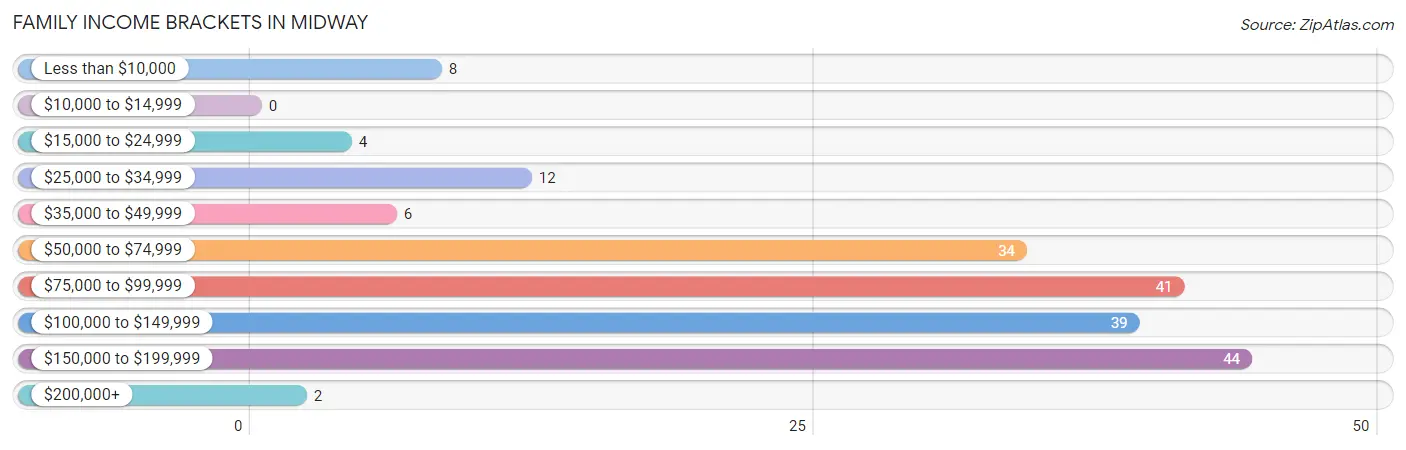
| Income Bracket | # Families | % Families |
| Less than $10,000 | 8 | 4.2% |
| $10,000 to $14,999 | 0 | 0.0% |
| $15,000 to $24,999 | 4 | 2.1% |
| $25,000 to $34,999 | 12 | 6.3% |
| $35,000 to $49,999 | 6 | 3.2% |
| $50,000 to $74,999 | 34 | 17.9% |
| $75,000 to $99,999 | 41 | 21.6% |
| $100,000 to $149,999 | 39 | 20.5% |
| $150,000 to $199,999 | 44 | 23.2% |
| $200,000+ | 2 | 1.1% |
Family Income by Famaliy Size in Midway
4-person families (20 | 10.5%) account for the highest median family income in Midway with $112,500 per family, while 2-person families (67 | 35.3%) have the highest median income of $37,940 per family member.
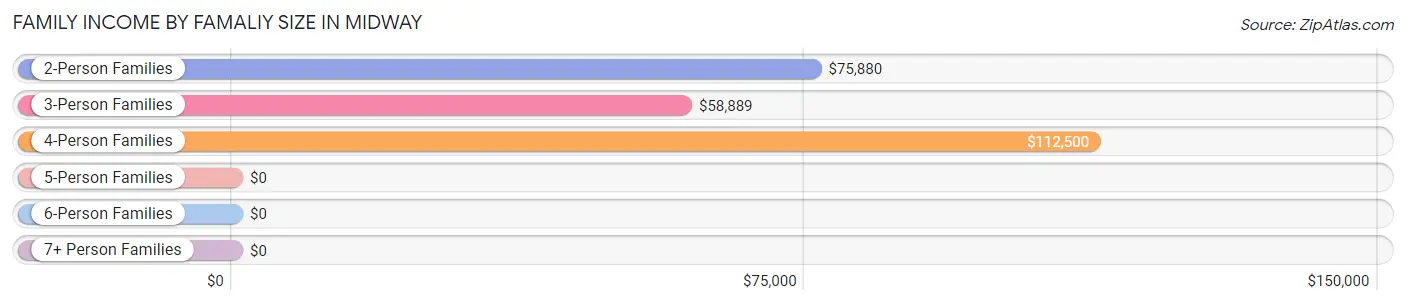
| Income Bracket | # Families | Median Income |
| 2-Person Families | 67 (35.3%) | $75,880 |
| 3-Person Families | 56 (29.5%) | $58,889 |
| 4-Person Families | 20 (10.5%) | $112,500 |
| 5-Person Families | 45 (23.7%) | $0 |
| 6-Person Families | 0 (0.0%) | $0 |
| 7+ Person Families | 2 (1.1%) | $0 |
| Total | 190 (100.0%) | $82,500 |
Family Income by Number of Earners in Midway
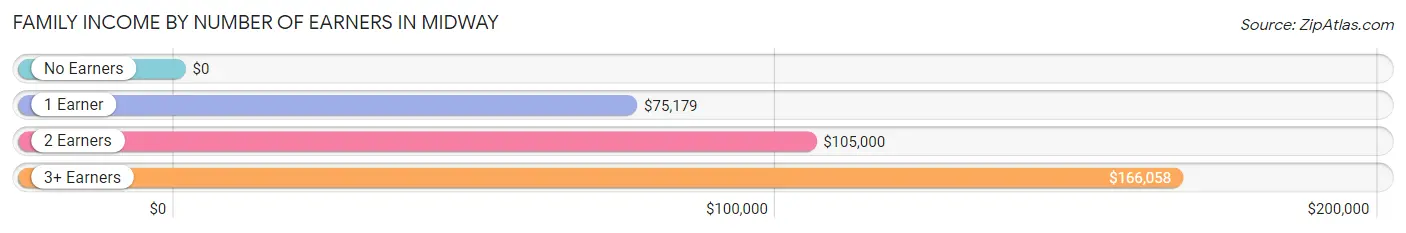
| Number of Earners | # Families | Median Income |
| No Earners | 9 (4.7%) | $0 |
| 1 Earner | 60 (31.6%) | $75,179 |
| 2 Earners | 70 (36.8%) | $105,000 |
| 3+ Earners | 51 (26.8%) | $166,058 |
| Total | 190 (100.0%) | $82,500 |
Household Income in Midway
Household Income Brackets in Midway
With 48 households falling in the category, the $150,000 to $199,999 income range is the most frequent in Midway, accounting for 20.5% of all households. In contrast, only 3 households (1.3%) fall into the $200,000+ income bracket, making it the least populous group.
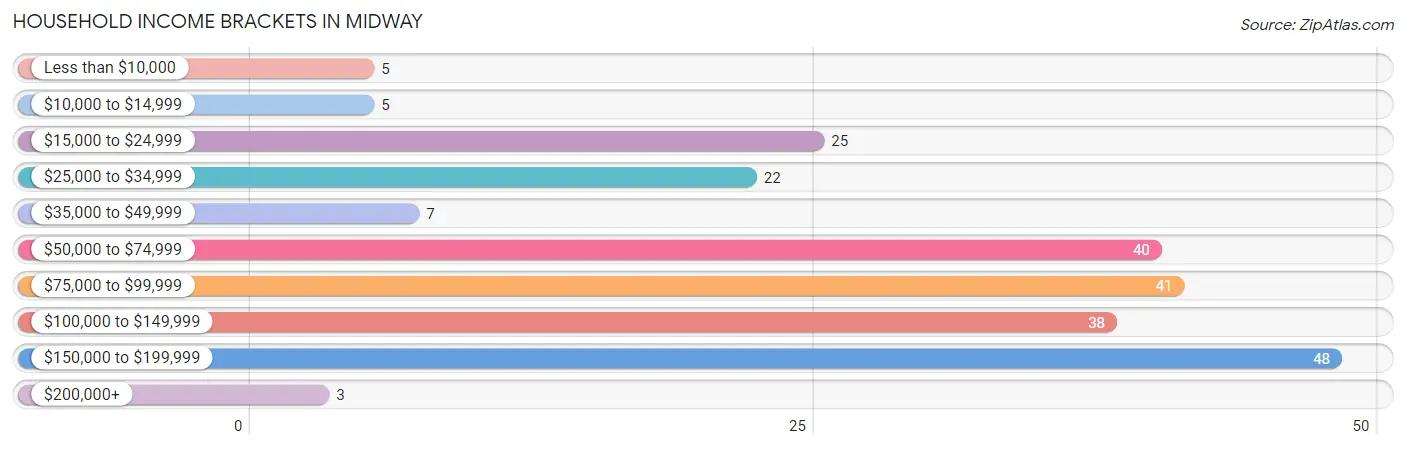
| Income Bracket | # Households | % Households |
| Less than $10,000 | 5 | 2.1% |
| $10,000 to $14,999 | 5 | 2.1% |
| $15,000 to $24,999 | 25 | 10.7% |
| $25,000 to $34,999 | 22 | 9.4% |
| $35,000 to $49,999 | 7 | 3.0% |
| $50,000 to $74,999 | 40 | 17.1% |
| $75,000 to $99,999 | 41 | 17.5% |
| $100,000 to $149,999 | 38 | 16.2% |
| $150,000 to $199,999 | 48 | 20.5% |
| $200,000+ | 3 | 1.3% |
Household Income by Householder Age in Midway
The median household income in Midway is $76,161, with the highest median household income of $156,250 found in the 45 to 64 years age bracket for the primary householder. A total of 92 households (39.3%) fall into this category.
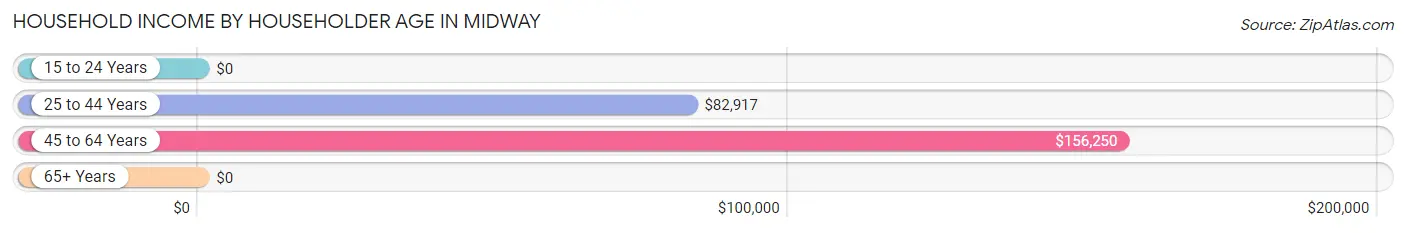
| Income Bracket | # Households | Median Income |
| 15 to 24 Years | 0 (0.0%) | $0 |
| 25 to 44 Years | 67 (28.6%) | $82,917 |
| 45 to 64 Years | 92 (39.3%) | $156,250 |
| 65+ Years | 75 (32.1%) | $0 |
| Total | 234 (100.0%) | $76,161 |
Poverty in Midway
Income Below Poverty by Sex and Age in Midway
With 7.4% poverty level for males and 10.3% for females among the residents of Midway, 35 to 44 year old males and under 5 year old females are the most vulnerable to poverty, with 23 males (31.1%) and 6 females (60.0%) in their respective age groups living below the poverty level.
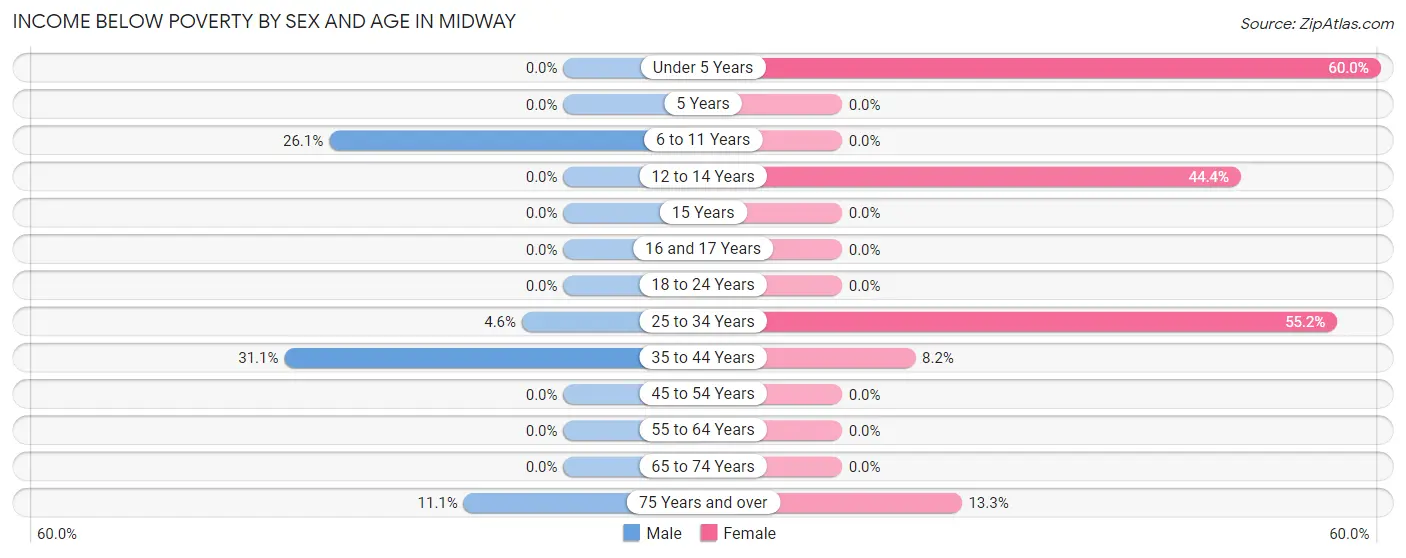
| Age Bracket | Male | Female |
| Under 5 Years | 0 (0.0%) | 6 (60.0%) |
| 5 Years | 0 (0.0%) | 0 (0.0%) |
| 6 to 11 Years | 6 (26.1%) | 0 (0.0%) |
| 12 to 14 Years | 0 (0.0%) | 4 (44.4%) |
| 15 Years | 0 (0.0%) | 0 (0.0%) |
| 16 and 17 Years | 0 (0.0%) | 0 (0.0%) |
| 18 to 24 Years | 0 (0.0%) | 0 (0.0%) |
| 25 to 34 Years | 3 (4.6%) | 16 (55.2%) |
| 35 to 44 Years | 23 (31.1%) | 4 (8.2%) |
| 45 to 54 Years | 0 (0.0%) | 0 (0.0%) |
| 55 to 64 Years | 0 (0.0%) | 0 (0.0%) |
| 65 to 74 Years | 0 (0.0%) | 0 (0.0%) |
| 75 Years and over | 1 (11.1%) | 2 (13.3%) |
| Total | 33 (7.4%) | 32 (10.3%) |
Income Above Poverty by Sex and Age in Midway
According to the poverty statistics in Midway, males aged 12 to 14 years and females aged 5 years are the age groups that are most secure financially, with 100.0% of males and 100.0% of females in these age groups living above the poverty line.
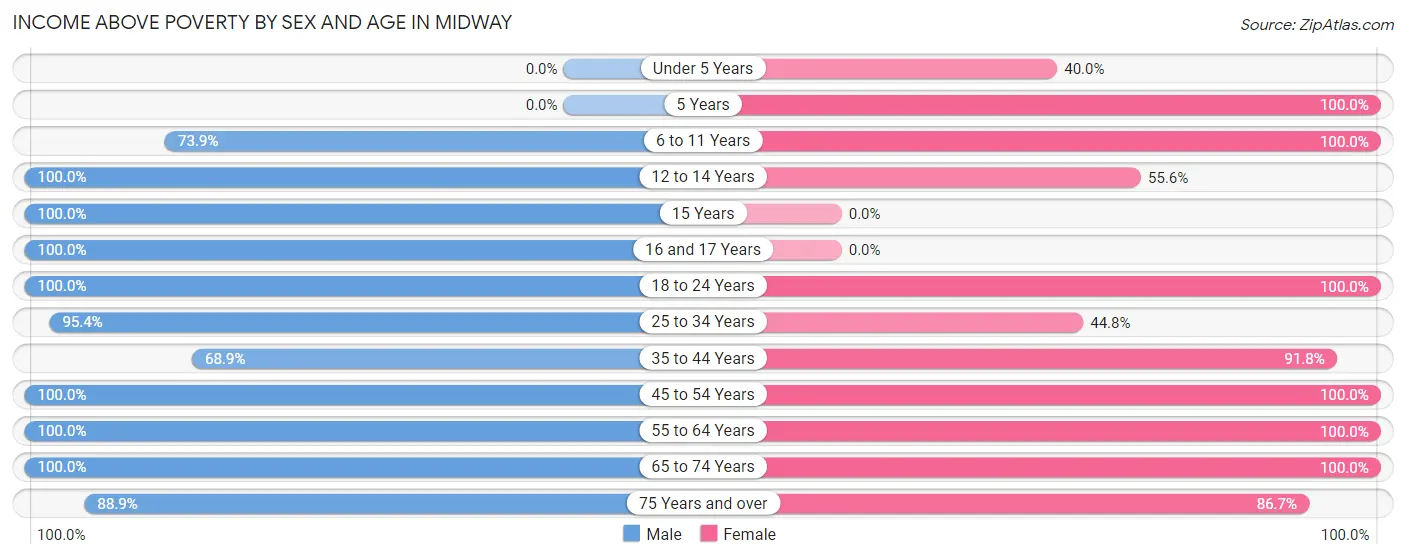
| Age Bracket | Male | Female |
| Under 5 Years | 0 (0.0%) | 4 (40.0%) |
| 5 Years | 0 (0.0%) | 2 (100.0%) |
| 6 to 11 Years | 17 (73.9%) | 13 (100.0%) |
| 12 to 14 Years | 12 (100.0%) | 5 (55.6%) |
| 15 Years | 1 (100.0%) | 0 (0.0%) |
| 16 and 17 Years | 24 (100.0%) | 0 (0.0%) |
| 18 to 24 Years | 90 (100.0%) | 17 (100.0%) |
| 25 to 34 Years | 62 (95.4%) | 13 (44.8%) |
| 35 to 44 Years | 51 (68.9%) | 45 (91.8%) |
| 45 to 54 Years | 71 (100.0%) | 48 (100.0%) |
| 55 to 64 Years | 35 (100.0%) | 36 (100.0%) |
| 65 to 74 Years | 40 (100.0%) | 82 (100.0%) |
| 75 Years and over | 8 (88.9%) | 13 (86.7%) |
| Total | 411 (92.6%) | 278 (89.7%) |
Income Below Poverty Among Married-Couple Families in Midway
The poverty statistics for married-couple families in Midway show that 1.9% or 3 of the total 155 families live below the poverty line. Families with 1 or 2 children have the highest poverty rate of 4.6%, comprising of 3 families. On the other hand, families with no children have the lowest poverty rate of 0.0%, which includes 0 families.
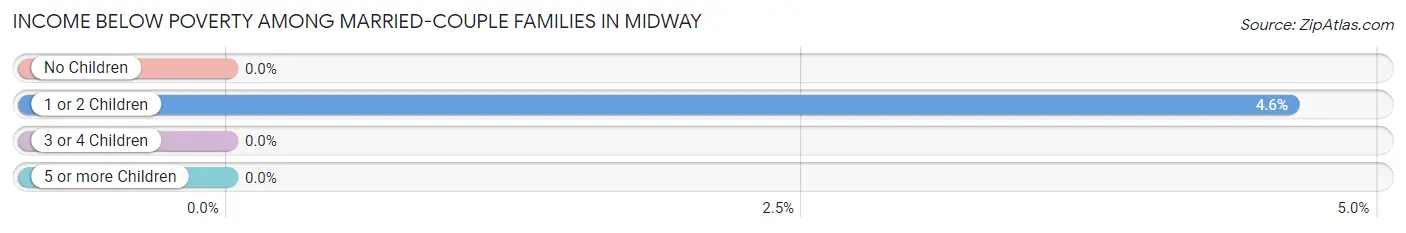
| Children | Above Poverty | Below Poverty |
| No Children | 84 (100.0%) | 0 (0.0%) |
| 1 or 2 Children | 62 (95.4%) | 3 (4.6%) |
| 3 or 4 Children | 6 (100.0%) | 0 (0.0%) |
| 5 or more Children | 0 (0.0%) | 0 (0.0%) |
| Total | 152 (98.1%) | 3 (1.9%) |
Income Below Poverty Among Single-Parent Households in Midway
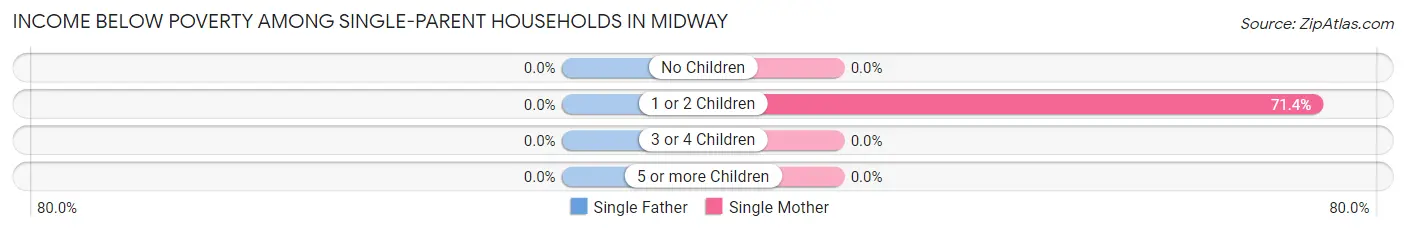
| Children | Single Father | Single Mother |
| No Children | 0 (0.0%) | 0 (0.0%) |
| 1 or 2 Children | 0 (0.0%) | 5 (71.4%) |
| 3 or 4 Children | 0 (0.0%) | 0 (0.0%) |
| 5 or more Children | 0 (0.0%) | 0 (0.0%) |
| Total | 0 (0.0%) | 5 (17.2%) |
Income Below Poverty Among Married-Couple vs Single-Parent Households in Midway
The poverty data for Midway shows that 3 of the married-couple family households (1.9%) and 5 of the single-parent households (14.3%) are living below the poverty level. Within the married-couple family households, those with 1 or 2 children have the highest poverty rate, with 3 households (4.6%) falling below the poverty line. Among the single-parent households, those with 1 or 2 children have the highest poverty rate, with 5 household (55.6%) living below poverty.
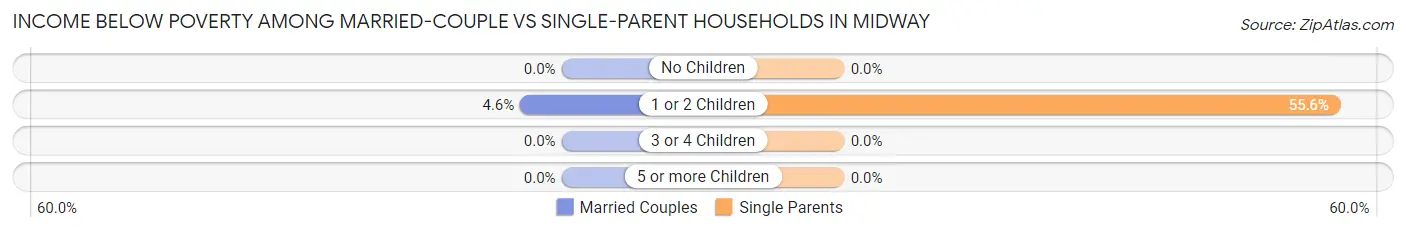
| Children | Married-Couple Families | Single-Parent Households |
| No Children | 0 (0.0%) | 0 (0.0%) |
| 1 or 2 Children | 3 (4.6%) | 5 (55.6%) |
| 3 or 4 Children | 0 (0.0%) | 0 (0.0%) |
| 5 or more Children | 0 (0.0%) | 0 (0.0%) |
| Total | 3 (1.9%) | 5 (14.3%) |
Race in Midway
The most populous races in Midway are White / Caucasian (747 | 99.1%), Two or more Races (6 | 0.8%), and Asian (1 | 0.1%).
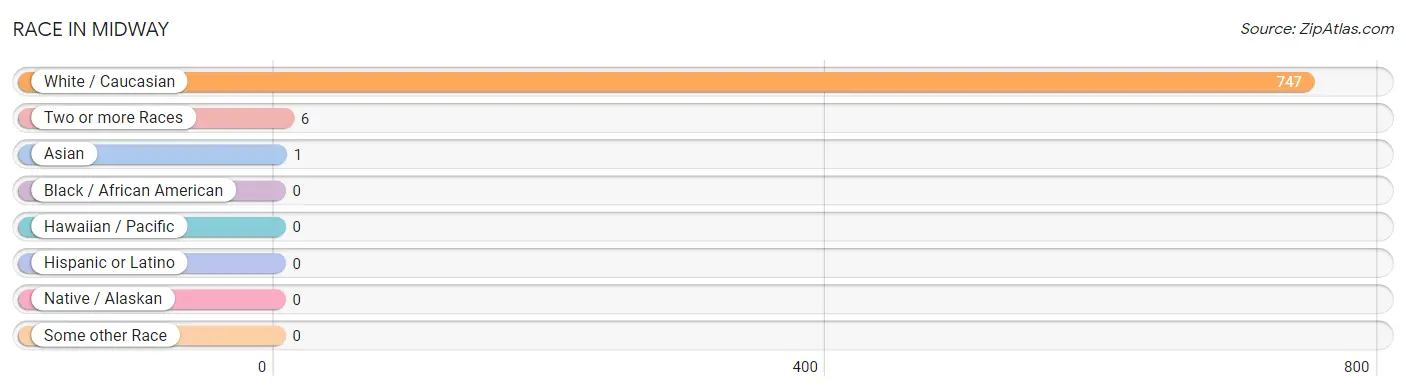
| Race | # Population | % Population |
| Asian | 1 | 0.1% |
| Black / African American | 0 | 0.0% |
| Hawaiian / Pacific | 0 | 0.0% |
| Hispanic or Latino | 0 | 0.0% |
| Native / Alaskan | 0 | 0.0% |
| White / Caucasian | 747 | 99.1% |
| Two or more Races | 6 | 0.8% |
| Some other Race | 0 | 0.0% |
| Total | 754 | 100.0% |
Ancestry in Midway
The most populous ancestries reported in Midway are German (36 | 4.8%), American (33 | 4.4%), English (29 | 3.8%), Irish (27 | 3.6%), and Scotch-Irish (14 | 1.9%), together accounting for 18.4% of all Midway residents.
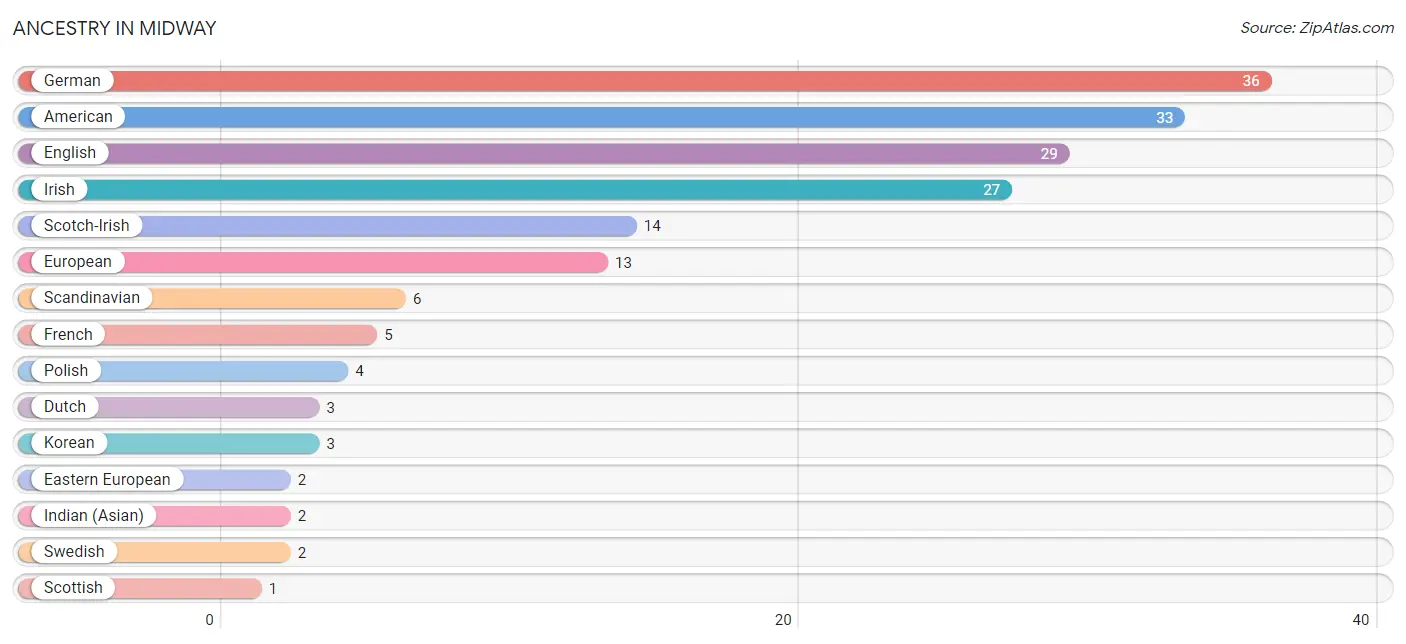
| Ancestry | # Population | % Population |
| American | 33 | 4.4% |
| Dutch | 3 | 0.4% |
| Eastern European | 2 | 0.3% |
| English | 29 | 3.8% |
| European | 13 | 1.7% |
| French | 5 | 0.7% |
| German | 36 | 4.8% |
| Indian (Asian) | 2 | 0.3% |
| Irish | 27 | 3.6% |
| Korean | 3 | 0.4% |
| Polish | 4 | 0.5% |
| Scandinavian | 6 | 0.8% |
| Scotch-Irish | 14 | 1.9% |
| Scottish | 1 | 0.1% |
| Swedish | 2 | 0.3% |
| Welsh | 1 | 0.1% | View All 16 Rows |
Immigrants in Midway
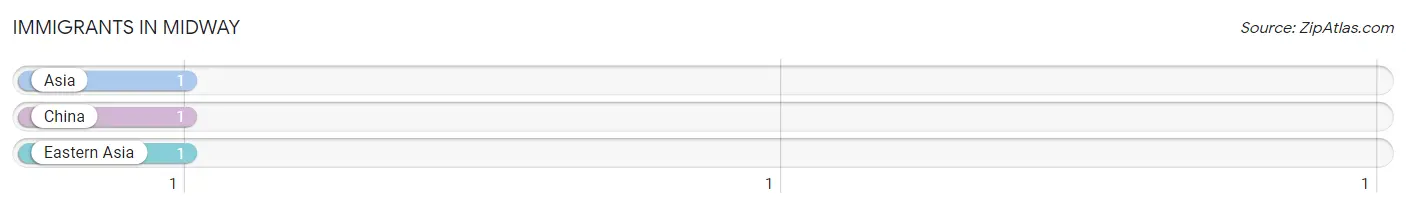
The most numerous immigrant groups reported in Midway came from Asia (1 | 0.1%), China (1 | 0.1%), and Eastern Asia (1 | 0.1%), together accounting for 0.4% of all Midway residents.
| Immigration Origin | # Population | % Population |
| Asia | 1 | 0.1% |
| China | 1 | 0.1% |
| Eastern Asia | 1 | 0.1% | View All 3 Rows |
Sex and Age in Midway
Sex and Age in Midway
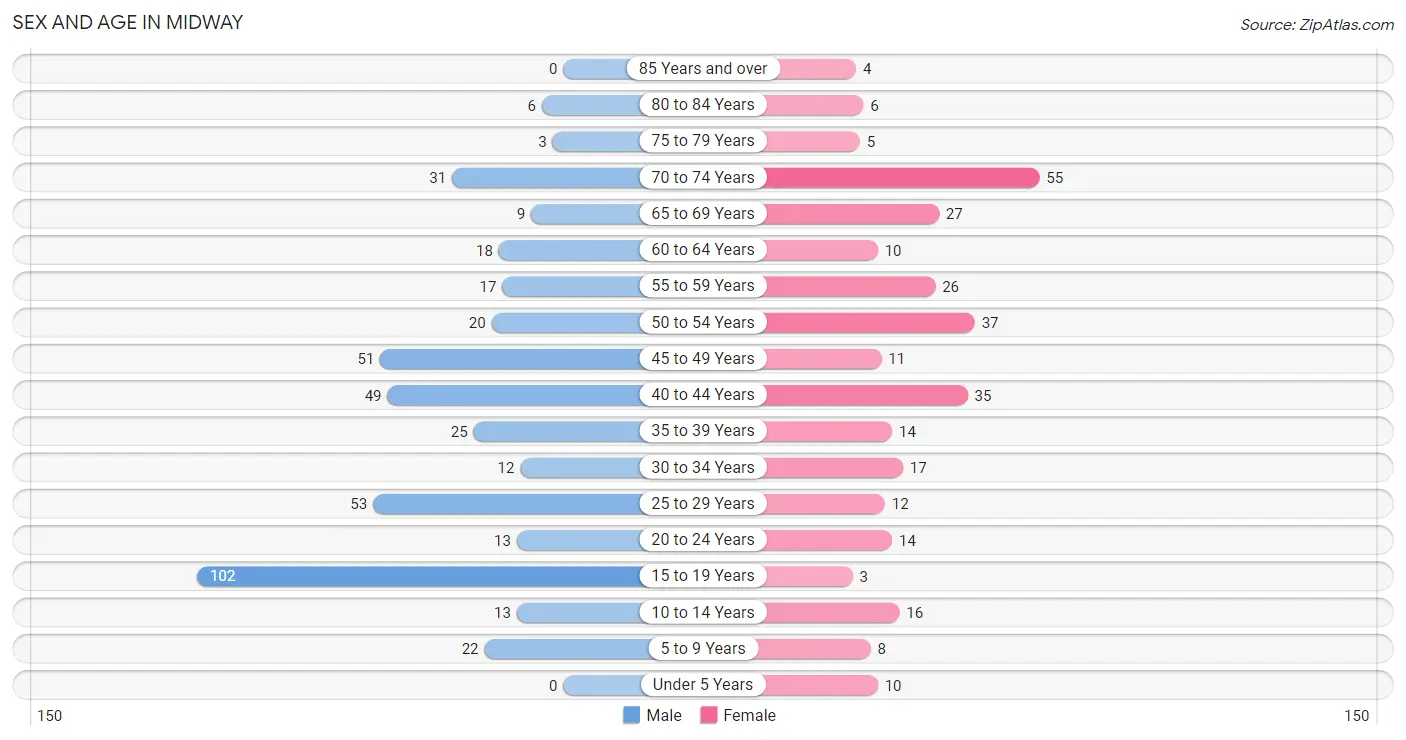
The most populous age groups in Midway are 15 to 19 Years (102 | 23.0%) for men and 70 to 74 Years (55 | 17.7%) for women.
| Age Bracket | Male | Female |
| Under 5 Years | 0 (0.0%) | 10 (3.2%) |
| 5 to 9 Years | 22 (5.0%) | 8 (2.6%) |
| 10 to 14 Years | 13 (2.9%) | 16 (5.2%) |
| 15 to 19 Years | 102 (23.0%) | 3 (1.0%) |
| 20 to 24 Years | 13 (2.9%) | 14 (4.5%) |
| 25 to 29 Years | 53 (11.9%) | 12 (3.9%) |
| 30 to 34 Years | 12 (2.7%) | 17 (5.5%) |
| 35 to 39 Years | 25 (5.6%) | 14 (4.5%) |
| 40 to 44 Years | 49 (11.0%) | 35 (11.3%) |
| 45 to 49 Years | 51 (11.5%) | 11 (3.5%) |
| 50 to 54 Years | 20 (4.5%) | 37 (11.9%) |
| 55 to 59 Years | 17 (3.8%) | 26 (8.4%) |
| 60 to 64 Years | 18 (4.1%) | 10 (3.2%) |
| 65 to 69 Years | 9 (2.0%) | 27 (8.7%) |
| 70 to 74 Years | 31 (7.0%) | 55 (17.7%) |
| 75 to 79 Years | 3 (0.7%) | 5 (1.6%) |
| 80 to 84 Years | 6 (1.3%) | 6 (1.9%) |
| 85 Years and over | 0 (0.0%) | 4 (1.3%) |
| Total | 444 (100.0%) | 310 (100.0%) |
Families and Households in Midway
Median Family Size in Midway
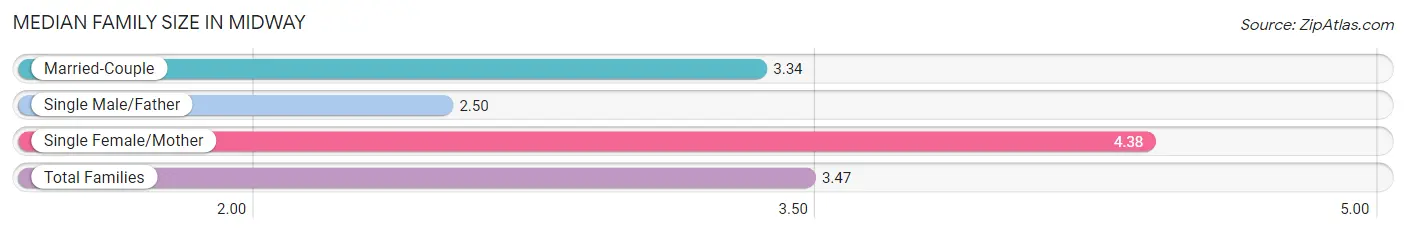
The median family size in Midway is 3.47 persons per family, with single female/mother families (29 | 15.3%) accounting for the largest median family size of 4.38 persons per family. On the other hand, single male/father families (6 | 3.2%) represent the smallest median family size with 2.50 persons per family.
| Family Type | # Families | Family Size |
| Married-Couple | 155 (81.6%) | 3.34 |
| Single Male/Father | 6 (3.2%) | 2.50 |
| Single Female/Mother | 29 (15.3%) | 4.38 |
| Total Families | 190 (100.0%) | 3.47 |
Median Household Size in Midway
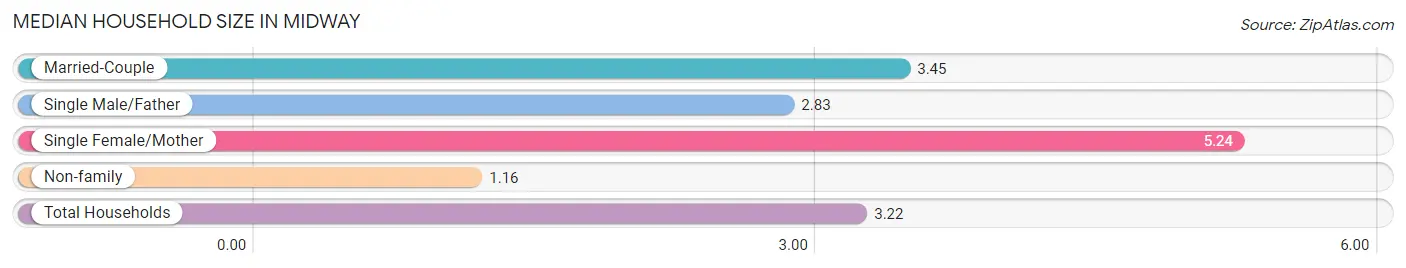
The median household size in Midway is 3.22 persons per household, with single female/mother households (29 | 12.4%) accounting for the largest median household size of 5.24 persons per household. non-family households (44 | 18.8%) represent the smallest median household size with 1.16 persons per household.
| Household Type | # Households | Household Size |
| Married-Couple | 155 (66.2%) | 3.45 |
| Single Male/Father | 6 (2.6%) | 2.83 |
| Single Female/Mother | 29 (12.4%) | 5.24 |
| Non-family | 44 (18.8%) | 1.16 |
| Total Households | 234 (100.0%) | 3.22 |
Household Size by Marriage Status in Midway
Out of a total of 234 households in Midway, 190 (81.2%) are family households, while 44 (18.8%) are nonfamily households. The most numerous type of family households are 2-person households, comprising 63, and the most common type of nonfamily households are 1-person households, comprising 40.
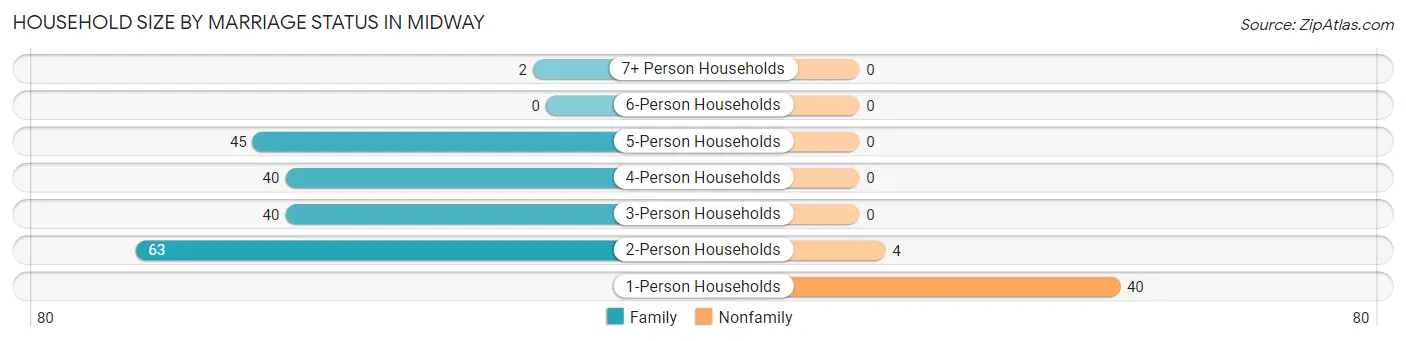
| Household Size | Family Households | Nonfamily Households |
| 1-Person Households | - | 40 (17.1%) |
| 2-Person Households | 63 (26.9%) | 4 (1.7%) |
| 3-Person Households | 40 (17.1%) | 0 (0.0%) |
| 4-Person Households | 40 (17.1%) | 0 (0.0%) |
| 5-Person Households | 45 (19.2%) | 0 (0.0%) |
| 6-Person Households | 0 (0.0%) | 0 (0.0%) |
| 7+ Person Households | 2 (0.9%) | 0 (0.0%) |
| Total | 190 (81.2%) | 44 (18.8%) |
Female Fertility in Midway
Fertility by Age in Midway
| Age Bracket | Women with Births | Births / 1,000 Women |
| 15 to 19 years | 0 (0.0%) | 0.0 |
| 20 to 34 years | 0 (0.0%) | 0.0 |
| 35 to 50 years | 0 (0.0%) | 0.0 |
| Total | 0 (0.0%) | 0.0 |
Fertility by Age by Marriage Status in Midway
| Age Bracket | Married | Unmarried |
| 15 to 19 years | 0 (0.0%) | 0 (0.0%) |
| 20 to 34 years | 0 (0.0%) | 0 (0.0%) |
| 35 to 50 years | 0 (0.0%) | 0 (0.0%) |
| Total | 0 (0.0%) | 0 (0.0%) |
Fertility by Education in Midway
| Educational Attainment | Women with Births | Births / 1,000 Women |
| Less than High School | 0 (0.0%) | 0.0 |
| High School Diploma | 0 (0.0%) | 0.0 |
| College or Associate's Degree | 0 (0.0%) | 0.0 |
| Bachelor's Degree | 0 (0.0%) | 0.0 |
| Graduate Degree | 0 (0.0%) | 0.0 |
| Total | 0 (0.0%) | 0.0 |
Fertility by Education by Marriage Status in Midway
| Educational Attainment | Married | Unmarried |
| Less than High School | 0 (0.0%) | 0 (0.0%) |
| High School Diploma | 0 (0.0%) | 0 (0.0%) |
| College or Associate's Degree | 0 (0.0%) | 0 (0.0%) |
| Bachelor's Degree | 0 (0.0%) | 0 (0.0%) |
| Graduate Degree | 0 (0.0%) | 0 (0.0%) |
| Total | 0 (0.0%) | 0 (0.0%) |
Employment Characteristics in Midway
Employment by Class of Employer in Midway
Among the 416 employed individuals in Midway, private company employees (326 | 78.4%), state government employees (47 | 11.3%), and local government employees (25 | 6.0%) make up the most common classes of employment.
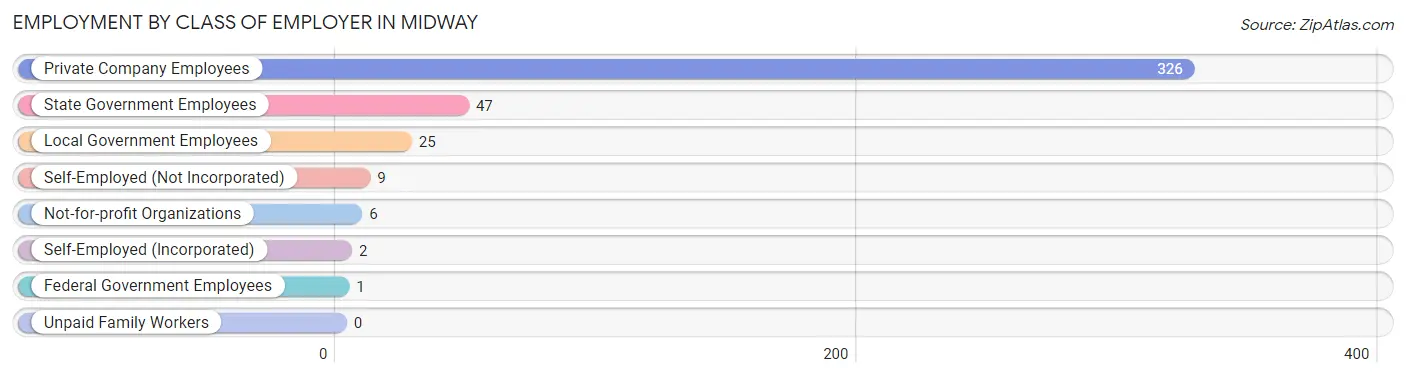
| Employer Class | # Employees | % Employees |
| Private Company Employees | 326 | 78.4% |
| Self-Employed (Incorporated) | 2 | 0.5% |
| Self-Employed (Not Incorporated) | 9 | 2.2% |
| Not-for-profit Organizations | 6 | 1.4% |
| Local Government Employees | 25 | 6.0% |
| State Government Employees | 47 | 11.3% |
| Federal Government Employees | 1 | 0.2% |
| Unpaid Family Workers | 0 | 0.0% |
| Total | 416 | 100.0% |
Employment Status by Age in Midway
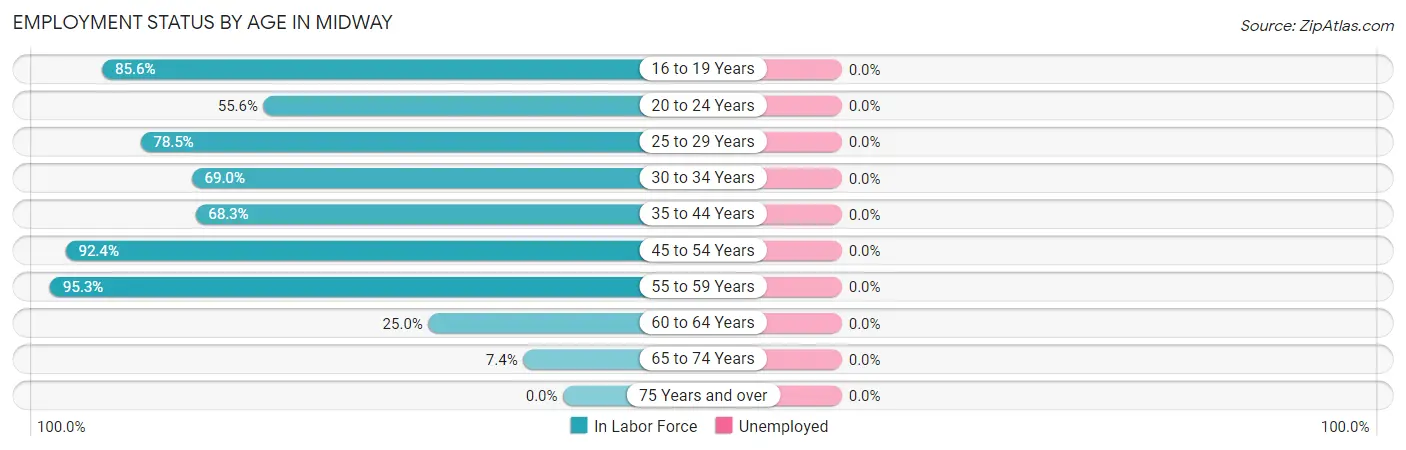
| Age Bracket | In Labor Force | Unemployed |
| 16 to 19 Years | 89 (85.6%) | 0 (0.0%) |
| 20 to 24 Years | 15 (55.6%) | 0 (0.0%) |
| 25 to 29 Years | 51 (78.5%) | 0 (0.0%) |
| 30 to 34 Years | 20 (69.0%) | 0 (0.0%) |
| 35 to 44 Years | 84 (68.3%) | 0 (0.0%) |
| 45 to 54 Years | 110 (92.4%) | 0 (0.0%) |
| 55 to 59 Years | 41 (95.3%) | 0 (0.0%) |
| 60 to 64 Years | 7 (25.0%) | 0 (0.0%) |
| 65 to 74 Years | 9 (7.4%) | 0 (0.0%) |
| 75 Years and over | 0 (0.0%) | 0 (0.0%) |
| Total | 426 (62.3%) | 0 (0.0%) |
Employment Status by Educational Attainment in Midway
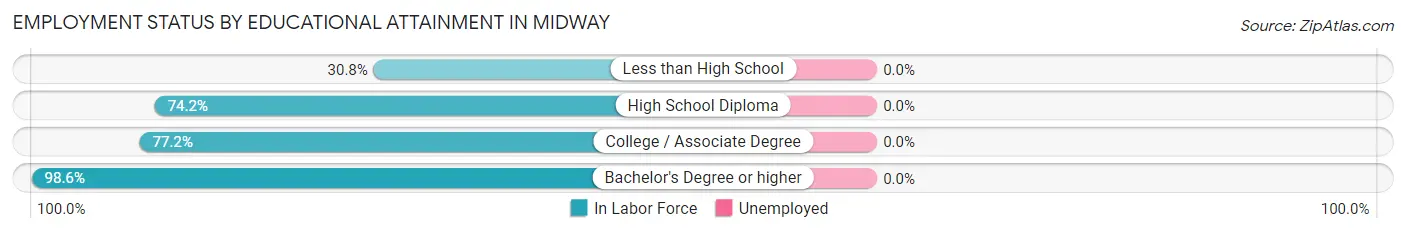
| Educational Attainment | In Labor Force | Unemployed |
| Less than High School | 8 (30.8%) | 0 (0.0%) |
| High School Diploma | 98 (74.2%) | 0 (0.0%) |
| College / Associate Degree | 139 (77.2%) | 0 (0.0%) |
| Bachelor's Degree or higher | 68 (98.6%) | 0 (0.0%) |
| Total | 313 (76.9%) | 0 (0.0%) |
Employment Occupations by Sex in Midway
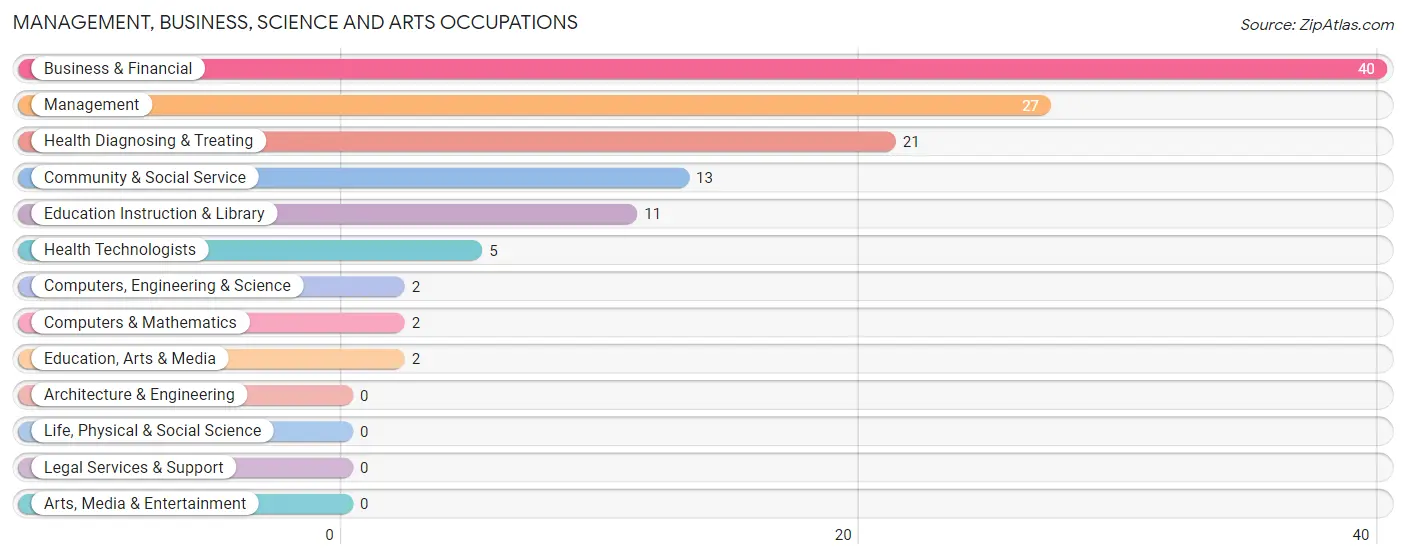
Management, Business, Science and Arts Occupations
The most common Management, Business, Science and Arts occupations in Midway are Business & Financial (40 | 9.4%), Management (27 | 6.3%), Health Diagnosing & Treating (21 | 4.9%), Community & Social Service (13 | 3.0%), and Education Instruction & Library (11 | 2.6%).
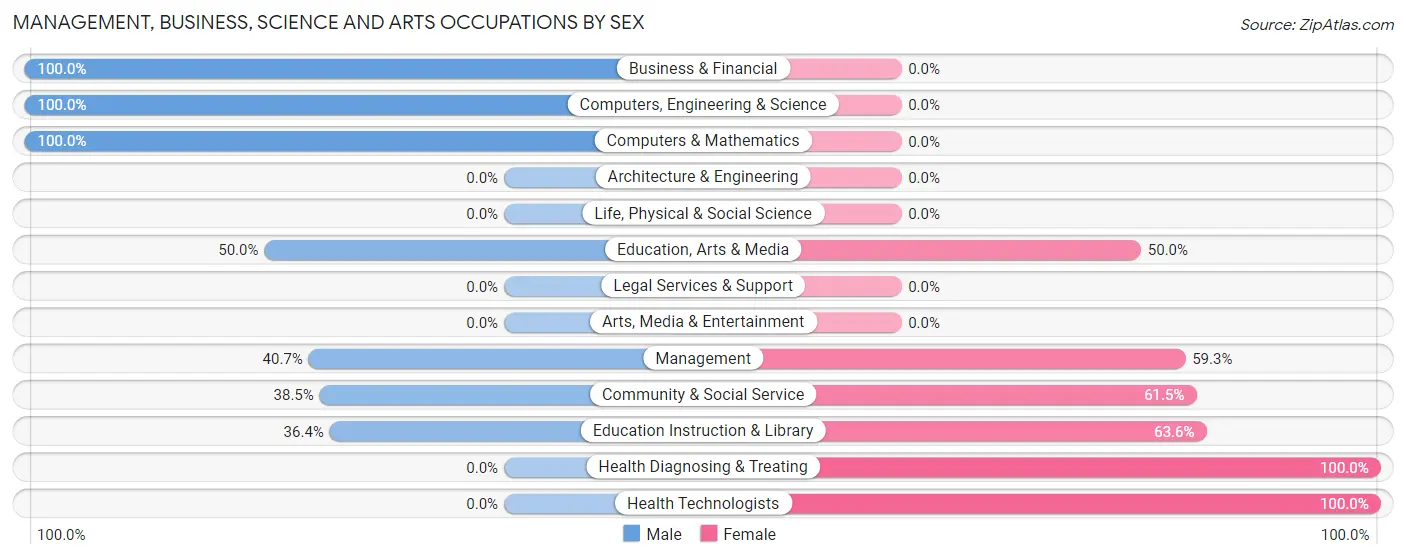
Management, Business, Science and Arts Occupations by Sex
Within the Management, Business, Science and Arts occupations in Midway, the most male-oriented occupations are Business & Financial (100.0%), Computers, Engineering & Science (100.0%), and Computers & Mathematics (100.0%), while the most female-oriented occupations are Health Diagnosing & Treating (100.0%), Health Technologists (100.0%), and Education Instruction & Library (63.6%).
| Occupation | Male | Female |
| Management | 11 (40.7%) | 16 (59.3%) |
| Business & Financial | 40 (100.0%) | 0 (0.0%) |
| Computers, Engineering & Science | 2 (100.0%) | 0 (0.0%) |
| Computers & Mathematics | 2 (100.0%) | 0 (0.0%) |
| Architecture & Engineering | 0 (0.0%) | 0 (0.0%) |
| Life, Physical & Social Science | 0 (0.0%) | 0 (0.0%) |
| Community & Social Service | 5 (38.5%) | 8 (61.5%) |
| Education, Arts & Media | 1 (50.0%) | 1 (50.0%) |
| Legal Services & Support | 0 (0.0%) | 0 (0.0%) |
| Education Instruction & Library | 4 (36.4%) | 7 (63.6%) |
| Arts, Media & Entertainment | 0 (0.0%) | 0 (0.0%) |
| Health Diagnosing & Treating | 0 (0.0%) | 21 (100.0%) |
| Health Technologists | 0 (0.0%) | 5 (100.0%) |
| Total (Category) | 58 (56.3%) | 45 (43.7%) |
| Total (Overall) | 280 (65.7%) | 146 (34.3%) |
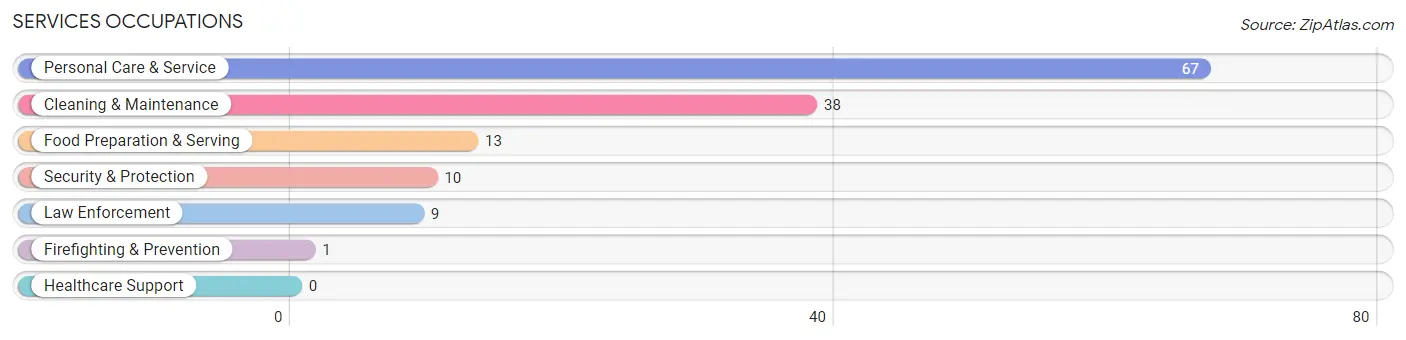
Services Occupations
The most common Services occupations in Midway are Personal Care & Service (67 | 15.7%), Cleaning & Maintenance (38 | 8.9%), Food Preparation & Serving (13 | 3.0%), Security & Protection (10 | 2.4%), and Law Enforcement (9 | 2.1%).
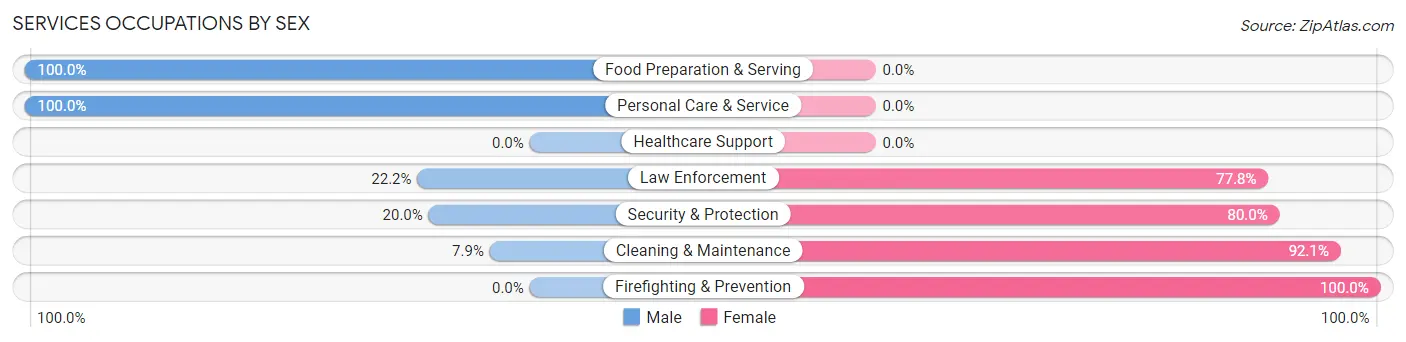
Services Occupations by Sex
Within the Services occupations in Midway, the most male-oriented occupations are Food Preparation & Serving (100.0%), Personal Care & Service (100.0%), and Law Enforcement (22.2%), while the most female-oriented occupations are Firefighting & Prevention (100.0%), Cleaning & Maintenance (92.1%), and Security & Protection (80.0%).
| Occupation | Male | Female |
| Healthcare Support | 0 (0.0%) | 0 (0.0%) |
| Security & Protection | 2 (20.0%) | 8 (80.0%) |
| Firefighting & Prevention | 0 (0.0%) | 1 (100.0%) |
| Law Enforcement | 2 (22.2%) | 7 (77.8%) |
| Food Preparation & Serving | 13 (100.0%) | 0 (0.0%) |
| Cleaning & Maintenance | 3 (7.9%) | 35 (92.1%) |
| Personal Care & Service | 67 (100.0%) | 0 (0.0%) |
| Total (Category) | 85 (66.4%) | 43 (33.6%) |
| Total (Overall) | 280 (65.7%) | 146 (34.3%) |
Sales and Office Occupations
The most common Sales and Office occupations in Midway are Office & Administration (46 | 10.8%), and Sales & Related (17 | 4.0%).

Sales and Office Occupations by Sex

| Occupation | Male | Female |
| Sales & Related | 9 (52.9%) | 8 (47.1%) |
| Office & Administration | 6 (13.0%) | 40 (87.0%) |
| Total (Category) | 15 (23.8%) | 48 (76.2%) |
| Total (Overall) | 280 (65.7%) | 146 (34.3%) |
Natural Resources, Construction and Maintenance Occupations
The most common Natural Resources, Construction and Maintenance occupations in Midway are Installation, Maintenance & Repair (14 | 3.3%), Construction & Extraction (12 | 2.8%), and Farming, Fishing & Forestry (2 | 0.5%).

Natural Resources, Construction and Maintenance Occupations by Sex

| Occupation | Male | Female |
| Farming, Fishing & Forestry | 2 (100.0%) | 0 (0.0%) |
| Construction & Extraction | 5 (41.7%) | 7 (58.3%) |
| Installation, Maintenance & Repair | 13 (92.9%) | 1 (7.1%) |
| Total (Category) | 20 (71.4%) | 8 (28.6%) |
| Total (Overall) | 280 (65.7%) | 146 (34.3%) |
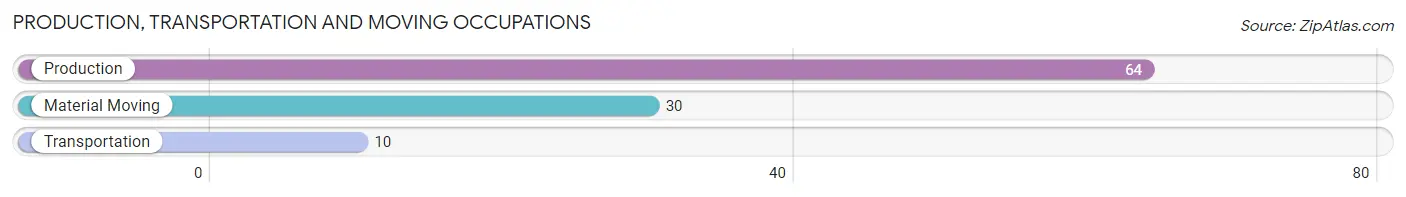
Production, Transportation and Moving Occupations
The most common Production, Transportation and Moving occupations in Midway are Production (64 | 15.0%), Material Moving (30 | 7.0%), and Transportation (10 | 2.4%).
Production, Transportation and Moving Occupations by Sex
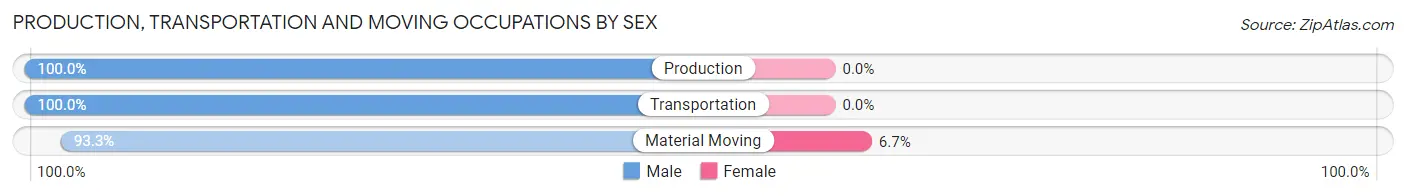
| Occupation | Male | Female |
| Production | 64 (100.0%) | 0 (0.0%) |
| Transportation | 10 (100.0%) | 0 (0.0%) |
| Material Moving | 28 (93.3%) | 2 (6.7%) |
| Total (Category) | 102 (98.1%) | 2 (1.9%) |
| Total (Overall) | 280 (65.7%) | 146 (34.3%) |
Employment Industries by Sex in Midway
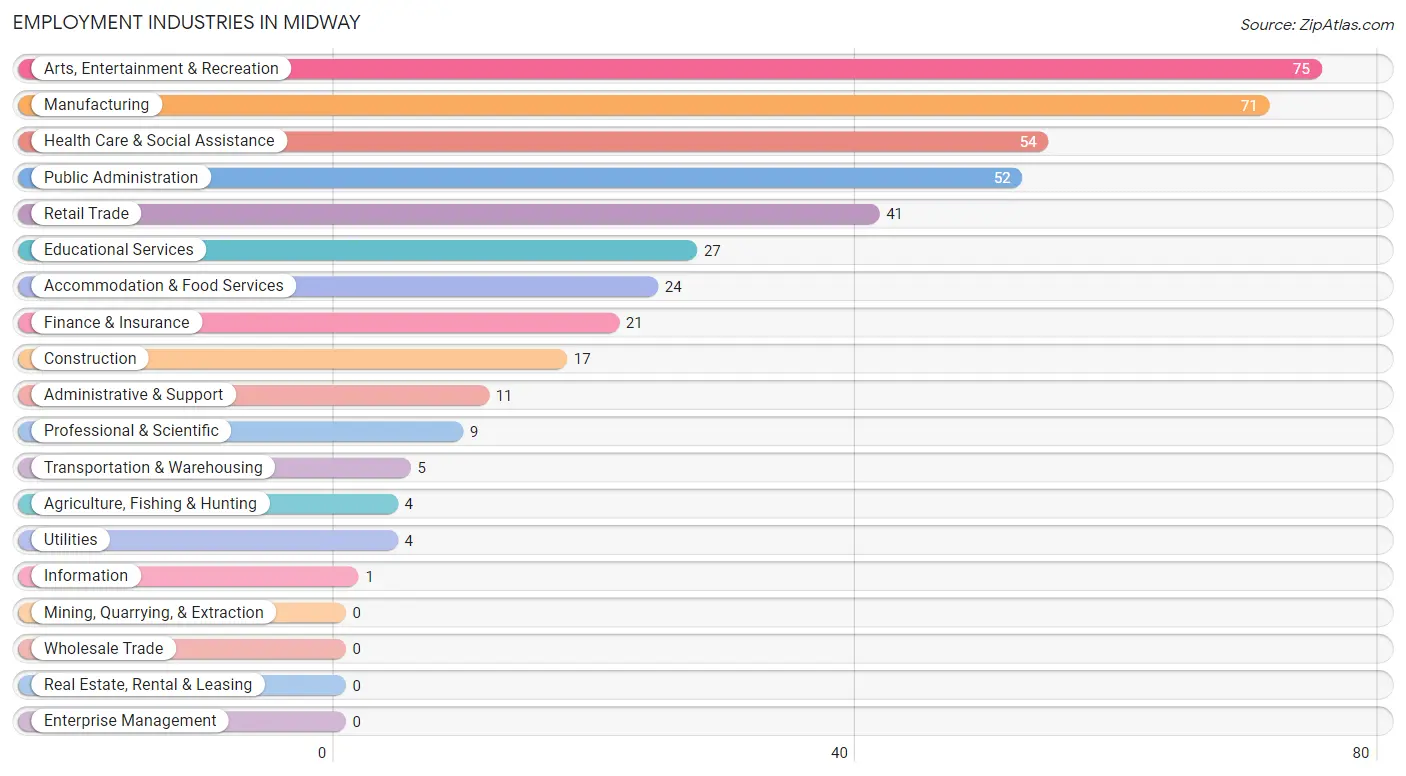
Employment Industries in Midway
The major employment industries in Midway include Arts, Entertainment & Recreation (75 | 17.6%), Manufacturing (71 | 16.7%), Health Care & Social Assistance (54 | 12.7%), Public Administration (52 | 12.2%), and Retail Trade (41 | 9.6%).
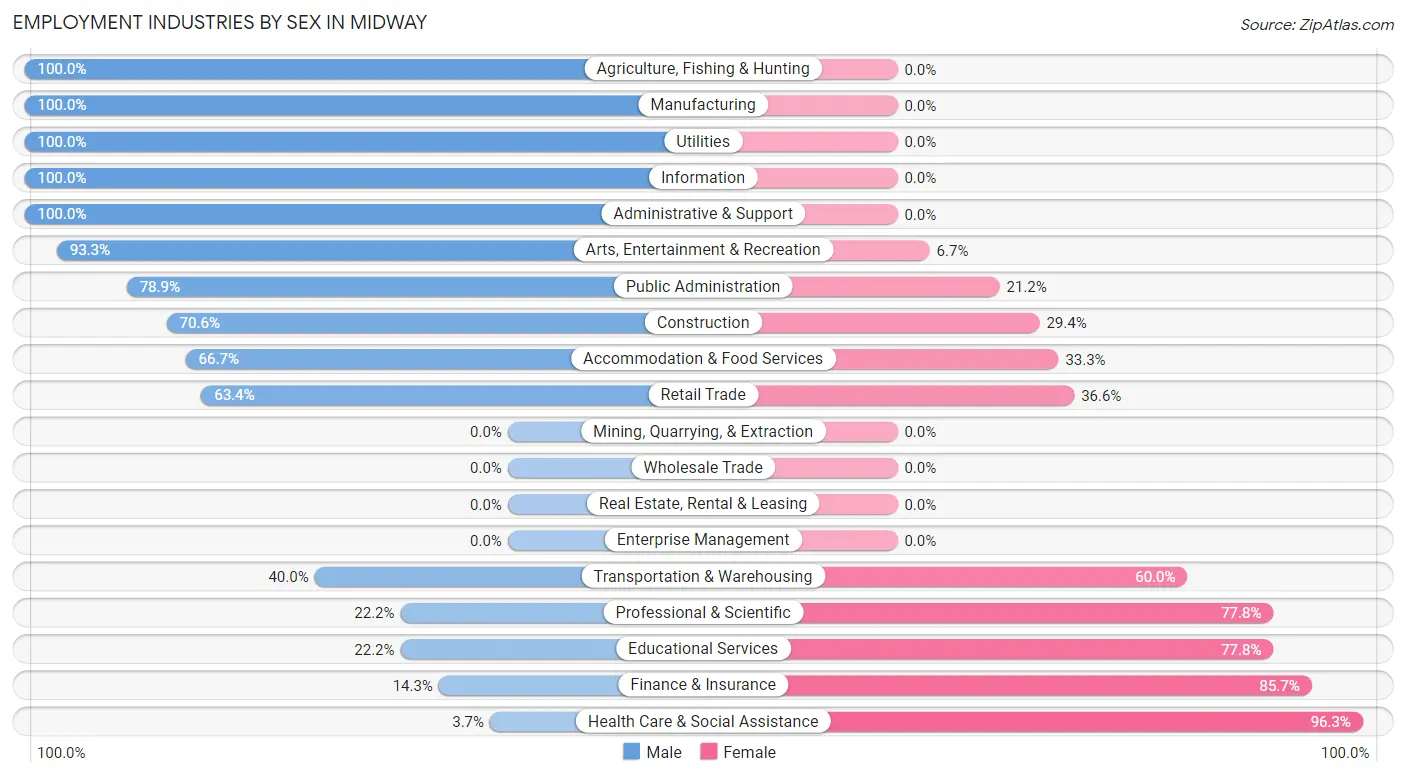
Employment Industries by Sex in Midway
The Midway industries that see more men than women are Agriculture, Fishing & Hunting (100.0%), Manufacturing (100.0%), and Utilities (100.0%), whereas the industries that tend to have a higher number of women are Health Care & Social Assistance (96.3%), Finance & Insurance (85.7%), and Professional & Scientific (77.8%).
| Industry | Male | Female |
| Agriculture, Fishing & Hunting | 4 (100.0%) | 0 (0.0%) |
| Mining, Quarrying, & Extraction | 0 (0.0%) | 0 (0.0%) |
| Construction | 12 (70.6%) | 5 (29.4%) |
| Manufacturing | 71 (100.0%) | 0 (0.0%) |
| Wholesale Trade | 0 (0.0%) | 0 (0.0%) |
| Retail Trade | 26 (63.4%) | 15 (36.6%) |
| Transportation & Warehousing | 2 (40.0%) | 3 (60.0%) |
| Utilities | 4 (100.0%) | 0 (0.0%) |
| Information | 1 (100.0%) | 0 (0.0%) |
| Finance & Insurance | 3 (14.3%) | 18 (85.7%) |
| Real Estate, Rental & Leasing | 0 (0.0%) | 0 (0.0%) |
| Professional & Scientific | 2 (22.2%) | 7 (77.8%) |
| Enterprise Management | 0 (0.0%) | 0 (0.0%) |
| Administrative & Support | 11 (100.0%) | 0 (0.0%) |
| Educational Services | 6 (22.2%) | 21 (77.8%) |
| Health Care & Social Assistance | 2 (3.7%) | 52 (96.3%) |
| Arts, Entertainment & Recreation | 70 (93.3%) | 5 (6.7%) |
| Accommodation & Food Services | 16 (66.7%) | 8 (33.3%) |
| Public Administration | 41 (78.8%) | 11 (21.1%) |
| Total | 280 (65.7%) | 146 (34.3%) |
Education in Midway
School Enrollment in Midway
The most common levels of schooling among the 187 students in Midway are college / undergraduate (64 | 34.2%), high school (60 | 32.1%), and elementary school (28 | 15.0%).
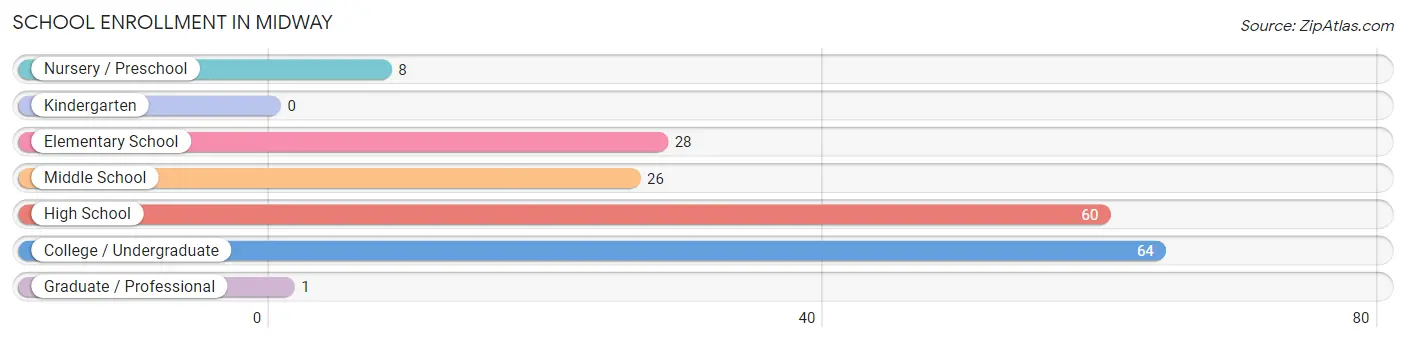
| School Level | # Students | % Students |
| Nursery / Preschool | 8 | 4.3% |
| Kindergarten | 0 | 0.0% |
| Elementary School | 28 | 15.0% |
| Middle School | 26 | 13.9% |
| High School | 60 | 32.1% |
| College / Undergraduate | 64 | 34.2% |
| Graduate / Professional | 1 | 0.5% |
| Total | 187 | 100.0% |
School Enrollment by Age by Funding Source in Midway
Out of a total of 187 students who are enrolled in schools in Midway, 3 (1.6%) attend a private institution, while the remaining 184 (98.4%) are enrolled in public schools. The age group of 35 years and over has the highest likelihood of being enrolled in private schools, with 3 (100.0% in the age bracket) enrolled. Conversely, the age group of 3 to 4 year olds has the lowest likelihood of being enrolled in a private school, with 6 (100.0% in the age bracket) attending a public institution.
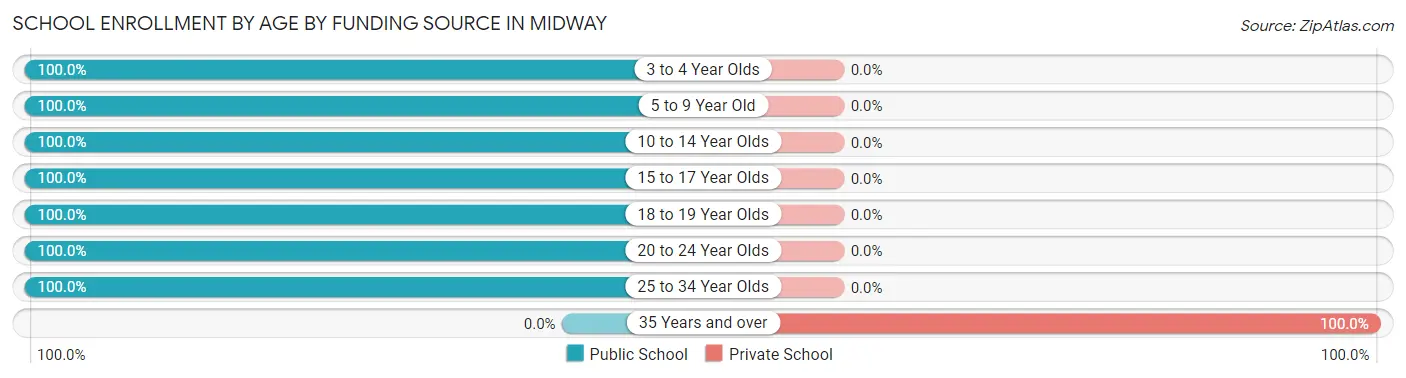
| Age Bracket | Public School | Private School |
| 3 to 4 Year Olds | 6 (100.0%) | 0 (0.0%) |
| 5 to 9 Year Old | 30 (100.0%) | 0 (0.0%) |
| 10 to 14 Year Olds | 29 (100.0%) | 0 (0.0%) |
| 15 to 17 Year Olds | 25 (100.0%) | 0 (0.0%) |
| 18 to 19 Year Olds | 79 (100.0%) | 0 (0.0%) |
| 20 to 24 Year Olds | 14 (100.0%) | 0 (0.0%) |
| 25 to 34 Year Olds | 1 (100.0%) | 0 (0.0%) |
| 35 Years and over | 0 (0.0%) | 3 (100.0%) |
| Total | 184 (98.4%) | 3 (1.6%) |
Educational Attainment by Field of Study in Midway
Business (46 | 56.1%), bio, nature & agricultural (8 | 9.8%), education (6 | 7.3%), visual & performing arts (5 | 6.1%), and science & technology (4 | 4.9%) are the most common fields of study among 82 individuals in Midway who have obtained a bachelor's degree or higher.
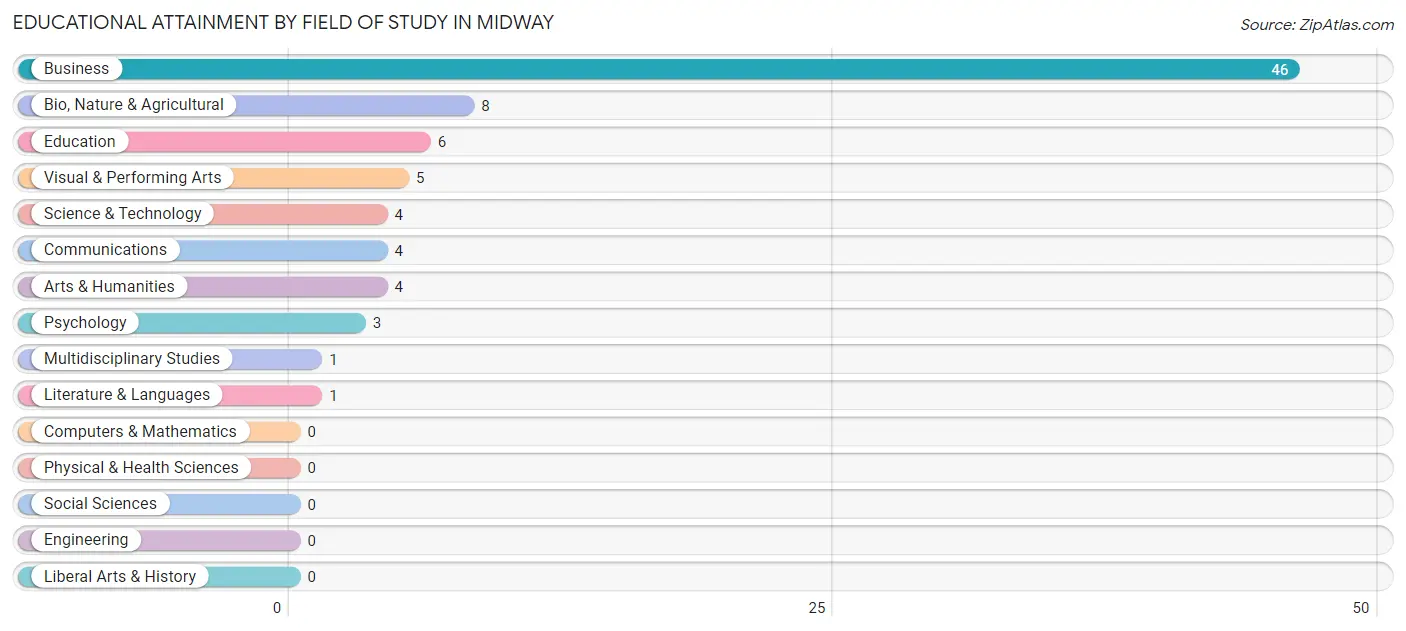
| Field of Study | # Graduates | % Graduates |
| Computers & Mathematics | 0 | 0.0% |
| Bio, Nature & Agricultural | 8 | 9.8% |
| Physical & Health Sciences | 0 | 0.0% |
| Psychology | 3 | 3.7% |
| Social Sciences | 0 | 0.0% |
| Engineering | 0 | 0.0% |
| Multidisciplinary Studies | 1 | 1.2% |
| Science & Technology | 4 | 4.9% |
| Business | 46 | 56.1% |
| Education | 6 | 7.3% |
| Literature & Languages | 1 | 1.2% |
| Liberal Arts & History | 0 | 0.0% |
| Visual & Performing Arts | 5 | 6.1% |
| Communications | 4 | 4.9% |
| Arts & Humanities | 4 | 4.9% |
| Total | 82 | 100.0% |
Transportation & Commute in Midway
Vehicle Availability by Sex in Midway
The most prevalent vehicle ownership categories in Midway are males with 4 vehicles (154, accounting for 57.0%) and females with 4 vehicles (37, making up 105.5%).
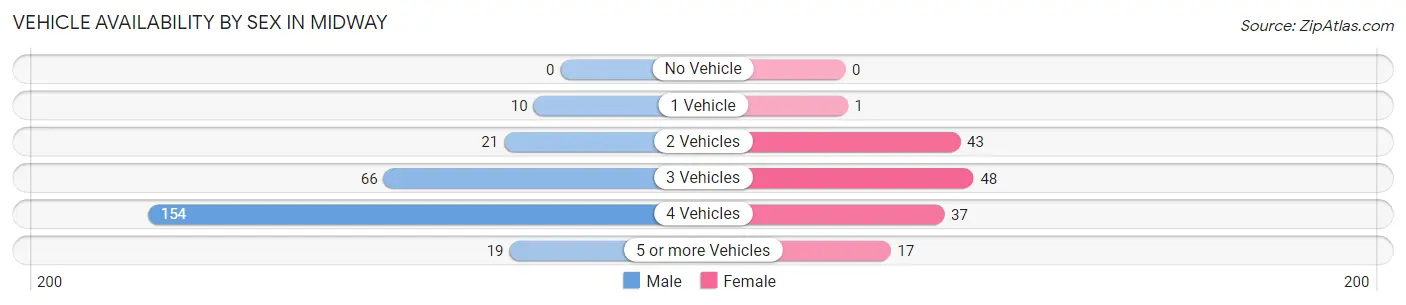
| Vehicles Available | Male | Female |
| No Vehicle | 0 (0.0%) | 0 (0.0%) |
| 1 Vehicle | 10 (3.7%) | 1 (0.7%) |
| 2 Vehicles | 21 (7.8%) | 43 (29.4%) |
| 3 Vehicles | 66 (24.4%) | 48 (32.9%) |
| 4 Vehicles | 154 (57.0%) | 37 (25.3%) |
| 5 or more Vehicles | 19 (7.0%) | 17 (11.6%) |
| Total | 270 (100.0%) | 146 (100.0%) |
Commute Time in Midway
The most frequently occuring commute durations in Midway are 45 to 59 minutes (92 commuters, 22.2%), 35 to 39 minutes (78 commuters, 18.8%), and 20 to 24 minutes (70 commuters, 16.9%).
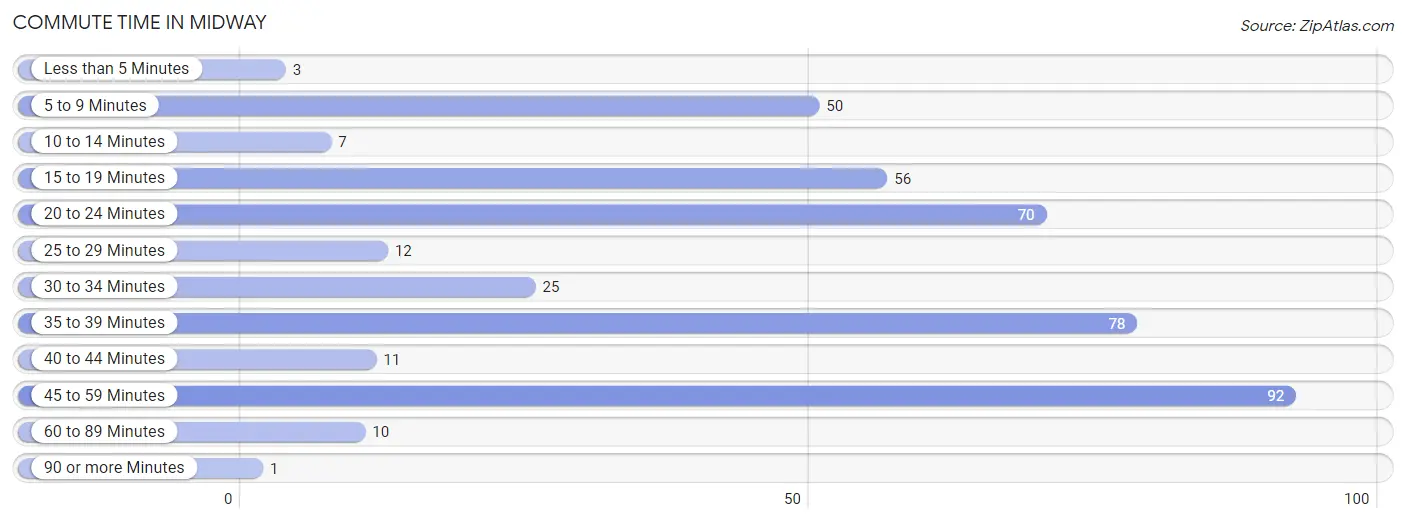
| Commute Time | # Commuters | % Commuters |
| Less than 5 Minutes | 3 | 0.7% |
| 5 to 9 Minutes | 50 | 12.0% |
| 10 to 14 Minutes | 7 | 1.7% |
| 15 to 19 Minutes | 56 | 13.5% |
| 20 to 24 Minutes | 70 | 16.9% |
| 25 to 29 Minutes | 12 | 2.9% |
| 30 to 34 Minutes | 25 | 6.0% |
| 35 to 39 Minutes | 78 | 18.8% |
| 40 to 44 Minutes | 11 | 2.6% |
| 45 to 59 Minutes | 92 | 22.2% |
| 60 to 89 Minutes | 10 | 2.4% |
| 90 or more Minutes | 1 | 0.2% |
Commute Time by Sex in Midway
The most common commute times in Midway are 35 to 39 minutes (78 commuters, 29.0%) for males and 45 to 59 minutes (42 commuters, 28.8%) for females.
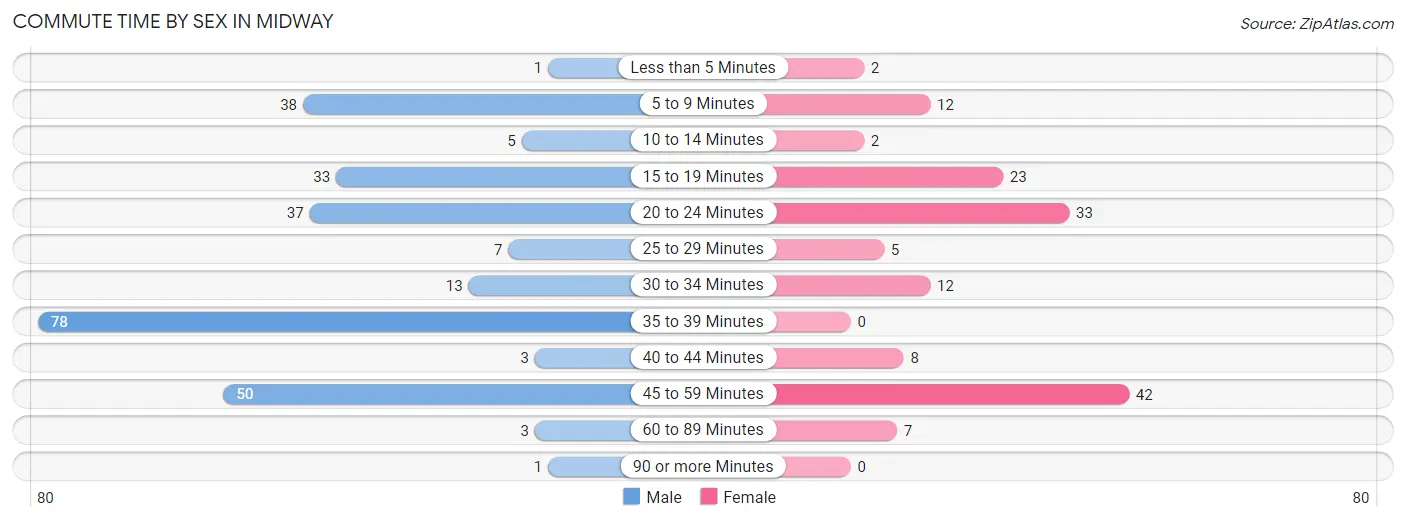
| Commute Time | Male | Female |
| Less than 5 Minutes | 1 (0.4%) | 2 (1.4%) |
| 5 to 9 Minutes | 38 (14.1%) | 12 (8.2%) |
| 10 to 14 Minutes | 5 (1.9%) | 2 (1.4%) |
| 15 to 19 Minutes | 33 (12.3%) | 23 (15.8%) |
| 20 to 24 Minutes | 37 (13.8%) | 33 (22.6%) |
| 25 to 29 Minutes | 7 (2.6%) | 5 (3.4%) |
| 30 to 34 Minutes | 13 (4.8%) | 12 (8.2%) |
| 35 to 39 Minutes | 78 (29.0%) | 0 (0.0%) |
| 40 to 44 Minutes | 3 (1.1%) | 8 (5.5%) |
| 45 to 59 Minutes | 50 (18.6%) | 42 (28.8%) |
| 60 to 89 Minutes | 3 (1.1%) | 7 (4.8%) |
| 90 or more Minutes | 1 (0.4%) | 0 (0.0%) |
Time of Departure to Work by Sex in Midway
The most frequent times of departure to work in Midway are 9:00 AM to 9:59 AM (71, 26.4%) for males and 7:00 AM to 7:29 AM (53, 36.3%) for females.
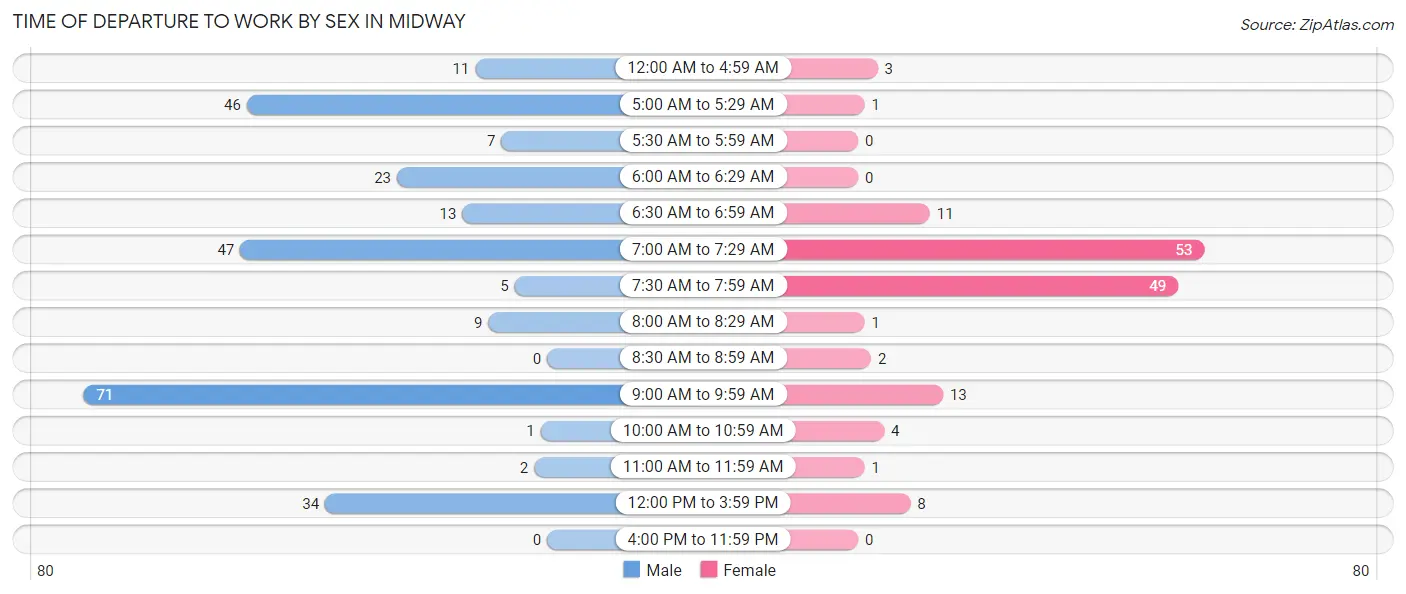
| Time of Departure | Male | Female |
| 12:00 AM to 4:59 AM | 11 (4.1%) | 3 (2.1%) |
| 5:00 AM to 5:29 AM | 46 (17.1%) | 1 (0.7%) |
| 5:30 AM to 5:59 AM | 7 (2.6%) | 0 (0.0%) |
| 6:00 AM to 6:29 AM | 23 (8.6%) | 0 (0.0%) |
| 6:30 AM to 6:59 AM | 13 (4.8%) | 11 (7.5%) |
| 7:00 AM to 7:29 AM | 47 (17.5%) | 53 (36.3%) |
| 7:30 AM to 7:59 AM | 5 (1.9%) | 49 (33.6%) |
| 8:00 AM to 8:29 AM | 9 (3.4%) | 1 (0.7%) |
| 8:30 AM to 8:59 AM | 0 (0.0%) | 2 (1.4%) |
| 9:00 AM to 9:59 AM | 71 (26.4%) | 13 (8.9%) |
| 10:00 AM to 10:59 AM | 1 (0.4%) | 4 (2.7%) |
| 11:00 AM to 11:59 AM | 2 (0.7%) | 1 (0.7%) |
| 12:00 PM to 3:59 PM | 34 (12.6%) | 8 (5.5%) |
| 4:00 PM to 11:59 PM | 0 (0.0%) | 0 (0.0%) |
| Total | 269 (100.0%) | 146 (100.0%) |
Housing Occupancy in Midway
Occupancy by Ownership in Midway
Of the total 655 dwellings in Midway, owner-occupied units account for 520 (79.4%), while renter-occupied units make up 135 (20.6%).
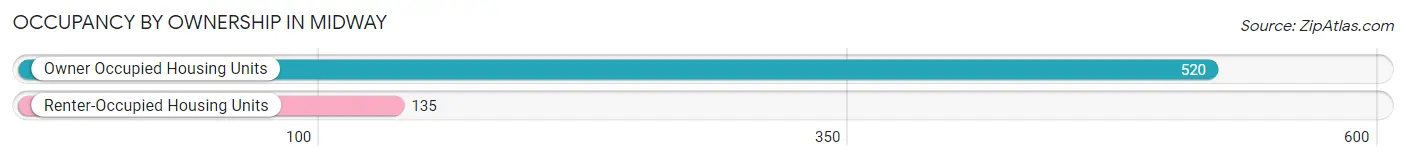
| Occupancy | # Housing Units | % Housing Units |
| Owner Occupied Housing Units | 520 | 79.4% |
| Renter-Occupied Housing Units | 135 | 20.6% |
| Total Occupied Housing Units | 655 | 100.0% |
Occupancy by Household Size in Midway
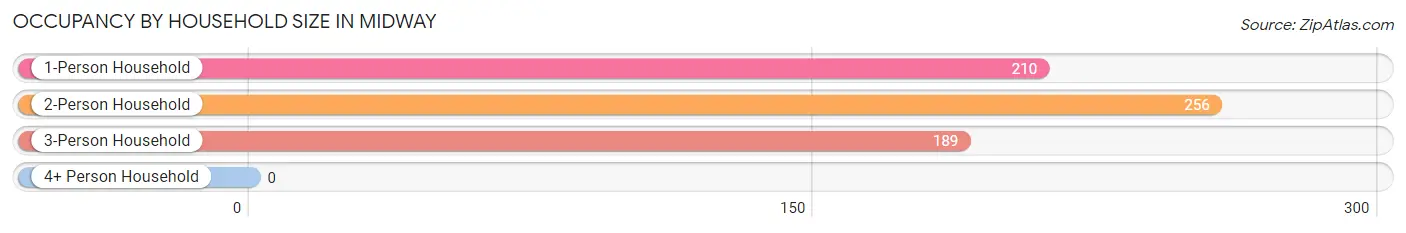
| Household Size | # Housing Units | % Housing Units |
| 1-Person Household | 210 | 32.1% |
| 2-Person Household | 256 | 39.1% |
| 3-Person Household | 189 | 28.8% |
| 4+ Person Household | 0 | 0.0% |
| Total Housing Units | 655 | 100.0% |
Occupancy by Ownership by Household Size in Midway
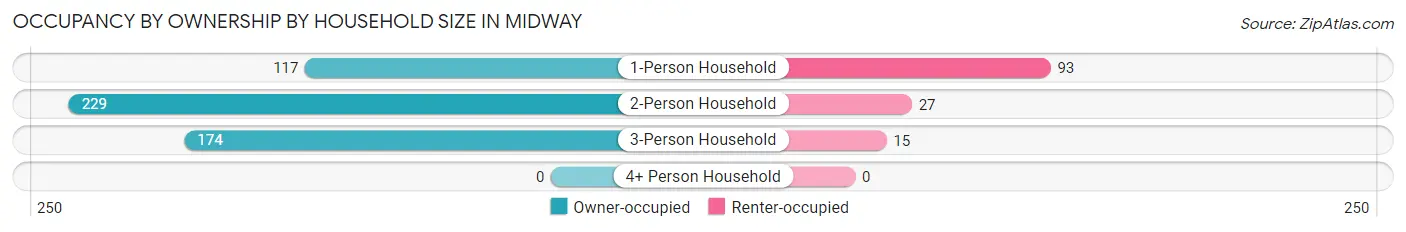
| Household Size | Owner-occupied | Renter-occupied |
| 1-Person Household | 117 (55.7%) | 93 (44.3%) |
| 2-Person Household | 229 (89.4%) | 27 (10.5%) |
| 3-Person Household | 174 (92.1%) | 15 (7.9%) |
| 4+ Person Household | 0 (0.0%) | 0 (0.0%) |
| Total Housing Units | 520 (79.4%) | 135 (20.6%) |
Occupancy by Educational Attainment in Midway
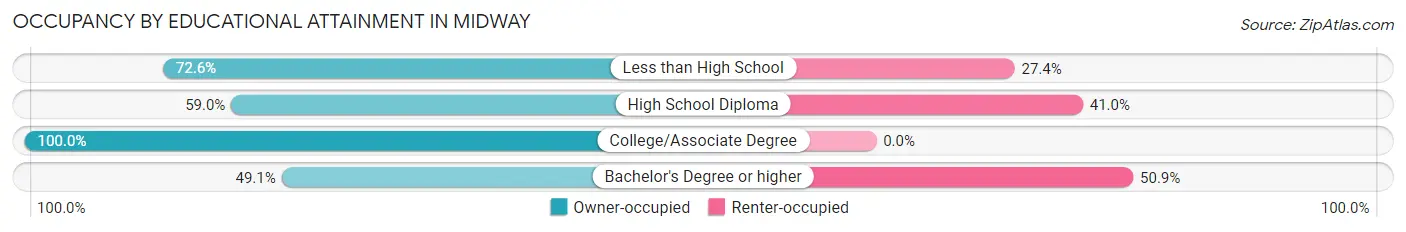
| Household Size | Owner-occupied | Renter-occupied |
| Less than High School | 82 (72.6%) | 31 (27.4%) |
| High School Diploma | 111 (59.0%) | 77 (41.0%) |
| College/Associate Degree | 301 (100.0%) | 0 (0.0%) |
| Bachelor's Degree or higher | 26 (49.1%) | 27 (50.9%) |
Occupancy by Age of Householder in Midway
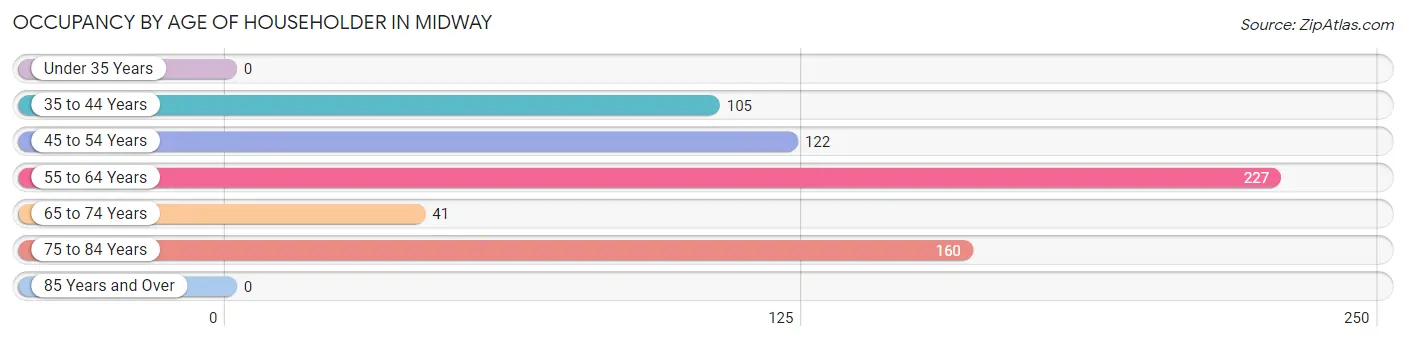
| Age Bracket | # Households | % Households |
| Under 35 Years | 0 | 0.0% |
| 35 to 44 Years | 105 | 16.0% |
| 45 to 54 Years | 122 | 18.6% |
| 55 to 64 Years | 227 | 34.7% |
| 65 to 74 Years | 41 | 6.3% |
| 75 to 84 Years | 160 | 24.4% |
| 85 Years and Over | 0 | 0.0% |
| Total | 655 | 100.0% |
Housing Finances in Midway
Median Income by Occupancy in Midway
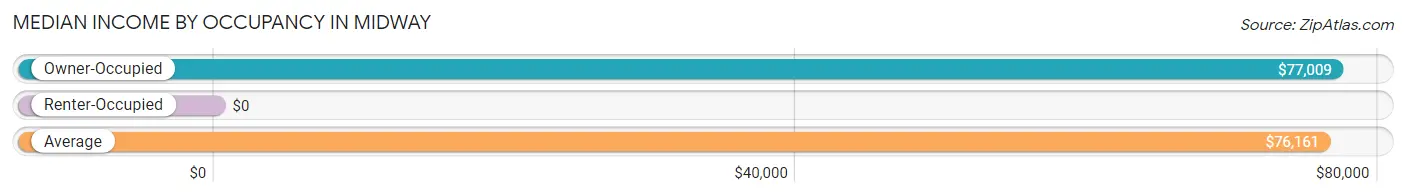
| Occupancy Type | # Households | Median Income |
| Owner-Occupied | 209 (89.3%) | $77,009 |
| Renter-Occupied | 25 (10.7%) | $0 |
| Average | 234 (100.0%) | $76,161 |
Occupancy by Householder Income Bracket in Midway
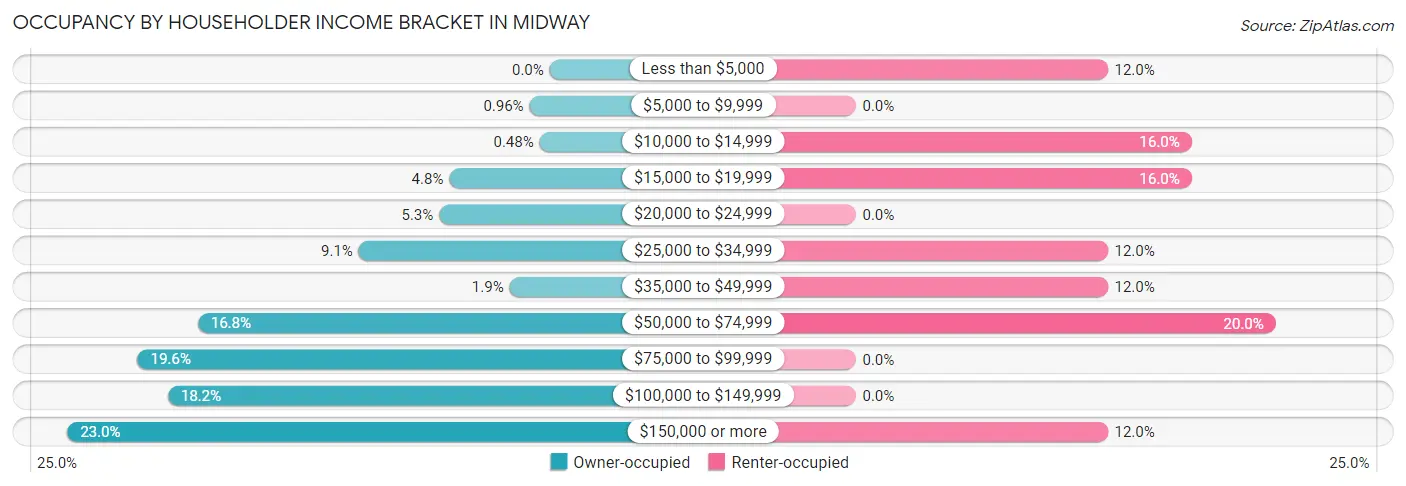
| Income Bracket | Owner-occupied | Renter-occupied |
| Less than $5,000 | 0 (0.0%) | 3 (12.0%) |
| $5,000 to $9,999 | 2 (1.0%) | 0 (0.0%) |
| $10,000 to $14,999 | 1 (0.5%) | 4 (16.0%) |
| $15,000 to $19,999 | 10 (4.8%) | 4 (16.0%) |
| $20,000 to $24,999 | 11 (5.3%) | 0 (0.0%) |
| $25,000 to $34,999 | 19 (9.1%) | 3 (12.0%) |
| $35,000 to $49,999 | 4 (1.9%) | 3 (12.0%) |
| $50,000 to $74,999 | 35 (16.8%) | 5 (20.0%) |
| $75,000 to $99,999 | 41 (19.6%) | 0 (0.0%) |
| $100,000 to $149,999 | 38 (18.2%) | 0 (0.0%) |
| $150,000 or more | 48 (23.0%) | 3 (12.0%) |
| Total | 209 (100.0%) | 25 (100.0%) |
Monthly Housing Cost Tiers in Midway
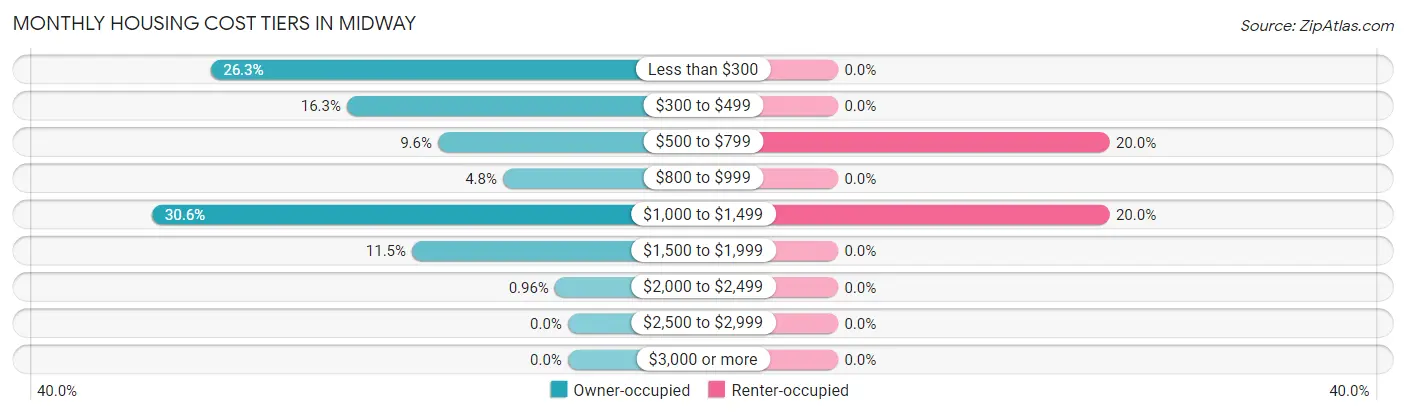
| Monthly Cost | Owner-occupied | Renter-occupied |
| Less than $300 | 55 (26.3%) | 0 (0.0%) |
| $300 to $499 | 34 (16.3%) | 0 (0.0%) |
| $500 to $799 | 20 (9.6%) | 5 (20.0%) |
| $800 to $999 | 10 (4.8%) | 0 (0.0%) |
| $1,000 to $1,499 | 64 (30.6%) | 5 (20.0%) |
| $1,500 to $1,999 | 24 (11.5%) | 0 (0.0%) |
| $2,000 to $2,499 | 2 (1.0%) | 0 (0.0%) |
| $2,500 to $2,999 | 0 (0.0%) | 0 (0.0%) |
| $3,000 or more | 0 (0.0%) | 0 (0.0%) |
| Total | 209 (100.0%) | 25 (100.0%) |
Physical Housing Characteristics in Midway
Housing Structures in Midway
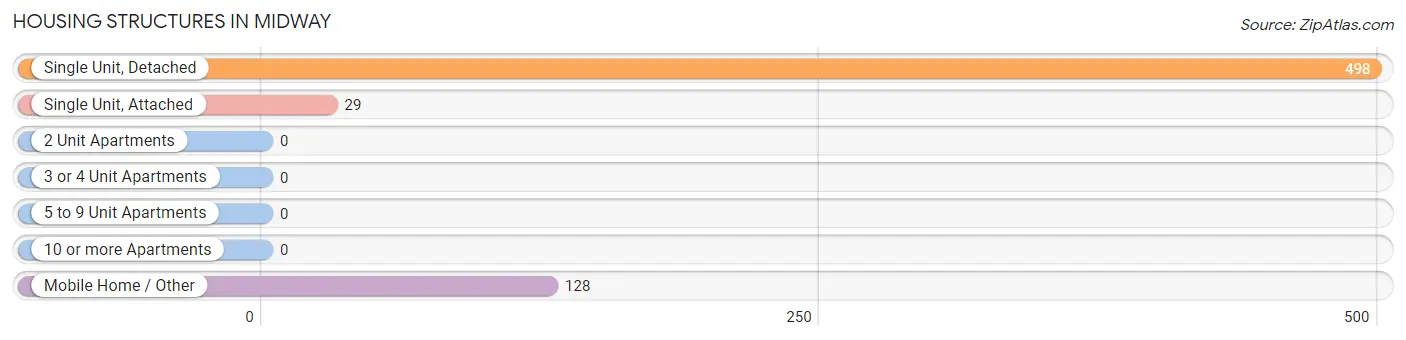
| Structure Type | # Housing Units | % Housing Units |
| Single Unit, Detached | 498 | 76.0% |
| Single Unit, Attached | 29 | 4.4% |
| 2 Unit Apartments | 0 | 0.0% |
| 3 or 4 Unit Apartments | 0 | 0.0% |
| 5 to 9 Unit Apartments | 0 | 0.0% |
| 10 or more Apartments | 0 | 0.0% |
| Mobile Home / Other | 128 | 19.5% |
| Total | 655 | 100.0% |
Housing Structures by Occupancy in Midway
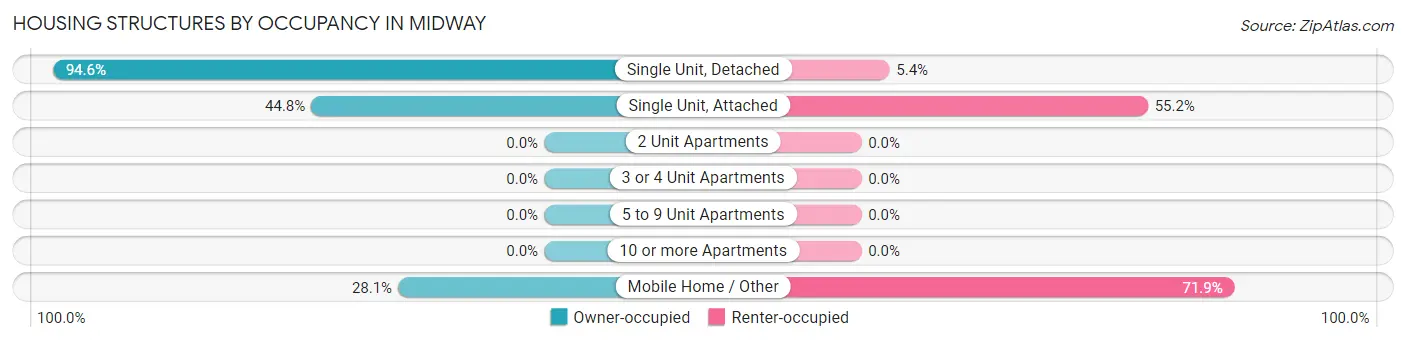
| Structure Type | Owner-occupied | Renter-occupied |
| Single Unit, Detached | 471 (94.6%) | 27 (5.4%) |
| Single Unit, Attached | 13 (44.8%) | 16 (55.2%) |
| 2 Unit Apartments | 0 (0.0%) | 0 (0.0%) |
| 3 or 4 Unit Apartments | 0 (0.0%) | 0 (0.0%) |
| 5 to 9 Unit Apartments | 0 (0.0%) | 0 (0.0%) |
| 10 or more Apartments | 0 (0.0%) | 0 (0.0%) |
| Mobile Home / Other | 36 (28.1%) | 92 (71.9%) |
| Total | 520 (79.4%) | 135 (20.6%) |
Housing Structures by Number of Rooms in Midway
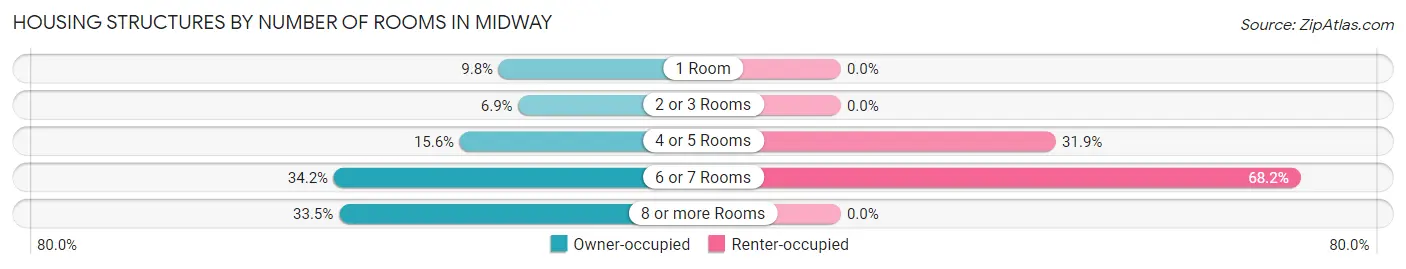
| Number of Rooms | Owner-occupied | Renter-occupied |
| 1 Room | 51 (9.8%) | 0 (0.0%) |
| 2 or 3 Rooms | 36 (6.9%) | 0 (0.0%) |
| 4 or 5 Rooms | 81 (15.6%) | 43 (31.9%) |
| 6 or 7 Rooms | 178 (34.2%) | 92 (68.1%) |
| 8 or more Rooms | 174 (33.5%) | 0 (0.0%) |
| Total | 520 (100.0%) | 135 (100.0%) |
Housing Structure by Heating Type in Midway
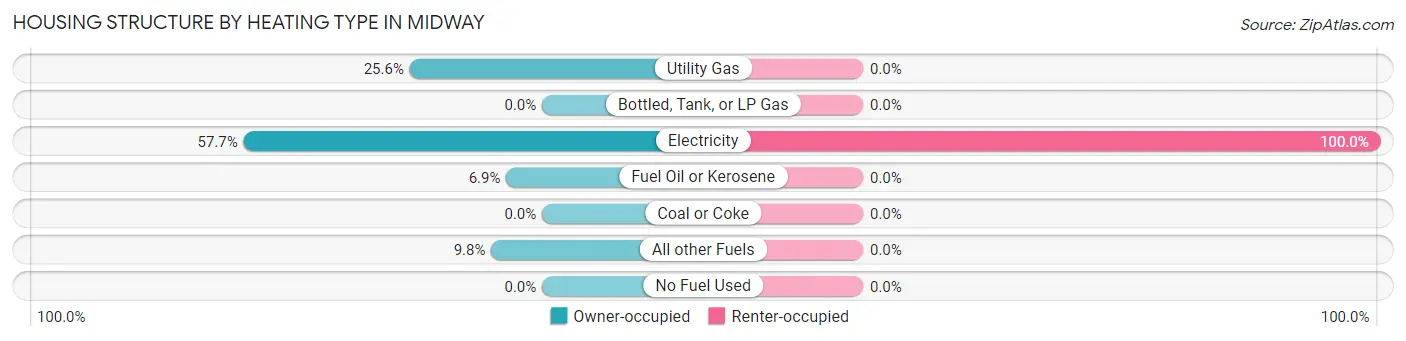
| Heating Type | Owner-occupied | Renter-occupied |
| Utility Gas | 133 (25.6%) | 0 (0.0%) |
| Bottled, Tank, or LP Gas | 0 (0.0%) | 0 (0.0%) |
| Electricity | 300 (57.7%) | 135 (100.0%) |
| Fuel Oil or Kerosene | 36 (6.9%) | 0 (0.0%) |
| Coal or Coke | 0 (0.0%) | 0 (0.0%) |
| All other Fuels | 51 (9.8%) | 0 (0.0%) |
| No Fuel Used | 0 (0.0%) | 0 (0.0%) |
| Total | 520 (100.0%) | 135 (100.0%) |
Household Vehicle Usage in Midway
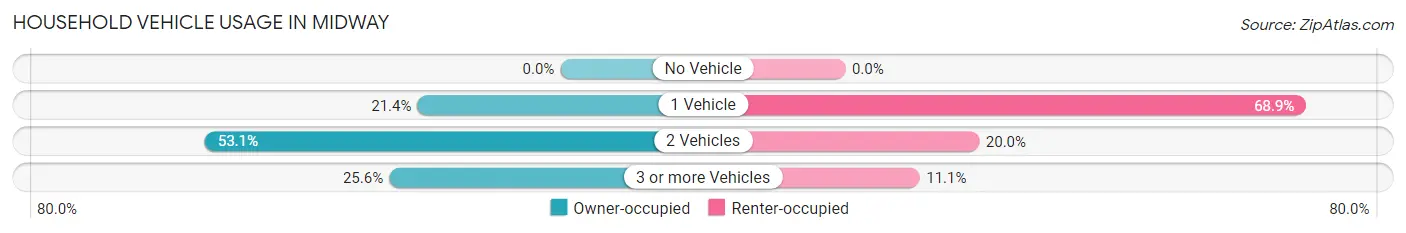
| Vehicles per Household | Owner-occupied | Renter-occupied |
| No Vehicle | 0 (0.0%) | 0 (0.0%) |
| 1 Vehicle | 111 (21.3%) | 93 (68.9%) |
| 2 Vehicles | 276 (53.1%) | 27 (20.0%) |
| 3 or more Vehicles | 133 (25.6%) | 15 (11.1%) |
| Total | 520 (100.0%) | 135 (100.0%) |
Real Estate & Mortgages in Midway
Real Estate and Mortgage Overview in Midway
| Characteristic | Without Mortgage | With Mortgage |
| Housing Units | 244 | 109 |
| Median Property Value | $138,900 | $169,800 |
| Median Household Income | $29,116 | $42 |
| Monthly Housing Costs | $336 | $0 |
| Real Estate Taxes | $618 | $0 |
Property Value by Mortgage Status in Midway
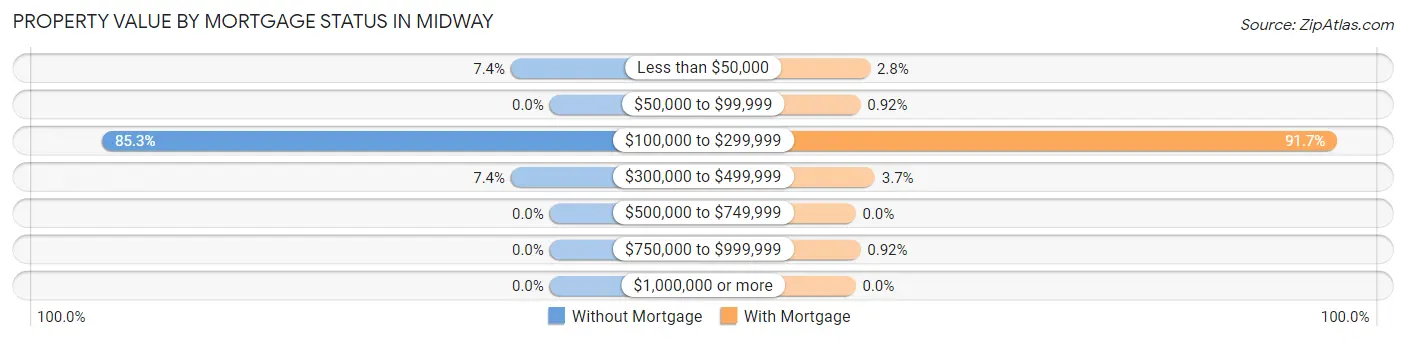
| Property Value | Without Mortgage | With Mortgage |
| Less than $50,000 | 18 (7.4%) | 3 (2.8%) |
| $50,000 to $99,999 | 0 (0.0%) | 1 (0.9%) |
| $100,000 to $299,999 | 208 (85.3%) | 100 (91.7%) |
| $300,000 to $499,999 | 18 (7.4%) | 4 (3.7%) |
| $500,000 to $749,999 | 0 (0.0%) | 0 (0.0%) |
| $750,000 to $999,999 | 0 (0.0%) | 1 (0.9%) |
| $1,000,000 or more | 0 (0.0%) | 0 (0.0%) |
| Total | 244 (100.0%) | 109 (100.0%) |
Household Income by Mortgage Status in Midway
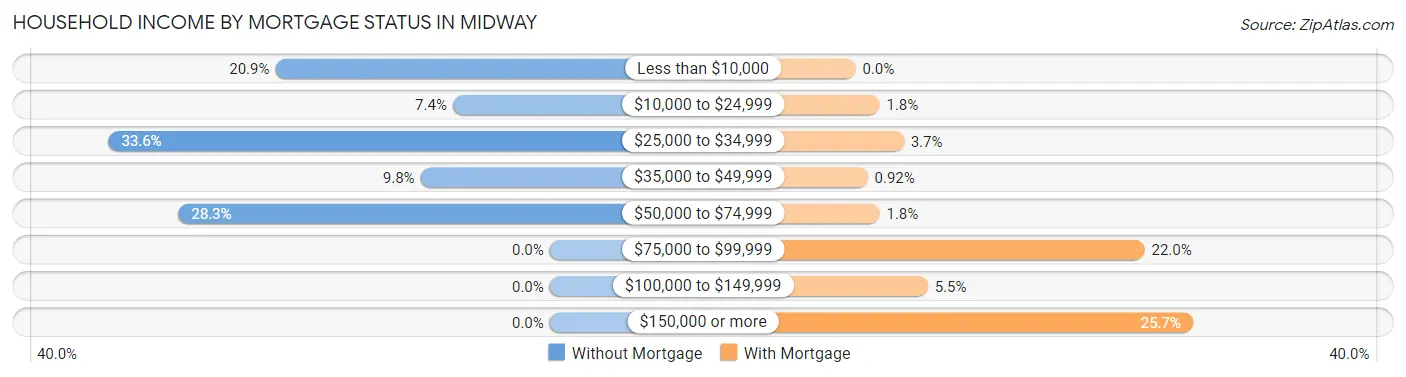
| Household Income | Without Mortgage | With Mortgage |
| Less than $10,000 | 51 (20.9%) | 0 (0.0%) |
| $10,000 to $24,999 | 18 (7.4%) | 2 (1.8%) |
| $25,000 to $34,999 | 82 (33.6%) | 4 (3.7%) |
| $35,000 to $49,999 | 24 (9.8%) | 1 (0.9%) |
| $50,000 to $74,999 | 69 (28.3%) | 2 (1.8%) |
| $75,000 to $99,999 | 0 (0.0%) | 24 (22.0%) |
| $100,000 to $149,999 | 0 (0.0%) | 6 (5.5%) |
| $150,000 or more | 0 (0.0%) | 28 (25.7%) |
| Total | 244 (100.0%) | 109 (100.0%) |
Property Value to Household Income Ratio in Midway
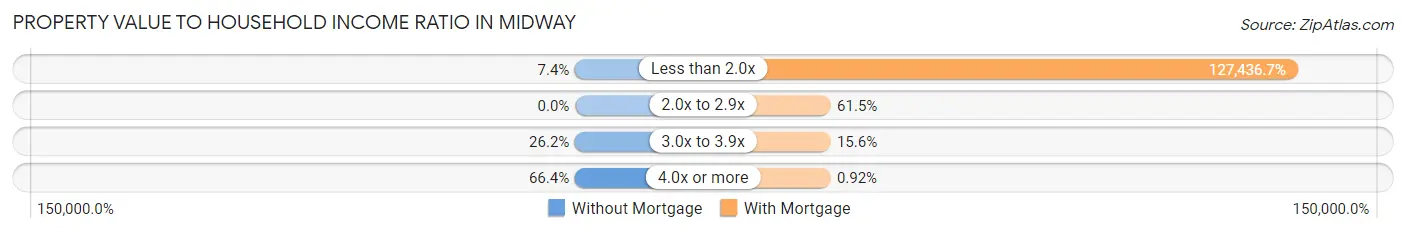
| Value-to-Income Ratio | Without Mortgage | With Mortgage |
| Less than 2.0x | 18 (7.4%) | 138,906 (127,436.7%) |
| 2.0x to 2.9x | 0 (0.0%) | 67 (61.5%) |
| 3.0x to 3.9x | 64 (26.2%) | 17 (15.6%) |
| 4.0x or more | 162 (66.4%) | 1 (0.9%) |
| Total | 244 (100.0%) | 109 (100.0%) |
Real Estate Taxes by Mortgage Status in Midway
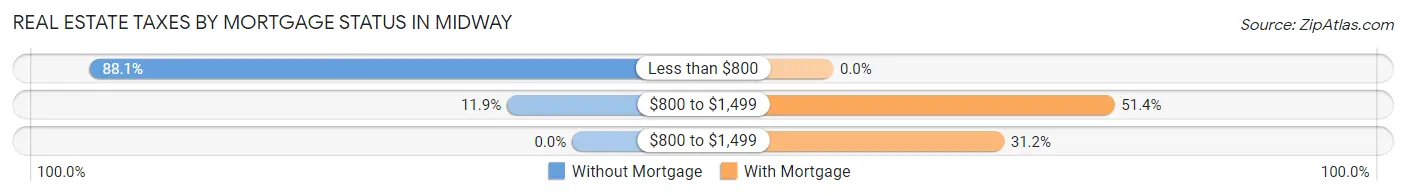
| Property Taxes | Without Mortgage | With Mortgage |
| Less than $800 | 215 (88.1%) | 0 (0.0%) |
| $800 to $1,499 | 29 (11.9%) | 56 (51.4%) |
| $800 to $1,499 | 0 (0.0%) | 34 (31.2%) |
| Total | 244 (100.0%) | 109 (100.0%) |
Health & Disability in Midway
Health Insurance Coverage by Age in Midway
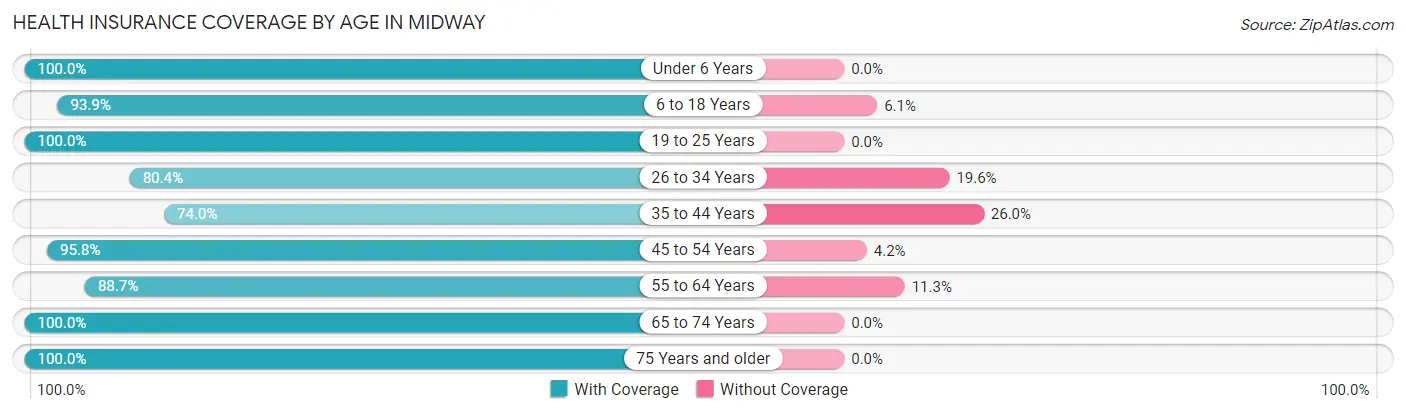
| Age Bracket | With Coverage | Without Coverage |
| Under 6 Years | 12 (100.0%) | 0 (0.0%) |
| 6 to 18 Years | 107 (93.9%) | 7 (6.1%) |
| 19 to 25 Years | 118 (100.0%) | 0 (0.0%) |
| 26 to 34 Years | 41 (80.4%) | 10 (19.6%) |
| 35 to 44 Years | 91 (74.0%) | 32 (26.0%) |
| 45 to 54 Years | 114 (95.8%) | 5 (4.2%) |
| 55 to 64 Years | 63 (88.7%) | 8 (11.3%) |
| 65 to 74 Years | 122 (100.0%) | 0 (0.0%) |
| 75 Years and older | 24 (100.0%) | 0 (0.0%) |
| Total | 692 (91.8%) | 62 (8.2%) |
Health Insurance Coverage by Citizenship Status in Midway
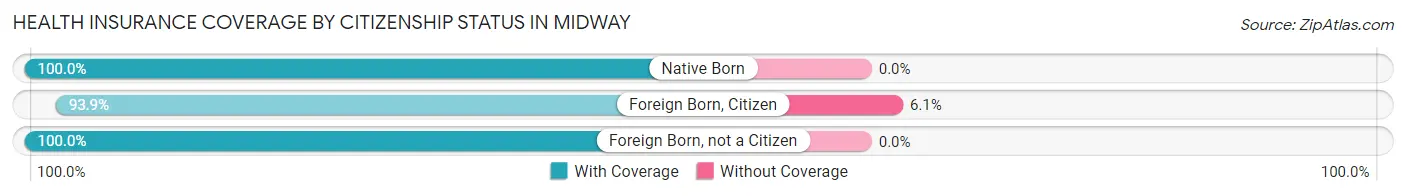
| Citizenship Status | With Coverage | Without Coverage |
| Native Born | 12 (100.0%) | 0 (0.0%) |
| Foreign Born, Citizen | 107 (93.9%) | 7 (6.1%) |
| Foreign Born, not a Citizen | 118 (100.0%) | 0 (0.0%) |
Health Insurance Coverage by Household Income in Midway
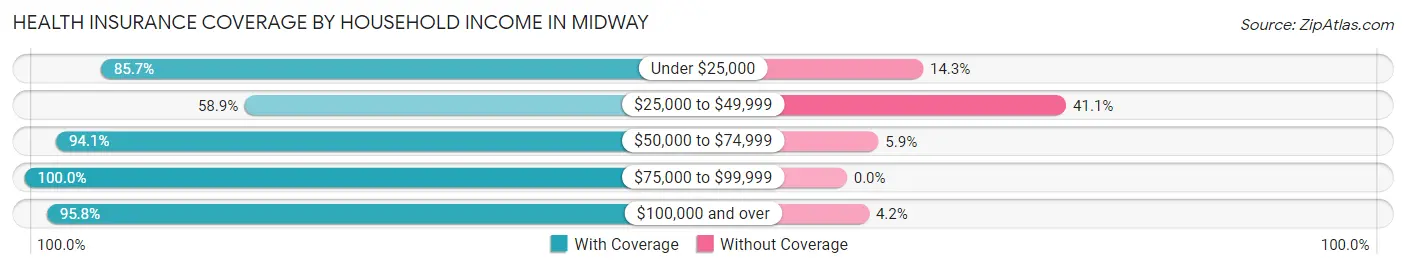
| Household Income | With Coverage | Without Coverage |
| Under $25,000 | 42 (85.7%) | 7 (14.3%) |
| $25,000 to $49,999 | 43 (58.9%) | 30 (41.1%) |
| $50,000 to $74,999 | 159 (94.1%) | 10 (5.9%) |
| $75,000 to $99,999 | 102 (100.0%) | 0 (0.0%) |
| $100,000 and over | 346 (95.8%) | 15 (4.2%) |
Public vs Private Health Insurance Coverage by Age in Midway
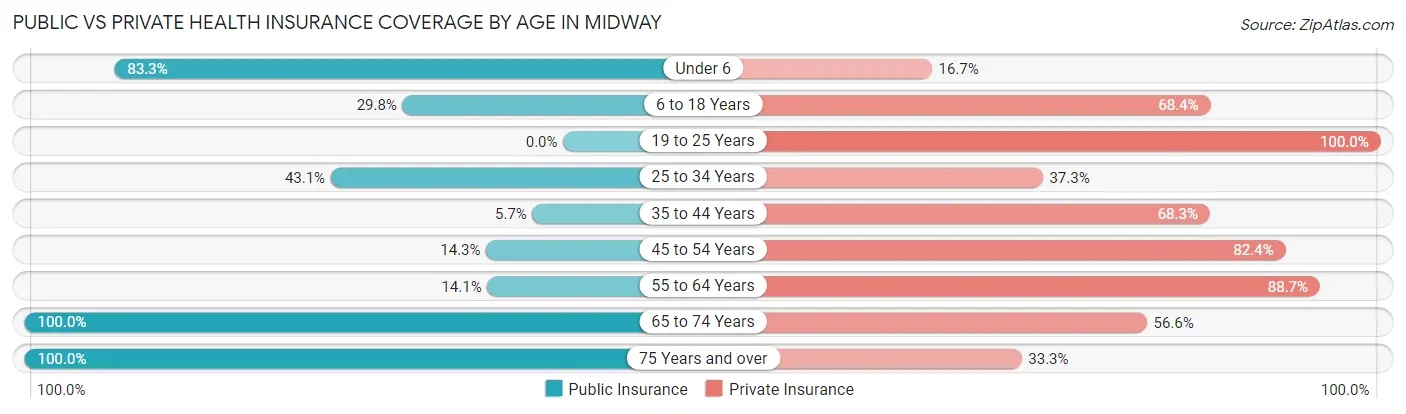
| Age Bracket | Public Insurance | Private Insurance |
| Under 6 | 10 (83.3%) | 2 (16.7%) |
| 6 to 18 Years | 34 (29.8%) | 78 (68.4%) |
| 19 to 25 Years | 0 (0.0%) | 118 (100.0%) |
| 25 to 34 Years | 22 (43.1%) | 19 (37.2%) |
| 35 to 44 Years | 7 (5.7%) | 84 (68.3%) |
| 45 to 54 Years | 17 (14.3%) | 98 (82.4%) |
| 55 to 64 Years | 10 (14.1%) | 63 (88.7%) |
| 65 to 74 Years | 122 (100.0%) | 69 (56.6%) |
| 75 Years and over | 24 (100.0%) | 8 (33.3%) |
| Total | 246 (32.6%) | 539 (71.5%) |
Disability Status by Sex by Age in Midway
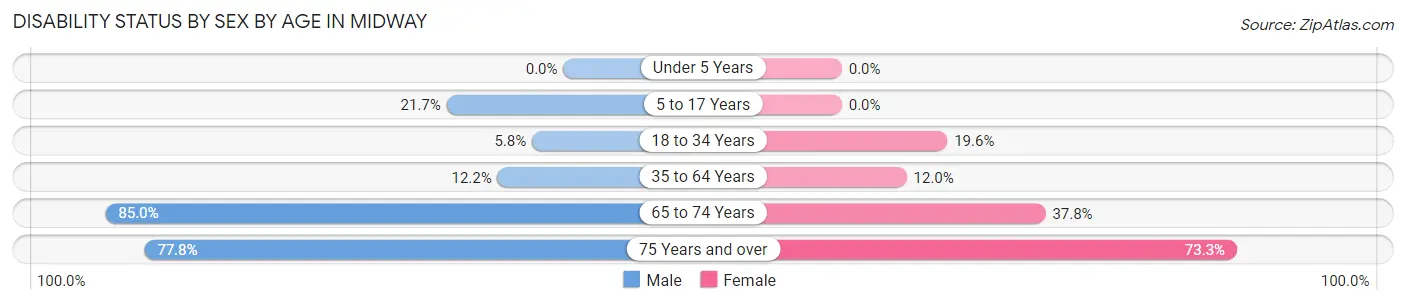
| Age Bracket | Male | Female |
| Under 5 Years | 0 (0.0%) | 0 (0.0%) |
| 5 to 17 Years | 13 (21.7%) | 0 (0.0%) |
| 18 to 34 Years | 9 (5.8%) | 9 (19.6%) |
| 35 to 64 Years | 22 (12.2%) | 16 (12.0%) |
| 65 to 74 Years | 34 (85.0%) | 31 (37.8%) |
| 75 Years and over | 7 (77.8%) | 11 (73.3%) |
Disability Class by Sex by Age in Midway
Disability Class: Hearing Difficulty
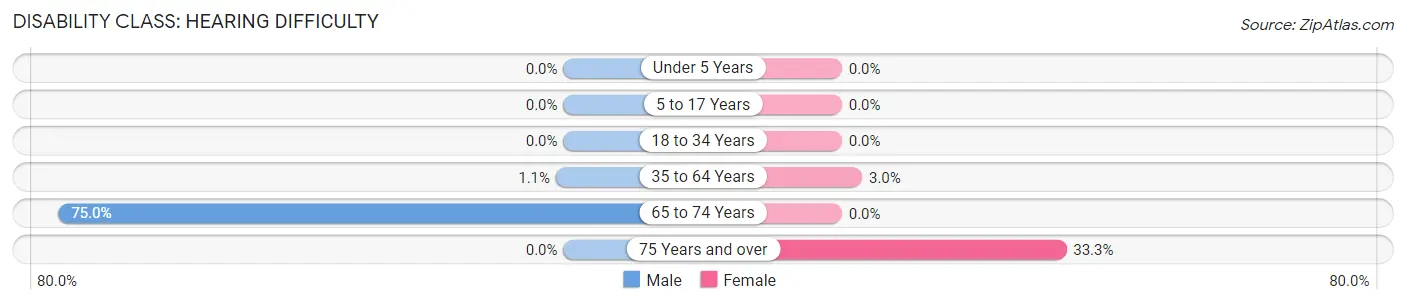
| Age Bracket | Male | Female |
| Under 5 Years | 0 (0.0%) | 0 (0.0%) |
| 5 to 17 Years | 0 (0.0%) | 0 (0.0%) |
| 18 to 34 Years | 0 (0.0%) | 0 (0.0%) |
| 35 to 64 Years | 2 (1.1%) | 4 (3.0%) |
| 65 to 74 Years | 30 (75.0%) | 0 (0.0%) |
| 75 Years and over | 0 (0.0%) | 5 (33.3%) |
Disability Class: Vision Difficulty
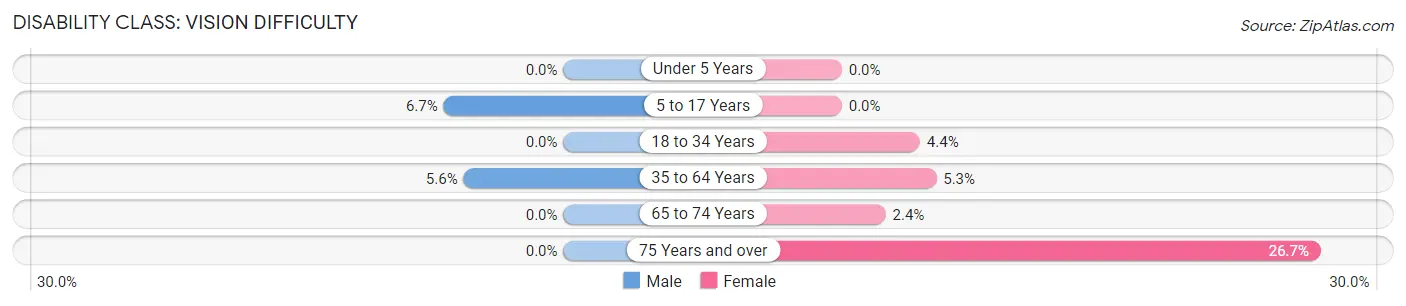
| Age Bracket | Male | Female |
| Under 5 Years | 0 (0.0%) | 0 (0.0%) |
| 5 to 17 Years | 4 (6.7%) | 0 (0.0%) |
| 18 to 34 Years | 0 (0.0%) | 2 (4.3%) |
| 35 to 64 Years | 10 (5.6%) | 7 (5.3%) |
| 65 to 74 Years | 0 (0.0%) | 2 (2.4%) |
| 75 Years and over | 0 (0.0%) | 4 (26.7%) |
Disability Class: Cognitive Difficulty
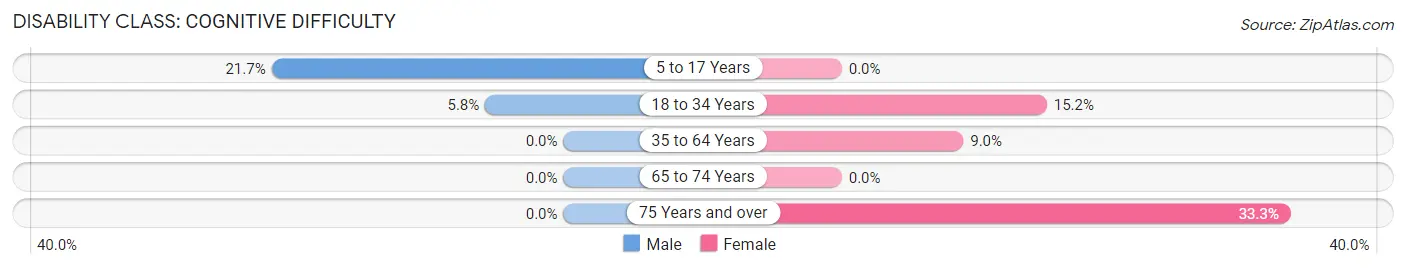
| Age Bracket | Male | Female |
| 5 to 17 Years | 13 (21.7%) | 0 (0.0%) |
| 18 to 34 Years | 9 (5.8%) | 7 (15.2%) |
| 35 to 64 Years | 0 (0.0%) | 12 (9.0%) |
| 65 to 74 Years | 0 (0.0%) | 0 (0.0%) |
| 75 Years and over | 0 (0.0%) | 5 (33.3%) |
Disability Class: Ambulatory Difficulty
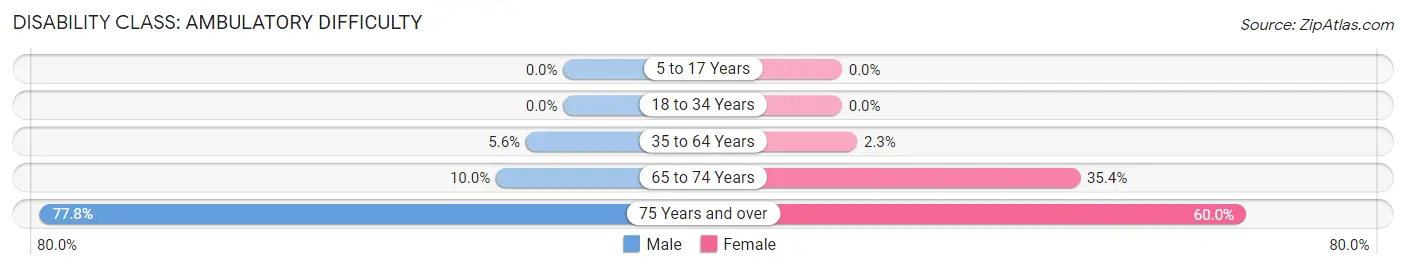
| Age Bracket | Male | Female |
| 5 to 17 Years | 0 (0.0%) | 0 (0.0%) |
| 18 to 34 Years | 0 (0.0%) | 0 (0.0%) |
| 35 to 64 Years | 10 (5.6%) | 3 (2.3%) |
| 65 to 74 Years | 4 (10.0%) | 29 (35.4%) |
| 75 Years and over | 7 (77.8%) | 9 (60.0%) |
Disability Class: Self-Care Difficulty
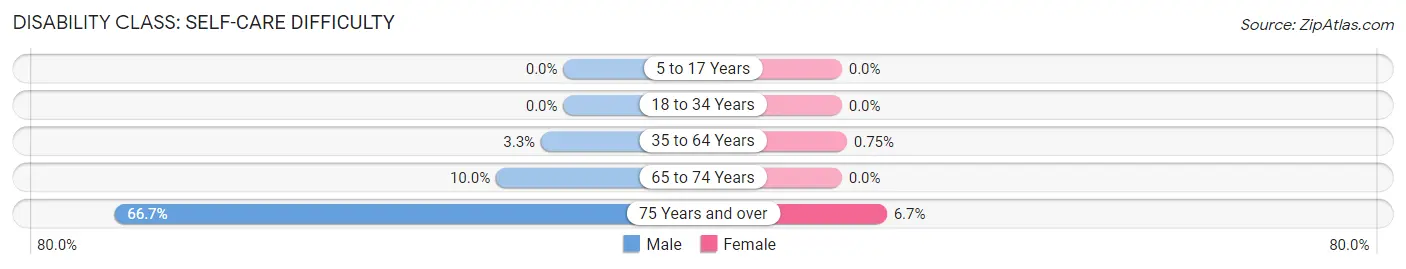
| Age Bracket | Male | Female |
| 5 to 17 Years | 0 (0.0%) | 0 (0.0%) |
| 18 to 34 Years | 0 (0.0%) | 0 (0.0%) |
| 35 to 64 Years | 6 (3.3%) | 1 (0.7%) |
| 65 to 74 Years | 4 (10.0%) | 0 (0.0%) |
| 75 Years and over | 6 (66.7%) | 1 (6.7%) |
Technology Access in Midway
Computing Device Access in Midway
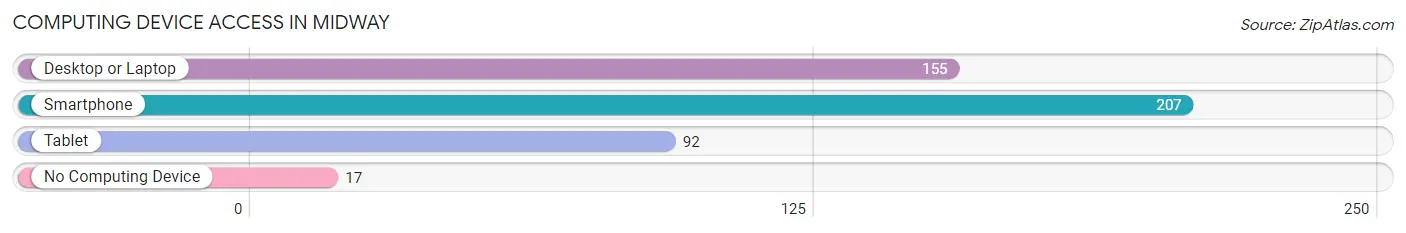
| Device Type | # Households | % Households |
| Desktop or Laptop | 155 | 66.2% |
| Smartphone | 207 | 88.5% |
| Tablet | 92 | 39.3% |
| No Computing Device | 17 | 7.3% |
| Total | 234 | 100.0% |
Internet Access in Midway
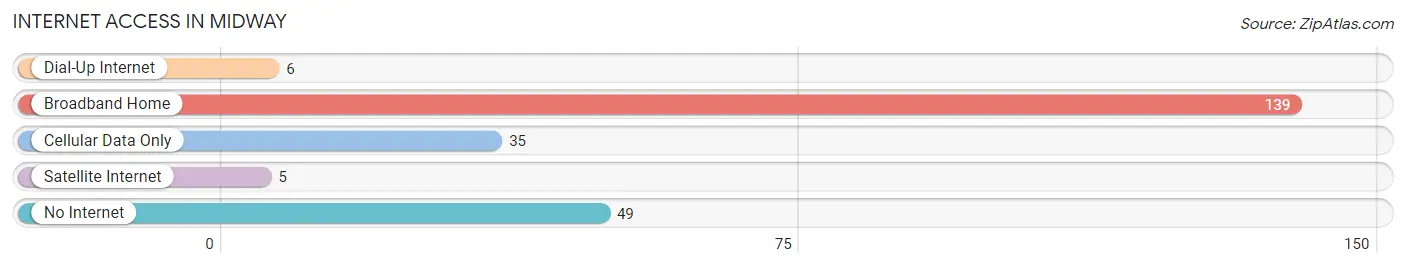
| Internet Type | # Households | % Households |
| Dial-Up Internet | 6 | 2.6% |
| Broadband Home | 139 | 59.4% |
| Cellular Data Only | 35 | 15.0% |
| Satellite Internet | 5 | 2.1% |
| No Internet | 49 | 20.9% |
| Total | 234 | 100.0% |
Midway Summary
Midway is a small town located in the Ozark Mountains of Arkansas. It is situated in the northwest corner of the state, near the Oklahoma border. The town was founded in 1872 and has a population of approximately 1,000 people.
Geography
Midway is located in the Ozark Mountains of Arkansas. The town is situated in the northwest corner of the state, near the Oklahoma border. The town is surrounded by rolling hills and lush forests. The town is located in the Ozark National Forest, which is home to a variety of wildlife, including deer, turkey, and black bear. The town is also located near the Buffalo National River, which is a popular destination for fishing, canoeing, and camping.
Economy
The economy of Midway is largely based on agriculture and tourism. The town is home to several farms, which produce a variety of crops, including corn, soybeans, and wheat. The town is also home to several small businesses, including restaurants, shops, and a grocery store. Tourism is also an important part of the local economy. The town is home to several attractions, including the Ozark National Forest, the Buffalo National River, and the Ozark Folk Center.
Demographics
As of the 2010 census, the population of Midway was 1,000 people. The town is predominantly white, with approximately 95% of the population being Caucasian. The median household income is $35,000, and the median age is 44 years old. The town is home to a variety of religious denominations, including Baptist, Methodist, and Catholic.
History
Midway was founded in 1872 by a group of settlers from Tennessee. The town was originally named “Midway Station”, due to its location halfway between Fayetteville and Fort Smith. The town was incorporated in 1883 and was renamed “Midway”. The town was a popular stop for travelers on the Butterfield Overland Mail route. The town was also home to a variety of businesses, including a hotel, a general store, and a blacksmith shop.
In the early 1900s, the town began to decline due to the decline of the railroad industry. The town was revitalized in the 1950s, when the Ozark National Forest was established. The town is now a popular destination for tourists, who come to enjoy the natural beauty of the Ozark Mountains.
Common Questions
What is Per Capita Income in Midway?
Per Capita income in Midway is $28,307.
What is the Median Family Income in Midway?
Median Family Income in Midway is $82,500.
What is the Median Household income in Midway?
Median Household Income in Midway is $76,161.
What is Income or Wage Gap in Midway?
Income or Wage Gap in Midway is 11.7%.
Women in Midway earn 88.3 cents for every dollar earned by a man.
What is Inequality or Gini Index in Midway?
Inequality or Gini Index in Midway is 0.36.
What is the Total Population of Midway?
Total Population of Midway is 754.
What is the Total Male Population of Midway?
Total Male Population of Midway is 444.
What is the Total Female Population of Midway?
Total Female Population of Midway is 310.
What is the Ratio of Males per 100 Females in Midway?
There are 143.23 Males per 100 Females in Midway.
What is the Ratio of Females per 100 Males in Midway?
There are 69.82 Females per 100 Males in Midway.
What is the Median Population Age in Midway?
Median Population Age in Midway is 43.3 Years.
What is the Average Family Size in Midway
Average Family Size in Midway is 3.5 People.
What is the Average Household Size in Midway
Average Household Size in Midway is 3.2 People.
How Large is the Labor Force in Midway?
There are 426 People in the Labor Forcein in Midway.
What is the Percentage of People in the Labor Force in Midway?
62.3% of People are in the Labor Force in Midway.