Zip Codes with the Highest Poverty Level Among Females Between Ages 18 and 24 in Spokane, WA
RELATED REPORTS & OPTIONS
Highest Poverty | Female 18-24
Spokane
Compare Zip Codes
Map of Zip Codes with the Highest Poverty Level Among Females Between Ages 18 and 24 in Spokane
8.1%
57.1%
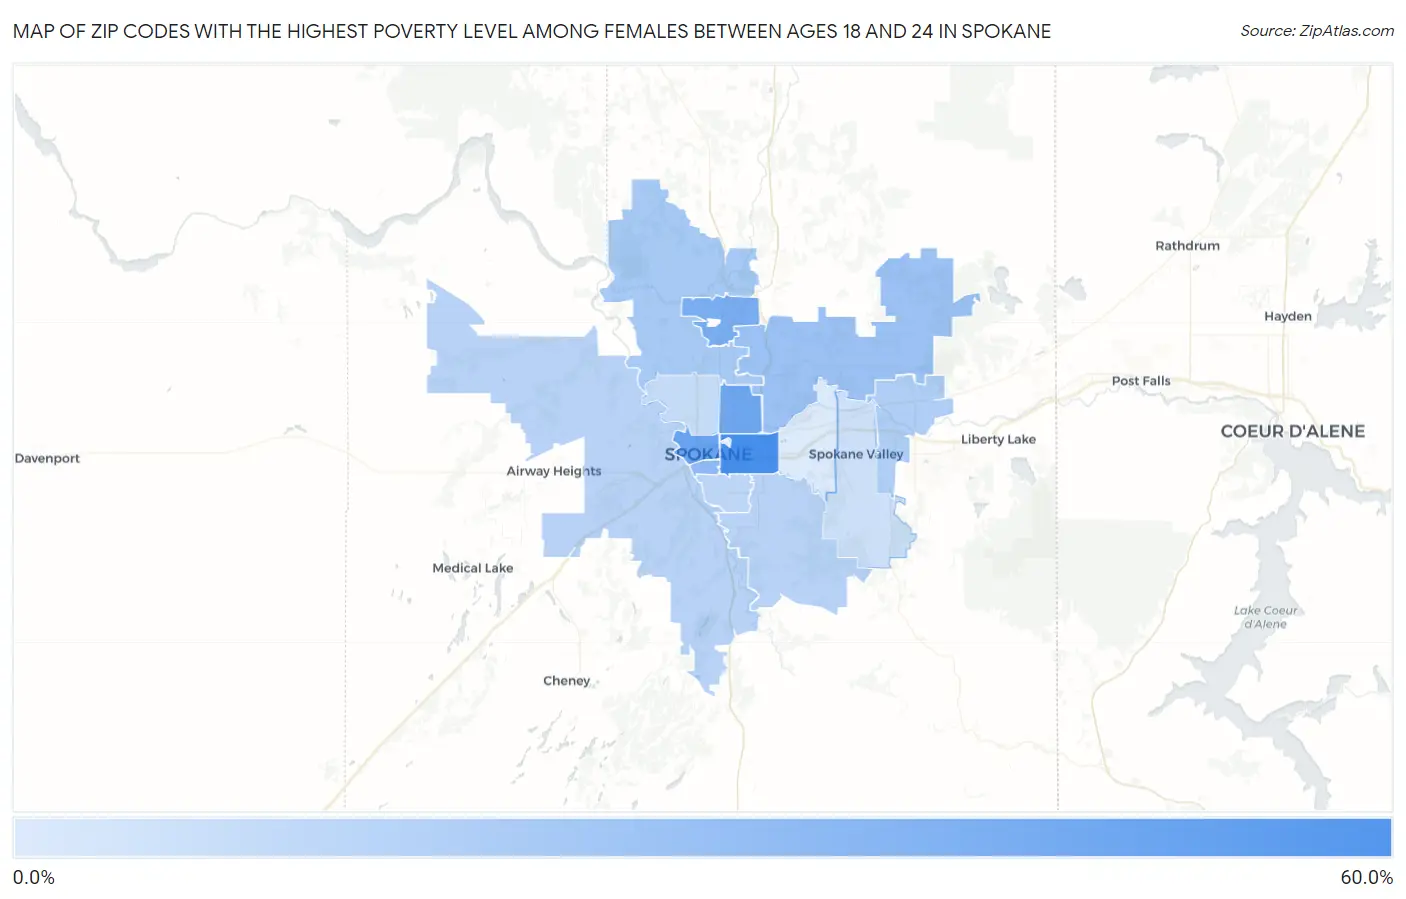
Zip Codes with the Highest Poverty Level Among Females Between Ages 18 and 24 in Spokane, WA
| Zip Code | Female Poverty | vs State | vs National | |
| 1. | 99202 | 57.1% | 19.2%(+37.9)#26 | 21.6%(+35.5)#1,948 |
| 2. | 99201 | 45.0% | 19.2%(+25.9)#46 | 21.6%(+23.4)#3,167 |
| 3. | 99207 | 42.2% | 19.2%(+23.0)#51 | 21.6%(+20.6)#3,579 |
| 4. | 99218 | 38.8% | 19.2%(+19.6)#58 | 21.6%(+17.2)#4,173 |
| 5. | 99204 | 31.4% | 19.2%(+12.2)#79 | 21.6%(+9.78)#5,863 |
| 6. | 99217 | 27.8% | 19.2%(+8.58)#97 | 21.6%(+6.16)#7,010 |
| 7. | 99208 | 23.0% | 19.2%(+3.87)#125 | 21.6%(+1.44)#8,782 |
| 8. | 99216 | 20.8% | 19.2%(+1.64)#150 | 21.6%(-0.789)#9,809 |
| 9. | 99223 | 18.4% | 19.2%(-0.740)#171 | 21.6%(-3.16)#10,987 |
| 10. | 99224 | 18.4% | 19.2%(-0.743)#172 | 21.6%(-3.17)#10,989 |
| 11. | 99203 | 17.1% | 19.2%(-2.10)#186 | 21.6%(-4.52)#11,732 |
| 12. | 99205 | 14.7% | 19.2%(-4.47)#213 | 21.6%(-6.89)#13,059 |
| 13. | 99206 | 12.7% | 19.2%(-6.52)#239 | 21.6%(-8.94)#14,265 |
| 14. | 99212 | 8.1% | 19.2%(-11.1)#313 | 21.6%(-13.5)#17,191 |
1
Common Questions
What are the Top 10 Zip Codes with the Highest Poverty Level Among Females Between Ages 18 and 24 in Spokane, WA?
Top 10 Zip Codes with the Highest Poverty Level Among Females Between Ages 18 and 24 in Spokane, WA are:
What zip code has the Highest Poverty Level Among Females Between Ages 18 and 24 in Spokane, WA?
99202 has the Highest Poverty Level Among Females Between Ages 18 and 24 in Spokane, WA with 57.1%.
What is the Poverty Level Among Females Between Ages 18 and 24 in Spokane, WA?
Poverty Level Among Females Between Ages 18 and 24 in Spokane is 29.5%.
What is the Poverty Level Among Females Between Ages 18 and 24 in Washington?
Poverty Level Among Females Between Ages 18 and 24 in Washington is 19.2%.
What is the Poverty Level Among Females Between Ages 18 and 24 in the United States?
Poverty Level Among Females Between Ages 18 and 24 in the United States is 21.6%.