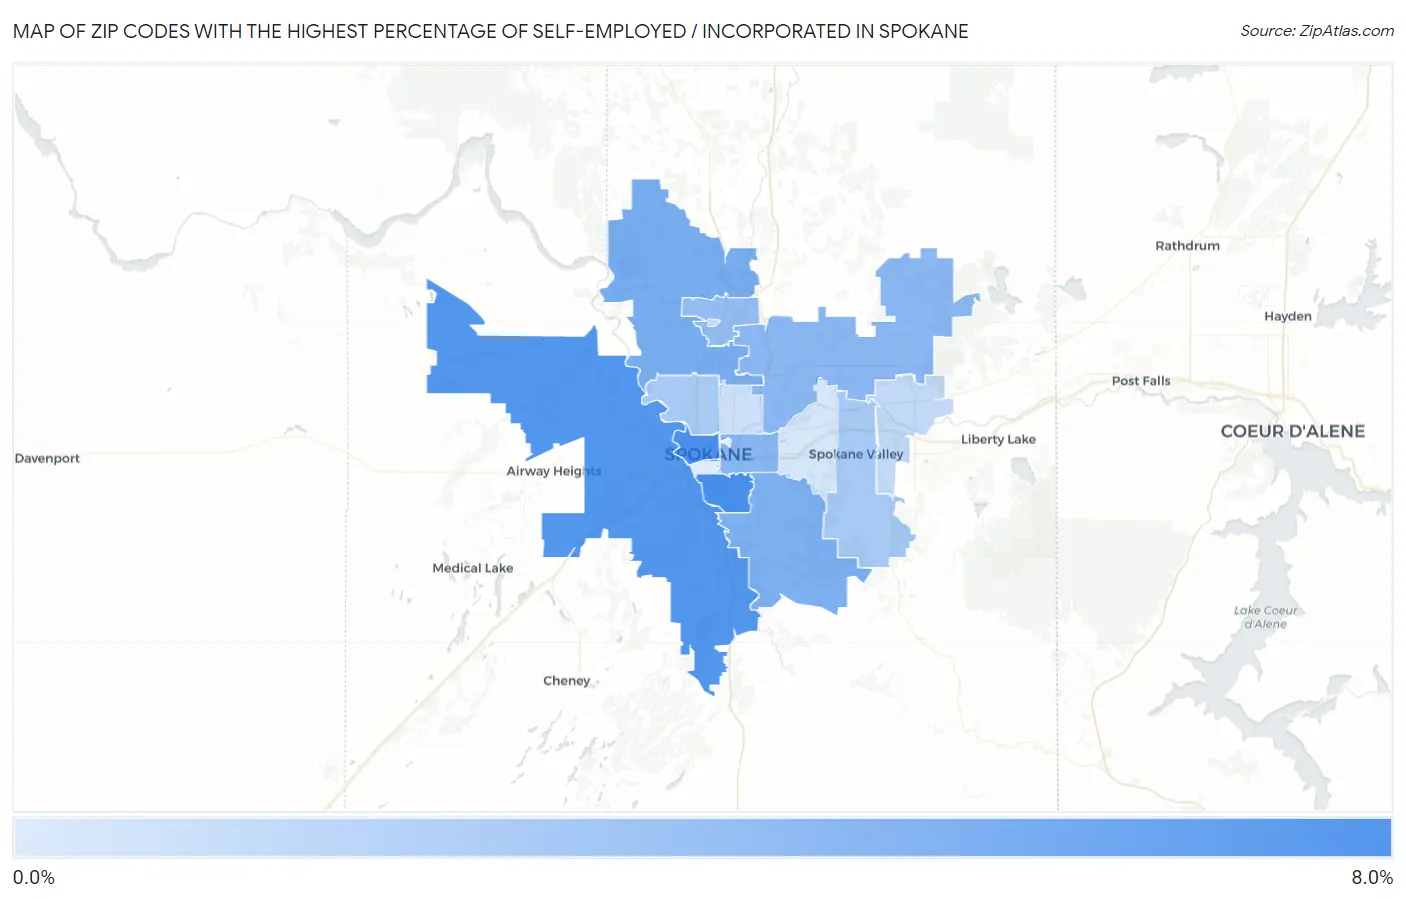
Zip Codes with the Highest Percentage of Self-Employed / Incorporated in Spokane, WA
RELATED REPORTS & OPTIONS
Self-Employed / Incorporated
Spokane
Compare Zip Codes
Map of Zip Codes with the Highest Percentage of Self-Employed / Incorporated in Spokane
0.0%
8.0%
Zip Codes with the Highest Percentage of Self-Employed / Incorporated in Spokane, WA
| Zip Code | % Self-Employed / Incorporated | vs State | vs National | |
| 1. | 99203 | 6.7% | 4.0%(+2.78)#126 | 3.8%(+2.92)#5,121 |
| 2. | 99201 | 6.7% | 4.0%(+2.70)#129 | 3.8%(+2.84)#5,254 |
| 3. | 99224 | 6.3% | 4.0%(+2.32)#142 | 3.8%(+2.46)#5,845 |
| 4. | 99208 | 5.0% | 4.0%(+0.994)#214 | 3.8%(+1.14)#8,728 |
| 5. | 99223 | 4.7% | 4.0%(+0.790)#228 | 3.8%(+0.931)#9,325 |
| 6. | 99202 | 4.4% | 4.0%(+0.441)#257 | 3.8%(+0.582)#10,442 |
| 7. | 99217 | 4.3% | 4.0%(+0.296)#267 | 3.8%(+0.437)#10,985 |
| 8. | 99218 | 4.0% | 4.0%(-0.002)#287 | 3.8%(+0.139)#12,098 |
| 9. | 99205 | 3.2% | 4.0%(-0.739)#340 | 3.8%(-0.599)#15,317 |
| 10. | 99206 | 3.2% | 4.0%(-0.779)#344 | 3.8%(-0.638)#15,500 |
| 11. | 99216 | 2.3% | 4.0%(-1.66)#422 | 3.8%(-1.52)#19,897 |
| 12. | 99251 | 2.0% | 4.0%(-1.95)#441 | 3.8%(-1.81)#21,344 |
| 13. | 99207 | 1.9% | 4.0%(-2.09)#445 | 3.8%(-1.95)#21,996 |
| 14. | 99212 | 1.5% | 4.0%(-2.42)#461 | 3.8%(-2.28)#23,336 |
| 15. | 99204 | 1.3% | 4.0%(-2.67)#477 | 3.8%(-2.53)#24,291 |
1
Common Questions
What are the Top 10 Zip Codes with the Highest Percentage of Self-Employed / Incorporated in Spokane, WA?
Top 10 Zip Codes with the Highest Percentage of Self-Employed / Incorporated in Spokane, WA are:
What zip code has the Highest Percentage of Self-Employed / Incorporated in Spokane, WA?
99203 has the Highest Percentage of Self-Employed / Incorporated in Spokane, WA with 6.7%.
What is the Percentage of Self-Employed / Incorporated in Spokane, WA?
Percentage of Self-Employed / Incorporated in Spokane is 3.9%.
What is the Percentage of Self-Employed / Incorporated in Washington?
Percentage of Self-Employed / Incorporated in Washington is 4.0%.
What is the Percentage of Self-Employed / Incorporated in the United States?
Percentage of Self-Employed / Incorporated in the United States is 3.8%.