Ukrainian vs Okinawan 1 or more Vehicles in Household
COMPARE
Ukrainian
Okinawan
1 or more Vehicles in Household
1 or more Vehicles in Household Comparison
Ukrainians
Okinawans
89.6%
1 OR MORE VEHICLES IN HOUSEHOLD
42.4/ 100
METRIC RATING
182nd/ 347
METRIC RANK
86.1%
1 OR MORE VEHICLES IN HOUSEHOLD
0.0/ 100
METRIC RATING
292nd/ 347
METRIC RANK
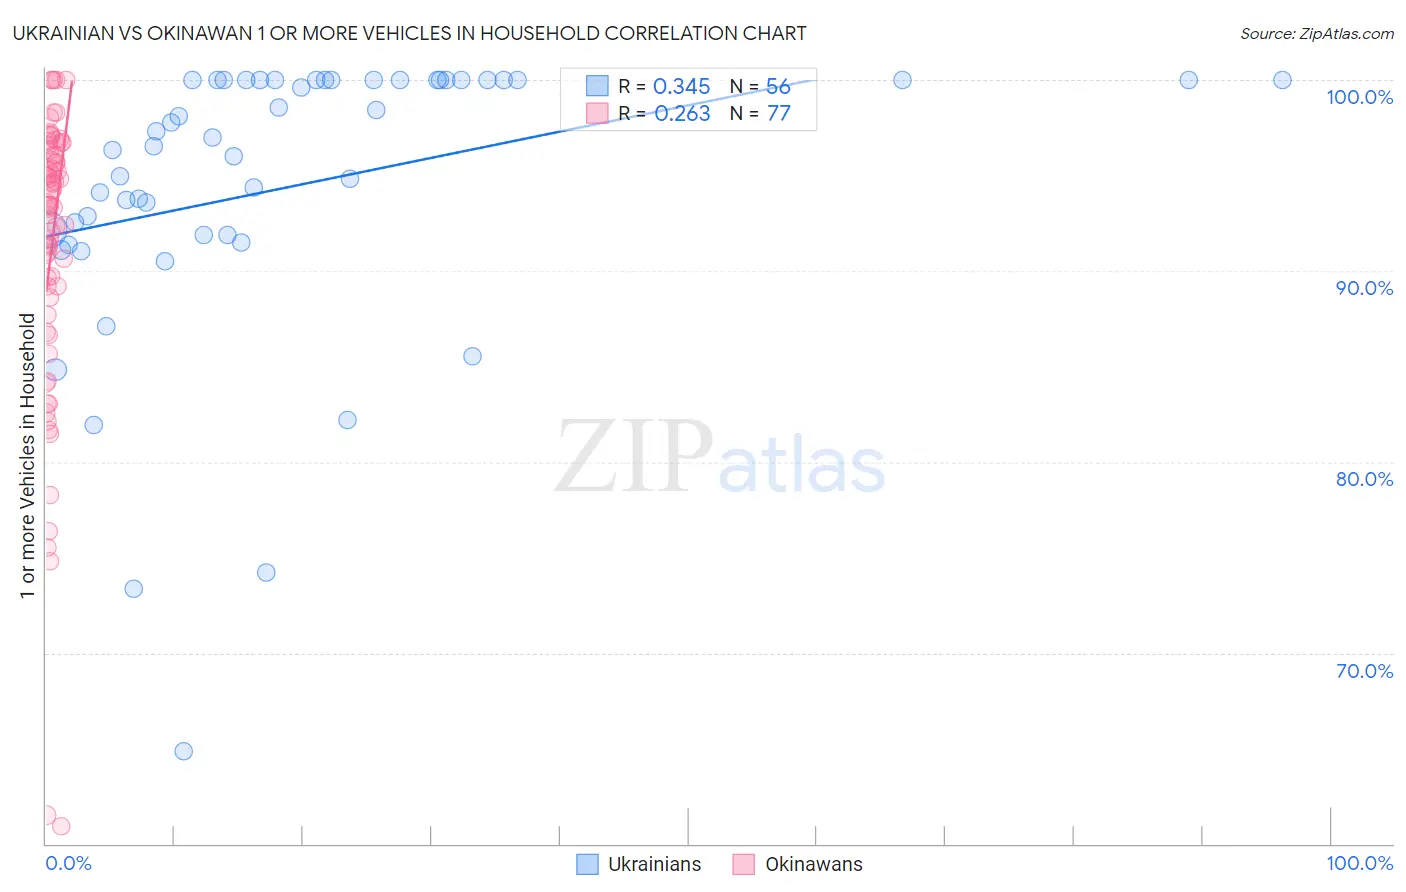
Ukrainian vs Okinawan 1 or more Vehicles in Household Correlation Chart
The statistical analysis conducted on geographies consisting of 448,299,681 people shows a mild positive correlation between the proportion of Ukrainians and percentage of households with 1 or more vehicles available in the United States with a correlation coefficient (R) of 0.345 and weighted average of 89.6%. Similarly, the statistical analysis conducted on geographies consisting of 73,660,740 people shows a weak positive correlation between the proportion of Okinawans and percentage of households with 1 or more vehicles available in the United States with a correlation coefficient (R) of 0.263 and weighted average of 86.1%, a difference of 4.1%.
1 or more Vehicles in Household Correlation Summary
| Measurement | Ukrainian | Okinawan |
| Minimum | 64.9% | 60.9% |
| Maximum | 100.0% | 100.0% |
| Range | 35.1% | 39.1% |
| Mean | 94.4% | 91.2% |
| Median | 96.8% | 93.4% |
| Interquartile 25% (IQ1) | 91.9% | 88.9% |
| Interquartile 75% (IQ3) | 100.0% | 96.2% |
| Interquartile Range (IQR) | 8.1% | 7.3% |
| Standard Deviation (Sample) | 7.5% | 7.8% |
| Standard Deviation (Population) | 7.4% | 7.7% |
Similar Demographics by 1 or more Vehicles in Household
Demographics Similar to Ukrainians by 1 or more Vehicles in Household
In terms of 1 or more vehicles in household, the demographic groups most similar to Ukrainians are Immigrants from Ethiopia (89.6%, a difference of 0.0%), Arab (89.6%, a difference of 0.010%), Ethiopian (89.6%, a difference of 0.020%), Immigrants from El Salvador (89.6%, a difference of 0.030%), and German Russian (89.6%, a difference of 0.030%).
| Demographics | Rating | Rank | 1 or more Vehicles in Household |
| Immigrants | Burma/Myanmar | 47.6 /100 | #175 | Average 89.7% |
| Immigrants | Sudan | 47.1 /100 | #176 | Average 89.7% |
| Hmong | 45.8 /100 | #177 | Average 89.6% |
| Immigrants | El Salvador | 44.1 /100 | #178 | Average 89.6% |
| German Russians | 44.0 /100 | #179 | Average 89.6% |
| Arabs | 43.3 /100 | #180 | Average 89.6% |
| Immigrants | Ethiopia | 42.5 /100 | #181 | Average 89.6% |
| Ukrainians | 42.4 /100 | #182 | Average 89.6% |
| Ethiopians | 41.2 /100 | #183 | Average 89.6% |
| Immigrants | Bulgaria | 40.7 /100 | #184 | Average 89.6% |
| Immigrants | Brazil | 40.1 /100 | #185 | Average 89.6% |
| Pueblo | 39.9 /100 | #186 | Fair 89.6% |
| South Americans | 39.6 /100 | #187 | Fair 89.5% |
| Immigrants | Nepal | 38.9 /100 | #188 | Fair 89.5% |
| Carpatho Rusyns | 37.8 /100 | #189 | Fair 89.5% |
Demographics Similar to Okinawans by 1 or more Vehicles in Household
In terms of 1 or more vehicles in household, the demographic groups most similar to Okinawans are Indian (Asian) (86.0%, a difference of 0.060%), Alaskan Athabascan (86.0%, a difference of 0.13%), Pima (86.3%, a difference of 0.23%), Immigrants from Jamaica (85.8%, a difference of 0.30%), and Immigrants from Australia (86.4%, a difference of 0.31%).
| Demographics | Rating | Rank | 1 or more Vehicles in Household |
| Immigrants | Kazakhstan | 0.0 /100 | #285 | Tragic 86.6% |
| Immigrants | Eastern Asia | 0.0 /100 | #286 | Tragic 86.5% |
| Immigrants | Malaysia | 0.0 /100 | #287 | Tragic 86.5% |
| Hopi | 0.0 /100 | #288 | Tragic 86.4% |
| Immigrants | Ireland | 0.0 /100 | #289 | Tragic 86.4% |
| Immigrants | Australia | 0.0 /100 | #290 | Tragic 86.4% |
| Pima | 0.0 /100 | #291 | Tragic 86.3% |
| Okinawans | 0.0 /100 | #292 | Tragic 86.1% |
| Indians (Asian) | 0.0 /100 | #293 | Tragic 86.0% |
| Alaskan Athabascans | 0.0 /100 | #294 | Tragic 86.0% |
| Immigrants | Jamaica | 0.0 /100 | #295 | Tragic 85.8% |
| Immigrants | Spain | 0.0 /100 | #296 | Tragic 85.8% |
| Paraguayans | 0.0 /100 | #297 | Tragic 85.7% |
| Belizeans | 0.0 /100 | #298 | Tragic 85.7% |
| Yuman | 0.0 /100 | #299 | Tragic 85.5% |