Ukrainian vs Cape Verdean 1 or more Vehicles in Household
COMPARE
Ukrainian
Cape Verdean
1 or more Vehicles in Household
1 or more Vehicles in Household Comparison
Ukrainians
Cape Verdeans
89.6%
1 OR MORE VEHICLES IN HOUSEHOLD
42.4/ 100
METRIC RATING
182nd/ 347
METRIC RANK
84.5%
1 OR MORE VEHICLES IN HOUSEHOLD
0.0/ 100
METRIC RATING
312th/ 347
METRIC RANK
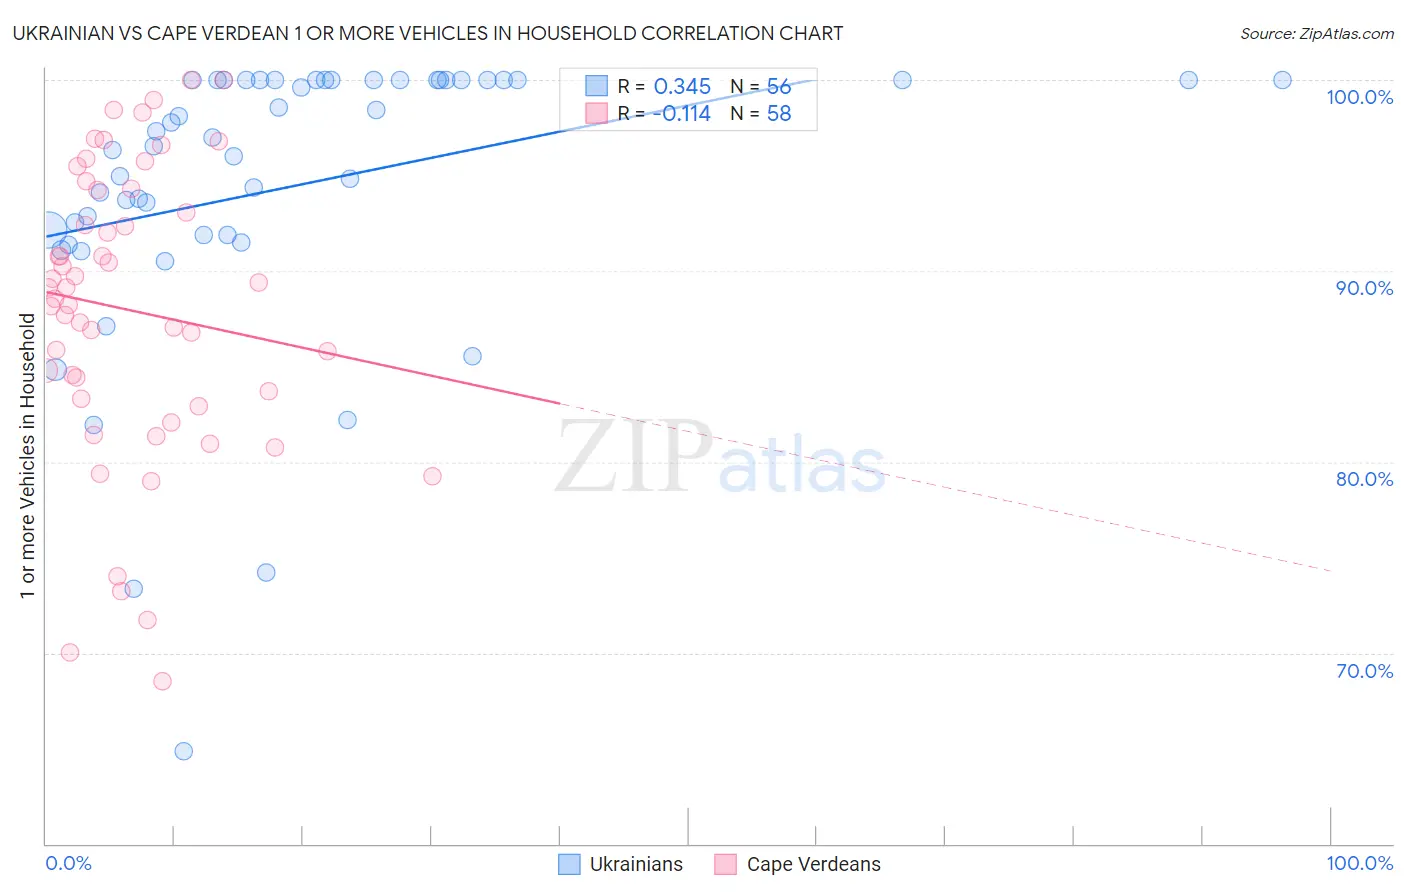
Ukrainian vs Cape Verdean 1 or more Vehicles in Household Correlation Chart
The statistical analysis conducted on geographies consisting of 448,299,681 people shows a mild positive correlation between the proportion of Ukrainians and percentage of households with 1 or more vehicles available in the United States with a correlation coefficient (R) of 0.345 and weighted average of 89.6%. Similarly, the statistical analysis conducted on geographies consisting of 107,533,487 people shows a poor negative correlation between the proportion of Cape Verdeans and percentage of households with 1 or more vehicles available in the United States with a correlation coefficient (R) of -0.114 and weighted average of 84.5%, a difference of 6.0%.
1 or more Vehicles in Household Correlation Summary
| Measurement | Ukrainian | Cape Verdean |
| Minimum | 64.9% | 68.5% |
| Maximum | 100.0% | 100.0% |
| Range | 35.1% | 31.5% |
| Mean | 94.4% | 87.9% |
| Median | 96.8% | 88.8% |
| Interquartile 25% (IQ1) | 91.9% | 83.3% |
| Interquartile 75% (IQ3) | 100.0% | 94.3% |
| Interquartile Range (IQR) | 8.1% | 10.9% |
| Standard Deviation (Sample) | 7.5% | 7.6% |
| Standard Deviation (Population) | 7.4% | 7.6% |
Similar Demographics by 1 or more Vehicles in Household
Demographics Similar to Ukrainians by 1 or more Vehicles in Household
In terms of 1 or more vehicles in household, the demographic groups most similar to Ukrainians are Immigrants from Ethiopia (89.6%, a difference of 0.0%), Arab (89.6%, a difference of 0.010%), Ethiopian (89.6%, a difference of 0.020%), Immigrants from El Salvador (89.6%, a difference of 0.030%), and German Russian (89.6%, a difference of 0.030%).
| Demographics | Rating | Rank | 1 or more Vehicles in Household |
| Immigrants | Burma/Myanmar | 47.6 /100 | #175 | Average 89.7% |
| Immigrants | Sudan | 47.1 /100 | #176 | Average 89.7% |
| Hmong | 45.8 /100 | #177 | Average 89.6% |
| Immigrants | El Salvador | 44.1 /100 | #178 | Average 89.6% |
| German Russians | 44.0 /100 | #179 | Average 89.6% |
| Arabs | 43.3 /100 | #180 | Average 89.6% |
| Immigrants | Ethiopia | 42.5 /100 | #181 | Average 89.6% |
| Ukrainians | 42.4 /100 | #182 | Average 89.6% |
| Ethiopians | 41.2 /100 | #183 | Average 89.6% |
| Immigrants | Bulgaria | 40.7 /100 | #184 | Average 89.6% |
| Immigrants | Brazil | 40.1 /100 | #185 | Average 89.6% |
| Pueblo | 39.9 /100 | #186 | Fair 89.6% |
| South Americans | 39.6 /100 | #187 | Fair 89.5% |
| Immigrants | Nepal | 38.9 /100 | #188 | Fair 89.5% |
| Carpatho Rusyns | 37.8 /100 | #189 | Fair 89.5% |
Demographics Similar to Cape Verdeans by 1 or more Vehicles in Household
In terms of 1 or more vehicles in household, the demographic groups most similar to Cape Verdeans are Immigrants from Israel (84.5%, a difference of 0.020%), Albanian (84.4%, a difference of 0.090%), Puerto Rican (84.6%, a difference of 0.11%), U.S. Virgin Islander (84.6%, a difference of 0.15%), and Cypriot (84.4%, a difference of 0.16%).
| Demographics | Rating | Rank | 1 or more Vehicles in Household |
| Immigrants | China | 0.0 /100 | #305 | Tragic 84.9% |
| Immigrants | Western Africa | 0.0 /100 | #306 | Tragic 84.9% |
| Tohono O'odham | 0.0 /100 | #307 | Tragic 84.7% |
| Immigrants | Belize | 0.0 /100 | #308 | Tragic 84.7% |
| Immigrants | Haiti | 0.0 /100 | #309 | Tragic 84.7% |
| U.S. Virgin Islanders | 0.0 /100 | #310 | Tragic 84.6% |
| Puerto Ricans | 0.0 /100 | #311 | Tragic 84.6% |
| Cape Verdeans | 0.0 /100 | #312 | Tragic 84.5% |
| Immigrants | Israel | 0.0 /100 | #313 | Tragic 84.5% |
| Albanians | 0.0 /100 | #314 | Tragic 84.4% |
| Cypriots | 0.0 /100 | #315 | Tragic 84.4% |
| Alaska Natives | 0.0 /100 | #316 | Tragic 83.8% |
| Ghanaians | 0.0 /100 | #317 | Tragic 83.6% |
| Immigrants | Ghana | 0.0 /100 | #318 | Tragic 83.4% |
| Immigrants | Belarus | 0.0 /100 | #319 | Tragic 83.3% |