Tongan vs Estonian 1 or more Vehicles in Household
COMPARE
Tongan
Estonian
1 or more Vehicles in Household
1 or more Vehicles in Household Comparison
Tongans
Estonians
92.9%
1 OR MORE VEHICLES IN HOUSEHOLD
100.0/ 100
METRIC RATING
19th/ 347
METRIC RANK
90.3%
1 OR MORE VEHICLES IN HOUSEHOLD
85.6/ 100
METRIC RATING
139th/ 347
METRIC RANK
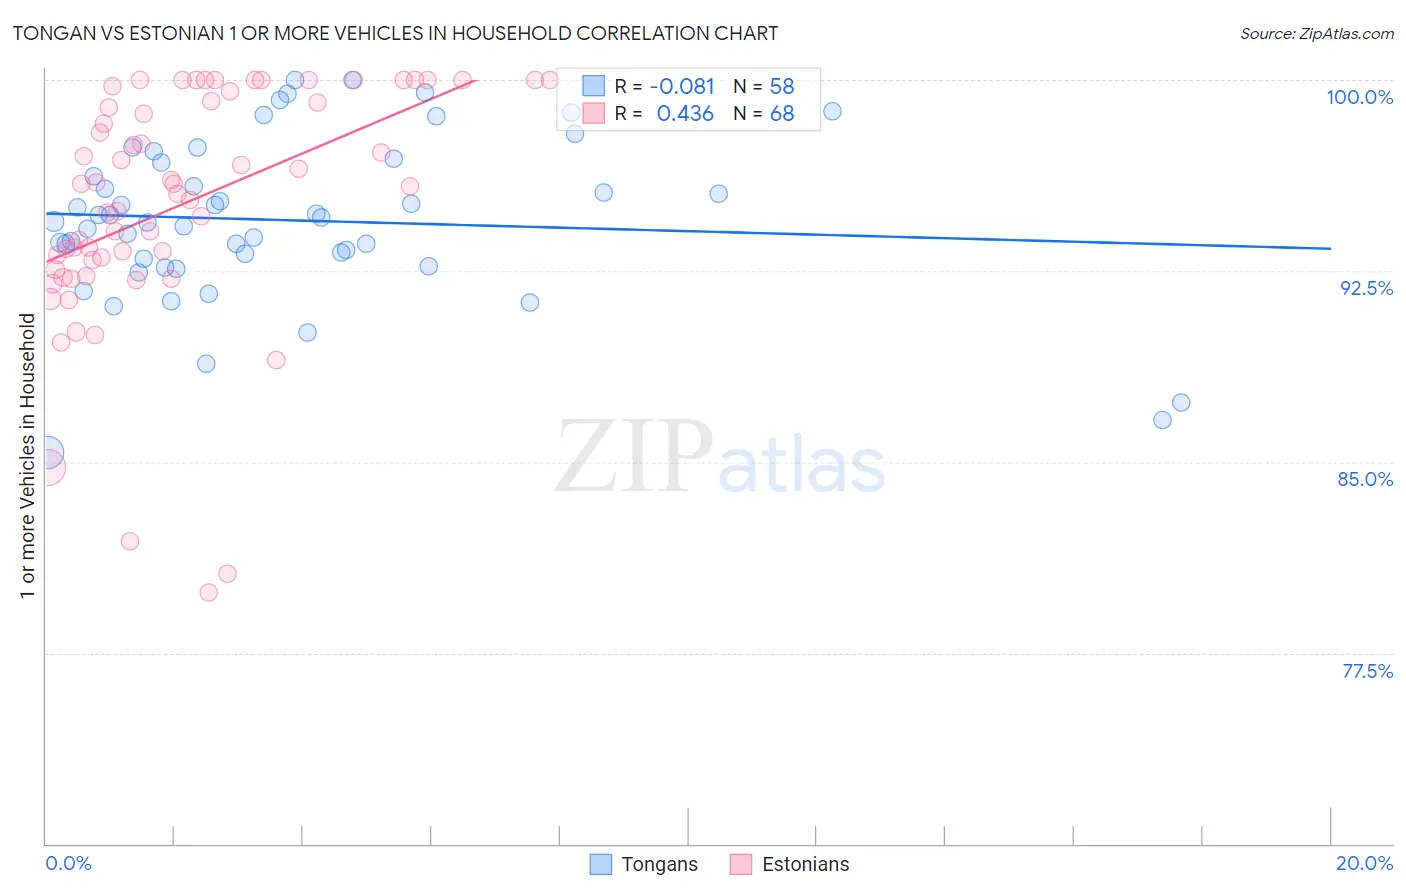
Tongan vs Estonian 1 or more Vehicles in Household Correlation Chart
The statistical analysis conducted on geographies consisting of 102,873,244 people shows a slight negative correlation between the proportion of Tongans and percentage of households with 1 or more vehicles available in the United States with a correlation coefficient (R) of -0.081 and weighted average of 92.9%. Similarly, the statistical analysis conducted on geographies consisting of 123,503,955 people shows a moderate positive correlation between the proportion of Estonians and percentage of households with 1 or more vehicles available in the United States with a correlation coefficient (R) of 0.436 and weighted average of 90.3%, a difference of 2.8%.
1 or more Vehicles in Household Correlation Summary
| Measurement | Tongan | Estonian |
| Minimum | 85.4% | 79.9% |
| Maximum | 100.0% | 100.0% |
| Range | 14.6% | 20.1% |
| Mean | 94.5% | 95.1% |
| Median | 94.5% | 95.9% |
| Interquartile 25% (IQ1) | 93.0% | 92.7% |
| Interquartile 75% (IQ3) | 96.7% | 99.4% |
| Interquartile Range (IQR) | 3.7% | 6.6% |
| Standard Deviation (Sample) | 3.2% | 4.7% |
| Standard Deviation (Population) | 3.2% | 4.6% |
Similar Demographics by 1 or more Vehicles in Household
Demographics Similar to Tongans by 1 or more Vehicles in Household
In terms of 1 or more vehicles in household, the demographic groups most similar to Tongans are Welsh (93.0%, a difference of 0.12%), European (93.0%, a difference of 0.15%), Arapaho (92.7%, a difference of 0.17%), Mexican (93.0%, a difference of 0.18%), and Assyrian/Chaldean/Syriac (93.0%, a difference of 0.18%).
| Demographics | Rating | Rank | 1 or more Vehicles in Household |
| Scandinavians | 100.0 /100 | #12 | Exceptional 93.1% |
| Whites/Caucasians | 100.0 /100 | #13 | Exceptional 93.1% |
| Irish | 100.0 /100 | #14 | Exceptional 93.1% |
| Mexicans | 100.0 /100 | #15 | Exceptional 93.0% |
| Assyrians/Chaldeans/Syriacs | 100.0 /100 | #16 | Exceptional 93.0% |
| Europeans | 100.0 /100 | #17 | Exceptional 93.0% |
| Welsh | 100.0 /100 | #18 | Exceptional 93.0% |
| Tongans | 100.0 /100 | #19 | Exceptional 92.9% |
| Arapaho | 100.0 /100 | #20 | Exceptional 92.7% |
| Ottawa | 100.0 /100 | #21 | Exceptional 92.7% |
| French | 100.0 /100 | #22 | Exceptional 92.7% |
| Nepalese | 100.0 /100 | #23 | Exceptional 92.6% |
| Yaqui | 100.0 /100 | #24 | Exceptional 92.6% |
| Immigrants | Iraq | 100.0 /100 | #25 | Exceptional 92.5% |
| British | 100.0 /100 | #26 | Exceptional 92.5% |
Demographics Similar to Estonians by 1 or more Vehicles in Household
In terms of 1 or more vehicles in household, the demographic groups most similar to Estonians are Sudanese (90.3%, a difference of 0.010%), Latvian (90.3%, a difference of 0.020%), Syrian (90.3%, a difference of 0.020%), Hungarian (90.3%, a difference of 0.030%), and Kenyan (90.4%, a difference of 0.040%).
| Demographics | Rating | Rank | 1 or more Vehicles in Household |
| Immigrants | South Africa | 88.1 /100 | #132 | Excellent 90.4% |
| Immigrants | Syria | 87.5 /100 | #133 | Excellent 90.4% |
| Kenyans | 87.0 /100 | #134 | Excellent 90.4% |
| Immigrants | Oceania | 86.9 /100 | #135 | Excellent 90.4% |
| Hungarians | 86.5 /100 | #136 | Excellent 90.3% |
| Latvians | 86.3 /100 | #137 | Excellent 90.3% |
| Syrians | 86.3 /100 | #138 | Excellent 90.3% |
| Estonians | 85.6 /100 | #139 | Excellent 90.3% |
| Sudanese | 85.2 /100 | #140 | Excellent 90.3% |
| Immigrants | Moldova | 83.1 /100 | #141 | Excellent 90.2% |
| Immigrants | Lithuania | 83.0 /100 | #142 | Excellent 90.2% |
| Immigrants | Bahamas | 81.5 /100 | #143 | Excellent 90.2% |
| Immigrants | Zimbabwe | 81.5 /100 | #144 | Excellent 90.2% |
| Sioux | 81.3 /100 | #145 | Excellent 90.2% |
| Bahamians | 80.5 /100 | #146 | Excellent 90.2% |