Tongan Female Poverty Among 18-24 Year Olds
COMPARE
Tongan
Select to Compare
Female Poverty Among 18-24 Year Olds
Tongan Female Poverty Among 18-24 Year Olds
17.1%
POVERTY | FEMALES 18-24
100.0/ 100
METRIC RATING
14th/ 347
METRIC RANK
Tongan Female Poverty Among 18-24 Year Olds Correlation Chart
The statistical analysis conducted on geographies consisting of 102,459,978 people shows a mild positive correlation between the proportion of Tongans and poverty level among females between the ages 18 and 24 in the United States with a correlation coefficient (R) of 0.394 and weighted average of 17.1%. On average, for every 1% (one percent) increase in Tongans within a typical geography, there is an increase of 1.1% in poverty level among females between the ages 18 and 24.
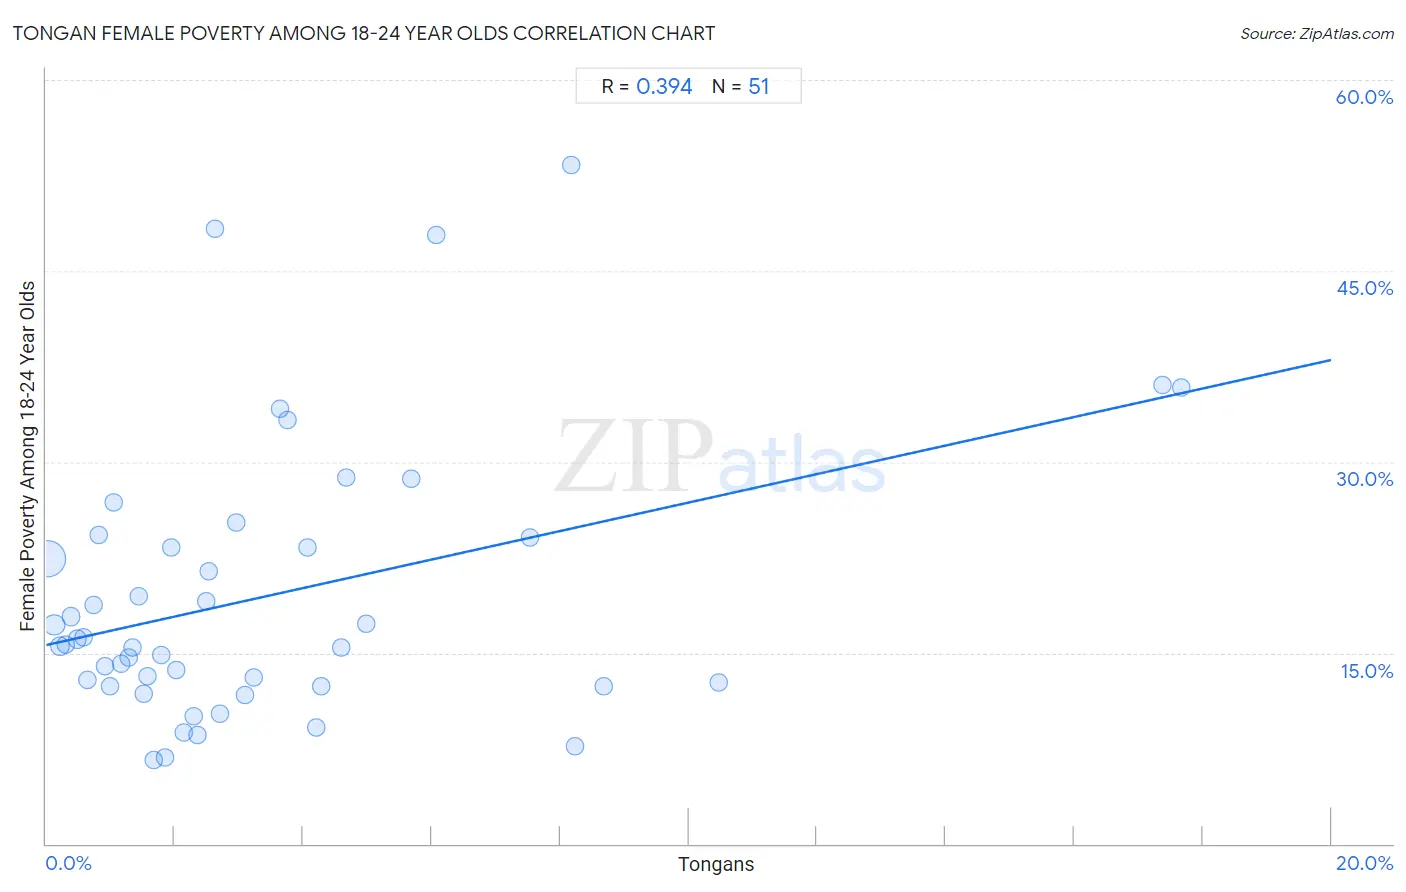
It is essential to understand that the correlation between the percentage of Tongans and poverty level among females between the ages 18 and 24 does not imply a direct cause-and-effect relationship. It remains uncertain whether the presence of Tongans influences an upward or downward trend in the level of poverty level among females between the ages 18 and 24 within an area, or if Tongans simply ended up residing in those areas with higher or lower levels of poverty level among females between the ages 18 and 24 due to other factors.
Demographics Similar to Tongans by Female Poverty Among 18-24 Year Olds
In terms of female poverty among 18-24 year olds, the demographic groups most similar to Tongans are Immigrants from Poland (17.1%, a difference of 0.17%), Cuban (17.2%, a difference of 0.28%), Peruvian (17.2%, a difference of 0.51%), Immigrants from Taiwan (17.3%, a difference of 0.75%), and Immigrants from Pakistan (17.0%, a difference of 0.83%).
| Demographics | Rating | Rank | Female Poverty Among 18-24 Year Olds |
| Immigrants from the Azores | 100.0 /100 | #7 | Exceptional 16.7% |
| Immigrants from Bolivia | 100.0 /100 | #8 | Exceptional 16.7% |
| Immigrants from Peru | 100.0 /100 | #9 | Exceptional 16.9% |
| Koreans | 100.0 /100 | #10 | Exceptional 16.9% |
| Thais | 100.0 /100 | #11 | Exceptional 17.0% |
| Immigrants from Pakistan | 100.0 /100 | #12 | Exceptional 17.0% |
| Immigrants from Poland | 100.0 /100 | #13 | Exceptional 17.1% |
| Tongans | 100.0 /100 | #14 | Exceptional 17.1% |
| Cubans | 100.0 /100 | #15 | Exceptional 17.2% |
| Peruvians | 100.0 /100 | #16 | Exceptional 17.2% |
| Immigrants from Taiwan | 100.0 /100 | #17 | Exceptional 17.3% |
| Immigrants from Colombia | 100.0 /100 | #18 | Exceptional 17.3% |
| Immigrants from Lithuania | 100.0 /100 | #19 | Exceptional 17.4% |
| Immigrants from Venezuela | 100.0 /100 | #20 | Exceptional 17.4% |
| Bolivians | 100.0 /100 | #21 | Exceptional 17.4% |
Tongan Female Poverty Among 18-24 Year Olds Correlation Summary
| Measurement | Tongan Data | Female Poverty Among 18-24 Year Olds Data |
| Minimum | 0.023% | 6.6% |
| Maximum | 17.7% | 53.3% |
| Range | 17.6% | 46.8% |
| Mean | 3.4% | 19.5% |
| Median | 2.3% | 15.7% |
| Interquartile 25% (IQ1) | 1.1% | 12.4% |
| Interquartile 75% (IQ3) | 4.3% | 24.1% |
| Interquartile Range (IQR) | 3.2% | 11.6% |
| Standard Deviation (Sample) | 3.8% | 10.7% |
| Standard Deviation (Population) | 3.7% | 10.6% |
Correlation Details
| Tongan Percentile | Sample Size | Female Poverty Among 18-24 Year Olds |
[ 0.0% - 0.5% ] 0.023% | 74,346,803 | 22.4% |
[ 0.0% - 0.5% ] 0.13% | 10,541,980 | 17.2% |
[ 0.0% - 0.5% ] 0.22% | 5,099,659 | 15.5% |
[ 0.0% - 0.5% ] 0.31% | 3,534,334 | 15.7% |
[ 0.0% - 0.5% ] 0.39% | 1,852,239 | 17.8% |
[ 0.0% - 0.5% ] 0.48% | 1,243,035 | 16.1% |
[ 0.5% - 1.0% ] 0.58% | 1,272,843 | 16.2% |
[ 0.5% - 1.0% ] 0.64% | 654,770 | 12.9% |
[ 0.5% - 1.0% ] 0.74% | 614,420 | 18.8% |
[ 0.5% - 1.0% ] 0.82% | 305,518 | 24.3% |
[ 0.5% - 1.0% ] 0.91% | 241,281 | 14.0% |
[ 1.0% - 1.5% ] 1.00% | 226,870 | 12.4% |
[ 1.0% - 1.5% ] 1.05% | 424,787 | 26.8% |
[ 1.0% - 1.5% ] 1.16% | 586,537 | 14.1% |
[ 1.0% - 1.5% ] 1.27% | 86,447 | 14.6% |
[ 1.0% - 1.5% ] 1.34% | 76,408 | 15.5% |
[ 1.0% - 1.5% ] 1.43% | 229,835 | 19.4% |
[ 1.5% - 2.0% ] 1.53% | 69,357 | 11.8% |
[ 1.5% - 2.0% ] 1.58% | 99,729 | 13.1% |
[ 1.5% - 2.0% ] 1.68% | 62,019 | 6.6% |
[ 1.5% - 2.0% ] 1.79% | 100,730 | 14.8% |
[ 1.5% - 2.0% ] 1.84% | 11,731 | 6.8% |
[ 1.5% - 2.0% ] 1.94% | 18,789 | 23.3% |
[ 2.0% - 2.5% ] 2.02% | 73,256 | 13.7% |
[ 2.0% - 2.5% ] 2.13% | 95,599 | 8.7% |
[ 2.0% - 2.5% ] 2.29% | 178,583 | 10.0% |
[ 2.0% - 2.5% ] 2.36% | 48,692 | 8.6% |
[ 2.0% - 2.5% ] 2.49% | 23,708 | 19.1% |
[ 2.5% - 3.0% ] 2.52% | 35,392 | 21.4% |
[ 2.5% - 3.0% ] 2.62% | 3,397 | 48.3% |
[ 2.5% - 3.0% ] 2.70% | 56,709 | 10.2% |
[ 2.5% - 3.0% ] 2.97% | 13,281 | 25.2% |
[ 3.0% - 3.5% ] 3.09% | 23,690 | 11.6% |
[ 3.0% - 3.5% ] 3.24% | 92,160 | 13.1% |
[ 3.5% - 4.0% ] 3.63% | 3,746 | 34.2% |
[ 3.5% - 4.0% ] 3.75% | 853 | 33.3% |
[ 4.0% - 4.5% ] 4.08% | 6,257 | 23.3% |
[ 4.0% - 4.5% ] 4.21% | 4,708 | 9.2% |
[ 4.0% - 4.5% ] 4.29% | 30,983 | 12.4% |
[ 4.5% - 5.0% ] 4.59% | 12,906 | 15.4% |
[ 4.5% - 5.0% ] 4.68% | 4,555 | 28.8% |
[ 4.5% - 5.0% ] 4.97% | 23,214 | 17.3% |
[ 5.5% - 6.0% ] 5.68% | 3,593 | 28.7% |
[ 6.0% - 6.5% ] 6.06% | 693 | 47.8% |
[ 7.5% - 8.0% ] 7.54% | 6,779 | 24.1% |
[ 8.0% - 8.5% ] 8.16% | 392 | 53.3% |
[ 8.0% - 8.5% ] 8.24% | 510 | 7.7% |
[ 8.5% - 9.0% ] 8.68% | 2,742 | 12.4% |
[ 10.0% - 10.5% ] 10.47% | 2,274 | 12.6% |
[ 17.0% - 17.5% ] 17.37% | 5,411 | 36.1% |
[ 17.5% - 18.0% ] 17.67% | 5,774 | 35.8% |