Tongan vs Cherokee 1 or more Vehicles in Household
COMPARE
Tongan
Cherokee
1 or more Vehicles in Household
1 or more Vehicles in Household Comparison
Tongans
Cherokee
92.9%
1 OR MORE VEHICLES IN HOUSEHOLD
100.0/ 100
METRIC RATING
19th/ 347
METRIC RANK
92.4%
1 OR MORE VEHICLES IN HOUSEHOLD
100.0/ 100
METRIC RATING
33rd/ 347
METRIC RANK
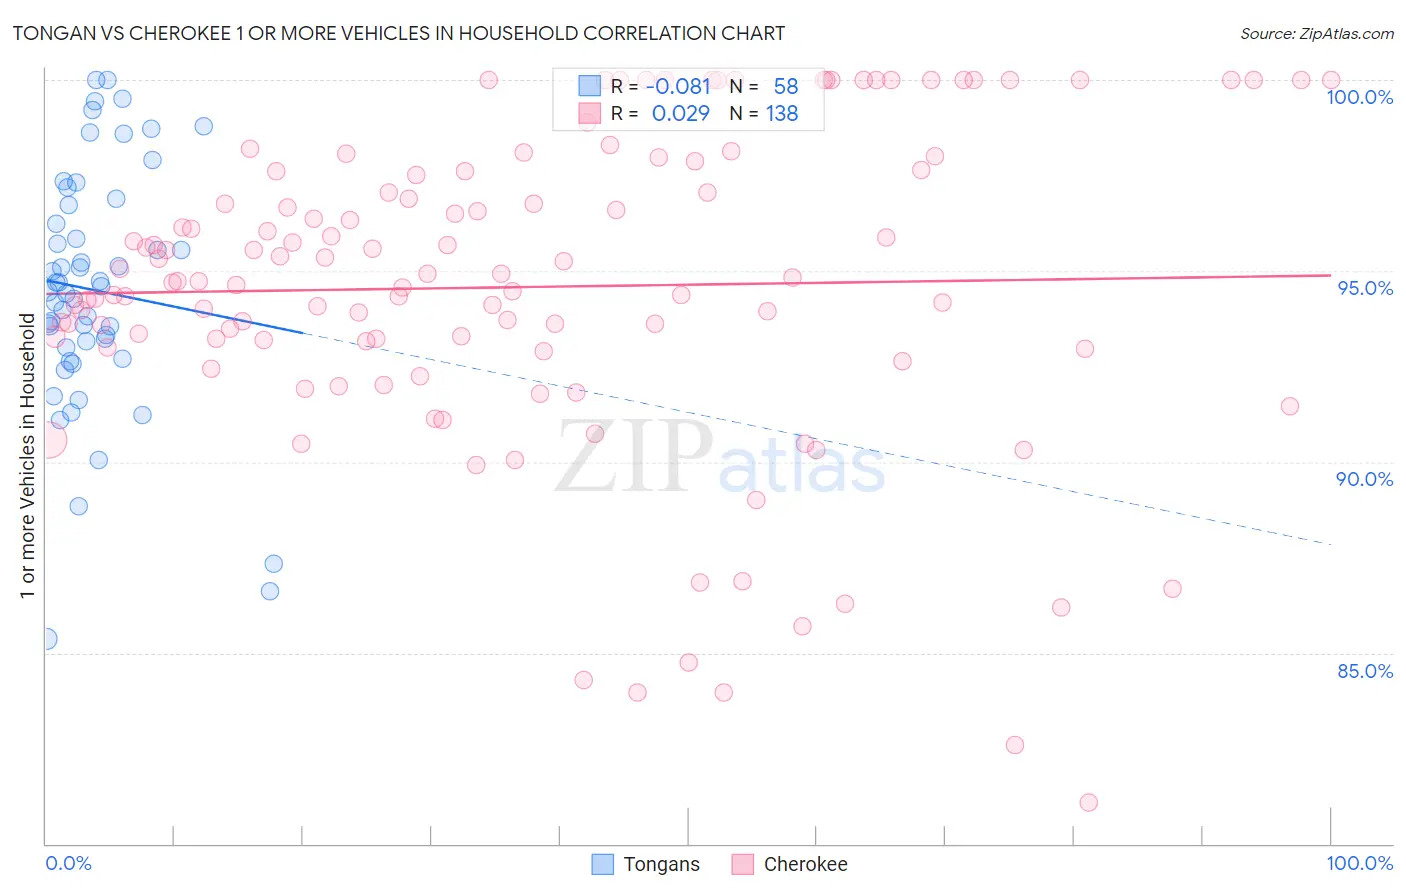
Tongan vs Cherokee 1 or more Vehicles in Household Correlation Chart
The statistical analysis conducted on geographies consisting of 102,873,244 people shows a slight negative correlation between the proportion of Tongans and percentage of households with 1 or more vehicles available in the United States with a correlation coefficient (R) of -0.081 and weighted average of 92.9%. Similarly, the statistical analysis conducted on geographies consisting of 493,431,899 people shows no correlation between the proportion of Cherokee and percentage of households with 1 or more vehicles available in the United States with a correlation coefficient (R) of 0.029 and weighted average of 92.4%, a difference of 0.52%.
1 or more Vehicles in Household Correlation Summary
| Measurement | Tongan | Cherokee |
| Minimum | 85.4% | 81.1% |
| Maximum | 100.0% | 100.0% |
| Range | 14.6% | 18.9% |
| Mean | 94.5% | 94.6% |
| Median | 94.5% | 94.7% |
| Interquartile 25% (IQ1) | 93.0% | 93.0% |
| Interquartile 75% (IQ3) | 96.7% | 97.6% |
| Interquartile Range (IQR) | 3.7% | 4.6% |
| Standard Deviation (Sample) | 3.2% | 4.1% |
| Standard Deviation (Population) | 3.2% | 4.1% |
Demographics Similar to Tongans and Cherokee by 1 or more Vehicles in Household
In terms of 1 or more vehicles in household, the demographic groups most similar to Tongans are Welsh (93.0%, a difference of 0.12%), European (93.0%, a difference of 0.15%), Arapaho (92.7%, a difference of 0.17%), Assyrian/Chaldean/Syriac (93.0%, a difference of 0.18%), and Ottawa (92.7%, a difference of 0.18%). Similarly, the demographic groups most similar to Cherokee are Basque (92.4%, a difference of 0.010%), Samoan (92.4%, a difference of 0.050%), Native Hawaiian (92.4%, a difference of 0.060%), Finnish (92.4%, a difference of 0.060%), and Sri Lankan (92.5%, a difference of 0.070%).
| Demographics | Rating | Rank | 1 or more Vehicles in Household |
| Assyrians/Chaldeans/Syriacs | 100.0 /100 | #16 | Exceptional 93.0% |
| Europeans | 100.0 /100 | #17 | Exceptional 93.0% |
| Welsh | 100.0 /100 | #18 | Exceptional 93.0% |
| Tongans | 100.0 /100 | #19 | Exceptional 92.9% |
| Arapaho | 100.0 /100 | #20 | Exceptional 92.7% |
| Ottawa | 100.0 /100 | #21 | Exceptional 92.7% |
| French | 100.0 /100 | #22 | Exceptional 92.7% |
| Nepalese | 100.0 /100 | #23 | Exceptional 92.6% |
| Yaqui | 100.0 /100 | #24 | Exceptional 92.6% |
| Immigrants | Iraq | 100.0 /100 | #25 | Exceptional 92.5% |
| British | 100.0 /100 | #26 | Exceptional 92.5% |
| Americans | 100.0 /100 | #27 | Exceptional 92.5% |
| Sri Lankans | 100.0 /100 | #28 | Exceptional 92.5% |
| Native Hawaiians | 100.0 /100 | #29 | Exceptional 92.4% |
| Finns | 100.0 /100 | #30 | Exceptional 92.4% |
| Samoans | 100.0 /100 | #31 | Exceptional 92.4% |
| Basques | 100.0 /100 | #32 | Exceptional 92.4% |
| Cherokee | 100.0 /100 | #33 | Exceptional 92.4% |
| Italians | 99.9 /100 | #34 | Exceptional 92.3% |
| Czechoslovakians | 99.9 /100 | #35 | Exceptional 92.3% |
| Malaysians | 99.9 /100 | #36 | Exceptional 92.3% |