Paiute vs Immigrants from Cabo Verde 1 or more Vehicles in Household
COMPARE
Paiute
Immigrants from Cabo Verde
1 or more Vehicles in Household
1 or more Vehicles in Household Comparison
Paiute
Immigrants from Cabo Verde
88.6%
1 OR MORE VEHICLES IN HOUSEHOLD
4.6/ 100
METRIC RATING
235th/ 347
METRIC RANK
81.6%
1 OR MORE VEHICLES IN HOUSEHOLD
0.0/ 100
METRIC RATING
322nd/ 347
METRIC RANK
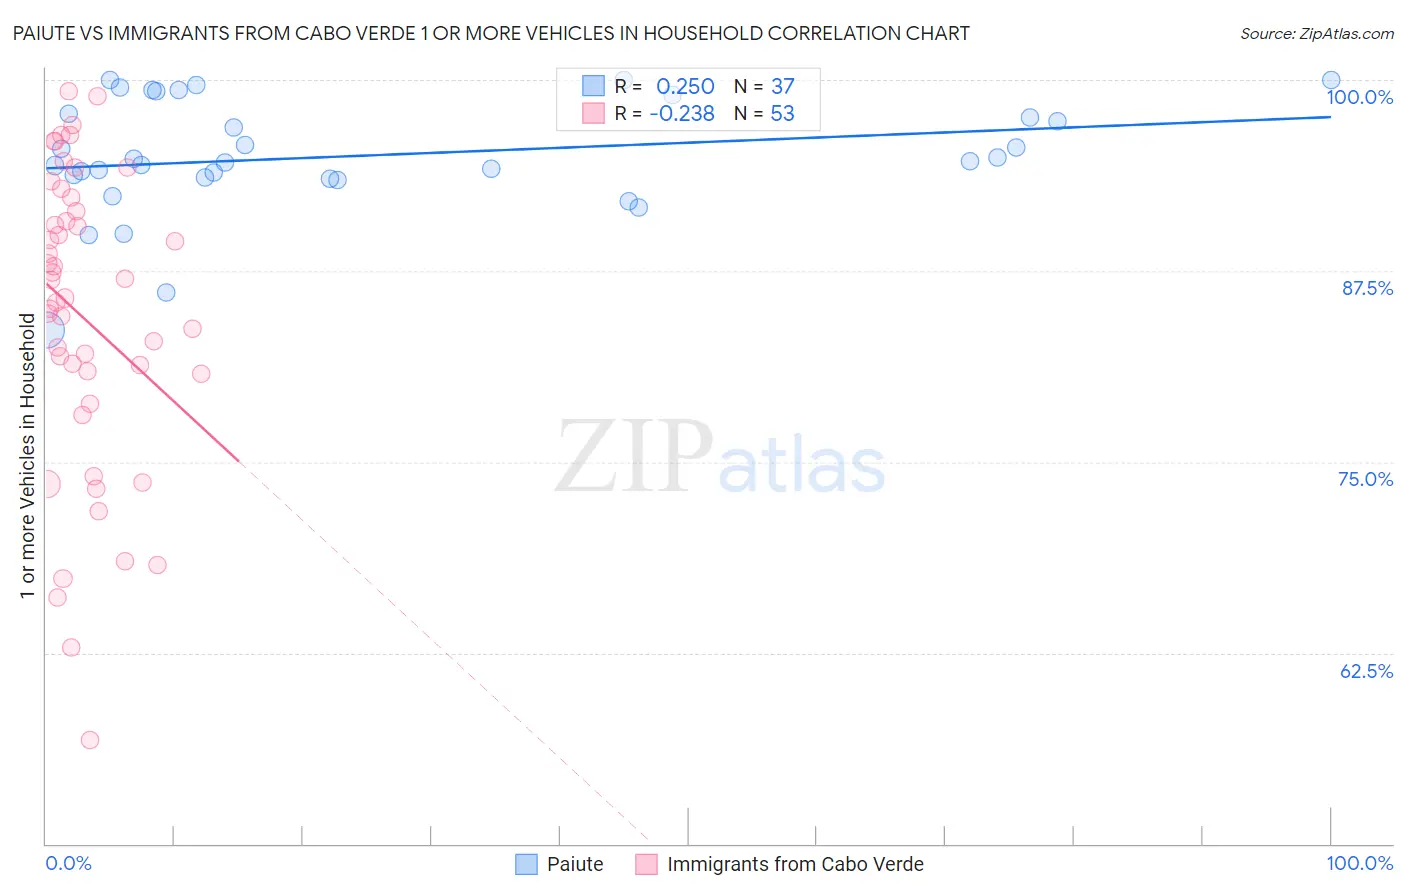
Paiute vs Immigrants from Cabo Verde 1 or more Vehicles in Household Correlation Chart
The statistical analysis conducted on geographies consisting of 58,397,300 people shows a weak positive correlation between the proportion of Paiute and percentage of households with 1 or more vehicles available in the United States with a correlation coefficient (R) of 0.250 and weighted average of 88.6%. Similarly, the statistical analysis conducted on geographies consisting of 38,145,332 people shows a weak negative correlation between the proportion of Immigrants from Cabo Verde and percentage of households with 1 or more vehicles available in the United States with a correlation coefficient (R) of -0.238 and weighted average of 81.6%, a difference of 8.6%.
1 or more Vehicles in Household Correlation Summary
| Measurement | Paiute | Immigrants from Cabo Verde |
| Minimum | 83.6% | 56.8% |
| Maximum | 100.0% | 99.3% |
| Range | 16.4% | 42.5% |
| Mean | 95.0% | 84.4% |
| Median | 94.6% | 85.7% |
| Interquartile 25% (IQ1) | 93.6% | 79.8% |
| Interquartile 75% (IQ3) | 98.4% | 91.9% |
| Interquartile Range (IQR) | 4.8% | 12.1% |
| Standard Deviation (Sample) | 3.8% | 9.9% |
| Standard Deviation (Population) | 3.7% | 9.8% |
Similar Demographics by 1 or more Vehicles in Household
Demographics Similar to Paiute by 1 or more Vehicles in Household
In terms of 1 or more vehicles in household, the demographic groups most similar to Paiute are Immigrants from Peru (88.6%, a difference of 0.0%), Houma (88.6%, a difference of 0.010%), Immigrants from Pakistan (88.6%, a difference of 0.010%), Immigrants from Turkey (88.6%, a difference of 0.020%), and Russian (88.7%, a difference of 0.030%).
| Demographics | Rating | Rank | 1 or more Vehicles in Household |
| Immigrants | Norway | 5.5 /100 | #228 | Tragic 88.7% |
| Immigrants | Romania | 5.4 /100 | #229 | Tragic 88.7% |
| Immigrants | Sierra Leone | 5.2 /100 | #230 | Tragic 88.7% |
| Russians | 5.0 /100 | #231 | Tragic 88.7% |
| Immigrants | Japan | 4.9 /100 | #232 | Tragic 88.7% |
| Houma | 4.8 /100 | #233 | Tragic 88.6% |
| Immigrants | Peru | 4.7 /100 | #234 | Tragic 88.6% |
| Paiute | 4.6 /100 | #235 | Tragic 88.6% |
| Immigrants | Pakistan | 4.5 /100 | #236 | Tragic 88.6% |
| Immigrants | Turkey | 4.4 /100 | #237 | Tragic 88.6% |
| Immigrants | Somalia | 4.2 /100 | #238 | Tragic 88.6% |
| Kiowa | 3.8 /100 | #239 | Tragic 88.6% |
| Eastern Europeans | 3.0 /100 | #240 | Tragic 88.5% |
| Taiwanese | 2.6 /100 | #241 | Tragic 88.4% |
| Turks | 2.5 /100 | #242 | Tragic 88.4% |
Demographics Similar to Immigrants from Cabo Verde by 1 or more Vehicles in Household
In terms of 1 or more vehicles in household, the demographic groups most similar to Immigrants from Cabo Verde are Jamaican (82.1%, a difference of 0.67%), Soviet Union (82.7%, a difference of 1.3%), Immigrants from Yemen (80.5%, a difference of 1.3%), Immigrants from Caribbean (80.4%, a difference of 1.4%), and Senegalese (80.4%, a difference of 1.5%).
| Demographics | Rating | Rank | 1 or more Vehicles in Household |
| Cypriots | 0.0 /100 | #315 | Tragic 84.4% |
| Alaska Natives | 0.0 /100 | #316 | Tragic 83.8% |
| Ghanaians | 0.0 /100 | #317 | Tragic 83.6% |
| Immigrants | Ghana | 0.0 /100 | #318 | Tragic 83.4% |
| Immigrants | Belarus | 0.0 /100 | #319 | Tragic 83.3% |
| Soviet Union | 0.0 /100 | #320 | Tragic 82.7% |
| Jamaicans | 0.0 /100 | #321 | Tragic 82.1% |
| Immigrants | Cabo Verde | 0.0 /100 | #322 | Tragic 81.6% |
| Immigrants | Yemen | 0.0 /100 | #323 | Tragic 80.5% |
| Immigrants | Caribbean | 0.0 /100 | #324 | Tragic 80.4% |
| Senegalese | 0.0 /100 | #325 | Tragic 80.4% |
| Immigrants | West Indies | 0.0 /100 | #326 | Tragic 79.5% |
| Immigrants | Senegal | 0.0 /100 | #327 | Tragic 79.0% |
| Ecuadorians | 0.0 /100 | #328 | Tragic 77.9% |
| Immigrants | Dominica | 0.0 /100 | #329 | Tragic 77.8% |