Blackfeet vs Colombian 1 or more Vehicles in Household
COMPARE
Blackfeet
Colombian
1 or more Vehicles in Household
1 or more Vehicles in Household Comparison
Blackfeet
Colombians
90.6%
1 OR MORE VEHICLES IN HOUSEHOLD
92.6/ 100
METRIC RATING
119th/ 347
METRIC RANK
88.0%
1 OR MORE VEHICLES IN HOUSEHOLD
0.9/ 100
METRIC RATING
256th/ 347
METRIC RANK
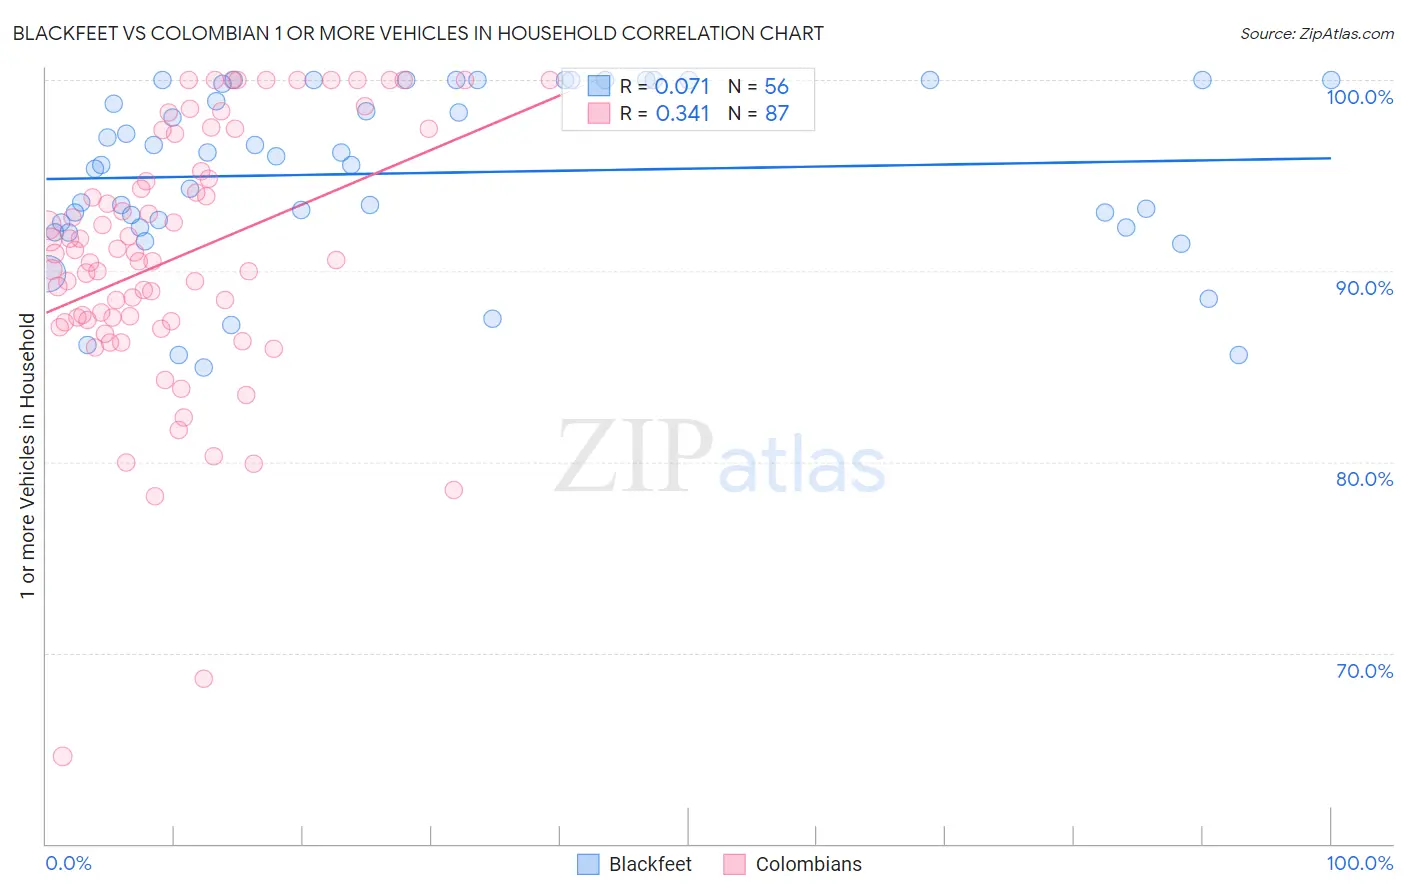
Blackfeet vs Colombian 1 or more Vehicles in Household Correlation Chart
The statistical analysis conducted on geographies consisting of 309,485,475 people shows a slight positive correlation between the proportion of Blackfeet and percentage of households with 1 or more vehicles available in the United States with a correlation coefficient (R) of 0.071 and weighted average of 90.6%. Similarly, the statistical analysis conducted on geographies consisting of 419,307,896 people shows a mild positive correlation between the proportion of Colombians and percentage of households with 1 or more vehicles available in the United States with a correlation coefficient (R) of 0.341 and weighted average of 88.0%, a difference of 2.9%.
1 or more Vehicles in Household Correlation Summary
| Measurement | Blackfeet | Colombian |
| Minimum | 84.9% | 64.6% |
| Maximum | 100.0% | 100.0% |
| Range | 15.1% | 35.4% |
| Mean | 95.1% | 90.7% |
| Median | 95.8% | 90.6% |
| Interquartile 25% (IQ1) | 92.4% | 87.4% |
| Interquartile 75% (IQ3) | 100.0% | 95.2% |
| Interquartile Range (IQR) | 7.6% | 7.9% |
| Standard Deviation (Sample) | 4.5% | 6.8% |
| Standard Deviation (Population) | 4.5% | 6.8% |
Similar Demographics by 1 or more Vehicles in Household
Demographics Similar to Blackfeet by 1 or more Vehicles in Household
In terms of 1 or more vehicles in household, the demographic groups most similar to Blackfeet are Immigrants from Thailand (90.6%, a difference of 0.020%), Icelander (90.5%, a difference of 0.030%), Costa Rican (90.5%, a difference of 0.030%), Fijian (90.5%, a difference of 0.040%), and Greek (90.6%, a difference of 0.050%).
| Demographics | Rating | Rank | 1 or more Vehicles in Household |
| Immigrants | Netherlands | 95.7 /100 | #112 | Exceptional 90.8% |
| Immigrants | Kuwait | 94.7 /100 | #113 | Exceptional 90.7% |
| Armenians | 94.5 /100 | #114 | Exceptional 90.7% |
| Serbians | 94.3 /100 | #115 | Exceptional 90.7% |
| Chippewa | 94.3 /100 | #116 | Exceptional 90.7% |
| Greeks | 93.5 /100 | #117 | Exceptional 90.6% |
| Japanese | 93.4 /100 | #118 | Exceptional 90.6% |
| Blackfeet | 92.6 /100 | #119 | Exceptional 90.6% |
| Immigrants | Thailand | 92.3 /100 | #120 | Exceptional 90.6% |
| Icelanders | 92.1 /100 | #121 | Exceptional 90.5% |
| Costa Ricans | 92.0 /100 | #122 | Exceptional 90.5% |
| Fijians | 91.8 /100 | #123 | Exceptional 90.5% |
| Puget Sound Salish | 91.5 /100 | #124 | Exceptional 90.5% |
| Immigrants | Korea | 90.5 /100 | #125 | Exceptional 90.5% |
| Immigrants | Cameroon | 89.4 /100 | #126 | Excellent 90.4% |
Demographics Similar to Colombians by 1 or more Vehicles in Household
In terms of 1 or more vehicles in household, the demographic groups most similar to Colombians are Liberian (88.0%, a difference of 0.0%), Immigrants from Latvia (88.1%, a difference of 0.010%), South American Indian (88.0%, a difference of 0.010%), Haitian (88.1%, a difference of 0.030%), and Honduran (88.1%, a difference of 0.040%).
| Demographics | Rating | Rank | 1 or more Vehicles in Household |
| Blacks/African Americans | 1.4 /100 | #249 | Tragic 88.2% |
| Egyptians | 1.2 /100 | #250 | Tragic 88.2% |
| Immigrants | Serbia | 1.2 /100 | #251 | Tragic 88.2% |
| Immigrants | Uruguay | 1.1 /100 | #252 | Tragic 88.1% |
| Hondurans | 1.0 /100 | #253 | Tragic 88.1% |
| Haitians | 0.9 /100 | #254 | Tragic 88.1% |
| Immigrants | Latvia | 0.9 /100 | #255 | Tragic 88.1% |
| Colombians | 0.9 /100 | #256 | Tragic 88.0% |
| Liberians | 0.9 /100 | #257 | Tragic 88.0% |
| South American Indians | 0.9 /100 | #258 | Tragic 88.0% |
| Nigerians | 0.8 /100 | #259 | Tragic 88.0% |
| Macedonians | 0.6 /100 | #260 | Tragic 87.9% |
| Immigrants | Switzerland | 0.6 /100 | #261 | Tragic 87.9% |
| Sub-Saharan Africans | 0.5 /100 | #262 | Tragic 87.9% |
| Immigrants | Egypt | 0.5 /100 | #263 | Tragic 87.8% |