Zip Codes with the Highest Percentage of Population with a Degree in Visual and Performing Arts in Beaumont, TX
RELATED REPORTS & OPTIONS
Visual and Performing Arts
Beaumont
Compare Zip Codes
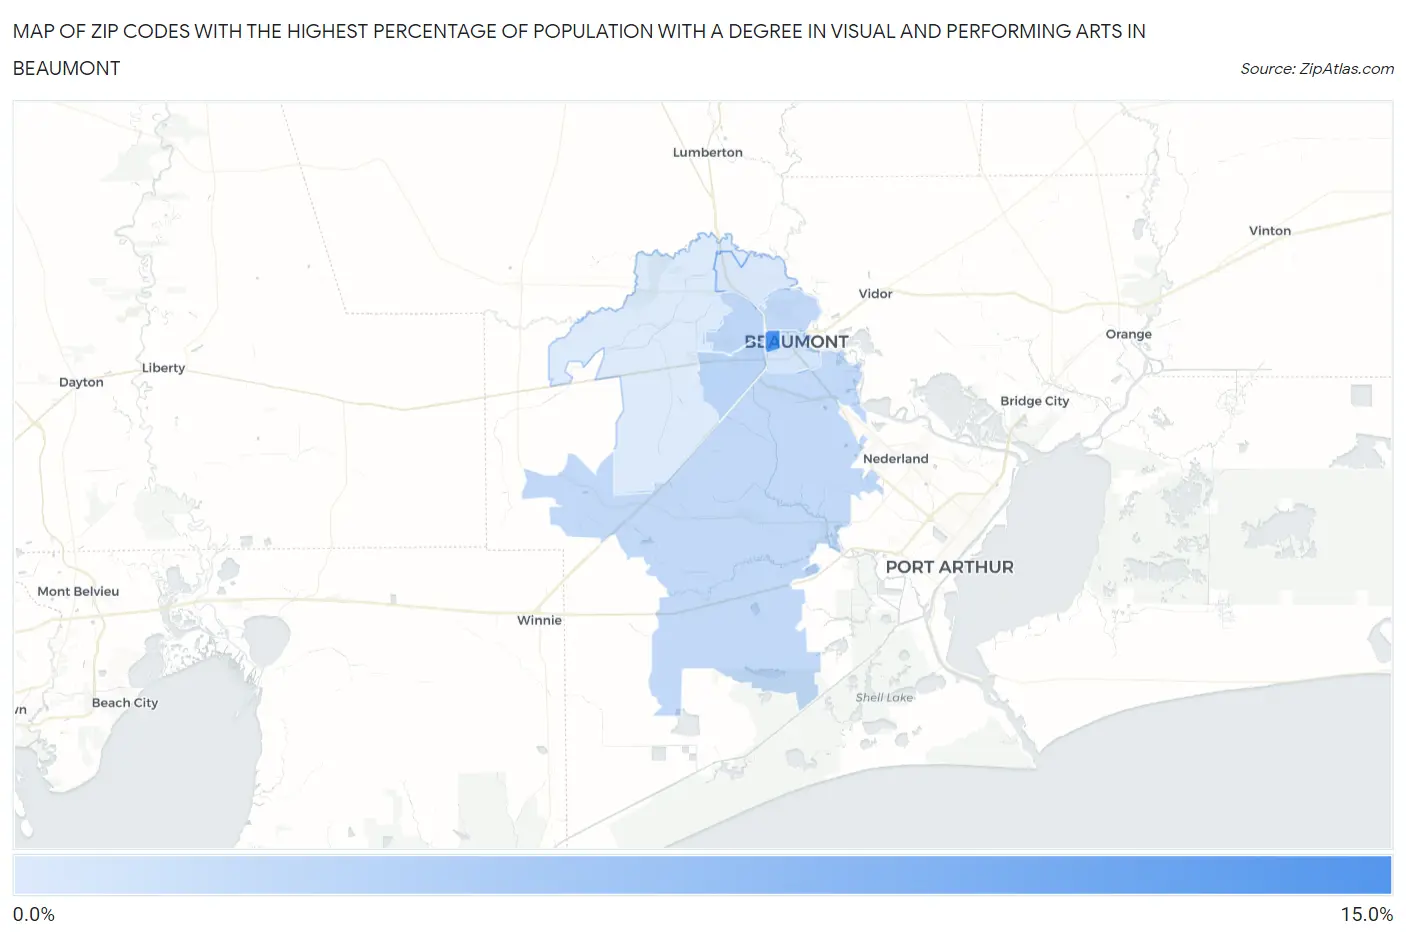
Map of Zip Codes with the Highest Percentage of Population with a Degree in Visual and Performing Arts in Beaumont
0.62%
12.4%
Zip Codes with the Highest Percentage of Population with a Degree in Visual and Performing Arts in Beaumont, TX
| Zip Code | % Graduates | vs State | vs National | |
| 1. | 77702 | 12.4% | 3.2%(+9.19)#41 | 4.3%(+8.14)#1,210 |
| 2. | 77707 | 3.3% | 3.2%(+0.079)#535 | 4.3%(-0.963)#11,659 |
| 3. | 77706 | 3.0% | 3.2%(-0.236)#620 | 4.3%(-1.28)#12,828 |
| 4. | 77703 | 2.7% | 3.2%(-0.502)#673 | 4.3%(-1.54)#13,865 |
| 5. | 77705 | 2.6% | 3.2%(-0.568)#686 | 4.3%(-1.61)#14,112 |
| 6. | 77701 | 1.4% | 3.2%(-1.83)#1,021 | 4.3%(-2.88)#18,538 |
| 7. | 77708 | 0.90% | 3.2%(-2.31)#1,125 | 4.3%(-3.36)#19,937 |
| 8. | 77713 | 0.62% | 3.2%(-2.59)#1,176 | 4.3%(-3.63)#20,515 |
1
Common Questions
What are the Top 5 Zip Codes with the Highest Percentage of Population with a Degree in Visual and Performing Arts in Beaumont, TX?
Top 5 Zip Codes with the Highest Percentage of Population with a Degree in Visual and Performing Arts in Beaumont, TX are:
What zip code has the Highest Percentage of Population with a Degree in Visual and Performing Arts in Beaumont, TX?
77702 has the Highest Percentage of Population with a Degree in Visual and Performing Arts in Beaumont, TX with 12.4%.
What is the Percentage of Population with a Degree in Visual and Performing Arts in Beaumont, TX?
Percentage of Population with a Degree in Visual and Performing Arts in Beaumont is 2.9%.
What is the Percentage of Population with a Degree in Visual and Performing Arts in Texas?
Percentage of Population with a Degree in Visual and Performing Arts in Texas is 3.2%.
What is the Percentage of Population with a Degree in Visual and Performing Arts in the United States?
Percentage of Population with a Degree in Visual and Performing Arts in the United States is 4.3%.