Zip Codes with the Highest Percentage of Immigrants from Eastern Africa in Beaumont, TX
RELATED REPORTS & OPTIONS
Eastern Africa
Beaumont
Compare Zip Codes
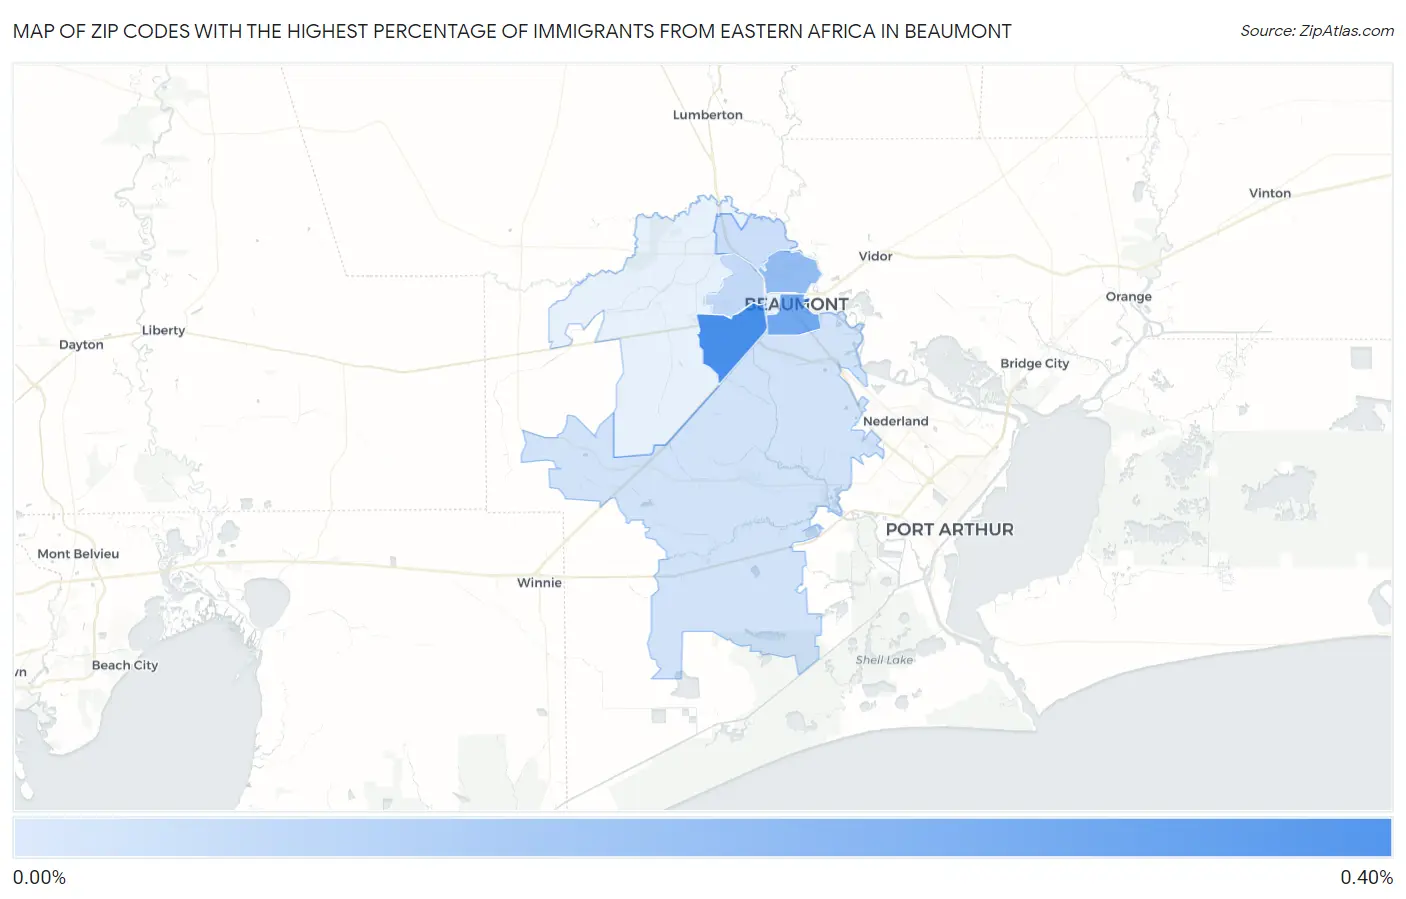
Map of Zip Codes with the Highest Percentage of Immigrants from Eastern Africa in Beaumont
0.029%
0.39%
Zip Codes with the Highest Percentage of Immigrants from Eastern Africa in Beaumont, TX
| Zip Code | Eastern Africa | vs State | vs National | |
| 1. | 77707 | 0.39% | 0.26%(+0.128)#-1 | 0.23%(+0.159)#0 |
| 2. | 77701 | 0.28% | 0.26%(+0.020)#0 | 0.23%(+0.051)#1 |
| 3. | 77703 | 0.19% | 0.26%(-0.070)#1 | 0.23%(-0.039)#2 |
| 4. | 77706 | 0.074% | 0.26%(-0.184)#2 | 0.23%(-0.153)#3 |
| 5. | 77708 | 0.045% | 0.26%(-0.213)#3 | 0.23%(-0.182)#4 |
| 6. | 77705 | 0.029% | 0.26%(-0.229)#4 | 0.23%(-0.198)#5 |
1
Common Questions
What are the Top 5 Zip Codes with the Highest Percentage of Immigrants from Eastern Africa in Beaumont, TX?
Top 5 Zip Codes with the Highest Percentage of Immigrants from Eastern Africa in Beaumont, TX are:
What zip code has the Highest Percentage of Immigrants from Eastern Africa in Beaumont, TX?
77707 has the Highest Percentage of Immigrants from Eastern Africa in Beaumont, TX with 0.39%.
What is the Percentage of Immigrants from Eastern Africa in Beaumont, TX?
Percentage of Immigrants from Eastern Africa in Beaumont is 0.14%.
What is the Percentage of Immigrants from Eastern Africa in Texas?
Percentage of Immigrants from Eastern Africa in Texas is 0.26%.
What is the Percentage of Immigrants from Eastern Africa in the United States?
Percentage of Immigrants from Eastern Africa in the United States is 0.23%.