Zip Codes with the Highest Percentage of Immigrants from Eastern Asia in Beaumont, TX
RELATED REPORTS & OPTIONS
Eastern Asia
Beaumont
Compare Zip Codes
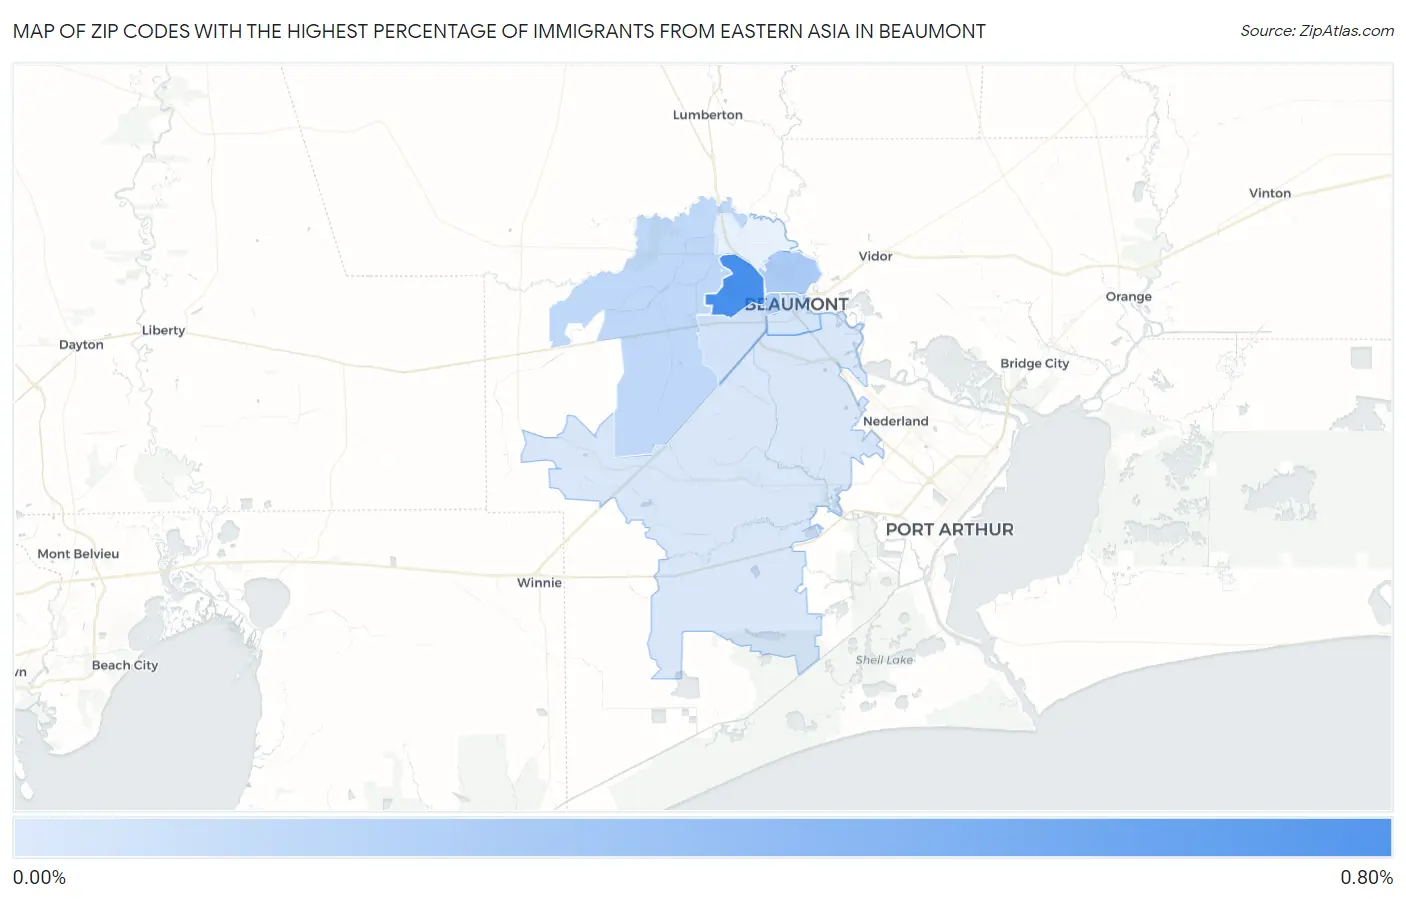
Map of Zip Codes with the Highest Percentage of Immigrants from Eastern Asia in Beaumont
0.024%
0.67%
Zip Codes with the Highest Percentage of Immigrants from Eastern Asia in Beaumont, TX
| Zip Code | Eastern Asia | vs State | vs National | |
| 1. | 77706 | 0.67% | 0.79%(-0.118)#288 | 1.28%(-0.602)#5,396 |
| 2. | 77703 | 0.23% | 0.79%(-0.561)#541 | 1.28%(-1.04)#9,786 |
| 3. | 77702 | 0.22% | 0.79%(-0.575)#556 | 1.28%(-1.06)#10,002 |
| 4. | 77713 | 0.14% | 0.79%(-0.653)#642 | 1.28%(-1.14)#11,401 |
| 5. | 77707 | 0.050% | 0.79%(-0.742)#773 | 1.28%(-1.23)#13,254 |
| 6. | 77701 | 0.046% | 0.79%(-0.745)#780 | 1.28%(-1.23)#13,327 |
| 7. | 77705 | 0.024% | 0.79%(-0.768)#827 | 1.28%(-1.25)#13,770 |
1
Common Questions
What are the Top 5 Zip Codes with the Highest Percentage of Immigrants from Eastern Asia in Beaumont, TX?
Top 5 Zip Codes with the Highest Percentage of Immigrants from Eastern Asia in Beaumont, TX are:
What zip code has the Highest Percentage of Immigrants from Eastern Asia in Beaumont, TX?
77706 has the Highest Percentage of Immigrants from Eastern Asia in Beaumont, TX with 0.67%.
What is the Percentage of Immigrants from Eastern Asia in Beaumont, TX?
Percentage of Immigrants from Eastern Asia in Beaumont is 0.24%.
What is the Percentage of Immigrants from Eastern Asia in Texas?
Percentage of Immigrants from Eastern Asia in Texas is 0.79%.
What is the Percentage of Immigrants from Eastern Asia in the United States?
Percentage of Immigrants from Eastern Asia in the United States is 1.28%.