Zip Codes with the Highest Percentage of Hispanic or Latino Population in Beaumont, TX
RELATED REPORTS & OPTIONS
Hispanic or Latino
Beaumont
Compare Zip Codes
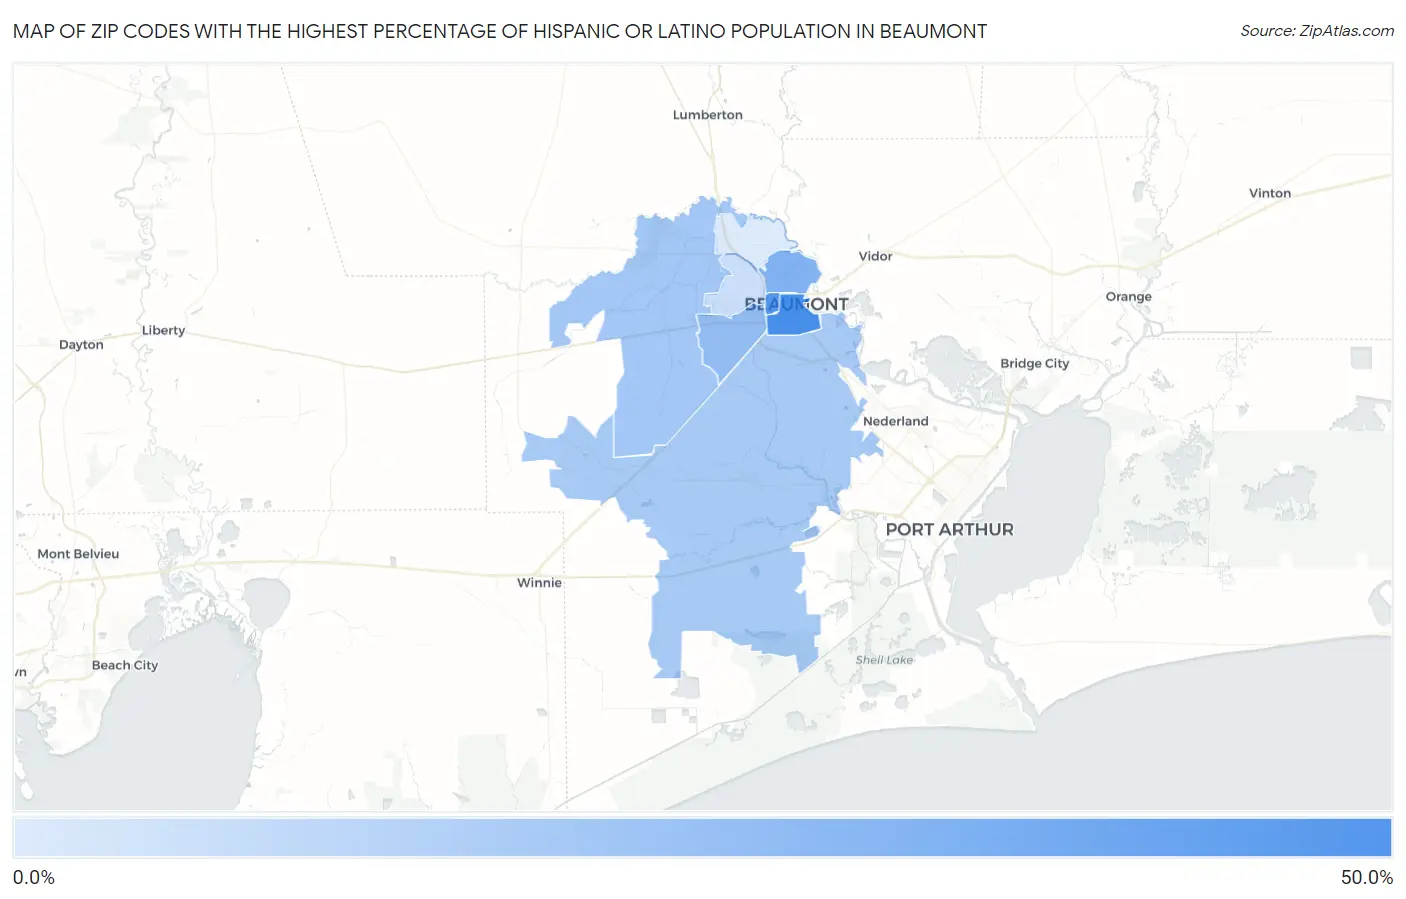
Map of Zip Codes with the Highest Percentage of Hispanic or Latino Population in Beaumont
9.4%
40.6%
Zip Codes with the Highest Percentage of Hispanic or Latino Population in Beaumont, TX
| Zip Code | Hispanic or Latino | vs State | vs National | |
| 1. | 77701 | 40.6% | 39.9%(+0.758)#599 | 18.7%(+22.0)#2,118 |
| 2. | 77702 | 38.2% | 39.9%(-1.67)#645 | 18.7%(+19.6)#2,300 |
| 3. | 77703 | 27.9% | 39.9%(-12.0)#872 | 18.7%(+9.25)#3,362 |
| 4. | 77707 | 23.9% | 39.9%(-16.0)#989 | 18.7%(+5.28)#3,982 |
| 5. | 77713 | 20.4% | 39.9%(-19.5)#1,123 | 18.7%(+1.78)#4,686 |
| 6. | 77705 | 19.6% | 39.9%(-20.3)#1,154 | 18.7%(+0.933)#4,914 |
| 7. | 77706 | 13.1% | 39.9%(-26.8)#1,424 | 18.7%(-5.58)#7,215 |
| 8. | 77708 | 9.4% | 39.9%(-30.5)#1,568 | 18.7%(-9.22)#9,341 |
1
Common Questions
What are the Top 5 Zip Codes with the Highest Percentage of Hispanic or Latino Population in Beaumont, TX?
Top 5 Zip Codes with the Highest Percentage of Hispanic or Latino Population in Beaumont, TX are:
What zip code has the Highest Percentage of Hispanic or Latino Population in Beaumont, TX?
77701 has the Highest Percentage of Hispanic or Latino Population in Beaumont, TX with 40.6%.
What is the Percentage of Hispanic or Latino Population in Beaumont, TX?
Percentage of Hispanic or Latino Population in Beaumont is 20.2%.
What is the Percentage of Hispanic or Latino Population in Texas?
Percentage of Hispanic or Latino Population in Texas is 39.9%.
What is the Percentage of Hispanic or Latino Population in the United States?
Percentage of Hispanic or Latino Population in the United States is 18.7%.