Zip Codes with the Highest Percentage of Population Employed in Health Care & Social Assistance in San Juan, PR
RELATED REPORTS & OPTIONS
Health Care & Social Assistance
San Juan
Compare Zip Codes
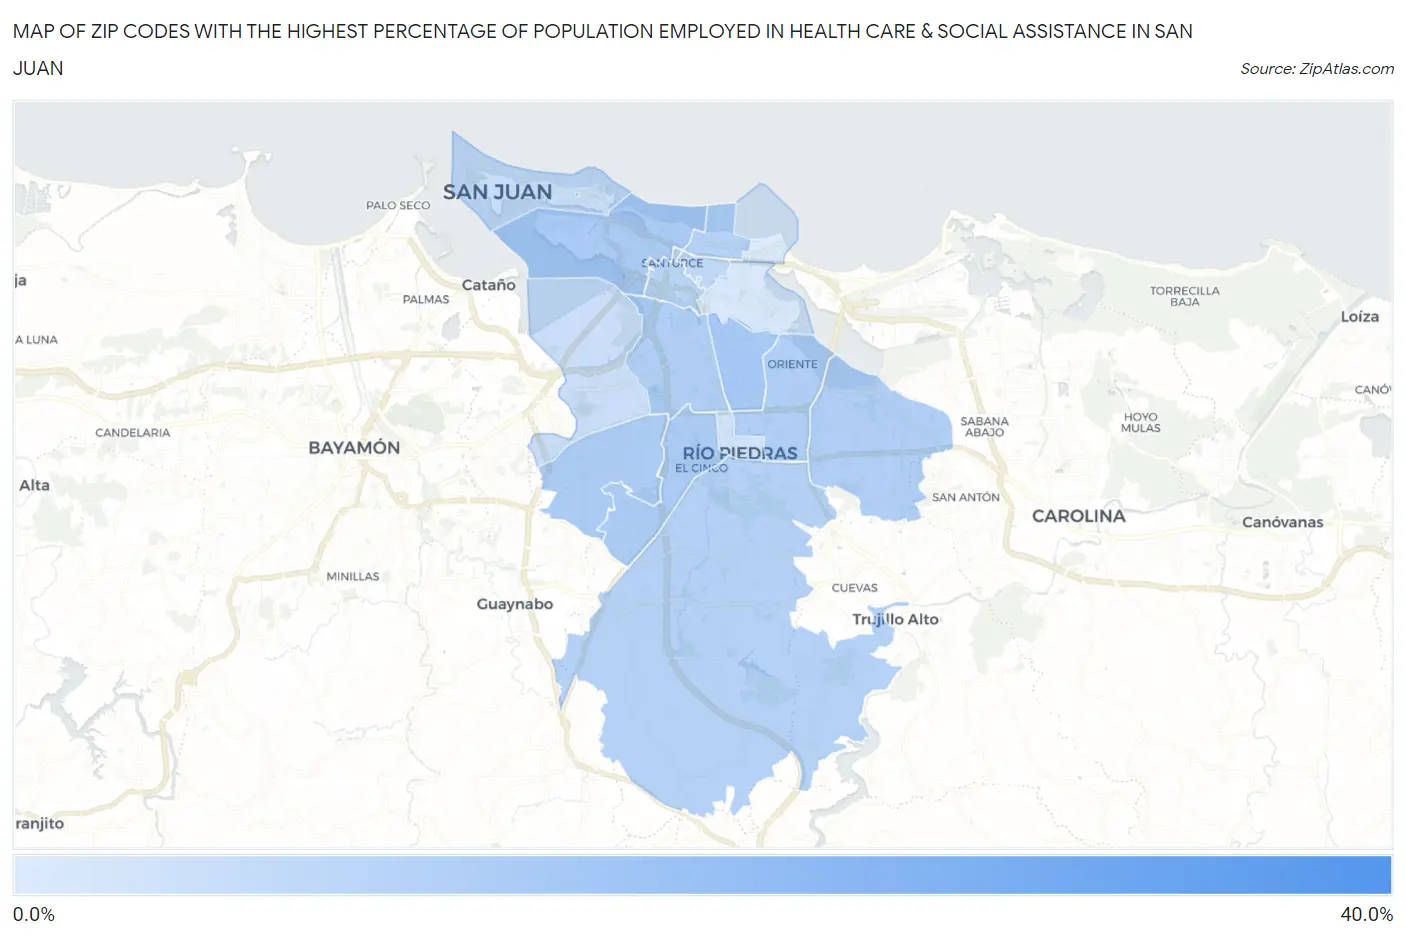
Map of Zip Codes with the Highest Percentage of Population Employed in Health Care & Social Assistance in San Juan
6.3%
31.6%
Zip Codes with the Highest Percentage of Population Employed in Health Care & Social Assistance in San Juan, PR
| Zip Code | % Employed | vs State | vs National | |
| 1. | 00906 | 31.6% | 12.7%(+19.0)#2 | 13.9%(+17.7)#800 |
| 2. | 00917 | 15.2% | 12.7%(+2.48)#25 | 13.9%(+1.22)#11,288 |
| 3. | 00907 | 14.1% | 12.7%(+1.46)#38 | 13.9%(+0.207)#13,707 |
| 4. | 00927 | 14.1% | 12.7%(+1.38)#40 | 13.9%(+0.129)#13,910 |
| 5. | 00921 | 13.9% | 12.7%(+1.23)#42 | 13.9%(-0.027)#14,287 |
| 6. | 00924 | 13.2% | 12.7%(+0.521)#50 | 13.9%(-0.734)#16,052 |
| 7. | 00918 | 13.1% | 12.7%(+0.375)#53 | 13.9%(-0.881)#16,452 |
| 8. | 00923 | 13.0% | 12.7%(+0.364)#54 | 13.9%(-0.892)#16,477 |
| 9. | 00911 | 12.3% | 12.7%(-0.406)#67 | 13.9%(-1.66)#18,408 |
| 10. | 00926 | 12.2% | 12.7%(-0.438)#68 | 13.9%(-1.69)#18,496 |
| 11. | 00909 | 11.6% | 12.7%(-1.13)#78 | 13.9%(-2.38)#20,074 |
| 12. | 00912 | 10.7% | 12.7%(-2.01)#93 | 13.9%(-3.26)#22,085 |
| 13. | 00901 | 9.4% | 12.7%(-3.25)#108 | 13.9%(-4.50)#24,485 |
| 14. | 00920 | 9.0% | 12.7%(-3.68)#111 | 13.9%(-4.93)#25,162 |
| 15. | 00925 | 7.9% | 12.7%(-4.78)#118 | 13.9%(-6.03)#26,590 |
| 16. | 00915 | 7.0% | 12.7%(-5.66)#122 | 13.9%(-6.91)#27,480 |
| 17. | 00913 | 6.3% | 12.7%(-6.41)#125 | 13.9%(-7.66)#28,145 |
1
Common Questions
What are the Top 10 Zip Codes with the Highest Percentage of Population Employed in Health Care & Social Assistance in San Juan, PR?
Top 10 Zip Codes with the Highest Percentage of Population Employed in Health Care & Social Assistance in San Juan, PR are:
What zip code has the Highest Percentage of Population Employed in Health Care & Social Assistance in San Juan, PR?
00906 has the Highest Percentage of Population Employed in Health Care & Social Assistance in San Juan, PR with 31.6%.
What is the Percentage of Population Employed in Health Care & Social Assistance in San Juan, PR?
Percentage of Population Employed in Health Care & Social Assistance in San Juan is 12.2%.
What is the Percentage of Population Employed in Health Care & Social Assistance in Puerto Rico?
Percentage of Population Employed in Health Care & Social Assistance in Puerto Rico is 12.7%.
What is the Percentage of Population Employed in Health Care & Social Assistance in the United States?
Percentage of Population Employed in Health Care & Social Assistance in the United States is 13.9%.