Zip Codes with the Highest Percentage of Population Employed in Health Diagnosing & Treating in San Juan, PR
RELATED REPORTS & OPTIONS
Health Diagnosing & Treating
San Juan
Compare Zip Codes
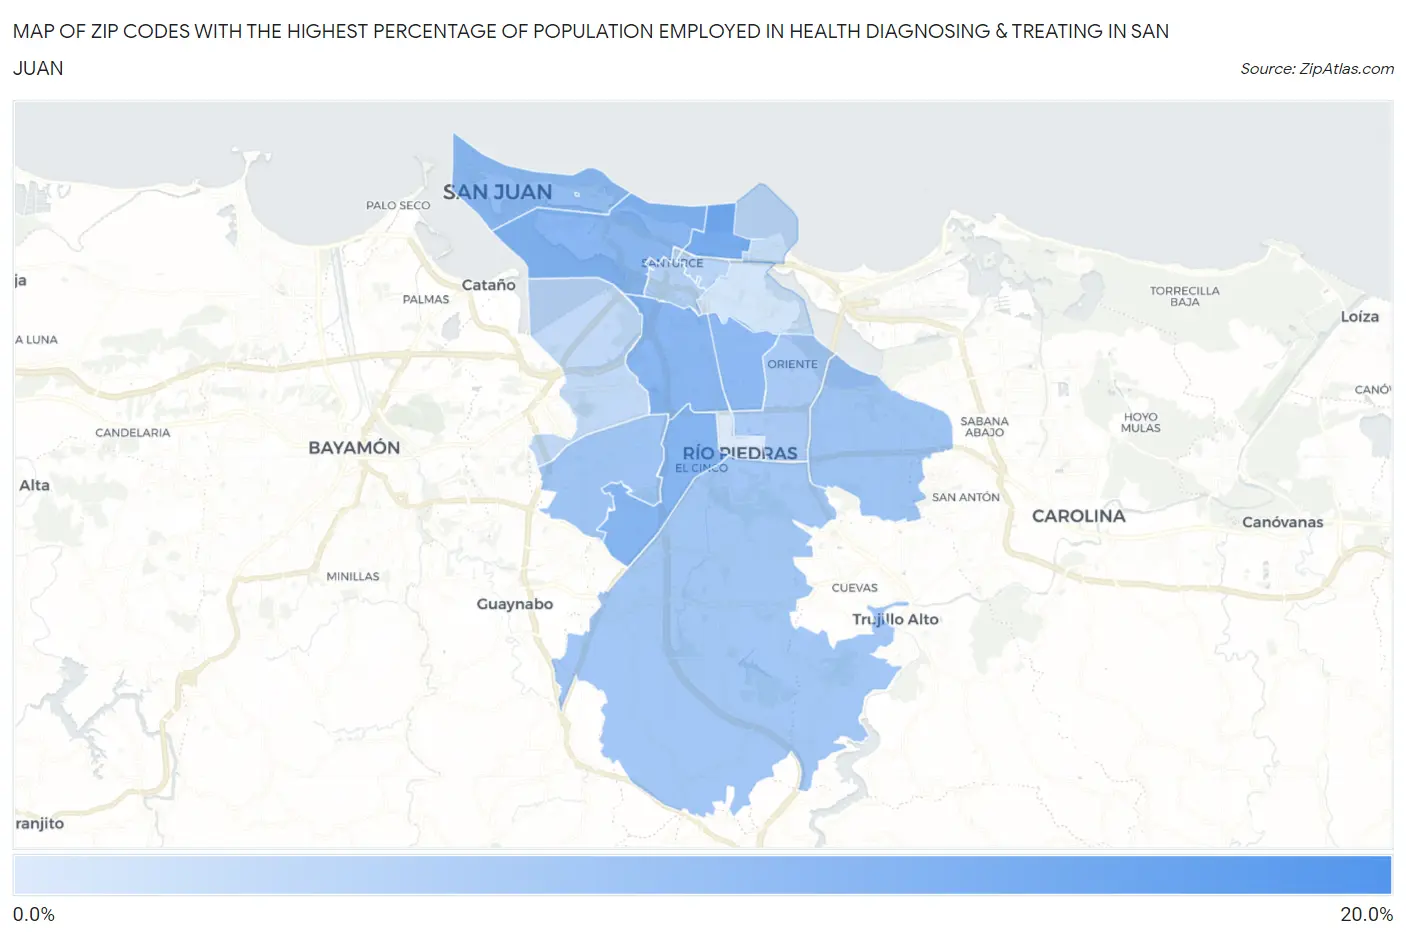
Map of Zip Codes with the Highest Percentage of Population Employed in Health Diagnosing & Treating in San Juan
2.1%
16.3%
Zip Codes with the Highest Percentage of Population Employed in Health Diagnosing & Treating in San Juan, PR
| Zip Code | % Employed | vs State | vs National | |
| 1. | 00906 | 16.3% | 6.7%(+9.59)#1 | 6.2%(+10.1)#902 |
| 2. | 00911 | 11.6% | 6.7%(+4.83)#7 | 6.2%(+5.32)#2,479 |
| 3. | 00927 | 9.9% | 6.7%(+3.19)#13 | 6.2%(+3.67)#3,981 |
| 4. | 00907 | 9.8% | 6.7%(+3.04)#15 | 6.2%(+3.53)#4,149 |
| 5. | 00918 | 9.8% | 6.7%(+3.03)#16 | 6.2%(+3.52)#4,162 |
| 6. | 00917 | 9.4% | 6.7%(+2.67)#19 | 6.2%(+3.16)#4,680 |
| 7. | 00901 | 8.9% | 6.7%(+2.14)#23 | 6.2%(+2.63)#5,583 |
| 8. | 00924 | 7.9% | 6.7%(+1.15)#40 | 6.2%(+1.64)#7,794 |
| 9. | 00921 | 7.5% | 6.7%(+0.757)#42 | 6.2%(+1.25)#8,853 |
| 10. | 00926 | 7.3% | 6.7%(+0.587)#46 | 6.2%(+1.08)#9,355 |
| 11. | 00923 | 6.6% | 6.7%(-0.093)#58 | 6.2%(+0.396)#11,523 |
| 12. | 00909 | 5.7% | 6.7%(-1.08)#82 | 6.2%(-0.590)#15,157 |
| 13. | 00912 | 5.2% | 6.7%(-1.50)#96 | 6.2%(-1.02)#16,823 |
| 14. | 00920 | 4.5% | 6.7%(-2.19)#104 | 6.2%(-1.70)#19,459 |
| 15. | 00913 | 4.2% | 6.7%(-2.57)#108 | 6.2%(-2.08)#20,854 |
| 16. | 00915 | 3.0% | 6.7%(-3.72)#115 | 6.2%(-3.23)#24,284 |
| 17. | 00925 | 2.1% | 6.7%(-4.63)#119 | 6.2%(-4.15)#26,296 |
1
Common Questions
What are the Top 10 Zip Codes with the Highest Percentage of Population Employed in Health Diagnosing & Treating in San Juan, PR?
Top 10 Zip Codes with the Highest Percentage of Population Employed in Health Diagnosing & Treating in San Juan, PR are:
What zip code has the Highest Percentage of Population Employed in Health Diagnosing & Treating in San Juan, PR?
00906 has the Highest Percentage of Population Employed in Health Diagnosing & Treating in San Juan, PR with 16.3%.
What is the Percentage of Population Employed in Health Diagnosing & Treating in San Juan, PR?
Percentage of Population Employed in Health Diagnosing & Treating in San Juan is 7.6%.
What is the Percentage of Population Employed in Health Diagnosing & Treating in Puerto Rico?
Percentage of Population Employed in Health Diagnosing & Treating in Puerto Rico is 6.7%.
What is the Percentage of Population Employed in Health Diagnosing & Treating in the United States?
Percentage of Population Employed in Health Diagnosing & Treating in the United States is 6.2%.