Zip Codes with the Highest Percentage of Population Employed in Installation, Maintenance & Repair in San Juan, PR
RELATED REPORTS & OPTIONS
Installation, Maintenance & Repair
San Juan
Compare Zip Codes
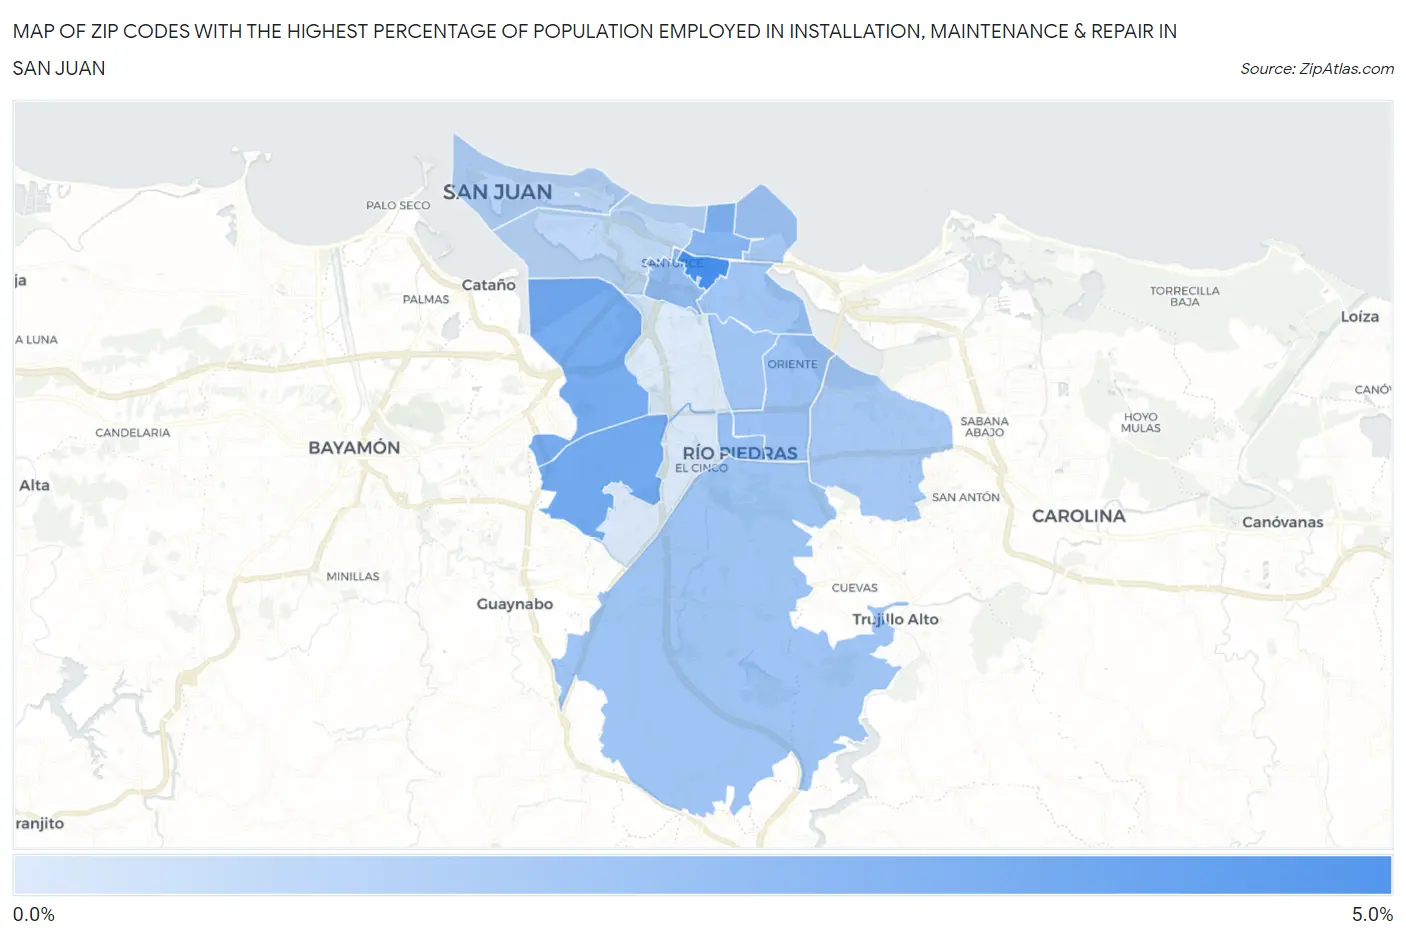
Map of Zip Codes with the Highest Percentage of Population Employed in Installation, Maintenance & Repair in San Juan
0.99%
4.7%
Zip Codes with the Highest Percentage of Population Employed in Installation, Maintenance & Repair in San Juan, PR
| Zip Code | % Employed | vs State | vs National | |
| 1. | 00912 | 4.7% | 3.6%(+1.04)#28 | 3.1%(+1.60)#9,811 |
| 2. | 00921 | 3.5% | 3.6%(-0.078)#61 | 3.1%(+0.481)#14,389 |
| 3. | 00920 | 3.5% | 3.6%(-0.151)#62 | 3.1%(+0.408)#14,729 |
| 4. | 00911 | 3.0% | 3.6%(-0.580)#75 | 3.1%(-0.021)#16,771 |
| 5. | 00909 | 2.8% | 3.6%(-0.872)#87 | 3.1%(-0.313)#18,237 |
| 6. | 00925 | 2.7% | 3.6%(-0.955)#90 | 3.1%(-0.396)#18,704 |
| 7. | 00923 | 2.5% | 3.6%(-1.09)#95 | 3.1%(-0.528)#19,354 |
| 8. | 00926 | 2.5% | 3.6%(-1.16)#96 | 3.1%(-0.598)#19,688 |
| 9. | 00915 | 2.5% | 3.6%(-1.17)#97 | 3.1%(-0.614)#19,770 |
| 10. | 00917 | 2.4% | 3.6%(-1.20)#98 | 3.1%(-0.640)#19,923 |
| 11. | 00924 | 2.3% | 3.6%(-1.30)#101 | 3.1%(-0.744)#20,459 |
| 12. | 00913 | 2.3% | 3.6%(-1.32)#103 | 3.1%(-0.756)#20,517 |
| 13. | 00901 | 1.9% | 3.6%(-1.73)#106 | 3.1%(-1.17)#22,458 |
| 14. | 00907 | 1.7% | 3.6%(-1.93)#108 | 3.1%(-1.37)#23,356 |
| 15. | 00927 | 1.0% | 3.6%(-2.60)#113 | 3.1%(-2.04)#25,861 |
| 16. | 00918 | 0.99% | 3.6%(-2.64)#114 | 3.1%(-2.08)#25,973 |
1
Common Questions
What are the Top 10 Zip Codes with the Highest Percentage of Population Employed in Installation, Maintenance & Repair in San Juan, PR?
Top 10 Zip Codes with the Highest Percentage of Population Employed in Installation, Maintenance & Repair in San Juan, PR are:
What zip code has the Highest Percentage of Population Employed in Installation, Maintenance & Repair in San Juan, PR?
00912 has the Highest Percentage of Population Employed in Installation, Maintenance & Repair in San Juan, PR with 4.7%.
What is the Percentage of Population Employed in Installation, Maintenance & Repair in San Juan, PR?
Percentage of Population Employed in Installation, Maintenance & Repair in San Juan is 2.2%.
What is the Percentage of Population Employed in Installation, Maintenance & Repair in Puerto Rico?
Percentage of Population Employed in Installation, Maintenance & Repair in Puerto Rico is 3.6%.
What is the Percentage of Population Employed in Installation, Maintenance & Repair in the United States?
Percentage of Population Employed in Installation, Maintenance & Repair in the United States is 3.1%.