Zip Codes with the Highest Percentage of Population Employed in Real Estate, Rental & Leasing in San Juan, PR
RELATED REPORTS & OPTIONS
Real Estate, Rental & Leasing
San Juan
Compare Zip Codes
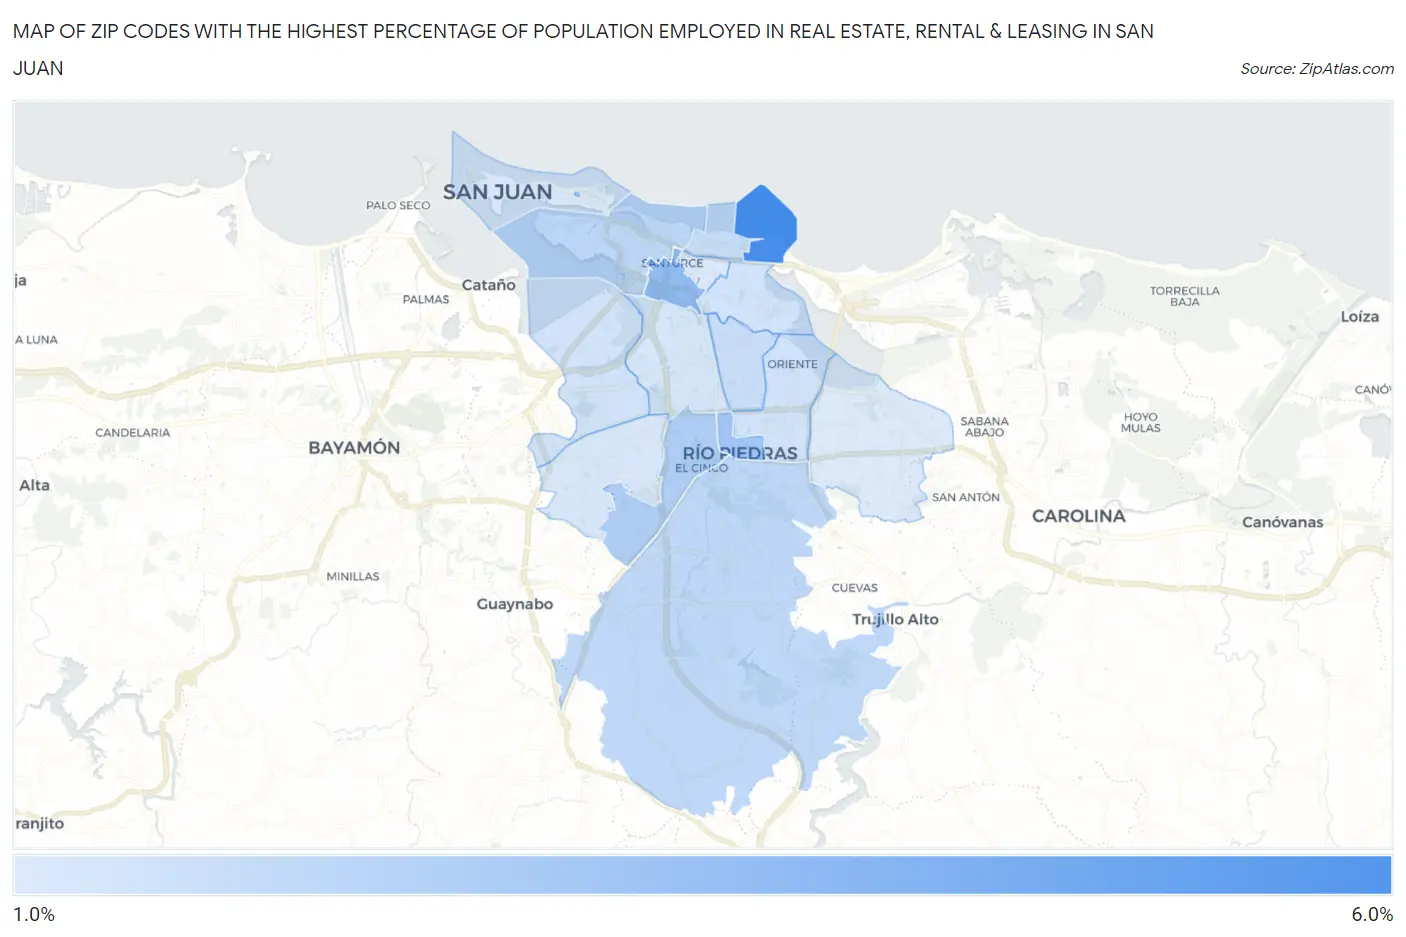
Map of Zip Codes with the Highest Percentage of Population Employed in Real Estate, Rental & Leasing in San Juan
1.4%
5.4%
Zip Codes with the Highest Percentage of Population Employed in Real Estate, Rental & Leasing in San Juan, PR
| Zip Code | % Employed | vs State | vs National | |
| 1. | 00913 | 5.4% | 1.3%(+4.09)#2 | 1.9%(+3.46)#1,217 |
| 2. | 00909 | 3.4% | 1.3%(+2.12)#6 | 1.9%(+1.49)#3,058 |
| 3. | 00925 | 2.9% | 1.3%(+1.68)#10 | 1.9%(+1.05)#4,060 |
| 4. | 00927 | 2.6% | 1.3%(+1.34)#13 | 1.9%(+0.710)#5,100 |
| 5. | 00907 | 2.2% | 1.3%(+0.983)#19 | 1.9%(+0.352)#6,597 |
| 6. | 00926 | 2.2% | 1.3%(+0.934)#23 | 1.9%(+0.304)#6,830 |
| 7. | 00911 | 2.0% | 1.3%(+0.750)#27 | 1.9%(+0.120)#7,773 |
| 8. | 00917 | 1.9% | 1.3%(+0.674)#28 | 1.9%(+0.043)#8,217 |
| 9. | 00923 | 1.7% | 1.3%(+0.432)#37 | 1.9%(-0.199)#9,812 |
| 10. | 00920 | 1.7% | 1.3%(+0.431)#38 | 1.9%(-0.200)#9,822 |
| 11. | 00915 | 1.7% | 1.3%(+0.427)#39 | 1.9%(-0.204)#9,848 |
| 12. | 00918 | 1.6% | 1.3%(+0.312)#41 | 1.9%(-0.319)#10,621 |
| 13. | 00921 | 1.5% | 1.3%(+0.282)#43 | 1.9%(-0.348)#10,835 |
| 14. | 00901 | 1.5% | 1.3%(+0.267)#44 | 1.9%(-0.363)#10,945 |
| 15. | 00912 | 1.5% | 1.3%(+0.223)#47 | 1.9%(-0.408)#11,273 |
| 16. | 00924 | 1.4% | 1.3%(+0.140)#51 | 1.9%(-0.490)#11,964 |
1
Common Questions
What are the Top 10 Zip Codes with the Highest Percentage of Population Employed in Real Estate, Rental & Leasing in San Juan, PR?
Top 10 Zip Codes with the Highest Percentage of Population Employed in Real Estate, Rental & Leasing in San Juan, PR are:
What zip code has the Highest Percentage of Population Employed in Real Estate, Rental & Leasing in San Juan, PR?
00913 has the Highest Percentage of Population Employed in Real Estate, Rental & Leasing in San Juan, PR with 5.4%.
What is the Percentage of Population Employed in Real Estate, Rental & Leasing in San Juan, PR?
Percentage of Population Employed in Real Estate, Rental & Leasing in San Juan is 2.1%.
What is the Percentage of Population Employed in Real Estate, Rental & Leasing in Puerto Rico?
Percentage of Population Employed in Real Estate, Rental & Leasing in Puerto Rico is 1.3%.
What is the Percentage of Population Employed in Real Estate, Rental & Leasing in the United States?
Percentage of Population Employed in Real Estate, Rental & Leasing in the United States is 1.9%.