Zip Codes with the Highest Percentage of Population Employed in Community & Social Service in San Juan, PR
RELATED REPORTS & OPTIONS
Community & Social Service
San Juan
Compare Zip Codes
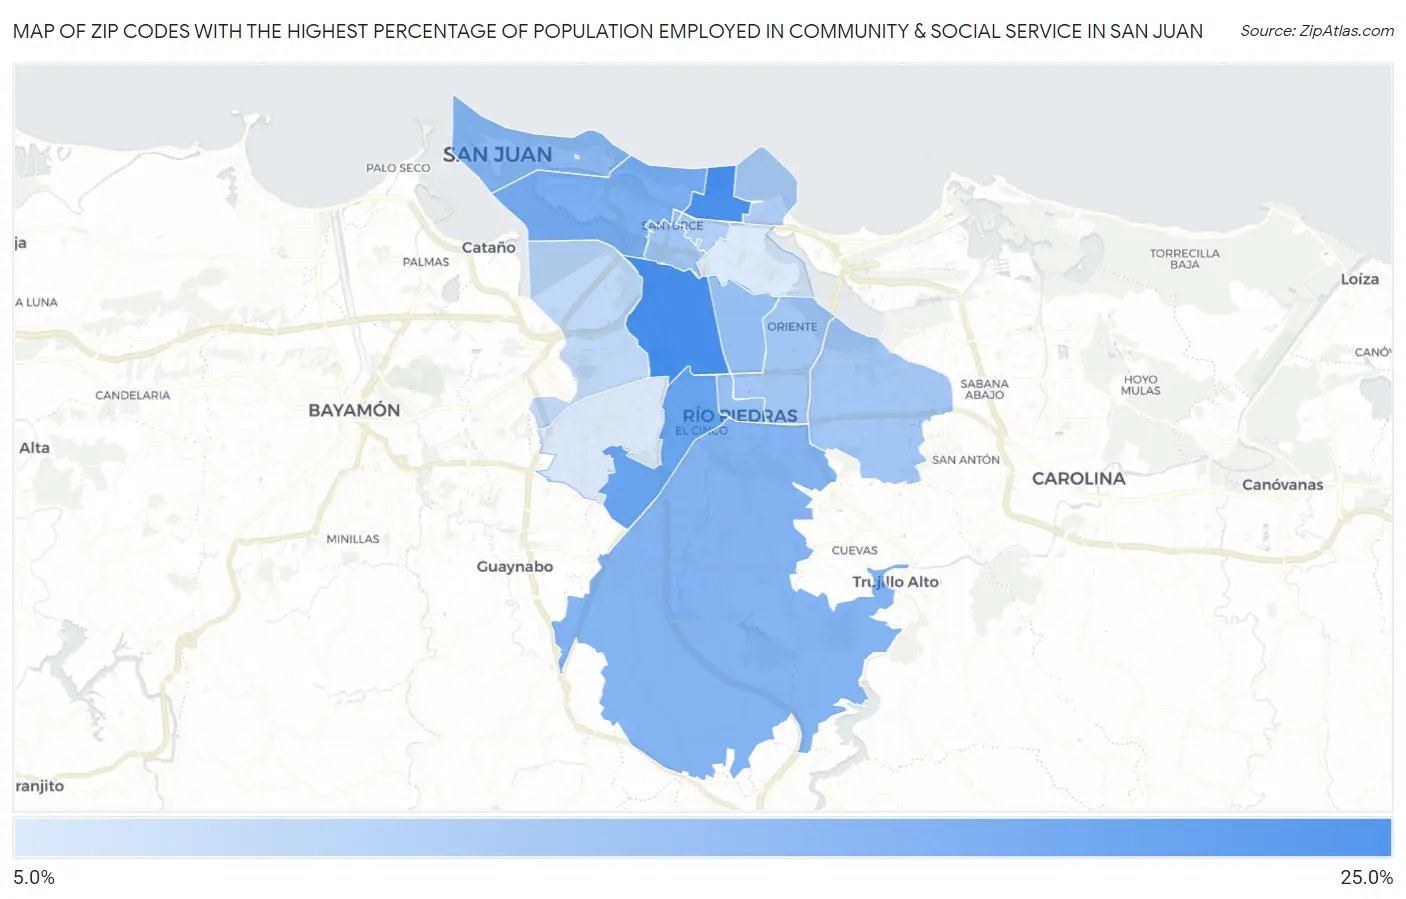
Map of Zip Codes with the Highest Percentage of Population Employed in Community & Social Service in San Juan
6.3%
21.9%
Zip Codes with the Highest Percentage of Population Employed in Community & Social Service in San Juan, PR
| Zip Code | % Employed | vs State | vs National | |
| 1. | 00918 | 21.9% | 10.2%(+11.7)#2 | 11.2%(+10.7)#1,498 |
| 2. | 00911 | 21.6% | 10.2%(+11.4)#3 | 11.2%(+10.4)#1,561 |
| 3. | 00927 | 18.2% | 10.2%(+8.00)#7 | 11.2%(+7.01)#2,703 |
| 4. | 00907 | 16.2% | 10.2%(+5.99)#11 | 11.2%(+5.00)#3,897 |
| 5. | 00926 | 15.4% | 10.2%(+5.14)#12 | 11.2%(+4.15)#4,645 |
| 6. | 00906 | 15.3% | 10.2%(+5.08)#13 | 11.2%(+4.09)#4,697 |
| 7. | 00901 | 14.4% | 10.2%(+4.20)#17 | 11.2%(+3.22)#5,555 |
| 8. | 00917 | 13.4% | 10.2%(+3.15)#18 | 11.2%(+2.16)#6,936 |
| 9. | 00925 | 13.2% | 10.2%(+3.02)#19 | 11.2%(+2.03)#7,161 |
| 10. | 00909 | 12.1% | 10.2%(+1.91)#27 | 11.2%(+0.917)#9,091 |
| 11. | 00924 | 12.1% | 10.2%(+1.86)#28 | 11.2%(+0.876)#9,190 |
| 12. | 00923 | 12.0% | 10.2%(+1.77)#30 | 11.2%(+0.781)#9,386 |
| 13. | 00913 | 10.8% | 10.2%(+0.606)#50 | 11.2%(-0.382)#12,053 |
| 14. | 00912 | 10.6% | 10.2%(+0.375)#56 | 11.2%(-0.614)#12,627 |
| 15. | 00920 | 9.4% | 10.2%(-0.868)#76 | 11.2%(-1.86)#15,806 |
| 16. | 00921 | 6.5% | 10.2%(-3.76)#113 | 11.2%(-4.75)#23,346 |
| 17. | 00915 | 6.3% | 10.2%(-3.93)#117 | 11.2%(-4.92)#23,729 |
1
Common Questions
What are the Top 10 Zip Codes with the Highest Percentage of Population Employed in Community & Social Service in San Juan, PR?
Top 10 Zip Codes with the Highest Percentage of Population Employed in Community & Social Service in San Juan, PR are:
What zip code has the Highest Percentage of Population Employed in Community & Social Service in San Juan, PR?
00918 has the Highest Percentage of Population Employed in Community & Social Service in San Juan, PR with 21.9%.
What is the Percentage of Population Employed in Community & Social Service in San Juan, PR?
Percentage of Population Employed in Community & Social Service in San Juan is 13.8%.
What is the Percentage of Population Employed in Community & Social Service in Puerto Rico?
Percentage of Population Employed in Community & Social Service in Puerto Rico is 10.2%.
What is the Percentage of Population Employed in Community & Social Service in the United States?
Percentage of Population Employed in Community & Social Service in the United States is 11.2%.