Zip Codes with the Highest Percentage of Households Without a Vehicle in San Juan, PR
RELATED REPORTS & OPTIONS
Households without a Cars
San Juan
Compare Zip Codes
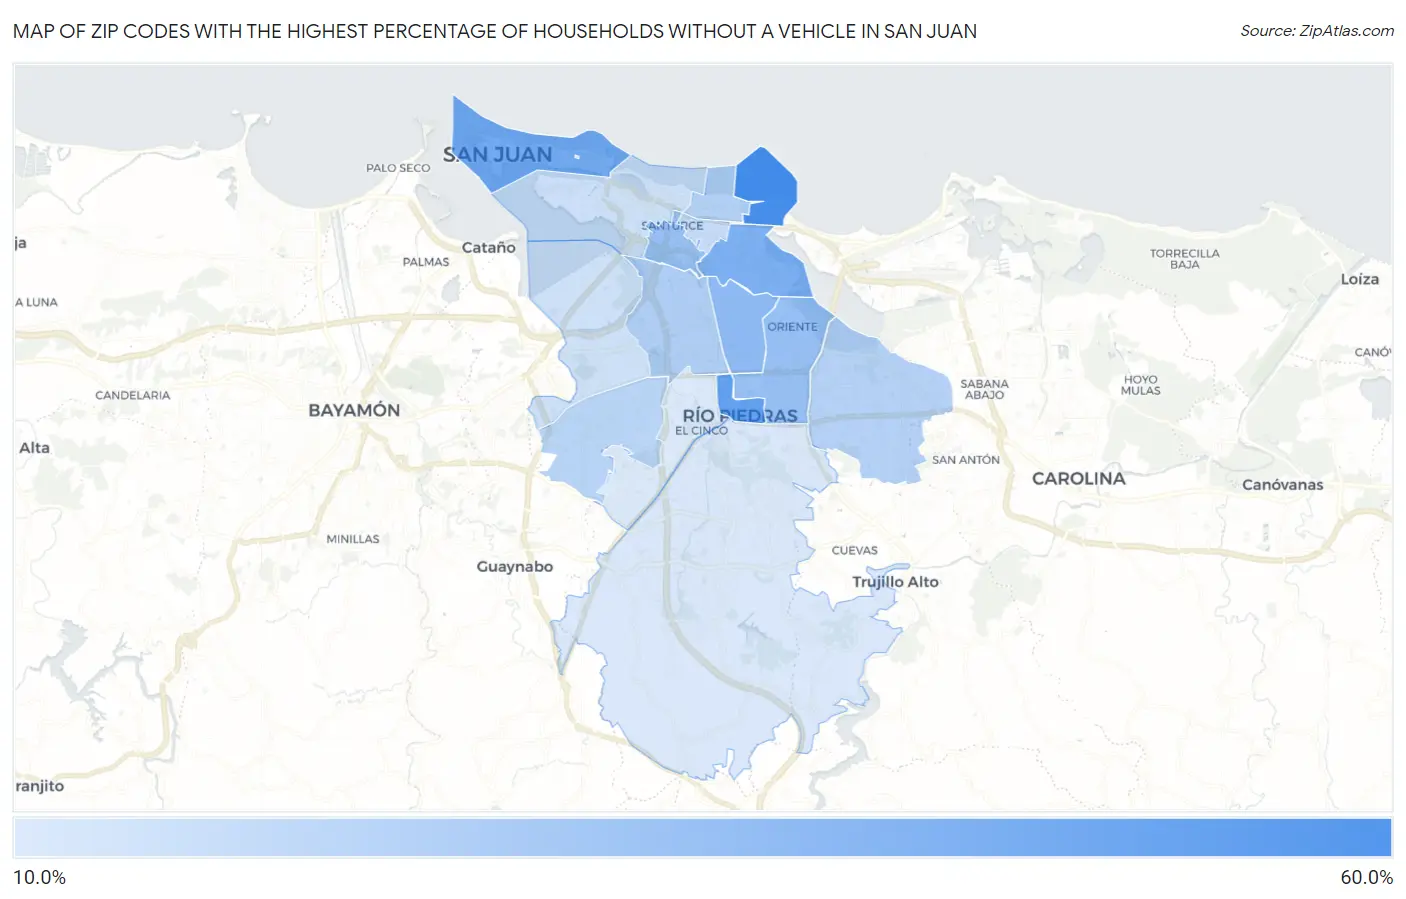
Map of Zip Codes with the Highest Percentage of Households Without a Vehicle in San Juan
12.6%
53.0%
Zip Codes with the Highest Percentage of Households Without a Vehicle in San Juan, PR
| Zip Code | Housholds Without a Car | vs State | vs National | |
| 1. | 00913 | 53.0% | 14.0%(+39.0)#2 | 8.3%(+44.7)#319 |
| 2. | 00925 | 44.3% | 14.0%(+30.3)#3 | 8.3%(+36.0)#418 |
| 3. | 00901 | 39.8% | 14.0%(+25.8)#4 | 8.3%(+31.5)#517 |
| 4. | 00915 | 37.5% | 14.0%(+23.5)#5 | 8.3%(+29.2)#577 |
| 5. | 00917 | 32.4% | 14.0%(+18.4)#6 | 8.3%(+24.1)#715 |
| 6. | 00909 | 29.8% | 14.0%(+15.8)#7 | 8.3%(+21.5)#809 |
| 7. | 00923 | 29.7% | 14.0%(+15.7)#8 | 8.3%(+21.4)#814 |
| 8. | 00918 | 23.8% | 14.0%(+9.80)#14 | 8.3%(+15.5)#1,150 |
| 9. | 00911 | 22.6% | 14.0%(+8.60)#16 | 8.3%(+14.3)#1,252 |
| 10. | 00924 | 22.1% | 14.0%(+8.10)#18 | 8.3%(+13.8)#1,292 |
| 11. | 00921 | 20.9% | 14.0%(+6.90)#20 | 8.3%(+12.6)#1,399 |
| 12. | 00912 | 18.0% | 14.0%(+4.00)#28 | 8.3%(+9.70)#1,782 |
| 13. | 00907 | 16.6% | 14.0%(+2.60)#33 | 8.3%(+8.30)#2,039 |
| 14. | 00920 | 15.9% | 14.0%(+1.90)#37 | 8.3%(+7.60)#2,177 |
| 15. | 00926 | 12.9% | 14.0%(-1.10)#67 | 8.3%(+4.60)#3,126 |
| 16. | 00927 | 12.6% | 14.0%(-1.40)#77 | 8.3%(+4.30)#3,282 |
1
Common Questions
What are the Top 10 Zip Codes with the Highest Percentage of Households Without a Vehicle in San Juan, PR?
Top 10 Zip Codes with the Highest Percentage of Households Without a Vehicle in San Juan, PR are:
What zip code has the Highest Percentage of Households Without a Vehicle in San Juan, PR?
00913 has the Highest Percentage of Households Without a Vehicle in San Juan, PR with 53.0%.
What is the Percentage of Households Without a Vehicle in San Juan, PR?
Percentage of Households Without a Vehicle in San Juan is 22.3%.
What is the Percentage of Households Without a Vehicle in Puerto Rico?
Percentage of Households Without a Vehicle in Puerto Rico is 14.0%.
What is the Percentage of Households Without a Vehicle in the United States?
Percentage of Households Without a Vehicle in the United States is 8.3%.