Zip Codes with the Highest Percentage of Population Employed in Administrative & Support Services in San Juan, PR
RELATED REPORTS & OPTIONS
Administrative & Support Services
San Juan
Compare Zip Codes
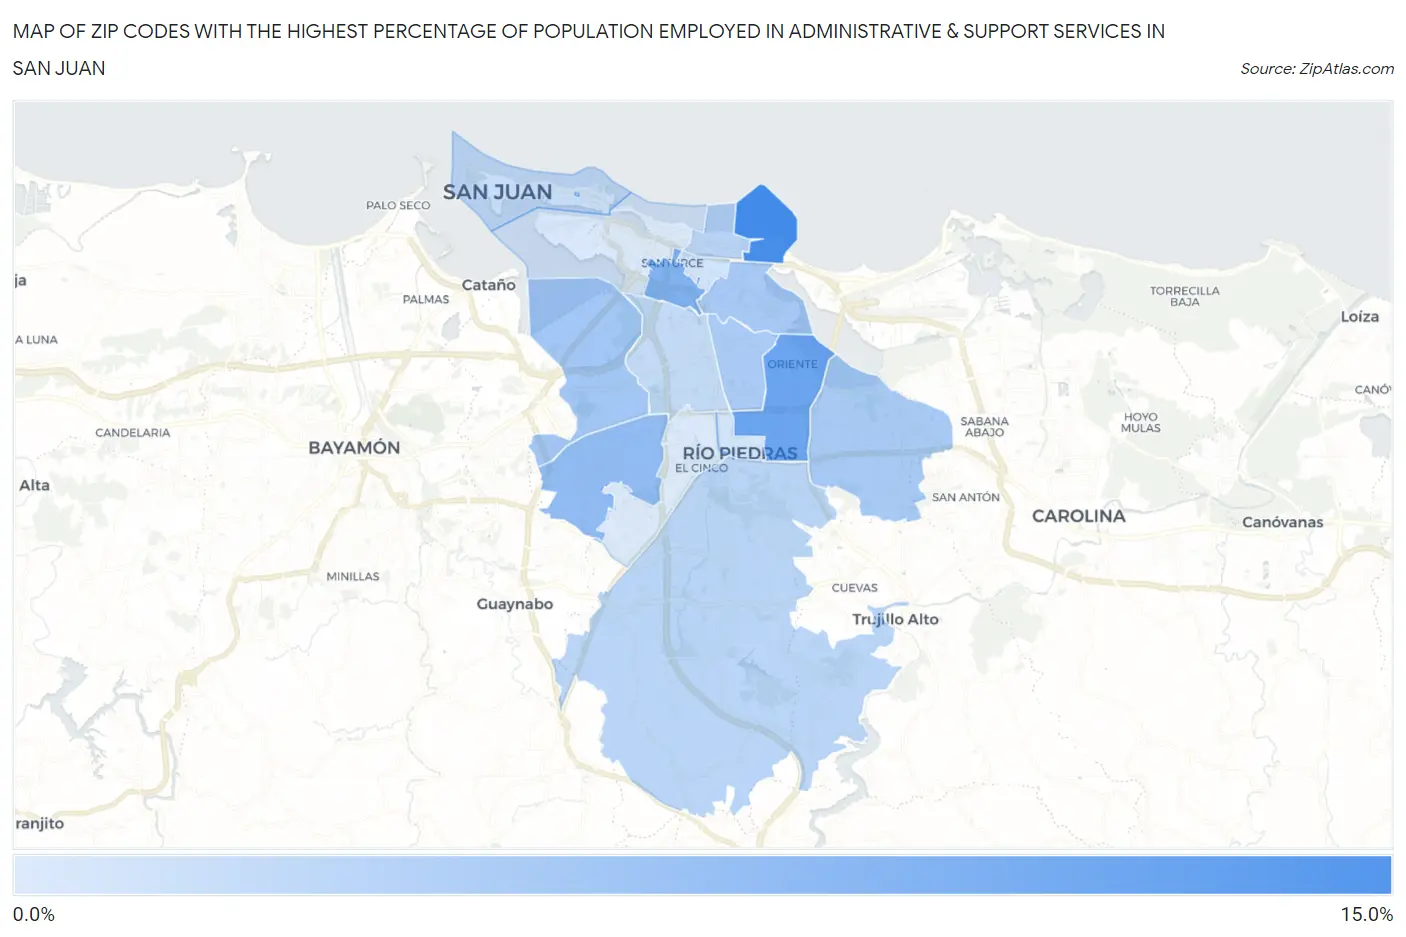
Map of Zip Codes with the Highest Percentage of Population Employed in Administrative & Support Services in San Juan
3.5%
13.1%
Zip Codes with the Highest Percentage of Population Employed in Administrative & Support Services in San Juan, PR
| Zip Code | % Employed | vs State | vs National | |
| 1. | 00913 | 13.1% | 6.2%(+6.92)#2 | 4.1%(+8.93)#713 |
| 2. | 00923 | 10.6% | 6.2%(+4.42)#9 | 4.1%(+6.43)#1,127 |
| 3. | 00909 | 9.3% | 6.2%(+3.17)#13 | 4.1%(+5.18)#1,538 |
| 4. | 00921 | 8.2% | 6.2%(+2.04)#24 | 4.1%(+4.05)#2,146 |
| 5. | 00920 | 7.1% | 6.2%(+0.957)#38 | 4.1%(+2.96)#3,076 |
| 6. | 00915 | 7.0% | 6.2%(+0.844)#41 | 4.1%(+2.85)#3,219 |
| 7. | 00924 | 6.8% | 6.2%(+0.639)#43 | 4.1%(+2.64)#3,489 |
| 8. | 00917 | 6.6% | 6.2%(+0.483)#45 | 4.1%(+2.49)#3,715 |
| 9. | 00911 | 5.8% | 6.2%(-0.357)#61 | 4.1%(+1.65)#5,154 |
| 10. | 00926 | 5.6% | 6.2%(-0.590)#71 | 4.1%(+1.41)#5,667 |
| 11. | 00918 | 5.1% | 6.2%(-1.04)#80 | 4.1%(+0.966)#6,812 |
| 12. | 00901 | 4.7% | 6.2%(-1.42)#88 | 4.1%(+0.585)#7,922 |
| 13. | 00912 | 4.2% | 6.2%(-1.98)#100 | 4.1%(+0.020)#9,961 |
| 14. | 00925 | 4.1% | 6.2%(-2.03)#101 | 4.1%(-0.028)#10,152 |
| 15. | 00907 | 3.7% | 6.2%(-2.47)#107 | 4.1%(-0.471)#12,083 |
| 16. | 00927 | 3.5% | 6.2%(-2.66)#112 | 4.1%(-0.659)#13,010 |
1
Common Questions
What are the Top 10 Zip Codes with the Highest Percentage of Population Employed in Administrative & Support Services in San Juan, PR?
Top 10 Zip Codes with the Highest Percentage of Population Employed in Administrative & Support Services in San Juan, PR are:
What zip code has the Highest Percentage of Population Employed in Administrative & Support Services in San Juan, PR?
00913 has the Highest Percentage of Population Employed in Administrative & Support Services in San Juan, PR with 13.1%.
What is the Percentage of Population Employed in Administrative & Support Services in San Juan, PR?
Percentage of Population Employed in Administrative & Support Services in San Juan is 6.2%.
What is the Percentage of Population Employed in Administrative & Support Services in Puerto Rico?
Percentage of Population Employed in Administrative & Support Services in Puerto Rico is 6.2%.
What is the Percentage of Population Employed in Administrative & Support Services in the United States?
Percentage of Population Employed in Administrative & Support Services in the United States is 4.1%.