La Yuca, PR Map & Demographics
La Yuca Map
La Yuca Overview
$14,727
PER CAPITA INCOME
$27,258
AVG FAMILY INCOME
$26,089
AVG HOUSEHOLD INCOME
0.35
INEQUALITY / GINI INDEX
329
TOTAL POPULATION
161
MALE POPULATION
168
FEMALE POPULATION
95.83
MALES / 100 FEMALES
104.35
FEMALES / 100 MALES
62.4
MEDIAN AGE
2.9
AVG FAMILY SIZE
1.9
AVG HOUSEHOLD SIZE
124
LABOR FORCE [ PEOPLE ]
37.7%
PERCENT IN LABOR FORCE
Income in La Yuca
Income Overview in La Yuca
Per Capita Income in La Yuca is $14,727, while median incomes of families and households are $27,258 and $26,089 respectively.
| Characteristic | Number | Measure |
| Per Capita Income | 329 | $14,727 |
| Median Family Income | 76 | $27,258 |
| Mean Family Income | 76 | $32,592 |
| Median Household Income | 171 | $26,089 |
| Mean Household Income | 171 | $25,705 |
| Income Deficit | 76 | $0 |
| Wage / Income Gap (%) | 329 | 0.00% |
| Wage / Income Gap ($) | 329 | 100.00¢ per $1 |
| Gini / Inequality Index | 329 | 0.35 |
Earnings by Sex in La Yuca
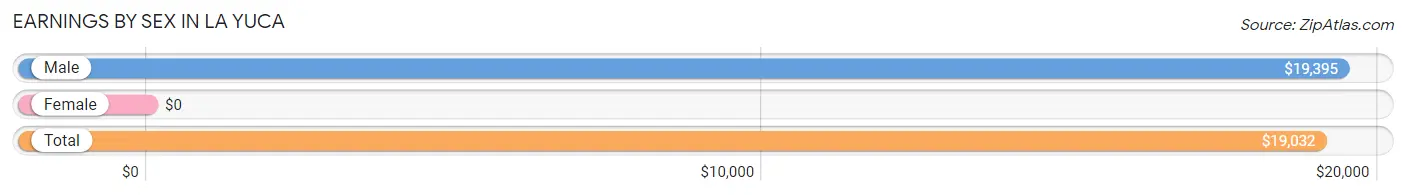
| Sex | Number | Average Earnings |
| Male | 77 (62.1%) | $19,395 |
| Female | 47 (37.9%) | $0 |
| Total | 124 (100.0%) | $19,032 |
Earnings by Sex by Income Bracket in La Yuca
The most common earnings brackets in La Yuca are $17,500 to $19,999 for men (31 | 40.3%) and $10,000 to $12,499 for women (28 | 59.6%).
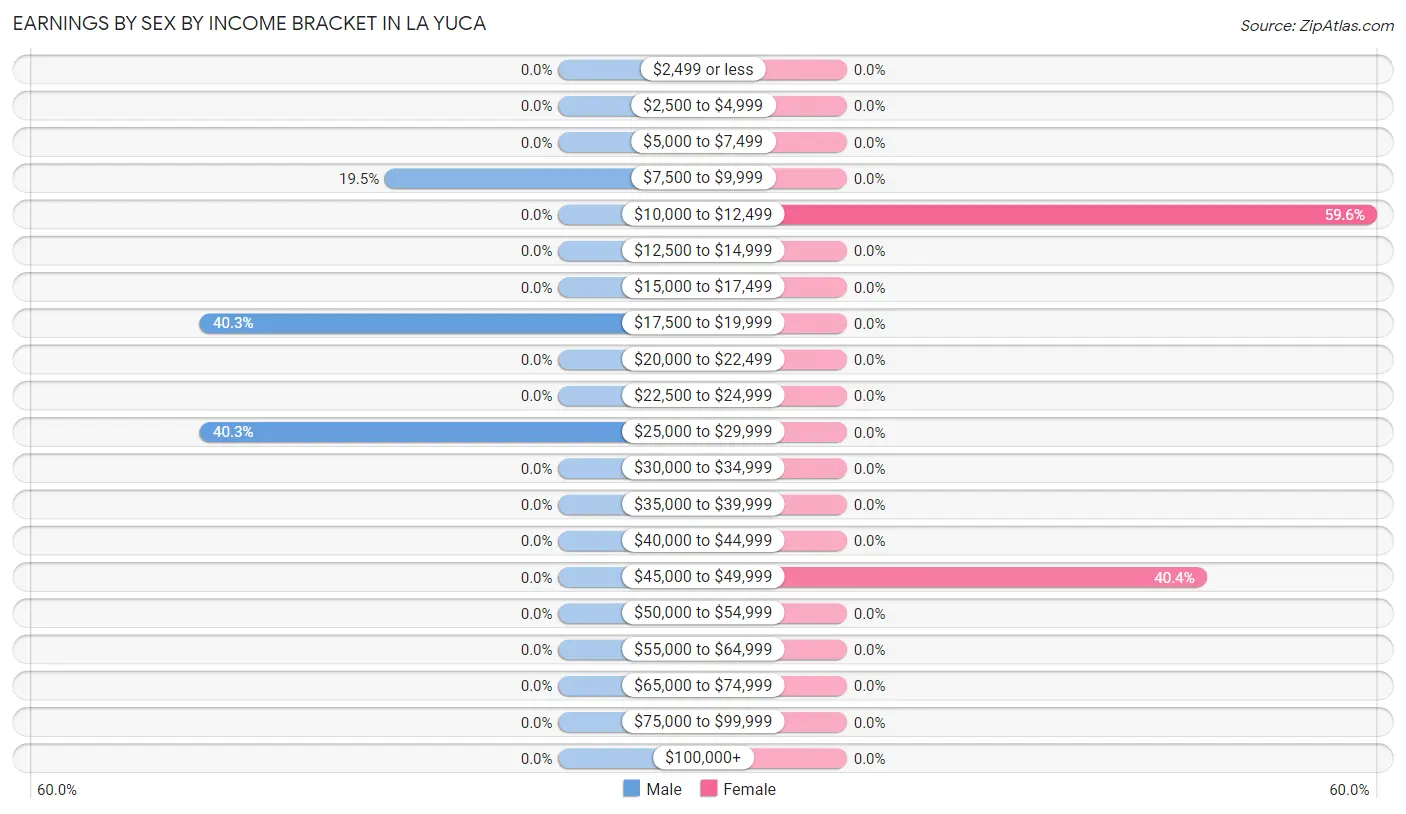
| Income | Male | Female |
| $2,499 or less | 0 (0.0%) | 0 (0.0%) |
| $2,500 to $4,999 | 0 (0.0%) | 0 (0.0%) |
| $5,000 to $7,499 | 0 (0.0%) | 0 (0.0%) |
| $7,500 to $9,999 | 15 (19.5%) | 0 (0.0%) |
| $10,000 to $12,499 | 0 (0.0%) | 28 (59.6%) |
| $12,500 to $14,999 | 0 (0.0%) | 0 (0.0%) |
| $15,000 to $17,499 | 0 (0.0%) | 0 (0.0%) |
| $17,500 to $19,999 | 31 (40.3%) | 0 (0.0%) |
| $20,000 to $22,499 | 0 (0.0%) | 0 (0.0%) |
| $22,500 to $24,999 | 0 (0.0%) | 0 (0.0%) |
| $25,000 to $29,999 | 31 (40.3%) | 0 (0.0%) |
| $30,000 to $34,999 | 0 (0.0%) | 0 (0.0%) |
| $35,000 to $39,999 | 0 (0.0%) | 0 (0.0%) |
| $40,000 to $44,999 | 0 (0.0%) | 0 (0.0%) |
| $45,000 to $49,999 | 0 (0.0%) | 19 (40.4%) |
| $50,000 to $54,999 | 0 (0.0%) | 0 (0.0%) |
| $55,000 to $64,999 | 0 (0.0%) | 0 (0.0%) |
| $65,000 to $74,999 | 0 (0.0%) | 0 (0.0%) |
| $75,000 to $99,999 | 0 (0.0%) | 0 (0.0%) |
| $100,000+ | 0 (0.0%) | 0 (0.0%) |
| Total | 77 (100.0%) | 47 (100.0%) |
Earnings by Sex by Educational Attainment in La Yuca
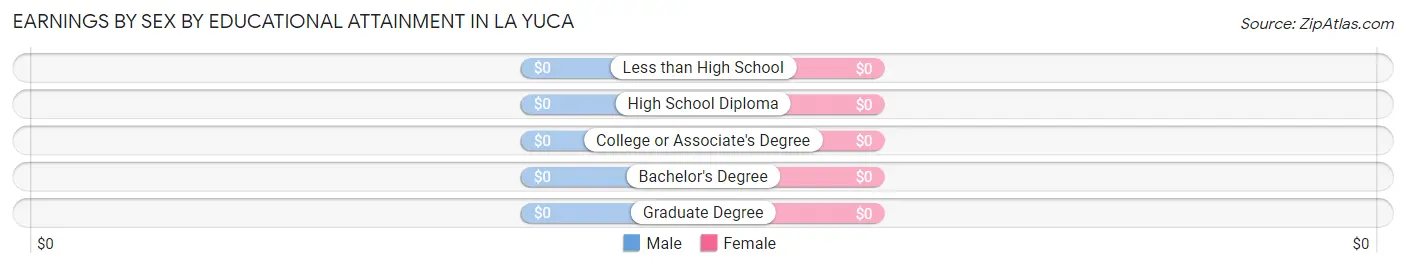
| Educational Attainment | Male Income | Female Income |
| Less than High School | - | - |
| High School Diploma | - | - |
| College or Associate's Degree | - | - |
| Bachelor's Degree | - | - |
| Graduate Degree | - | - |
| Total | $19,395 | $0 |
Family Income in La Yuca
Family Income Brackets in La Yuca
According to the La Yuca family income data, there are 46 families falling into the $25,000 to $34,999 income range, which is the most common income bracket and makes up 60.5% of all families.
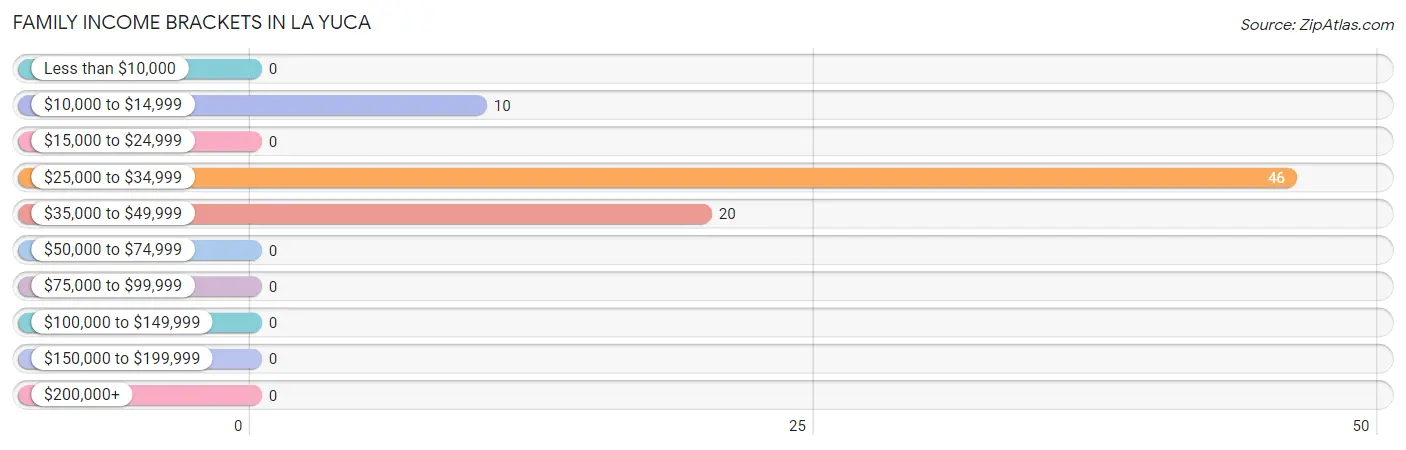
| Income Bracket | # Families | % Families |
| Less than $10,000 | 0 | 0.0% |
| $10,000 to $14,999 | 10 | 13.2% |
| $15,000 to $24,999 | 0 | 0.0% |
| $25,000 to $34,999 | 46 | 60.5% |
| $35,000 to $49,999 | 20 | 26.3% |
| $50,000 to $74,999 | 0 | 0.0% |
| $75,000 to $99,999 | 0 | 0.0% |
| $100,000 to $149,999 | 0 | 0.0% |
| $150,000 to $199,999 | 0 | 0.0% |
| $200,000+ | 0 | 0.0% |
Family Income by Famaliy Size in La Yuca
3-person families (45 | 59.2%) account for the highest median family income in La Yuca with $34,583 per family, while 3-person families (45 | 59.2%) have the highest median income of $11,528 per family member.
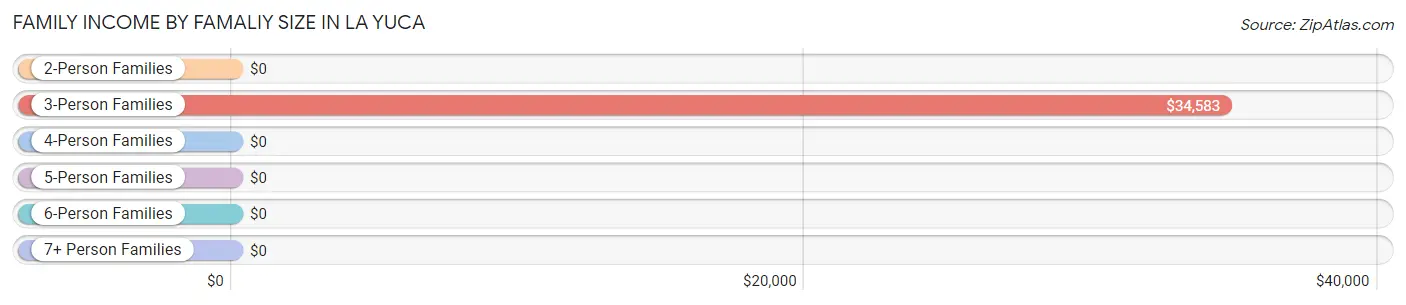
| Income Bracket | # Families | Median Income |
| 2-Person Families | 31 (40.8%) | $0 |
| 3-Person Families | 45 (59.2%) | $34,583 |
| 4-Person Families | 0 (0.0%) | $0 |
| 5-Person Families | 0 (0.0%) | $0 |
| 6-Person Families | 0 (0.0%) | $0 |
| 7+ Person Families | 0 (0.0%) | $0 |
| Total | 76 (100.0%) | $27,258 |
Family Income by Number of Earners in La Yuca
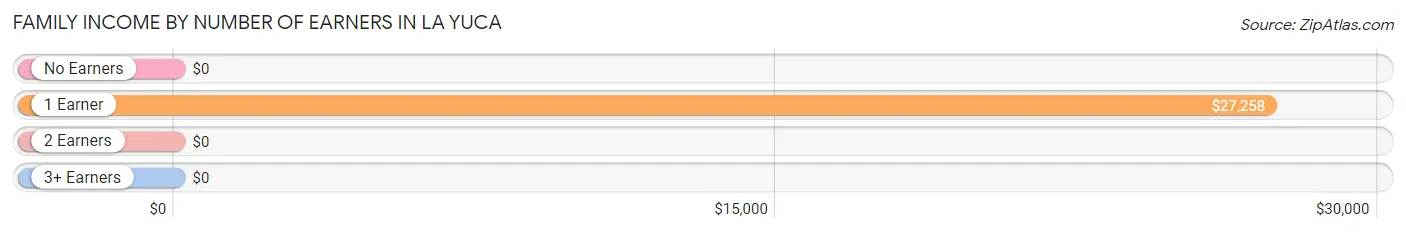
| Number of Earners | # Families | Median Income |
| No Earners | 0 (0.0%) | $0 |
| 1 Earner | 76 (100.0%) | $27,258 |
| 2 Earners | 0 (0.0%) | $0 |
| 3+ Earners | 0 (0.0%) | $0 |
| Total | 76 (100.0%) | $27,258 |
Household Income in La Yuca
Household Income Brackets in La Yuca
With 62 households falling in the category, the less than $10,000 income range is the most frequent in La Yuca, accounting for 36.3% of all households.
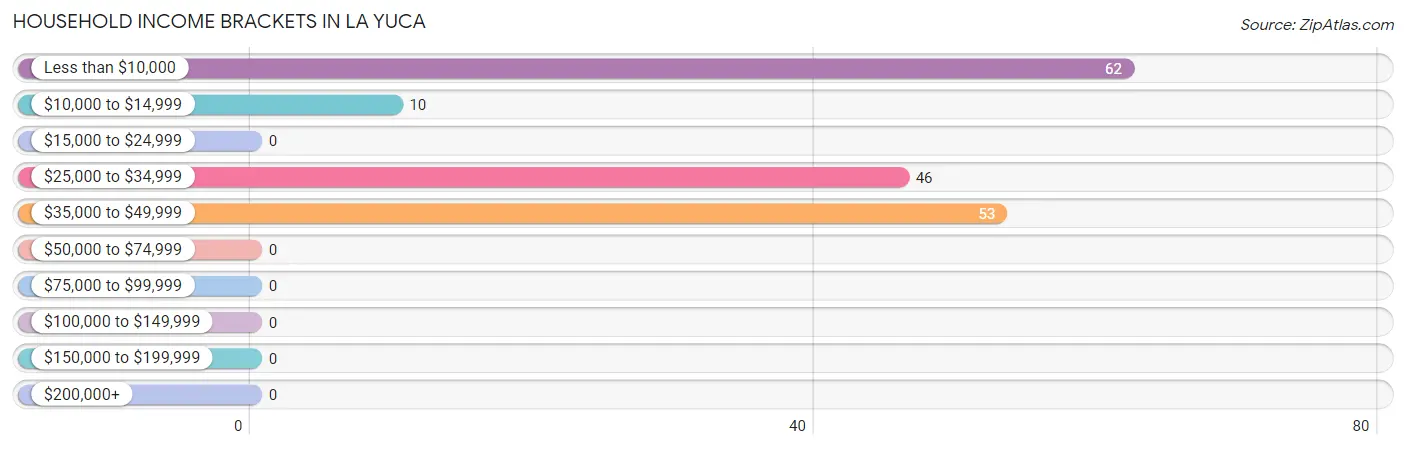
| Income Bracket | # Households | % Households |
| Less than $10,000 | 62 | 36.3% |
| $10,000 to $14,999 | 10 | 5.8% |
| $15,000 to $24,999 | 0 | 0.0% |
| $25,000 to $34,999 | 46 | 26.9% |
| $35,000 to $49,999 | 53 | 31.0% |
| $50,000 to $74,999 | 0 | 0.0% |
| $75,000 to $99,999 | 0 | 0.0% |
| $100,000 to $149,999 | 0 | 0.0% |
| $150,000 to $199,999 | 0 | 0.0% |
| $200,000+ | 0 | 0.0% |
Household Income by Householder Age in La Yuca
| Income Bracket | # Households | Median Income |
| 15 to 24 Years | 0 (0.0%) | $0 |
| 25 to 44 Years | 31 (18.1%) | $0 |
| 45 to 64 Years | 37 (21.6%) | $0 |
| 65+ Years | 103 (60.2%) | $0 |
| Total | 171 (100.0%) | $26,089 |
Poverty in La Yuca
Income Below Poverty by Sex and Age in La Yuca
With 29.8% poverty level for males and 38.1% for females among the residents of La Yuca, 45 to 54 year old males and 45 to 54 year old females are the most vulnerable to poverty, with 15 males (100.0%) and 15 females (100.0%) in their respective age groups living below the poverty level.
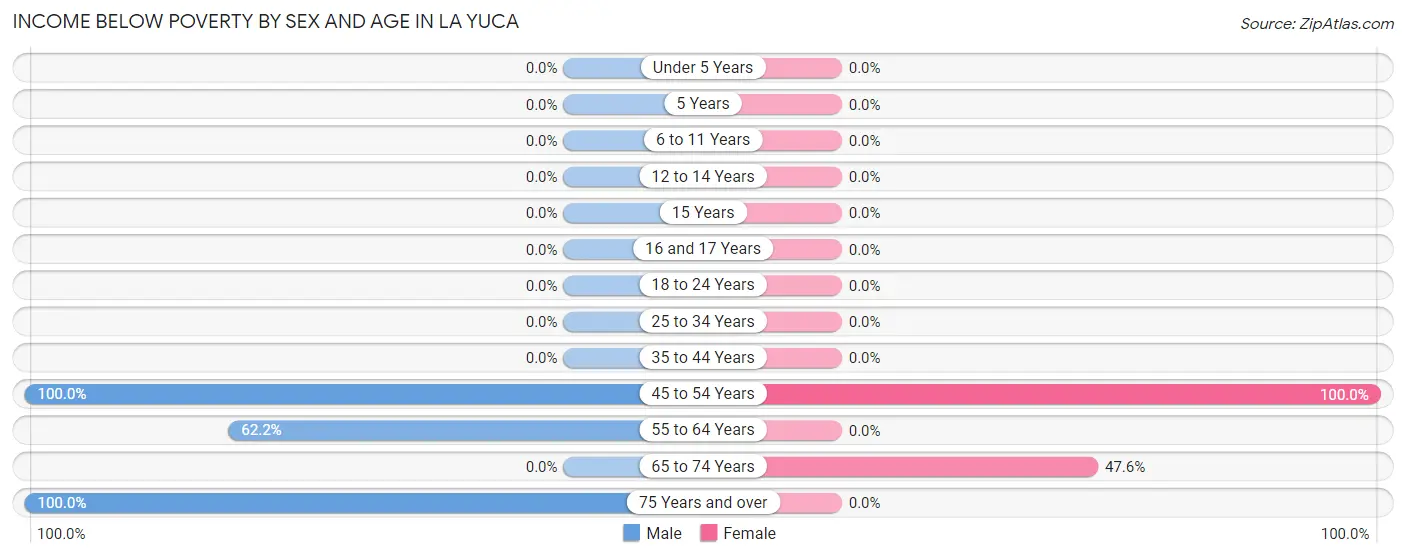
| Age Bracket | Male | Female |
| Under 5 Years | 0 (0.0%) | 0 (0.0%) |
| 5 Years | 0 (0.0%) | 0 (0.0%) |
| 6 to 11 Years | 0 (0.0%) | 0 (0.0%) |
| 12 to 14 Years | 0 (0.0%) | 0 (0.0%) |
| 15 Years | 0 (0.0%) | 0 (0.0%) |
| 16 and 17 Years | 0 (0.0%) | 0 (0.0%) |
| 18 to 24 Years | 0 (0.0%) | 0 (0.0%) |
| 25 to 34 Years | 0 (0.0%) | 0 (0.0%) |
| 35 to 44 Years | 0 (0.0%) | 0 (0.0%) |
| 45 to 54 Years | 15 (100.0%) | 15 (100.0%) |
| 55 to 64 Years | 23 (62.2%) | 0 (0.0%) |
| 65 to 74 Years | 0 (0.0%) | 49 (47.6%) |
| 75 Years and over | 10 (100.0%) | 0 (0.0%) |
| Total | 48 (29.8%) | 64 (38.1%) |
Income Above Poverty by Sex and Age in La Yuca
According to the poverty statistics in La Yuca, males aged 25 to 34 years and females aged 25 to 34 years are the age groups that are most secure financially, with 100.0% of males and 100.0% of females in these age groups living above the poverty line.
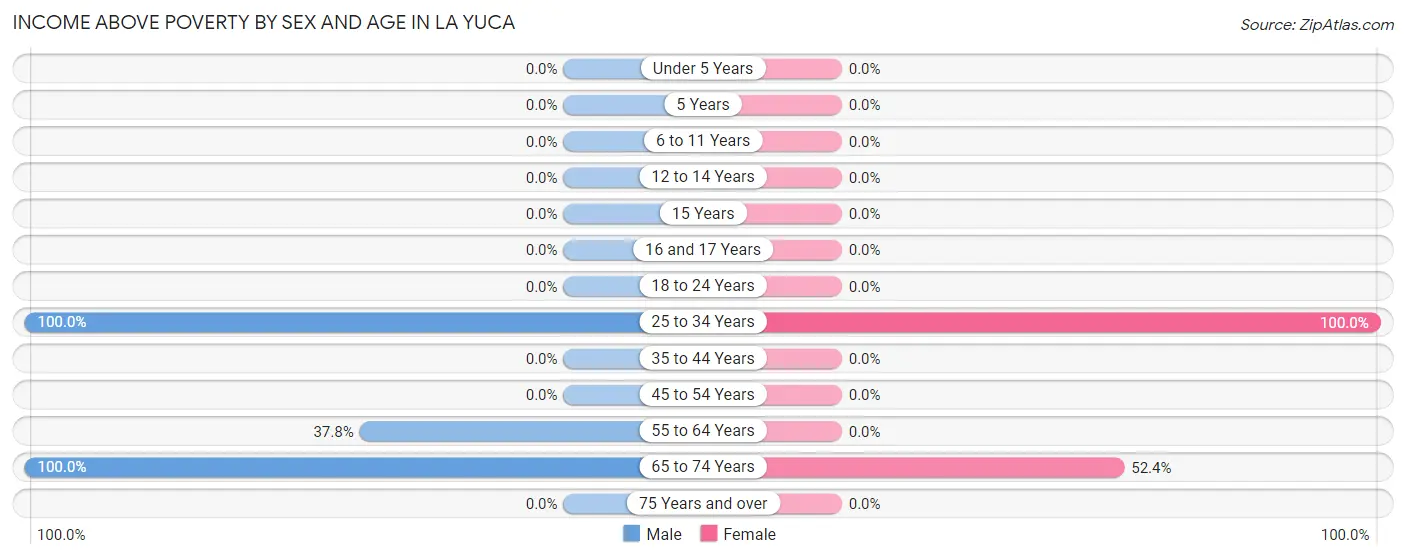
| Age Bracket | Male | Female |
| Under 5 Years | 0 (0.0%) | 0 (0.0%) |
| 5 Years | 0 (0.0%) | 0 (0.0%) |
| 6 to 11 Years | 0 (0.0%) | 0 (0.0%) |
| 12 to 14 Years | 0 (0.0%) | 0 (0.0%) |
| 15 Years | 0 (0.0%) | 0 (0.0%) |
| 16 and 17 Years | 0 (0.0%) | 0 (0.0%) |
| 18 to 24 Years | 0 (0.0%) | 0 (0.0%) |
| 25 to 34 Years | 62 (100.0%) | 50 (100.0%) |
| 35 to 44 Years | 0 (0.0%) | 0 (0.0%) |
| 45 to 54 Years | 0 (0.0%) | 0 (0.0%) |
| 55 to 64 Years | 14 (37.8%) | 0 (0.0%) |
| 65 to 74 Years | 37 (100.0%) | 54 (52.4%) |
| 75 Years and over | 0 (0.0%) | 0 (0.0%) |
| Total | 113 (70.2%) | 104 (61.9%) |
Income Below Poverty Among Married-Couple Families in La Yuca
The poverty statistics for married-couple families in La Yuca show that 13.2% or 10 of the total 76 families live below the poverty line. Families with no children have the highest poverty rate of 13.2%, comprising of 10 families. On the other hand, families with no children have the lowest poverty rate of 13.2%, which includes 10 families.
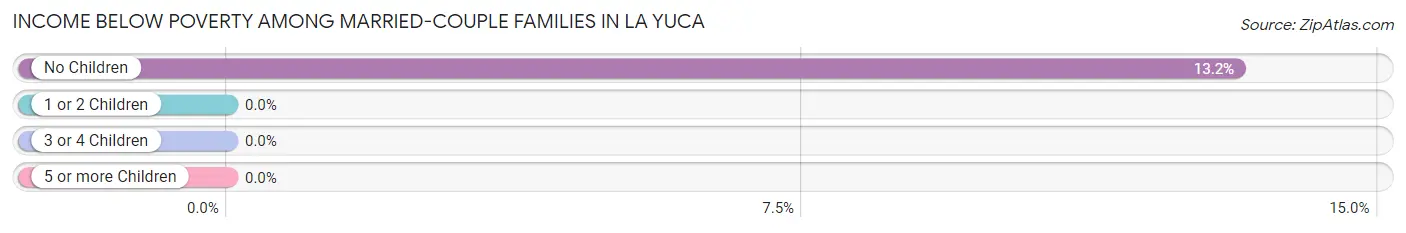
| Children | Above Poverty | Below Poverty |
| No Children | 66 (86.8%) | 10 (13.2%) |
| 1 or 2 Children | 0 (0.0%) | 0 (0.0%) |
| 3 or 4 Children | 0 (0.0%) | 0 (0.0%) |
| 5 or more Children | 0 (0.0%) | 0 (0.0%) |
| Total | 66 (86.8%) | 10 (13.2%) |
Income Below Poverty Among Single-Parent Households in La Yuca
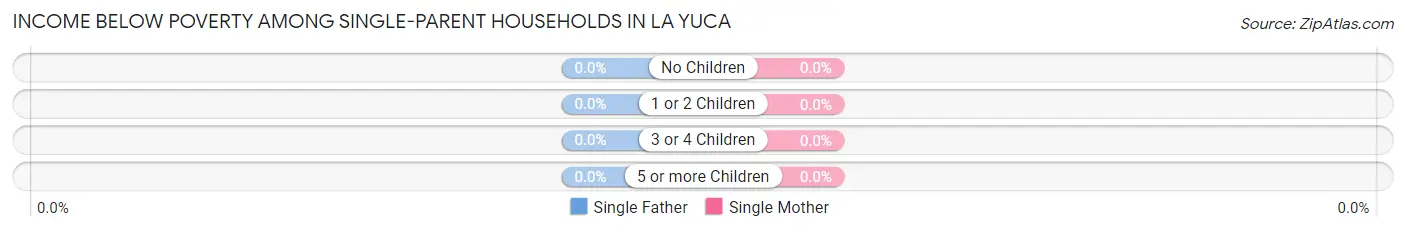
| Children | Single Father | Single Mother |
| No Children | 0 (0.0%) | 0 (0.0%) |
| 1 or 2 Children | 0 (0.0%) | 0 (0.0%) |
| 3 or 4 Children | 0 (0.0%) | 0 (0.0%) |
| 5 or more Children | 0 (0.0%) | 0 (0.0%) |
| Total | 0 (0.0%) | 0 (0.0%) |
Income Below Poverty Among Married-Couple vs Single-Parent Households in La Yuca
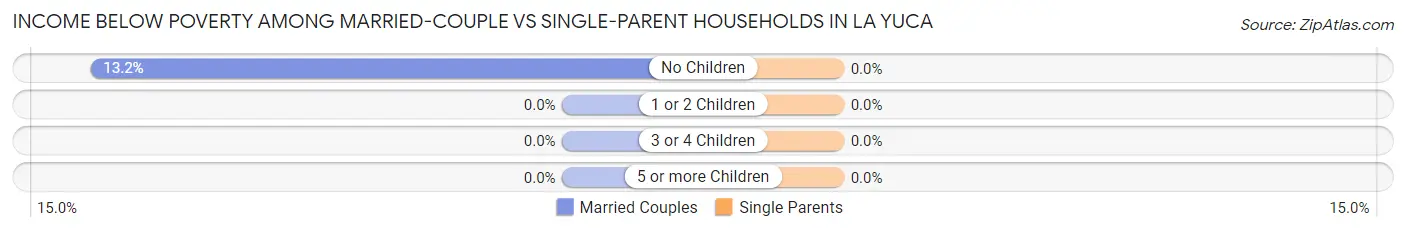
| Children | Married-Couple Families | Single-Parent Households |
| No Children | 10 (13.2%) | 0 (0.0%) |
| 1 or 2 Children | 0 (0.0%) | 0 (0.0%) |
| 3 or 4 Children | 0 (0.0%) | 0 (0.0%) |
| 5 or more Children | 0 (0.0%) | 0 (0.0%) |
| Total | 10 (13.2%) | 0 (0.0%) |
Race in La Yuca
The most populous races in La Yuca are Hispanic or Latino (329 | 100.0%), White / Caucasian (133 | 40.4%), and Two or more Races (127 | 38.6%).
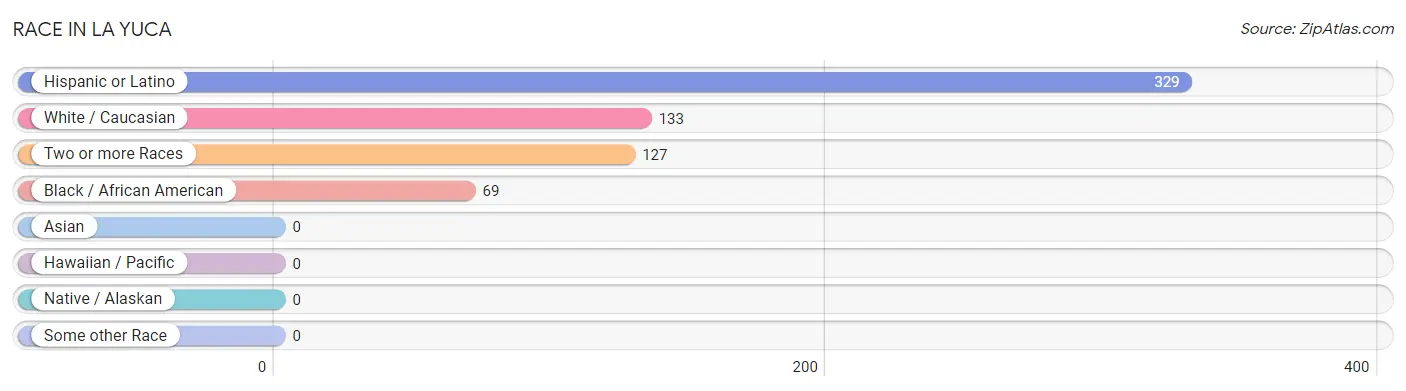
| Race | # Population | % Population |
| Asian | 0 | 0.0% |
| Black / African American | 69 | 21.0% |
| Hawaiian / Pacific | 0 | 0.0% |
| Hispanic or Latino | 329 | 100.0% |
| Native / Alaskan | 0 | 0.0% |
| White / Caucasian | 133 | 40.4% |
| Two or more Races | 127 | 38.6% |
| Some other Race | 0 | 0.0% |
| Total | 329 | 100.0% |
Ancestry in La Yuca
The most populous ancestries reported in La Yuca are , and Puerto Rican (329 | 100.0%), together accounting for 100.0% of all La Yuca residents.

| Ancestry | # Population | % Population |
| Puerto Rican | 329 | 100.0% | View All 1 Rows |
Immigrants in La Yuca

| Immigration Origin | # Population | % Population | View All 0 Rows |
Sex and Age in La Yuca
Sex and Age in La Yuca
The most populous age groups in La Yuca are 60 to 64 Years (37 | 23.0%) for men and 65 to 69 Years (93 | 55.4%) for women.
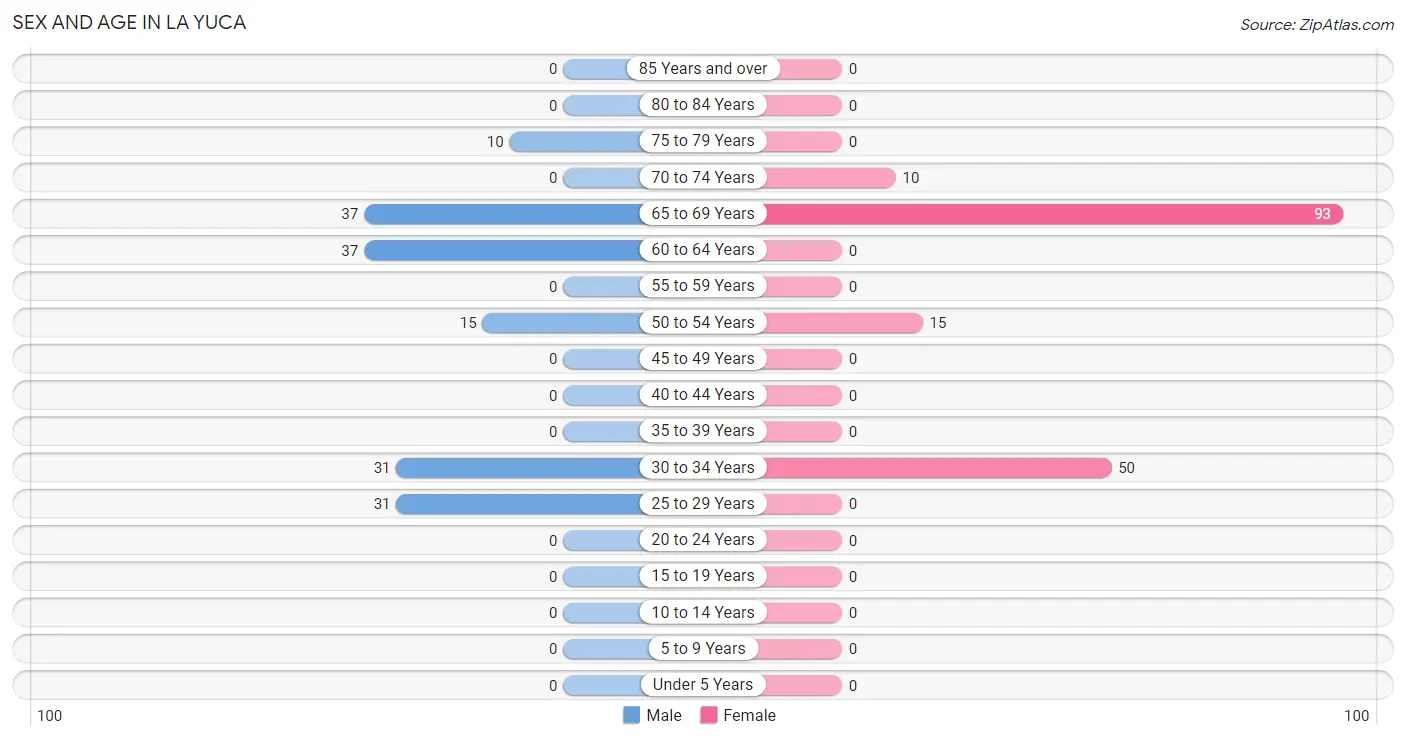
| Age Bracket | Male | Female |
| Under 5 Years | 0 (0.0%) | 0 (0.0%) |
| 5 to 9 Years | 0 (0.0%) | 0 (0.0%) |
| 10 to 14 Years | 0 (0.0%) | 0 (0.0%) |
| 15 to 19 Years | 0 (0.0%) | 0 (0.0%) |
| 20 to 24 Years | 0 (0.0%) | 0 (0.0%) |
| 25 to 29 Years | 31 (19.3%) | 0 (0.0%) |
| 30 to 34 Years | 31 (19.3%) | 50 (29.8%) |
| 35 to 39 Years | 0 (0.0%) | 0 (0.0%) |
| 40 to 44 Years | 0 (0.0%) | 0 (0.0%) |
| 45 to 49 Years | 0 (0.0%) | 0 (0.0%) |
| 50 to 54 Years | 15 (9.3%) | 15 (8.9%) |
| 55 to 59 Years | 0 (0.0%) | 0 (0.0%) |
| 60 to 64 Years | 37 (23.0%) | 0 (0.0%) |
| 65 to 69 Years | 37 (23.0%) | 93 (55.4%) |
| 70 to 74 Years | 0 (0.0%) | 10 (5.9%) |
| 75 to 79 Years | 10 (6.2%) | 0 (0.0%) |
| 80 to 84 Years | 0 (0.0%) | 0 (0.0%) |
| 85 Years and over | 0 (0.0%) | 0 (0.0%) |
| Total | 161 (100.0%) | 168 (100.0%) |
Families and Households in La Yuca
Median Family Size in La Yuca
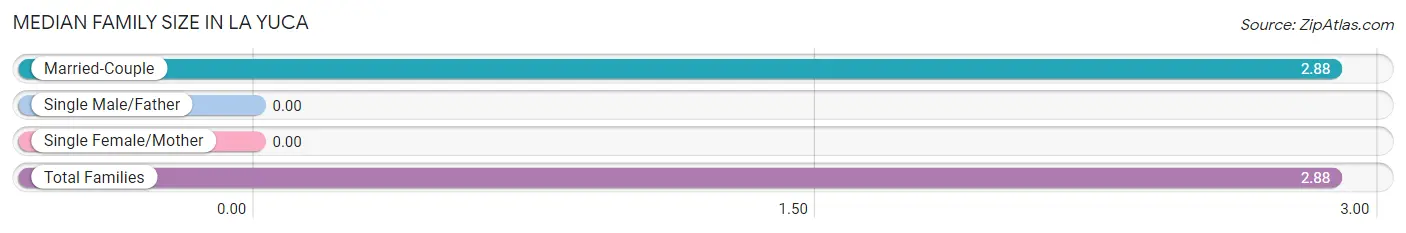
| Family Type | # Families | Family Size |
| Married-Couple | 76 (100.0%) | 2.88 |
| Single Male/Father | 0 (0.0%) | - |
| Single Female/Mother | 0 (0.0%) | - |
| Total Families | 76 (100.0%) | 2.88 |
Median Household Size in La Yuca
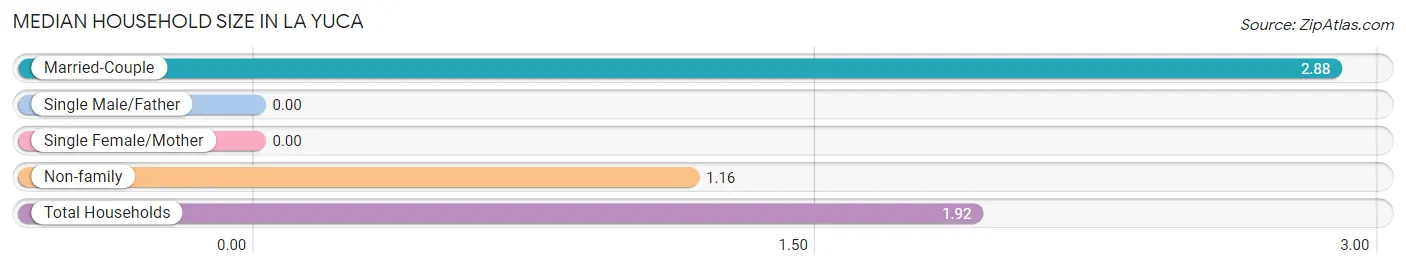
| Household Type | # Households | Household Size |
| Married-Couple | 76 (44.4%) | 2.88 |
| Single Male/Father | 0 (0.0%) | - |
| Single Female/Mother | 0 (0.0%) | - |
| Non-family | 95 (55.6%) | 1.16 |
| Total Households | 171 (100.0%) | 1.92 |
Household Size by Marriage Status in La Yuca
Out of a total of 171 households in La Yuca, 76 (44.4%) are family households, while 95 (55.6%) are nonfamily households. The most numerous type of family households are 3-person households, comprising 45, and the most common type of nonfamily households are 1-person households, comprising 81.
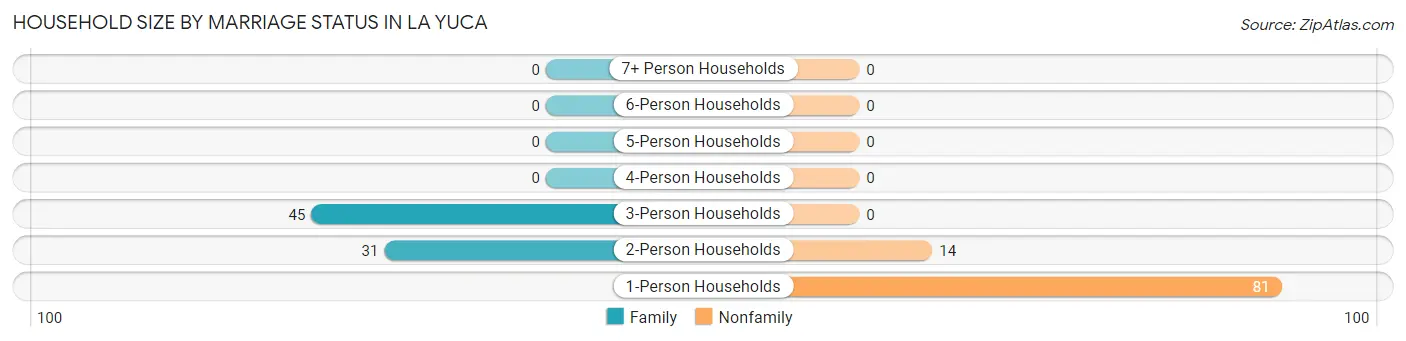
| Household Size | Family Households | Nonfamily Households |
| 1-Person Households | - | 81 (47.4%) |
| 2-Person Households | 31 (18.1%) | 14 (8.2%) |
| 3-Person Households | 45 (26.3%) | 0 (0.0%) |
| 4-Person Households | 0 (0.0%) | 0 (0.0%) |
| 5-Person Households | 0 (0.0%) | 0 (0.0%) |
| 6-Person Households | 0 (0.0%) | 0 (0.0%) |
| 7+ Person Households | 0 (0.0%) | 0 (0.0%) |
| Total | 76 (44.4%) | 95 (55.6%) |
Female Fertility in La Yuca
Fertility by Age in La Yuca
| Age Bracket | Women with Births | Births / 1,000 Women |
| 15 to 19 years | 0 (0.0%) | 0.0 |
| 20 to 34 years | 0 (0.0%) | 0.0 |
| 35 to 50 years | 0 (0.0%) | 0.0 |
| Total | 0 (0.0%) | 0.0 |
Fertility by Age by Marriage Status in La Yuca
| Age Bracket | Married | Unmarried |
| 15 to 19 years | 0 (0.0%) | 0 (0.0%) |
| 20 to 34 years | 0 (0.0%) | 0 (0.0%) |
| 35 to 50 years | 0 (0.0%) | 0 (0.0%) |
| Total | 0 (0.0%) | 0 (0.0%) |
Fertility by Education in La Yuca
| Educational Attainment | Women with Births | Births / 1,000 Women |
| Less than High School | 0 (0.0%) | 0.0 |
| High School Diploma | 0 (0.0%) | 0.0 |
| College or Associate's Degree | 0 (0.0%) | 0.0 |
| Bachelor's Degree | 0 (0.0%) | 0.0 |
| Graduate Degree | 0 (0.0%) | 0.0 |
| Total | 0 (0.0%) | 0.0 |
Fertility by Education by Marriage Status in La Yuca
| Educational Attainment | Married | Unmarried |
| Less than High School | 0 (0.0%) | 0 (0.0%) |
| High School Diploma | 0 (0.0%) | 0 (0.0%) |
| College or Associate's Degree | 0 (0.0%) | 0 (0.0%) |
| Bachelor's Degree | 0 (0.0%) | 0 (0.0%) |
| Graduate Degree | 0 (0.0%) | 0 (0.0%) |
| Total | 0 (0.0%) | 0 (0.0%) |
Employment Characteristics in La Yuca
Employment by Class of Employer in La Yuca
Among the 124 employed individuals in La Yuca, private company employees (74 | 59.7%), federal government employees (31 | 25.0%), and local government employees (19 | 15.3%) make up the most common classes of employment.
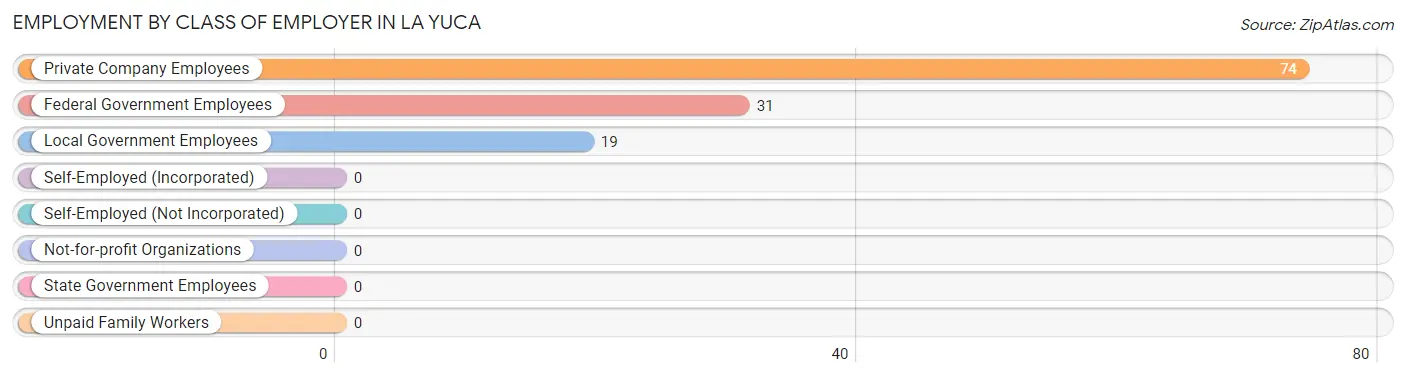
| Employer Class | # Employees | % Employees |
| Private Company Employees | 74 | 59.7% |
| Self-Employed (Incorporated) | 0 | 0.0% |
| Self-Employed (Not Incorporated) | 0 | 0.0% |
| Not-for-profit Organizations | 0 | 0.0% |
| Local Government Employees | 19 | 15.3% |
| State Government Employees | 0 | 0.0% |
| Federal Government Employees | 31 | 25.0% |
| Unpaid Family Workers | 0 | 0.0% |
| Total | 124 | 100.0% |
Employment Status by Age in La Yuca
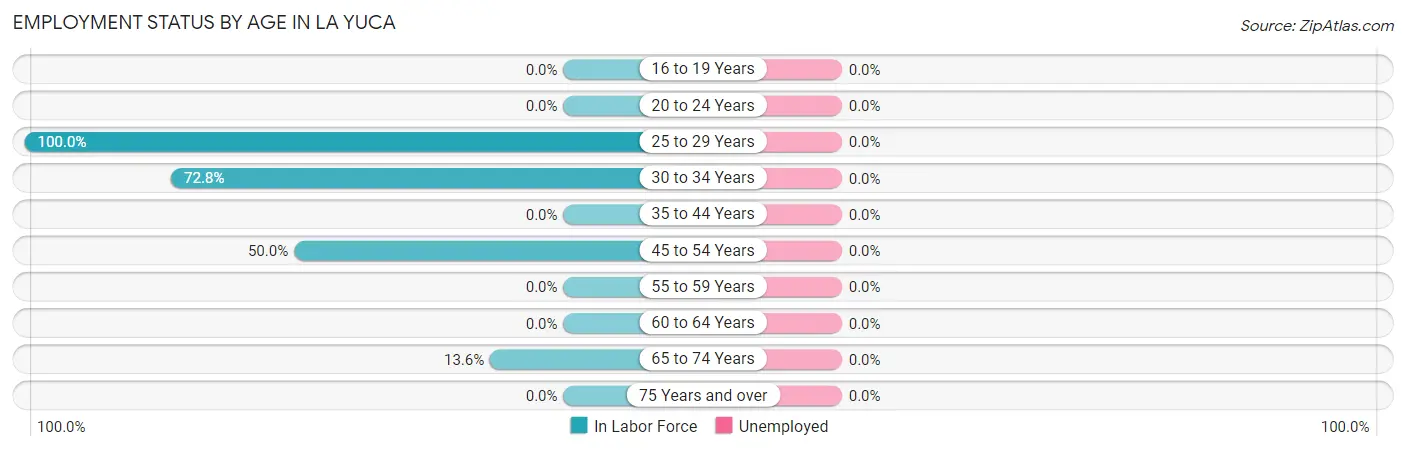
| Age Bracket | In Labor Force | Unemployed |
| 16 to 19 Years | 0 (0.0%) | 0 (0.0%) |
| 20 to 24 Years | 0 (0.0%) | 0 (0.0%) |
| 25 to 29 Years | 31 (100.0%) | 0 (0.0%) |
| 30 to 34 Years | 59 (72.8%) | 0 (0.0%) |
| 35 to 44 Years | 0 (0.0%) | 0 (0.0%) |
| 45 to 54 Years | 15 (50.0%) | 0 (0.0%) |
| 55 to 59 Years | 0 (0.0%) | 0 (0.0%) |
| 60 to 64 Years | 0 (0.0%) | 0 (0.0%) |
| 65 to 74 Years | 19 (13.6%) | 0 (0.0%) |
| 75 Years and over | 0 (0.0%) | 0 (0.0%) |
| Total | 124 (37.7%) | 0 (0.0%) |
Employment Status by Educational Attainment in La Yuca
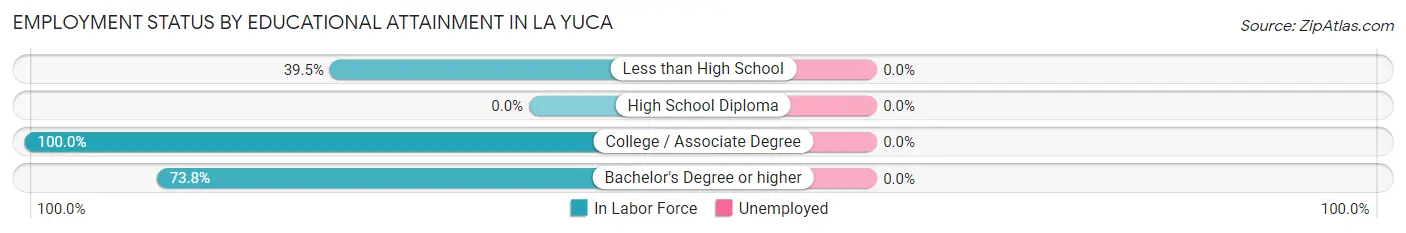
| Educational Attainment | In Labor Force | Unemployed |
| Less than High School | 15 (39.5%) | 0 (0.0%) |
| High School Diploma | 0 (0.0%) | 0 (0.0%) |
| College / Associate Degree | 28 (100.0%) | 0 (0.0%) |
| Bachelor's Degree or higher | 62 (73.8%) | 0 (0.0%) |
| Total | 105 (58.7%) | 0 (0.0%) |
Employment Occupations by Sex in La Yuca
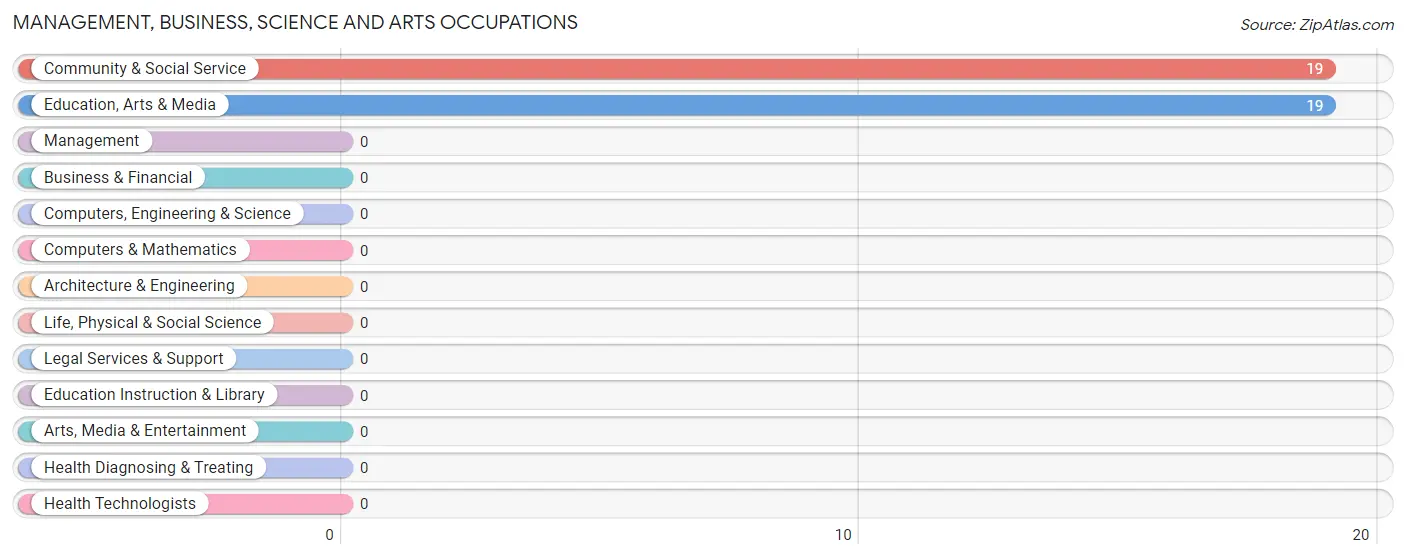
Management, Business, Science and Arts Occupations
The most common Management, Business, Science and Arts occupations in La Yuca are Community & Social Service (19 | 15.3%), and Education, Arts & Media (19 | 15.3%).
Management, Business, Science and Arts Occupations by Sex
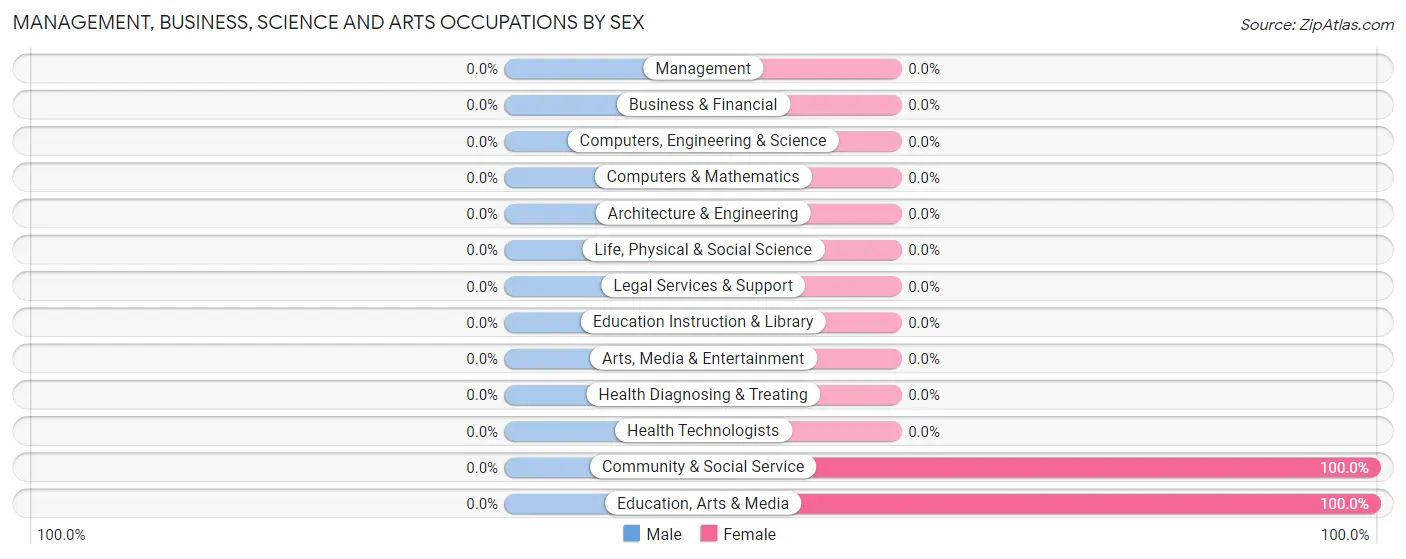
| Occupation | Male | Female |
| Management | 0 (0.0%) | 0 (0.0%) |
| Business & Financial | 0 (0.0%) | 0 (0.0%) |
| Computers, Engineering & Science | 0 (0.0%) | 0 (0.0%) |
| Computers & Mathematics | 0 (0.0%) | 0 (0.0%) |
| Architecture & Engineering | 0 (0.0%) | 0 (0.0%) |
| Life, Physical & Social Science | 0 (0.0%) | 0 (0.0%) |
| Community & Social Service | 0 (0.0%) | 19 (100.0%) |
| Education, Arts & Media | 0 (0.0%) | 19 (100.0%) |
| Legal Services & Support | 0 (0.0%) | 0 (0.0%) |
| Education Instruction & Library | 0 (0.0%) | 0 (0.0%) |
| Arts, Media & Entertainment | 0 (0.0%) | 0 (0.0%) |
| Health Diagnosing & Treating | 0 (0.0%) | 0 (0.0%) |
| Health Technologists | 0 (0.0%) | 0 (0.0%) |
| Total (Category) | 0 (0.0%) | 19 (100.0%) |
| Total (Overall) | 77 (62.1%) | 47 (37.9%) |
Services Occupations
Services Occupations by Sex
| Occupation | Male | Female |
| Healthcare Support | 0 (0.0%) | 0 (0.0%) |
| Security & Protection | 0 (0.0%) | 0 (0.0%) |
| Firefighting & Prevention | 0 (0.0%) | 0 (0.0%) |
| Law Enforcement | 0 (0.0%) | 0 (0.0%) |
| Food Preparation & Serving | 0 (0.0%) | 0 (0.0%) |
| Cleaning & Maintenance | 0 (0.0%) | 0 (0.0%) |
| Personal Care & Service | 0 (0.0%) | 0 (0.0%) |
| Total (Category) | 0 (0.0%) | 0 (0.0%) |
| Total (Overall) | 77 (62.1%) | 47 (37.9%) |
Sales and Office Occupations
The most common Sales and Office occupations in La Yuca are , and Office & Administration (31 | 25.0%).
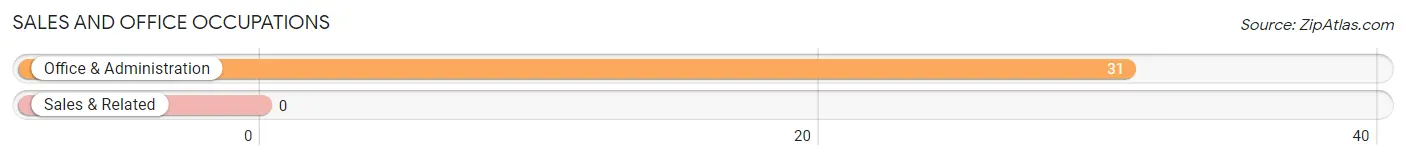
Sales and Office Occupations by Sex

| Occupation | Male | Female |
| Sales & Related | 0 (0.0%) | 0 (0.0%) |
| Office & Administration | 31 (100.0%) | 0 (0.0%) |
| Total (Category) | 31 (100.0%) | 0 (0.0%) |
| Total (Overall) | 77 (62.1%) | 47 (37.9%) |
Natural Resources, Construction and Maintenance Occupations
The most common Natural Resources, Construction and Maintenance occupations in La Yuca are , and Construction & Extraction (43 | 34.7%).
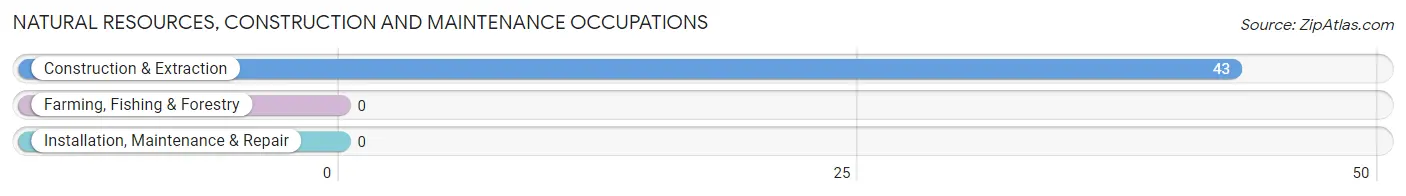
Natural Resources, Construction and Maintenance Occupations by Sex
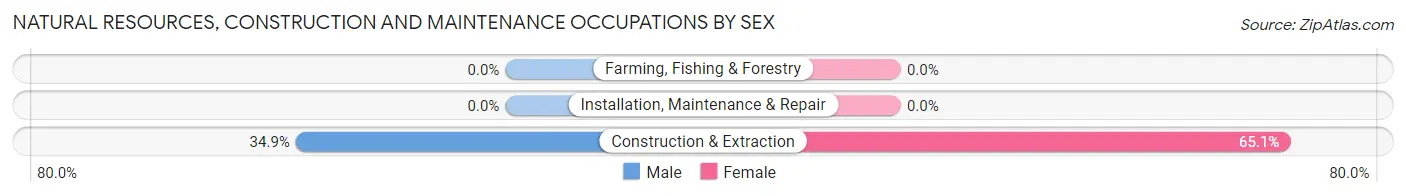
| Occupation | Male | Female |
| Farming, Fishing & Forestry | 0 (0.0%) | 0 (0.0%) |
| Construction & Extraction | 15 (34.9%) | 28 (65.1%) |
| Installation, Maintenance & Repair | 0 (0.0%) | 0 (0.0%) |
| Total (Category) | 15 (34.9%) | 28 (65.1%) |
| Total (Overall) | 77 (62.1%) | 47 (37.9%) |
Production, Transportation and Moving Occupations
The most common Production, Transportation and Moving occupations in La Yuca are , and Production (31 | 25.0%).
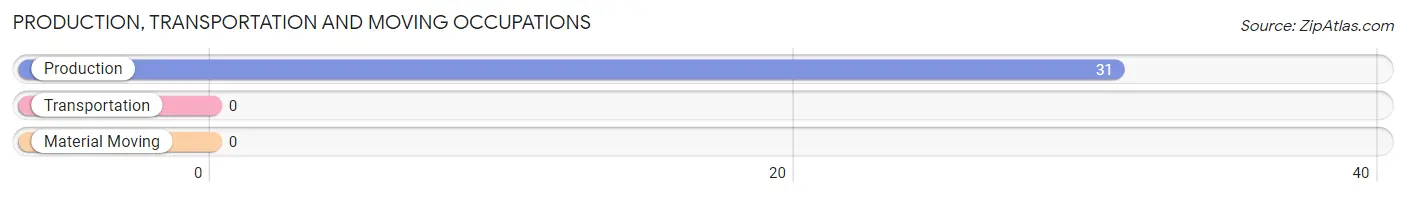
Production, Transportation and Moving Occupations by Sex
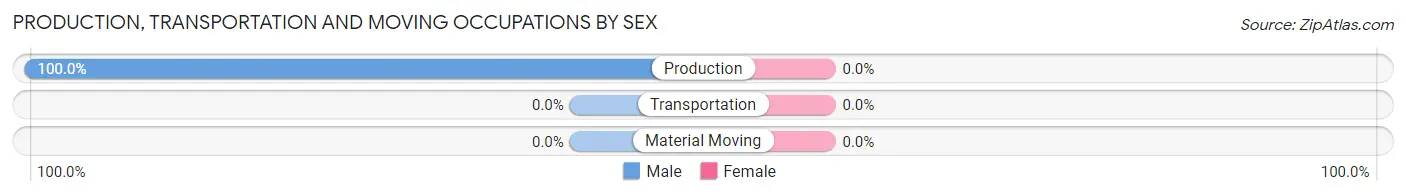
| Occupation | Male | Female |
| Production | 31 (100.0%) | 0 (0.0%) |
| Transportation | 0 (0.0%) | 0 (0.0%) |
| Material Moving | 0 (0.0%) | 0 (0.0%) |
| Total (Category) | 31 (100.0%) | 0 (0.0%) |
| Total (Overall) | 77 (62.1%) | 47 (37.9%) |
Employment Industries by Sex in La Yuca
Employment Industries in La Yuca
The major employment industries in La Yuca include Construction (43 | 34.7%), Manufacturing (31 | 25.0%), Transportation & Warehousing (31 | 25.0%), and Public Administration (19 | 15.3%).
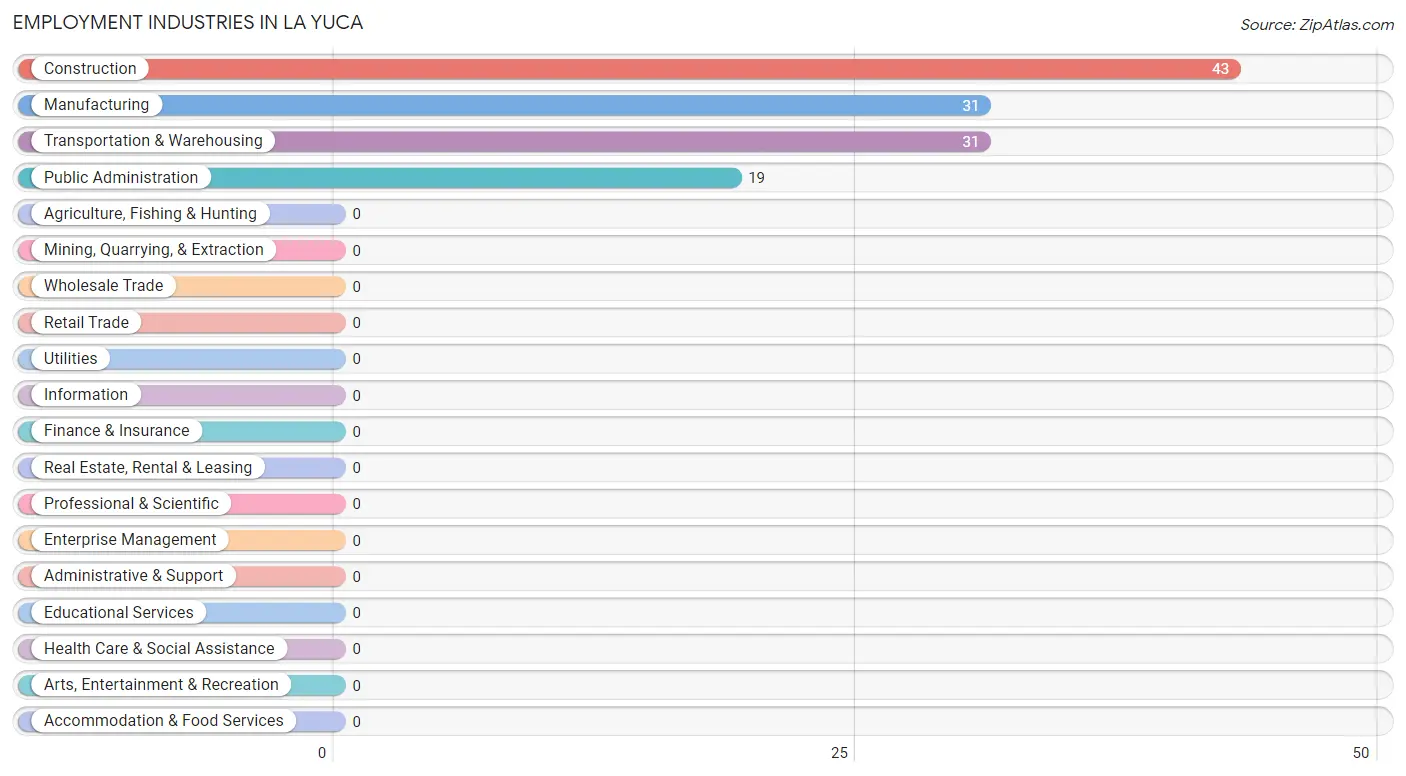
Employment Industries by Sex in La Yuca
The La Yuca industries that see more men than women are Manufacturing (100.0%), Transportation & Warehousing (100.0%), and Construction (34.9%), whereas the industries that tend to have a higher number of women are Public Administration (100.0%), and Construction (65.1%).
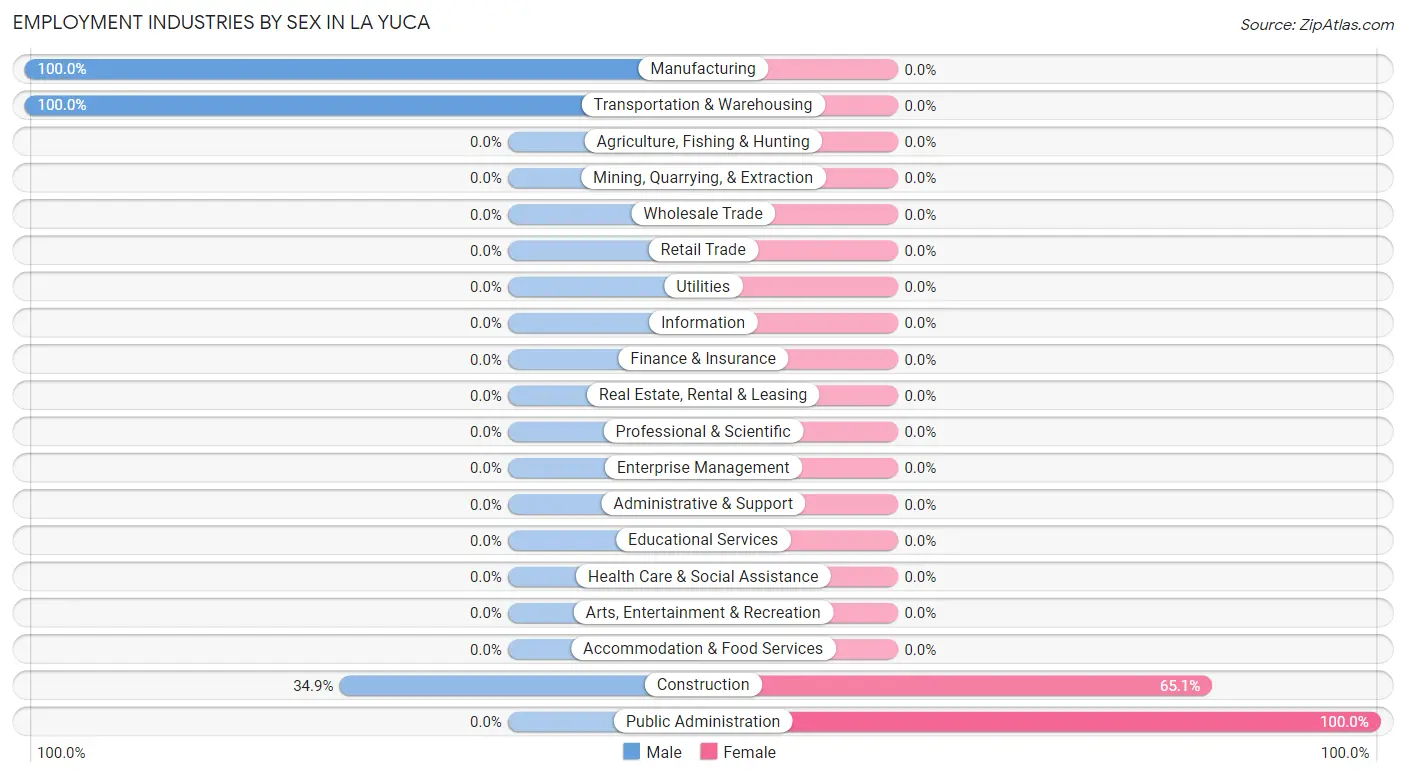
| Industry | Male | Female |
| Agriculture, Fishing & Hunting | 0 (0.0%) | 0 (0.0%) |
| Mining, Quarrying, & Extraction | 0 (0.0%) | 0 (0.0%) |
| Construction | 15 (34.9%) | 28 (65.1%) |
| Manufacturing | 31 (100.0%) | 0 (0.0%) |
| Wholesale Trade | 0 (0.0%) | 0 (0.0%) |
| Retail Trade | 0 (0.0%) | 0 (0.0%) |
| Transportation & Warehousing | 31 (100.0%) | 0 (0.0%) |
| Utilities | 0 (0.0%) | 0 (0.0%) |
| Information | 0 (0.0%) | 0 (0.0%) |
| Finance & Insurance | 0 (0.0%) | 0 (0.0%) |
| Real Estate, Rental & Leasing | 0 (0.0%) | 0 (0.0%) |
| Professional & Scientific | 0 (0.0%) | 0 (0.0%) |
| Enterprise Management | 0 (0.0%) | 0 (0.0%) |
| Administrative & Support | 0 (0.0%) | 0 (0.0%) |
| Educational Services | 0 (0.0%) | 0 (0.0%) |
| Health Care & Social Assistance | 0 (0.0%) | 0 (0.0%) |
| Arts, Entertainment & Recreation | 0 (0.0%) | 0 (0.0%) |
| Accommodation & Food Services | 0 (0.0%) | 0 (0.0%) |
| Public Administration | 0 (0.0%) | 19 (100.0%) |
| Total | 77 (62.1%) | 47 (37.9%) |
Education in La Yuca
School Enrollment in La Yuca
| School Level | # Students | % Students |
| Nursery / Preschool | 0 | 0.0% |
| Kindergarten | 0 | 0.0% |
| Elementary School | 0 | 0.0% |
| Middle School | 0 | 0.0% |
| High School | 0 | 0.0% |
| College / Undergraduate | 0 | 0.0% |
| Graduate / Professional | 0 | 0.0% |
| Total | 0 | 0.0% |
School Enrollment by Age by Funding Source in La Yuca
| Age Bracket | Public School | Private School |
| 3 to 4 Year Olds | 0 (0.0%) | 0 (0.0%) |
| 5 to 9 Year Old | 0 (0.0%) | 0 (0.0%) |
| 10 to 14 Year Olds | 0 (0.0%) | 0 (0.0%) |
| 15 to 17 Year Olds | 0 (0.0%) | 0 (0.0%) |
| 18 to 19 Year Olds | 0 (0.0%) | 0 (0.0%) |
| 20 to 24 Year Olds | 0 (0.0%) | 0 (0.0%) |
| 25 to 34 Year Olds | 0 (0.0%) | 0 (0.0%) |
| 35 Years and over | 0 (0.0%) | 0 (0.0%) |
| Total | 0 (0.0%) | 0 (0.0%) |
Educational Attainment by Field of Study in La Yuca
Business (84 | 66.7%), arts & humanities (22 | 17.5%), and education (20 | 15.9%) are the most common fields of study among 126 individuals in La Yuca who have obtained a bachelor's degree or higher.
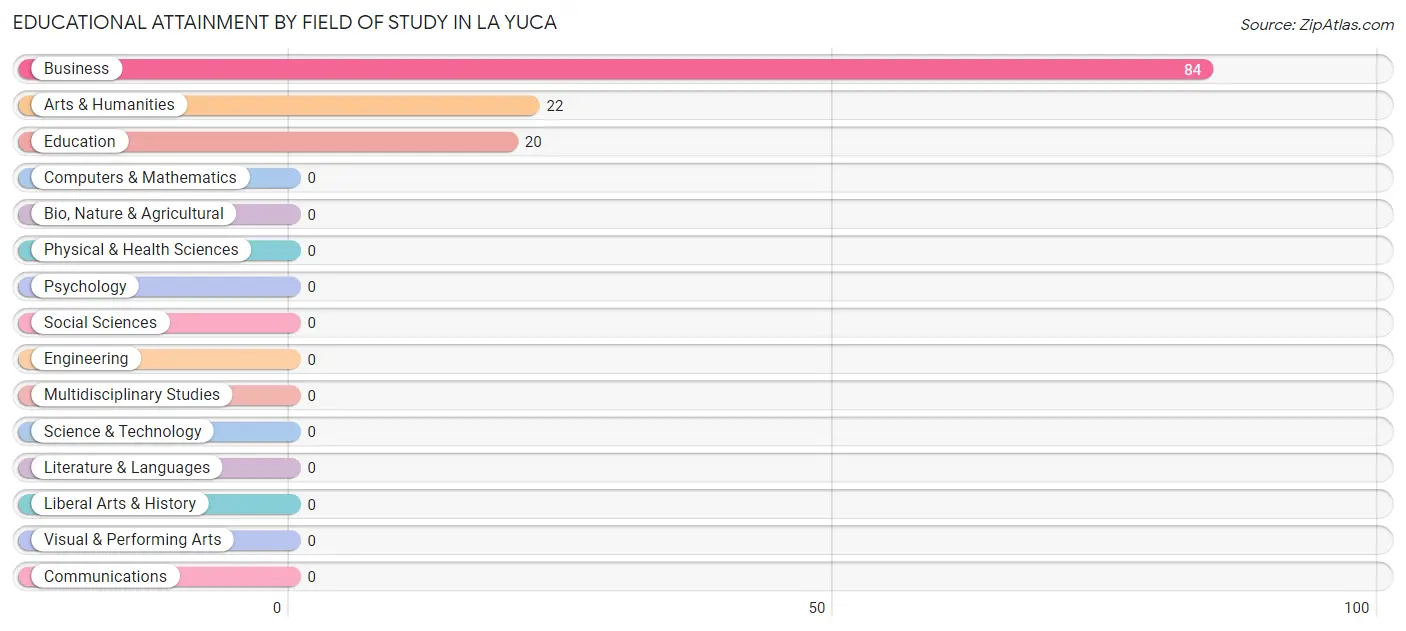
| Field of Study | # Graduates | % Graduates |
| Computers & Mathematics | 0 | 0.0% |
| Bio, Nature & Agricultural | 0 | 0.0% |
| Physical & Health Sciences | 0 | 0.0% |
| Psychology | 0 | 0.0% |
| Social Sciences | 0 | 0.0% |
| Engineering | 0 | 0.0% |
| Multidisciplinary Studies | 0 | 0.0% |
| Science & Technology | 0 | 0.0% |
| Business | 84 | 66.7% |
| Education | 20 | 15.9% |
| Literature & Languages | 0 | 0.0% |
| Liberal Arts & History | 0 | 0.0% |
| Visual & Performing Arts | 0 | 0.0% |
| Communications | 0 | 0.0% |
| Arts & Humanities | 22 | 17.5% |
| Total | 126 | 100.0% |
Transportation & Commute in La Yuca
Vehicle Availability by Sex in La Yuca
The most prevalent vehicle ownership categories in La Yuca are males with 1 vehicle (46, accounting for 59.7%) and females with 1 vehicle (19, making up 97.9%).
| Vehicles Available | Male | Female |
| No Vehicle | 0 (0.0%) | 0 (0.0%) |
| 1 Vehicle | 46 (59.7%) | 19 (40.4%) |
| 2 Vehicles | 31 (40.3%) | 28 (59.6%) |
| 3 Vehicles | 0 (0.0%) | 0 (0.0%) |
| 4 Vehicles | 0 (0.0%) | 0 (0.0%) |
| 5 or more Vehicles | 0 (0.0%) | 0 (0.0%) |
| Total | 77 (100.0%) | 47 (100.0%) |
Commute Time in La Yuca
The most frequently occuring commute durations in La Yuca are 30 to 34 minutes (62 commuters, 50.0%), 15 to 19 minutes (28 commuters, 22.6%), and 25 to 29 minutes (19 commuters, 15.3%).
| Commute Time | # Commuters | % Commuters |
| Less than 5 Minutes | 0 | 0.0% |
| 5 to 9 Minutes | 0 | 0.0% |
| 10 to 14 Minutes | 0 | 0.0% |
| 15 to 19 Minutes | 28 | 22.6% |
| 20 to 24 Minutes | 15 | 12.1% |
| 25 to 29 Minutes | 19 | 15.3% |
| 30 to 34 Minutes | 62 | 50.0% |
| 35 to 39 Minutes | 0 | 0.0% |
| 40 to 44 Minutes | 0 | 0.0% |
| 45 to 59 Minutes | 0 | 0.0% |
| 60 to 89 Minutes | 0 | 0.0% |
| 90 or more Minutes | 0 | 0.0% |
Commute Time by Sex in La Yuca
The most common commute times in La Yuca are 30 to 34 minutes (62 commuters, 80.5%) for males and 15 to 19 minutes (28 commuters, 59.6%) for females.
| Commute Time | Male | Female |
| Less than 5 Minutes | 0 (0.0%) | 0 (0.0%) |
| 5 to 9 Minutes | 0 (0.0%) | 0 (0.0%) |
| 10 to 14 Minutes | 0 (0.0%) | 0 (0.0%) |
| 15 to 19 Minutes | 0 (0.0%) | 28 (59.6%) |
| 20 to 24 Minutes | 15 (19.5%) | 0 (0.0%) |
| 25 to 29 Minutes | 0 (0.0%) | 19 (40.4%) |
| 30 to 34 Minutes | 62 (80.5%) | 0 (0.0%) |
| 35 to 39 Minutes | 0 (0.0%) | 0 (0.0%) |
| 40 to 44 Minutes | 0 (0.0%) | 0 (0.0%) |
| 45 to 59 Minutes | 0 (0.0%) | 0 (0.0%) |
| 60 to 89 Minutes | 0 (0.0%) | 0 (0.0%) |
| 90 or more Minutes | 0 (0.0%) | 0 (0.0%) |
Time of Departure to Work by Sex in La Yuca
The most frequent times of departure to work in La Yuca are 5:00 AM to 5:29 AM (31, 40.3%) for males and 5:30 AM to 5:59 AM (28, 59.6%) for females.
| Time of Departure | Male | Female |
| 12:00 AM to 4:59 AM | 0 (0.0%) | 0 (0.0%) |
| 5:00 AM to 5:29 AM | 31 (40.3%) | 0 (0.0%) |
| 5:30 AM to 5:59 AM | 0 (0.0%) | 28 (59.6%) |
| 6:00 AM to 6:29 AM | 0 (0.0%) | 0 (0.0%) |
| 6:30 AM to 6:59 AM | 0 (0.0%) | 19 (40.4%) |
| 7:00 AM to 7:29 AM | 15 (19.5%) | 0 (0.0%) |
| 7:30 AM to 7:59 AM | 0 (0.0%) | 0 (0.0%) |
| 8:00 AM to 8:29 AM | 31 (40.3%) | 0 (0.0%) |
| 8:30 AM to 8:59 AM | 0 (0.0%) | 0 (0.0%) |
| 9:00 AM to 9:59 AM | 0 (0.0%) | 0 (0.0%) |
| 10:00 AM to 10:59 AM | 0 (0.0%) | 0 (0.0%) |
| 11:00 AM to 11:59 AM | 0 (0.0%) | 0 (0.0%) |
| 12:00 PM to 3:59 PM | 0 (0.0%) | 0 (0.0%) |
| 4:00 PM to 11:59 PM | 0 (0.0%) | 0 (0.0%) |
| Total | 77 (100.0%) | 47 (100.0%) |
Housing Occupancy in La Yuca
Occupancy by Ownership in La Yuca
Of the total 171 dwellings in La Yuca, owner-occupied units account for 157 (91.8%), while renter-occupied units make up 14 (8.2%).
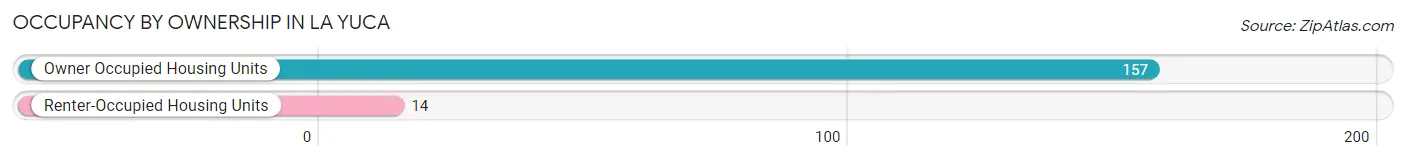
| Occupancy | # Housing Units | % Housing Units |
| Owner Occupied Housing Units | 157 | 91.8% |
| Renter-Occupied Housing Units | 14 | 8.2% |
| Total Occupied Housing Units | 171 | 100.0% |
Occupancy by Household Size in La Yuca
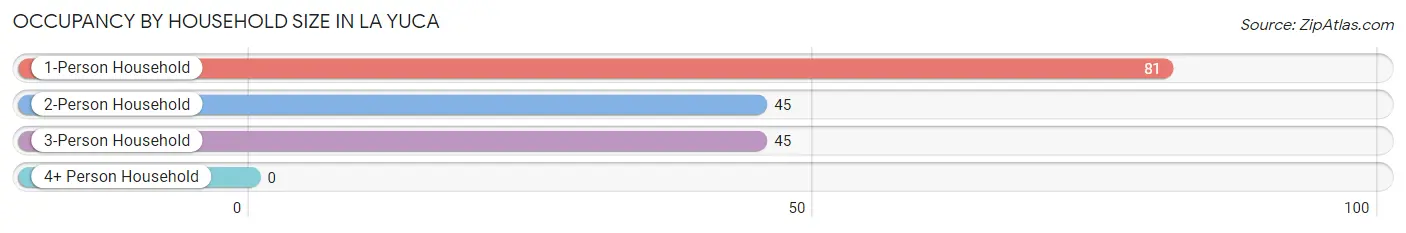
| Household Size | # Housing Units | % Housing Units |
| 1-Person Household | 81 | 47.4% |
| 2-Person Household | 45 | 26.3% |
| 3-Person Household | 45 | 26.3% |
| 4+ Person Household | 0 | 0.0% |
| Total Housing Units | 171 | 100.0% |
Occupancy by Ownership by Household Size in La Yuca
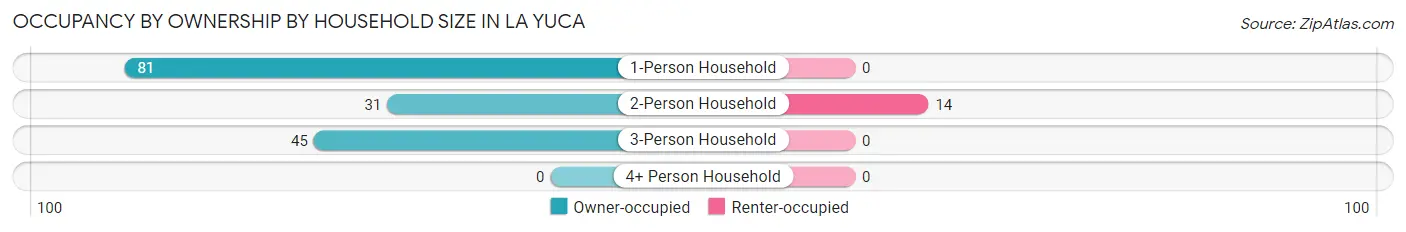
| Household Size | Owner-occupied | Renter-occupied |
| 1-Person Household | 81 (100.0%) | 0 (0.0%) |
| 2-Person Household | 31 (68.9%) | 14 (31.1%) |
| 3-Person Household | 45 (100.0%) | 0 (0.0%) |
| 4+ Person Household | 0 (0.0%) | 0 (0.0%) |
| Total Housing Units | 157 (91.8%) | 14 (8.2%) |
Occupancy by Educational Attainment in La Yuca
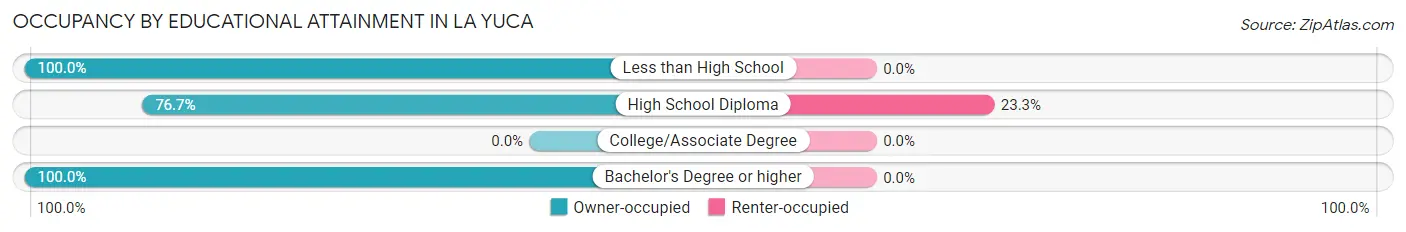
| Household Size | Owner-occupied | Renter-occupied |
| Less than High School | 38 (100.0%) | 0 (0.0%) |
| High School Diploma | 46 (76.7%) | 14 (23.3%) |
| College/Associate Degree | 0 (0.0%) | 0 (0.0%) |
| Bachelor's Degree or higher | 73 (100.0%) | 0 (0.0%) |
Occupancy by Age of Householder in La Yuca
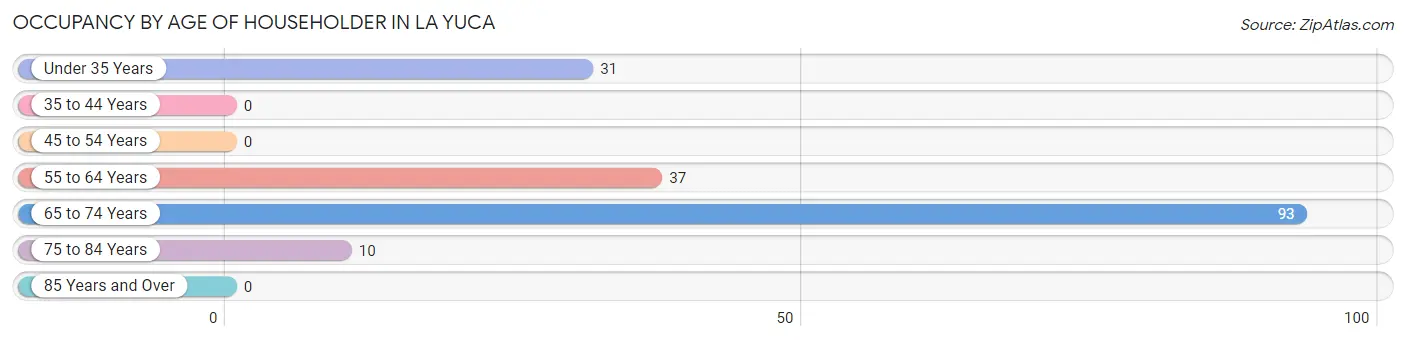
| Age Bracket | # Households | % Households |
| Under 35 Years | 31 | 18.1% |
| 35 to 44 Years | 0 | 0.0% |
| 45 to 54 Years | 0 | 0.0% |
| 55 to 64 Years | 37 | 21.6% |
| 65 to 74 Years | 93 | 54.4% |
| 75 to 84 Years | 10 | 5.9% |
| 85 Years and Over | 0 | 0.0% |
| Total | 171 | 100.0% |
Housing Finances in La Yuca
Median Income by Occupancy in La Yuca
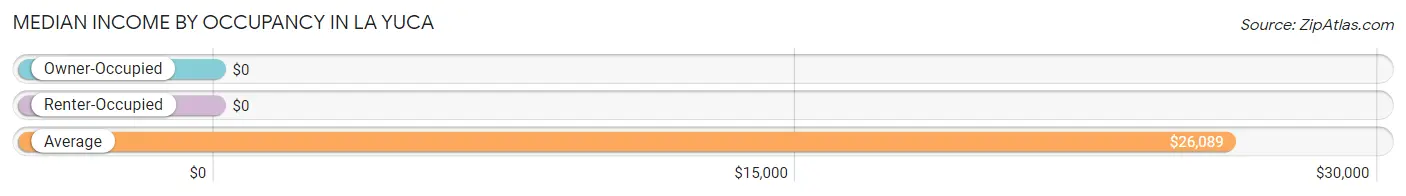
| Occupancy Type | # Households | Median Income |
| Owner-Occupied | 157 (91.8%) | $0 |
| Renter-Occupied | 14 (8.2%) | $0 |
| Average | 171 (100.0%) | $26,089 |
Occupancy by Householder Income Bracket in La Yuca
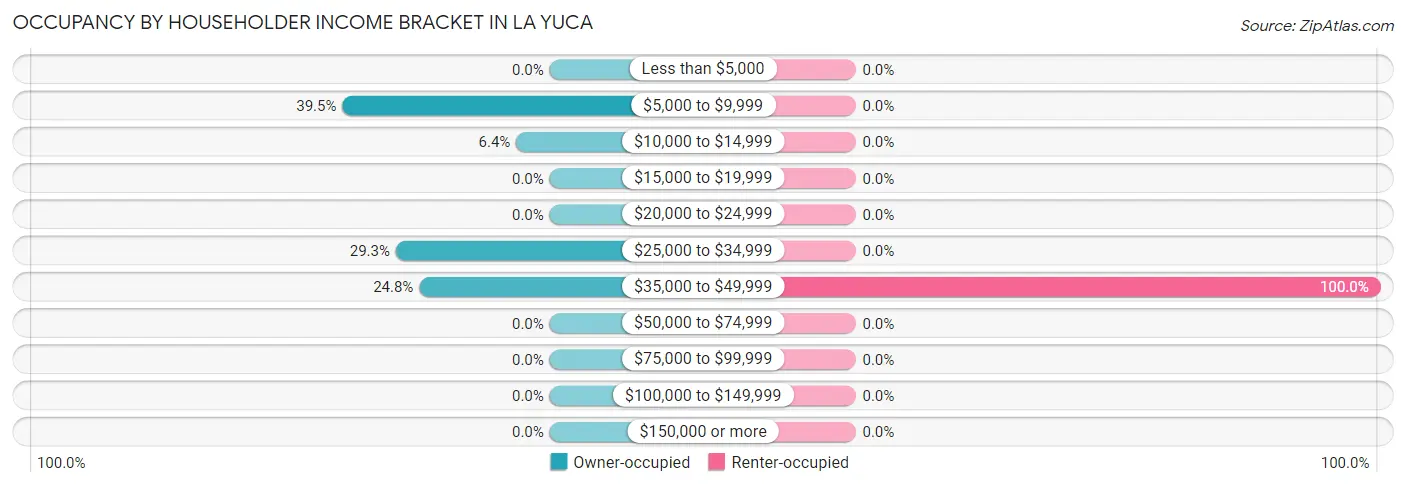
| Income Bracket | Owner-occupied | Renter-occupied |
| Less than $5,000 | 0 (0.0%) | 0 (0.0%) |
| $5,000 to $9,999 | 62 (39.5%) | 0 (0.0%) |
| $10,000 to $14,999 | 10 (6.4%) | 0 (0.0%) |
| $15,000 to $19,999 | 0 (0.0%) | 0 (0.0%) |
| $20,000 to $24,999 | 0 (0.0%) | 0 (0.0%) |
| $25,000 to $34,999 | 46 (29.3%) | 0 (0.0%) |
| $35,000 to $49,999 | 39 (24.8%) | 14 (100.0%) |
| $50,000 to $74,999 | 0 (0.0%) | 0 (0.0%) |
| $75,000 to $99,999 | 0 (0.0%) | 0 (0.0%) |
| $100,000 to $149,999 | 0 (0.0%) | 0 (0.0%) |
| $150,000 or more | 0 (0.0%) | 0 (0.0%) |
| Total | 157 (100.0%) | 14 (100.0%) |
Monthly Housing Cost Tiers in La Yuca
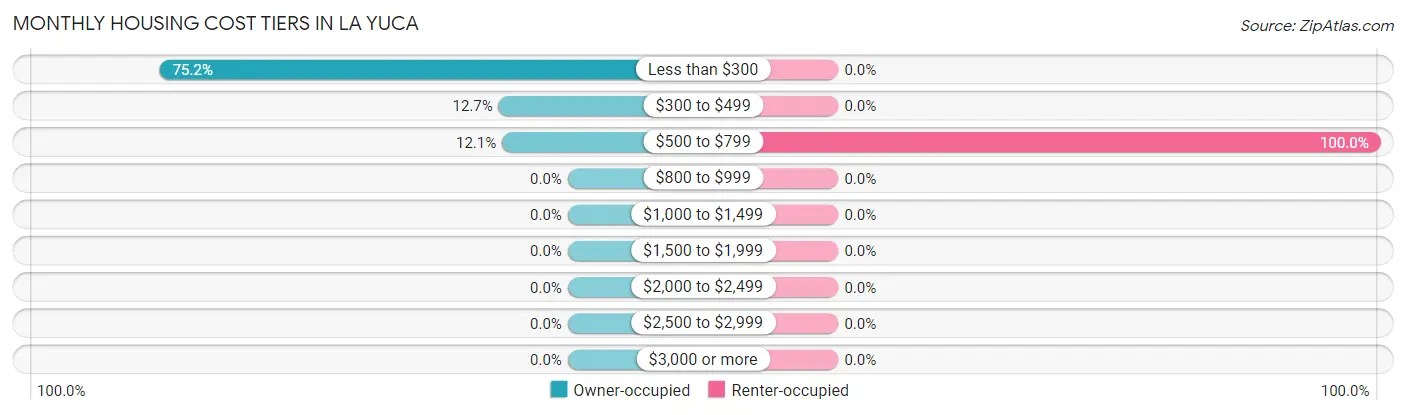
| Monthly Cost | Owner-occupied | Renter-occupied |
| Less than $300 | 118 (75.2%) | 0 (0.0%) |
| $300 to $499 | 20 (12.7%) | 0 (0.0%) |
| $500 to $799 | 19 (12.1%) | 14 (100.0%) |
| $800 to $999 | 0 (0.0%) | 0 (0.0%) |
| $1,000 to $1,499 | 0 (0.0%) | 0 (0.0%) |
| $1,500 to $1,999 | 0 (0.0%) | 0 (0.0%) |
| $2,000 to $2,499 | 0 (0.0%) | 0 (0.0%) |
| $2,500 to $2,999 | 0 (0.0%) | 0 (0.0%) |
| $3,000 or more | 0 (0.0%) | 0 (0.0%) |
| Total | 157 (100.0%) | 14 (100.0%) |
Physical Housing Characteristics in La Yuca
Housing Structures in La Yuca
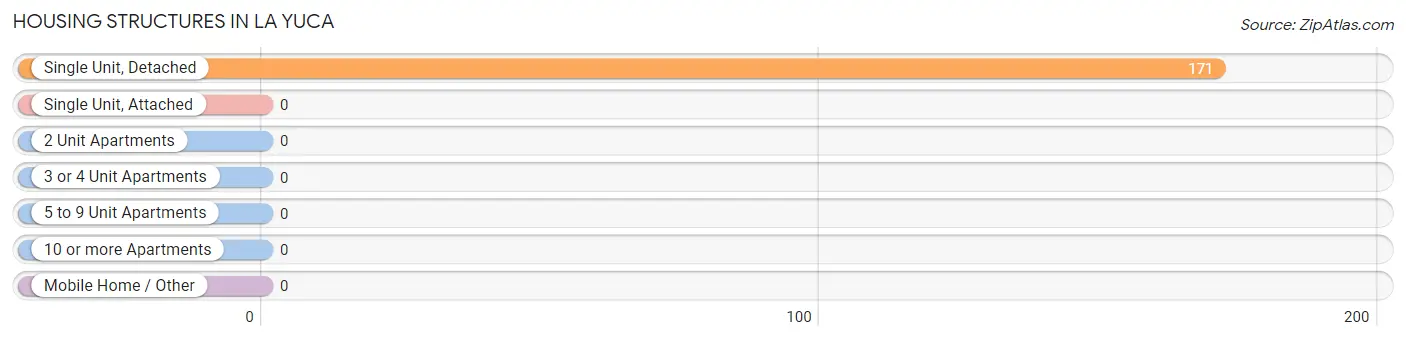
| Structure Type | # Housing Units | % Housing Units |
| Single Unit, Detached | 171 | 100.0% |
| Single Unit, Attached | 0 | 0.0% |
| 2 Unit Apartments | 0 | 0.0% |
| 3 or 4 Unit Apartments | 0 | 0.0% |
| 5 to 9 Unit Apartments | 0 | 0.0% |
| 10 or more Apartments | 0 | 0.0% |
| Mobile Home / Other | 0 | 0.0% |
| Total | 171 | 100.0% |
Housing Structures by Occupancy in La Yuca
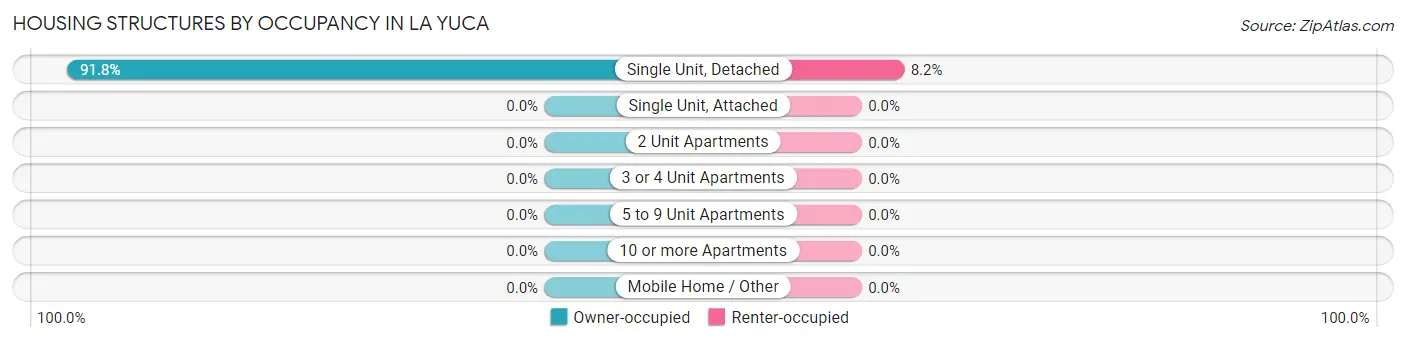
| Structure Type | Owner-occupied | Renter-occupied |
| Single Unit, Detached | 157 (91.8%) | 14 (8.2%) |
| Single Unit, Attached | 0 (0.0%) | 0 (0.0%) |
| 2 Unit Apartments | 0 (0.0%) | 0 (0.0%) |
| 3 or 4 Unit Apartments | 0 (0.0%) | 0 (0.0%) |
| 5 to 9 Unit Apartments | 0 (0.0%) | 0 (0.0%) |
| 10 or more Apartments | 0 (0.0%) | 0 (0.0%) |
| Mobile Home / Other | 0 (0.0%) | 0 (0.0%) |
| Total | 157 (91.8%) | 14 (8.2%) |
Housing Structures by Number of Rooms in La Yuca
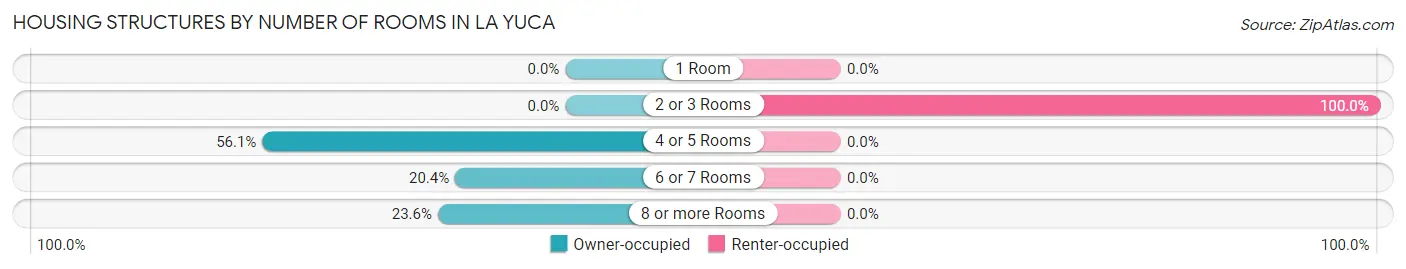
| Number of Rooms | Owner-occupied | Renter-occupied |
| 1 Room | 0 (0.0%) | 0 (0.0%) |
| 2 or 3 Rooms | 0 (0.0%) | 14 (100.0%) |
| 4 or 5 Rooms | 88 (56.0%) | 0 (0.0%) |
| 6 or 7 Rooms | 32 (20.4%) | 0 (0.0%) |
| 8 or more Rooms | 37 (23.6%) | 0 (0.0%) |
| Total | 157 (100.0%) | 14 (100.0%) |
Housing Structure by Heating Type in La Yuca
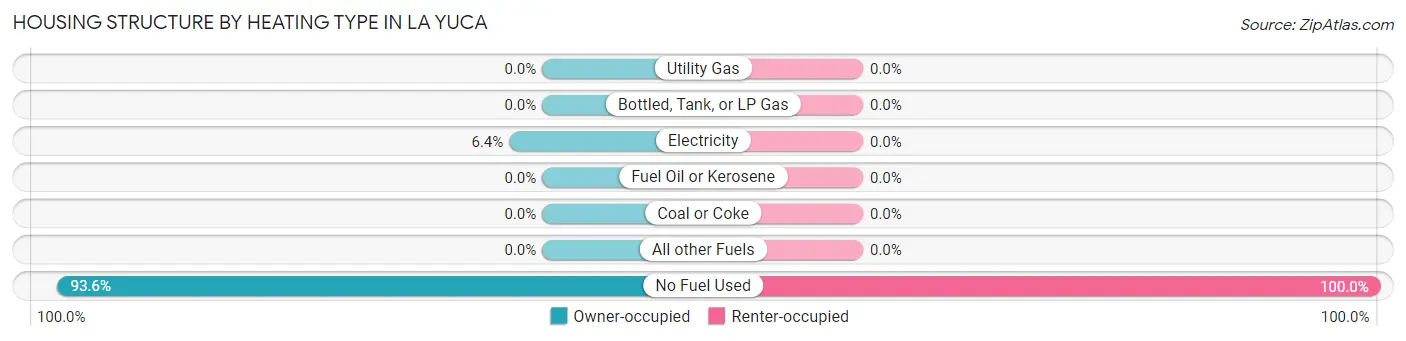
| Heating Type | Owner-occupied | Renter-occupied |
| Utility Gas | 0 (0.0%) | 0 (0.0%) |
| Bottled, Tank, or LP Gas | 0 (0.0%) | 0 (0.0%) |
| Electricity | 10 (6.4%) | 0 (0.0%) |
| Fuel Oil or Kerosene | 0 (0.0%) | 0 (0.0%) |
| Coal or Coke | 0 (0.0%) | 0 (0.0%) |
| All other Fuels | 0 (0.0%) | 0 (0.0%) |
| No Fuel Used | 147 (93.6%) | 14 (100.0%) |
| Total | 157 (100.0%) | 14 (100.0%) |
Household Vehicle Usage in La Yuca
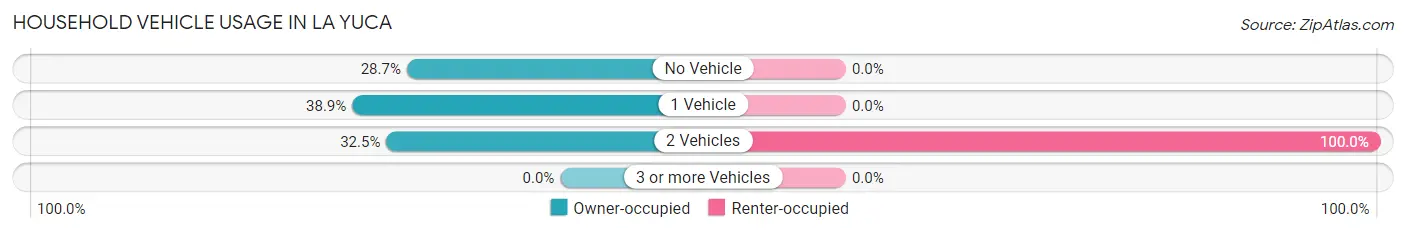
| Vehicles per Household | Owner-occupied | Renter-occupied |
| No Vehicle | 45 (28.7%) | 0 (0.0%) |
| 1 Vehicle | 61 (38.9%) | 0 (0.0%) |
| 2 Vehicles | 51 (32.5%) | 14 (100.0%) |
| 3 or more Vehicles | 0 (0.0%) | 0 (0.0%) |
| Total | 157 (100.0%) | 14 (100.0%) |
Real Estate & Mortgages in La Yuca
Real Estate and Mortgage Overview in La Yuca
| Characteristic | Without Mortgage | With Mortgage |
| Housing Units | 138 | 19 |
| Median Property Value | $80,300 | $0 |
| Median Household Income | - | - |
| Monthly Housing Costs | $175 | $0 |
| Real Estate Taxes | - | - |
Property Value by Mortgage Status in La Yuca
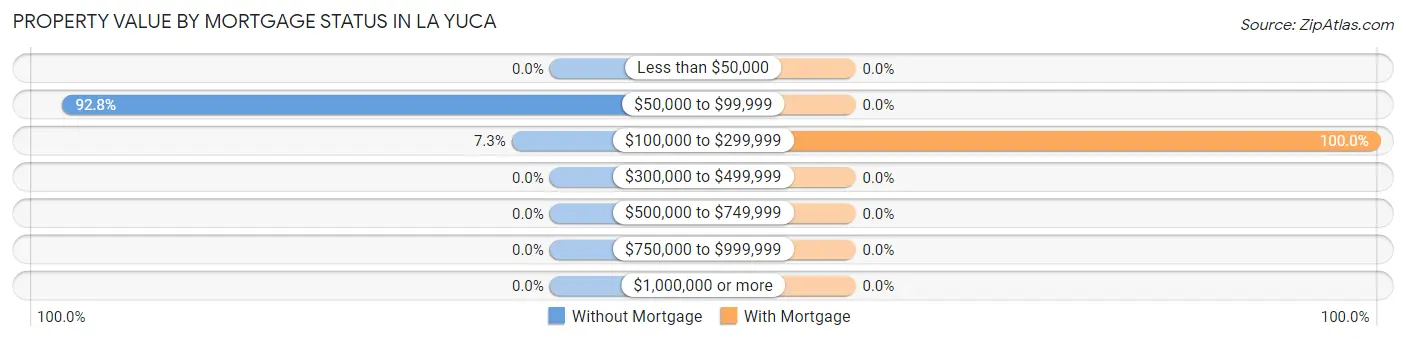
| Property Value | Without Mortgage | With Mortgage |
| Less than $50,000 | 0 (0.0%) | 0 (0.0%) |
| $50,000 to $99,999 | 128 (92.7%) | 0 (0.0%) |
| $100,000 to $299,999 | 10 (7.2%) | 19 (100.0%) |
| $300,000 to $499,999 | 0 (0.0%) | 0 (0.0%) |
| $500,000 to $749,999 | 0 (0.0%) | 0 (0.0%) |
| $750,000 to $999,999 | 0 (0.0%) | 0 (0.0%) |
| $1,000,000 or more | 0 (0.0%) | 0 (0.0%) |
| Total | 138 (100.0%) | 19 (100.0%) |
Household Income by Mortgage Status in La Yuca
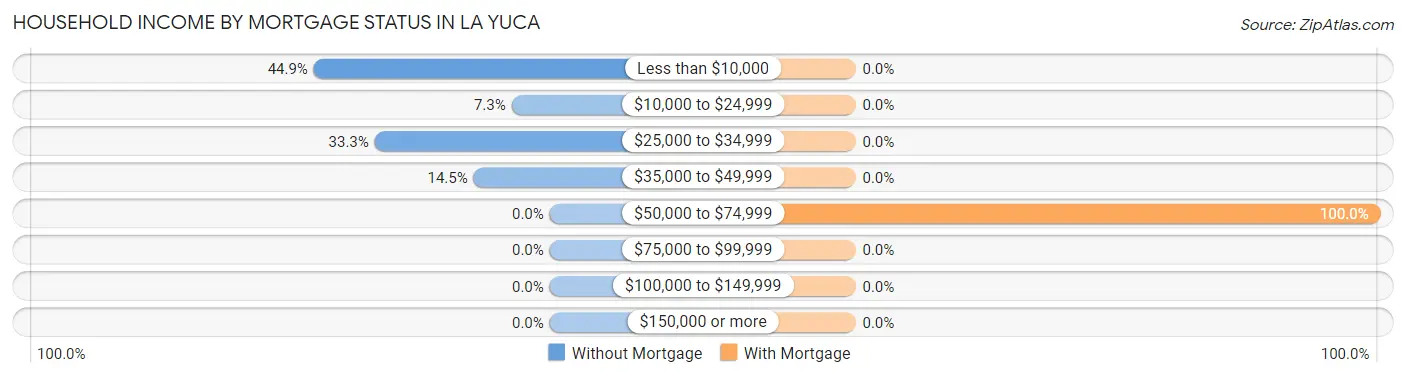
| Household Income | Without Mortgage | With Mortgage |
| Less than $10,000 | 62 (44.9%) | 0 (0.0%) |
| $10,000 to $24,999 | 10 (7.2%) | 0 (0.0%) |
| $25,000 to $34,999 | 46 (33.3%) | 0 (0.0%) |
| $35,000 to $49,999 | 20 (14.5%) | 0 (0.0%) |
| $50,000 to $74,999 | 0 (0.0%) | 19 (100.0%) |
| $75,000 to $99,999 | 0 (0.0%) | 0 (0.0%) |
| $100,000 to $149,999 | 0 (0.0%) | 0 (0.0%) |
| $150,000 or more | 0 (0.0%) | 0 (0.0%) |
| Total | 138 (100.0%) | 19 (100.0%) |
Property Value to Household Income Ratio in La Yuca
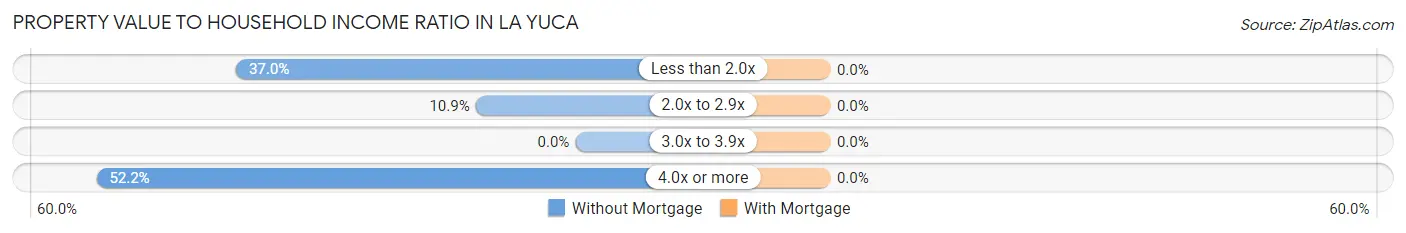
| Value-to-Income Ratio | Without Mortgage | With Mortgage |
| Less than 2.0x | 51 (37.0%) | 0 (0.0%) |
| 2.0x to 2.9x | 15 (10.9%) | 0 (0.0%) |
| 3.0x to 3.9x | 0 (0.0%) | 0 (0.0%) |
| 4.0x or more | 72 (52.2%) | 0 (0.0%) |
| Total | 138 (100.0%) | 19 (100.0%) |
Real Estate Taxes by Mortgage Status in La Yuca
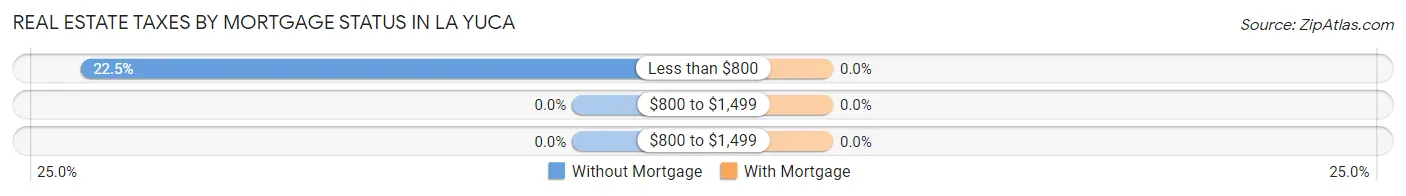
| Property Taxes | Without Mortgage | With Mortgage |
| Less than $800 | 31 (22.5%) | 0 (0.0%) |
| $800 to $1,499 | 0 (0.0%) | 0 (0.0%) |
| $800 to $1,499 | 0 (0.0%) | 0 (0.0%) |
| Total | 138 (100.0%) | 19 (100.0%) |
Health & Disability in La Yuca
Health Insurance Coverage by Age in La Yuca
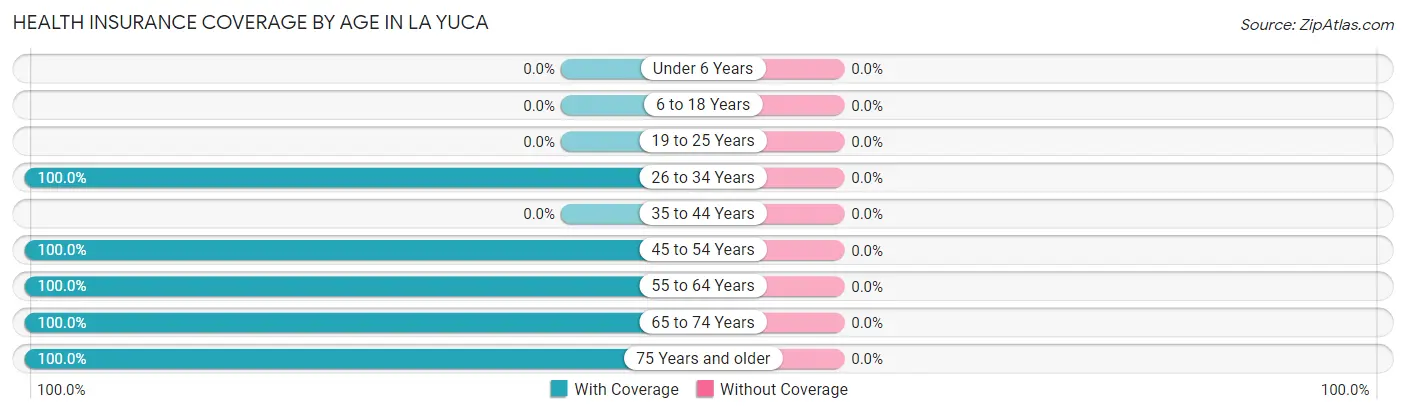
| Age Bracket | With Coverage | Without Coverage |
| Under 6 Years | 0 (0.0%) | 0 (0.0%) |
| 6 to 18 Years | 0 (0.0%) | 0 (0.0%) |
| 19 to 25 Years | 0 (0.0%) | 0 (0.0%) |
| 26 to 34 Years | 112 (100.0%) | 0 (0.0%) |
| 35 to 44 Years | 0 (0.0%) | 0 (0.0%) |
| 45 to 54 Years | 30 (100.0%) | 0 (0.0%) |
| 55 to 64 Years | 37 (100.0%) | 0 (0.0%) |
| 65 to 74 Years | 140 (100.0%) | 0 (0.0%) |
| 75 Years and older | 10 (100.0%) | 0 (0.0%) |
| Total | 329 (100.0%) | 0 (0.0%) |
Health Insurance Coverage by Citizenship Status in La Yuca
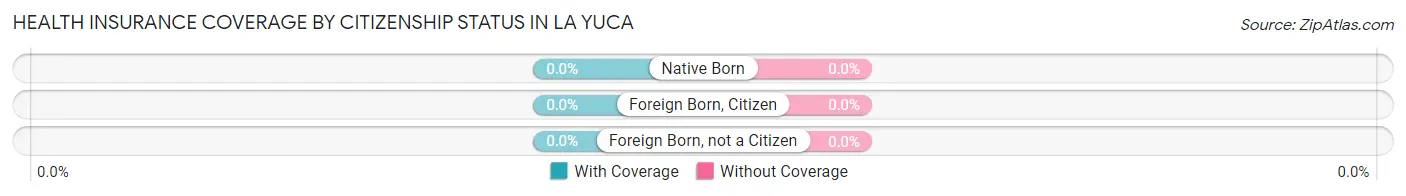
| Citizenship Status | With Coverage | Without Coverage |
| Native Born | 0 (0.0%) | 0 (0.0%) |
| Foreign Born, Citizen | 0 (0.0%) | 0 (0.0%) |
| Foreign Born, not a Citizen | 0 (0.0%) | 0 (0.0%) |
Health Insurance Coverage by Household Income in La Yuca
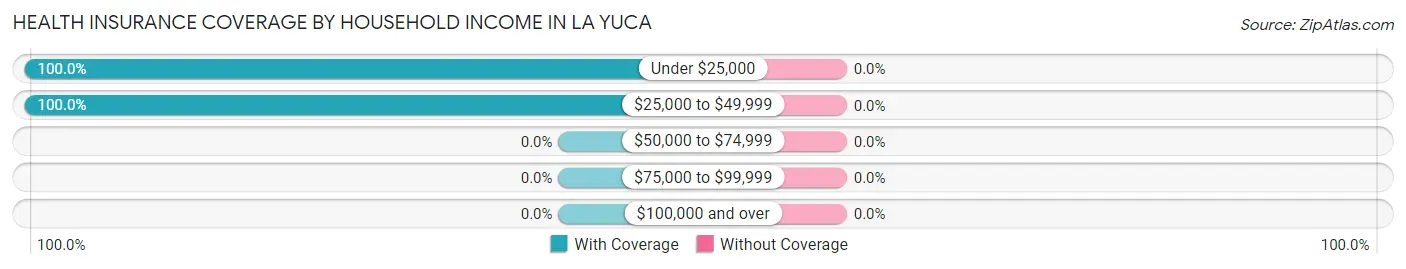
| Household Income | With Coverage | Without Coverage |
| Under $25,000 | 97 (100.0%) | 0 (0.0%) |
| $25,000 to $49,999 | 232 (100.0%) | 0 (0.0%) |
| $50,000 to $74,999 | 0 (0.0%) | 0 (0.0%) |
| $75,000 to $99,999 | 0 (0.0%) | 0 (0.0%) |
| $100,000 and over | 0 (0.0%) | 0 (0.0%) |
Public vs Private Health Insurance Coverage by Age in La Yuca
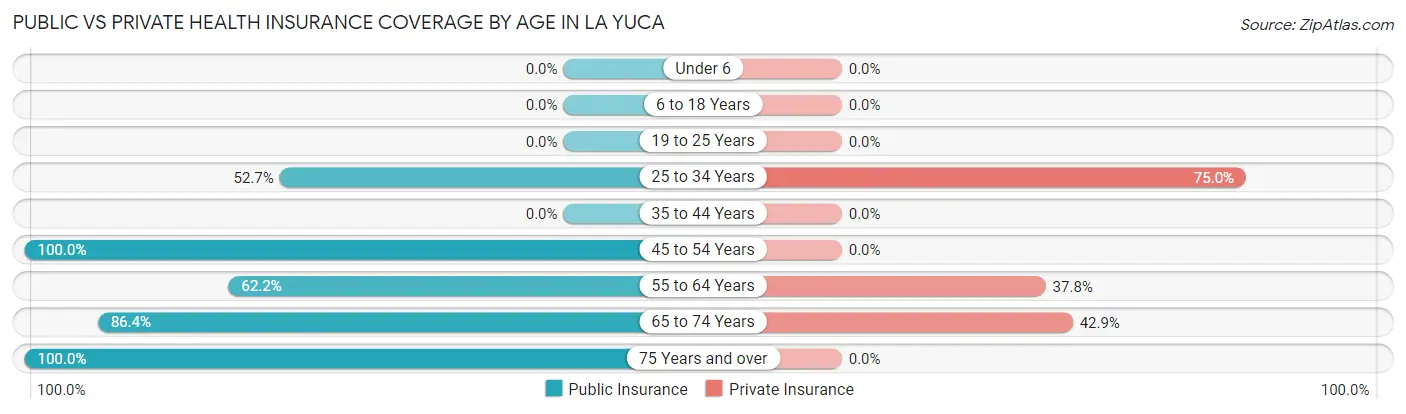
| Age Bracket | Public Insurance | Private Insurance |
| Under 6 | 0 (0.0%) | 0 (0.0%) |
| 6 to 18 Years | 0 (0.0%) | 0 (0.0%) |
| 19 to 25 Years | 0 (0.0%) | 0 (0.0%) |
| 25 to 34 Years | 59 (52.7%) | 84 (75.0%) |
| 35 to 44 Years | 0 (0.0%) | 0 (0.0%) |
| 45 to 54 Years | 30 (100.0%) | 0 (0.0%) |
| 55 to 64 Years | 23 (62.2%) | 14 (37.8%) |
| 65 to 74 Years | 121 (86.4%) | 60 (42.9%) |
| 75 Years and over | 10 (100.0%) | 0 (0.0%) |
| Total | 243 (73.9%) | 158 (48.0%) |
Disability Status by Sex by Age in La Yuca
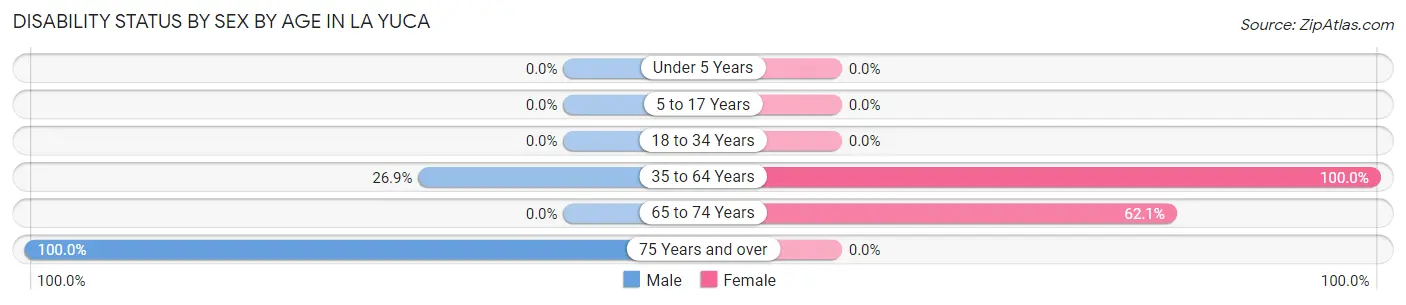
| Age Bracket | Male | Female |
| Under 5 Years | 0 (0.0%) | 0 (0.0%) |
| 5 to 17 Years | 0 (0.0%) | 0 (0.0%) |
| 18 to 34 Years | 0 (0.0%) | 0 (0.0%) |
| 35 to 64 Years | 14 (26.9%) | 15 (100.0%) |
| 65 to 74 Years | 0 (0.0%) | 64 (62.1%) |
| 75 Years and over | 10 (100.0%) | 0 (0.0%) |
Disability Class by Sex by Age in La Yuca
Disability Class: Hearing Difficulty
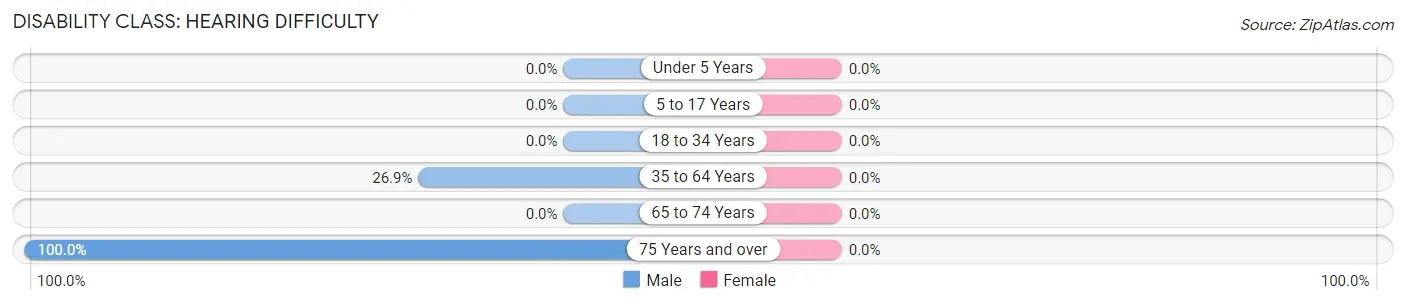
| Age Bracket | Male | Female |
| Under 5 Years | 0 (0.0%) | 0 (0.0%) |
| 5 to 17 Years | 0 (0.0%) | 0 (0.0%) |
| 18 to 34 Years | 0 (0.0%) | 0 (0.0%) |
| 35 to 64 Years | 14 (26.9%) | 0 (0.0%) |
| 65 to 74 Years | 0 (0.0%) | 0 (0.0%) |
| 75 Years and over | 10 (100.0%) | 0 (0.0%) |
Disability Class: Vision Difficulty
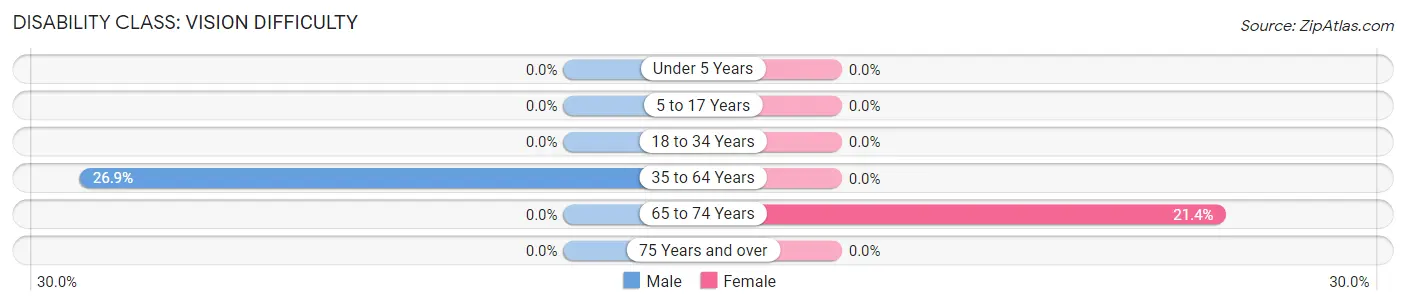
| Age Bracket | Male | Female |
| Under 5 Years | 0 (0.0%) | 0 (0.0%) |
| 5 to 17 Years | 0 (0.0%) | 0 (0.0%) |
| 18 to 34 Years | 0 (0.0%) | 0 (0.0%) |
| 35 to 64 Years | 14 (26.9%) | 0 (0.0%) |
| 65 to 74 Years | 0 (0.0%) | 22 (21.4%) |
| 75 Years and over | 0 (0.0%) | 0 (0.0%) |
Disability Class: Cognitive Difficulty
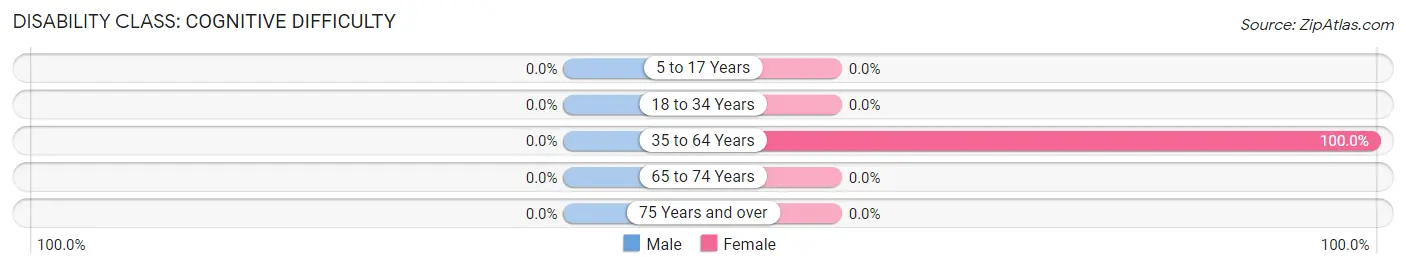
| Age Bracket | Male | Female |
| 5 to 17 Years | 0 (0.0%) | 0 (0.0%) |
| 18 to 34 Years | 0 (0.0%) | 0 (0.0%) |
| 35 to 64 Years | 0 (0.0%) | 15 (100.0%) |
| 65 to 74 Years | 0 (0.0%) | 0 (0.0%) |
| 75 Years and over | 0 (0.0%) | 0 (0.0%) |
Disability Class: Ambulatory Difficulty
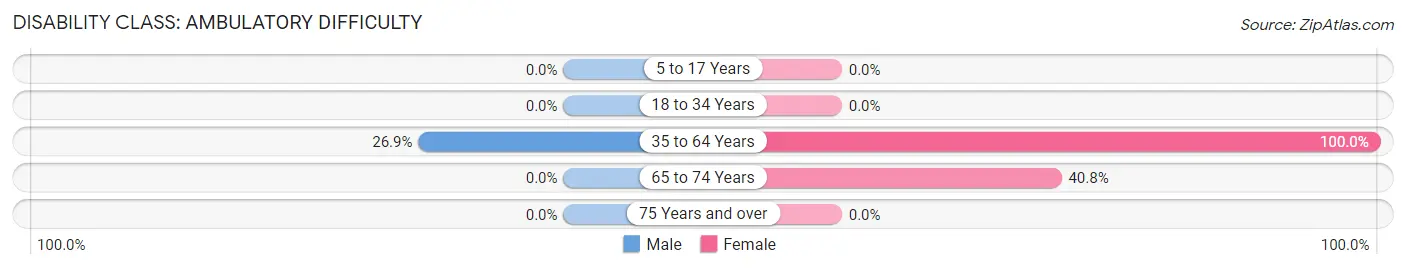
| Age Bracket | Male | Female |
| 5 to 17 Years | 0 (0.0%) | 0 (0.0%) |
| 18 to 34 Years | 0 (0.0%) | 0 (0.0%) |
| 35 to 64 Years | 14 (26.9%) | 15 (100.0%) |
| 65 to 74 Years | 0 (0.0%) | 42 (40.8%) |
| 75 Years and over | 0 (0.0%) | 0 (0.0%) |
Disability Class: Self-Care Difficulty
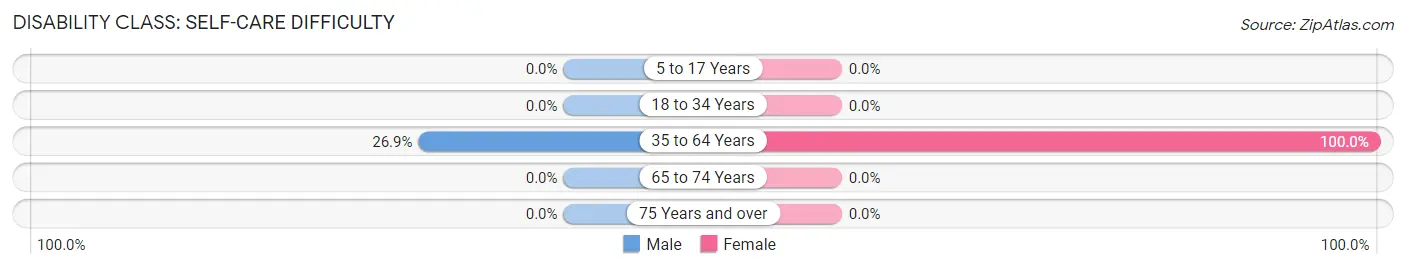
| Age Bracket | Male | Female |
| 5 to 17 Years | 0 (0.0%) | 0 (0.0%) |
| 18 to 34 Years | 0 (0.0%) | 0 (0.0%) |
| 35 to 64 Years | 14 (26.9%) | 15 (100.0%) |
| 65 to 74 Years | 0 (0.0%) | 0 (0.0%) |
| 75 Years and over | 0 (0.0%) | 0 (0.0%) |
Technology Access in La Yuca
Computing Device Access in La Yuca
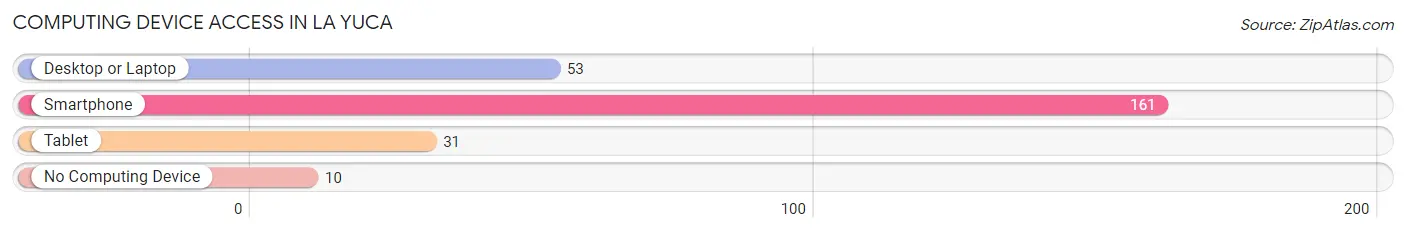
| Device Type | # Households | % Households |
| Desktop or Laptop | 53 | 31.0% |
| Smartphone | 161 | 94.2% |
| Tablet | 31 | 18.1% |
| No Computing Device | 10 | 5.9% |
| Total | 171 | 100.0% |
Internet Access in La Yuca
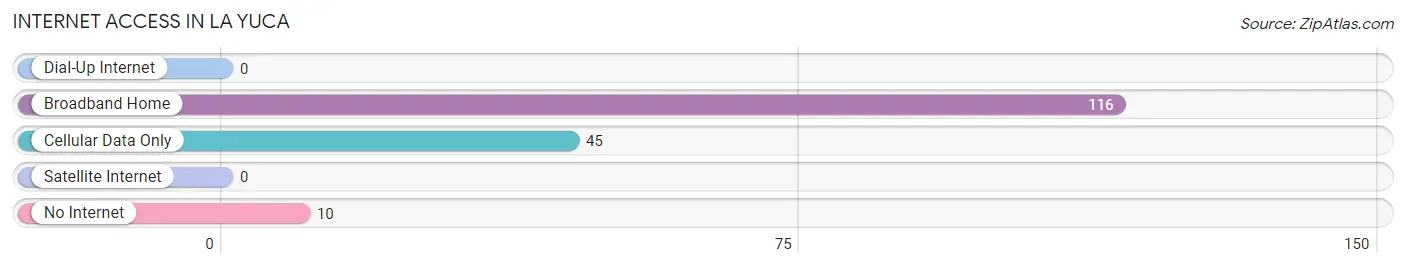
| Internet Type | # Households | % Households |
| Dial-Up Internet | 0 | 0.0% |
| Broadband Home | 116 | 67.8% |
| Cellular Data Only | 45 | 26.3% |
| Satellite Internet | 0 | 0.0% |
| No Internet | 10 | 5.9% |
| Total | 171 | 100.0% |
La Yuca Summary
Yuca, Puerto Rico is a small town located in the municipality of San Lorenzo, Puerto Rico. It is located in the central region of the island, about 20 miles south of San Juan. The town has a population of approximately 4,000 people and is known for its agricultural production.
History
Yuca was founded in 1845 by a group of settlers from the nearby town of San Lorenzo. The settlers were looking for a place to settle and cultivate the land. The town was named after the yuca plant, which was abundant in the area. The town was officially recognized in 1848 and has been a part of the municipality of San Lorenzo ever since.
Geography
Yuca is located in the central region of Puerto Rico, about 20 miles south of San Juan. The town is situated in a valley surrounded by mountains. The terrain is mostly flat and the climate is tropical. The average temperature is around 80 degrees Fahrenheit and the average rainfall is around 50 inches per year.
Economy
Yuca’s economy is mainly based on agriculture. The town is known for its production of coffee, sugar cane, and other crops. The town also has a few small businesses, such as restaurants, stores, and a few small factories.
Demographics
As of the 2010 census, Yuca had a population of 4,000 people. The population is mostly of Puerto Rican descent, with a small percentage of other ethnicities. The median age is 33 years old and the median household income is around $20,000.
Conclusion
Yuca, Puerto Rico is a small town located in the municipality of San Lorenzo, Puerto Rico. It is known for its agricultural production and has a population of around 4,000 people. The town has a tropical climate and the economy is mainly based on agriculture. The population is mostly of Puerto Rican descent, with a small percentage of other ethnicities.
Common Questions
What is Per Capita Income in La Yuca?
Per Capita income in La Yuca is $14,727.
What is the Median Family Income in La Yuca?
Median Family Income in La Yuca is $27,258.
What is the Median Household income in La Yuca?
Median Household Income in La Yuca is $26,089.
What is Inequality or Gini Index in La Yuca?
Inequality or Gini Index in La Yuca is 0.35.
What is the Total Population of La Yuca?
Total Population of La Yuca is 329.
What is the Total Male Population of La Yuca?
Total Male Population of La Yuca is 161.
What is the Total Female Population of La Yuca?
Total Female Population of La Yuca is 168.
What is the Ratio of Males per 100 Females in La Yuca?
There are 95.83 Males per 100 Females in La Yuca.
What is the Ratio of Females per 100 Males in La Yuca?
There are 104.35 Females per 100 Males in La Yuca.
What is the Median Population Age in La Yuca?
Median Population Age in La Yuca is 62.4 Years.
What is the Average Family Size in La Yuca
Average Family Size in La Yuca is 2.9 People.
What is the Average Household Size in La Yuca
Average Household Size in La Yuca is 1.9 People.
How Large is the Labor Force in La Yuca?
There are 124 People in the Labor Forcein in La Yuca.
What is the Percentage of People in the Labor Force in La Yuca?
37.7% of People are in the Labor Force in La Yuca.