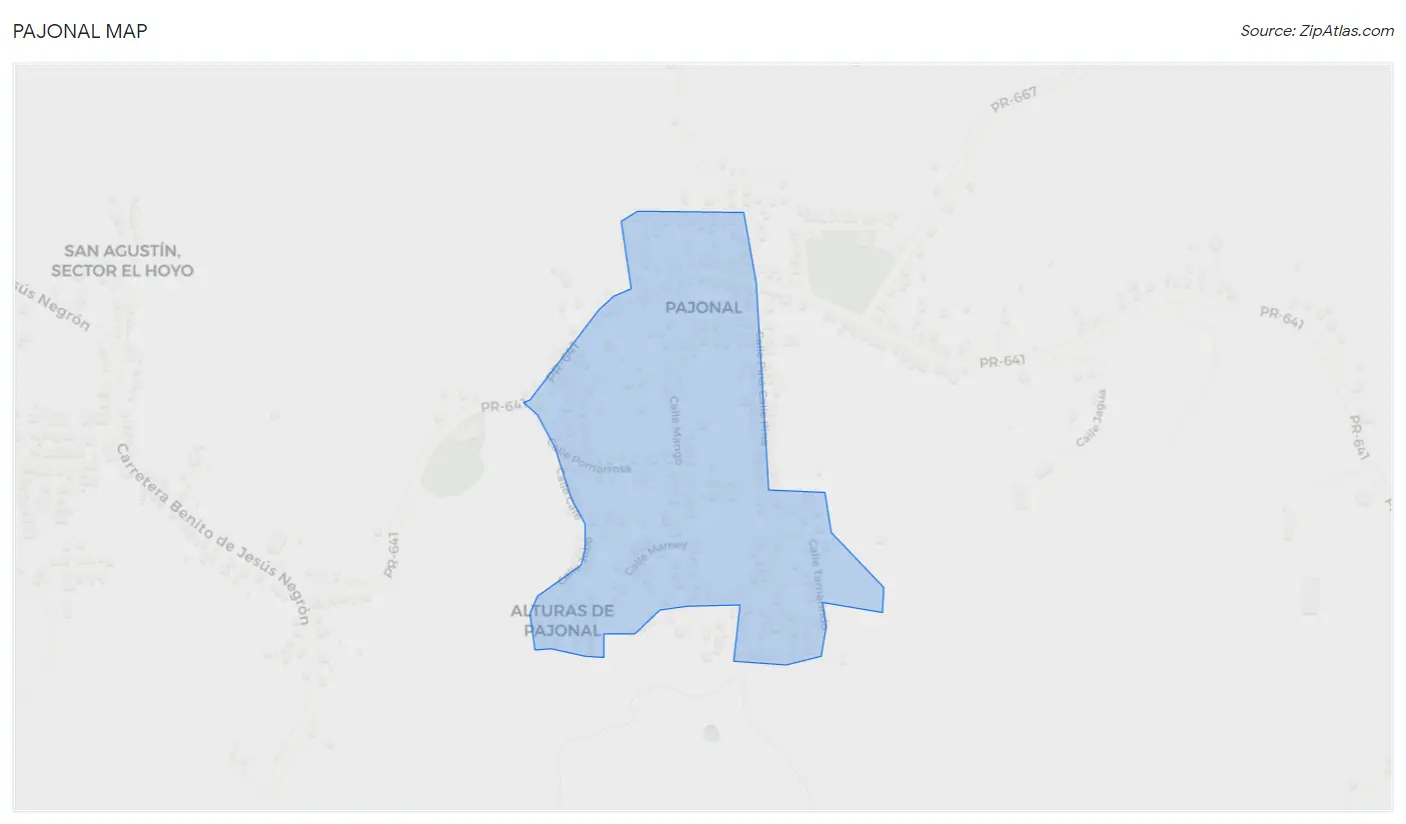
Pajonal, PR Map & Demographics
Pajonal Map
Pajonal Overview
$6,308
PER CAPITA INCOME
$13,571
AVG FAMILY INCOME
$13,087
AVG HOUSEHOLD INCOME
0.53
INEQUALITY / GINI INDEX
639
TOTAL POPULATION
357
MALE POPULATION
282
FEMALE POPULATION
126.60
MALES / 100 FEMALES
78.99
FEMALES / 100 MALES
43.3
MEDIAN AGE
3.2
AVG FAMILY SIZE
3.0
AVG HOUSEHOLD SIZE
273
LABOR FORCE [ PEOPLE ]
49.5%
PERCENT IN LABOR FORCE
47.6%
UNEMPLOYMENT RATE
Income in Pajonal
Income Overview in Pajonal
Per Capita Income in Pajonal is $6,308, while median incomes of families and households are $13,571 and $13,087 respectively.
| Characteristic | Number | Measure |
| Per Capita Income | 639 | $6,308 |
| Median Family Income | 194 | $13,571 |
| Mean Family Income | 194 | $17,088 |
| Median Household Income | 213 | $13,087 |
| Mean Household Income | 213 | $15,658 |
| Income Deficit | 194 | $0 |
| Wage / Income Gap (%) | 639 | 0.00% |
| Wage / Income Gap ($) | 639 | 100.00¢ per $1 |
| Gini / Inequality Index | 639 | 0.53 |
Earnings by Sex in Pajonal
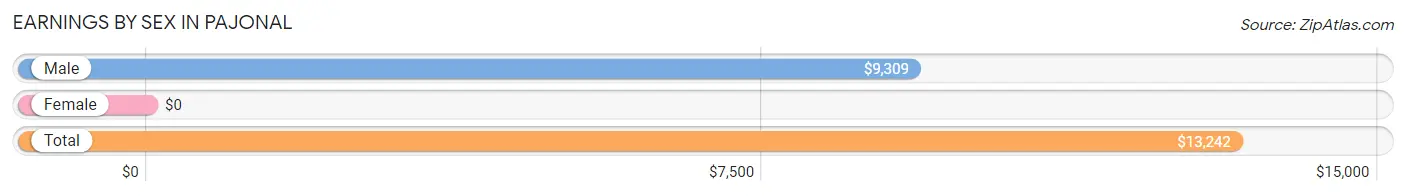
| Sex | Number | Average Earnings |
| Male | 135 (77.1%) | $9,309 |
| Female | 40 (22.9%) | $0 |
| Total | 175 (100.0%) | $13,242 |
Earnings by Sex by Income Bracket in Pajonal
The most common earnings brackets in Pajonal are $2,499 or less for men (40 | 29.6%) and $15,000 to $17,499 for women (40 | 100.0%).
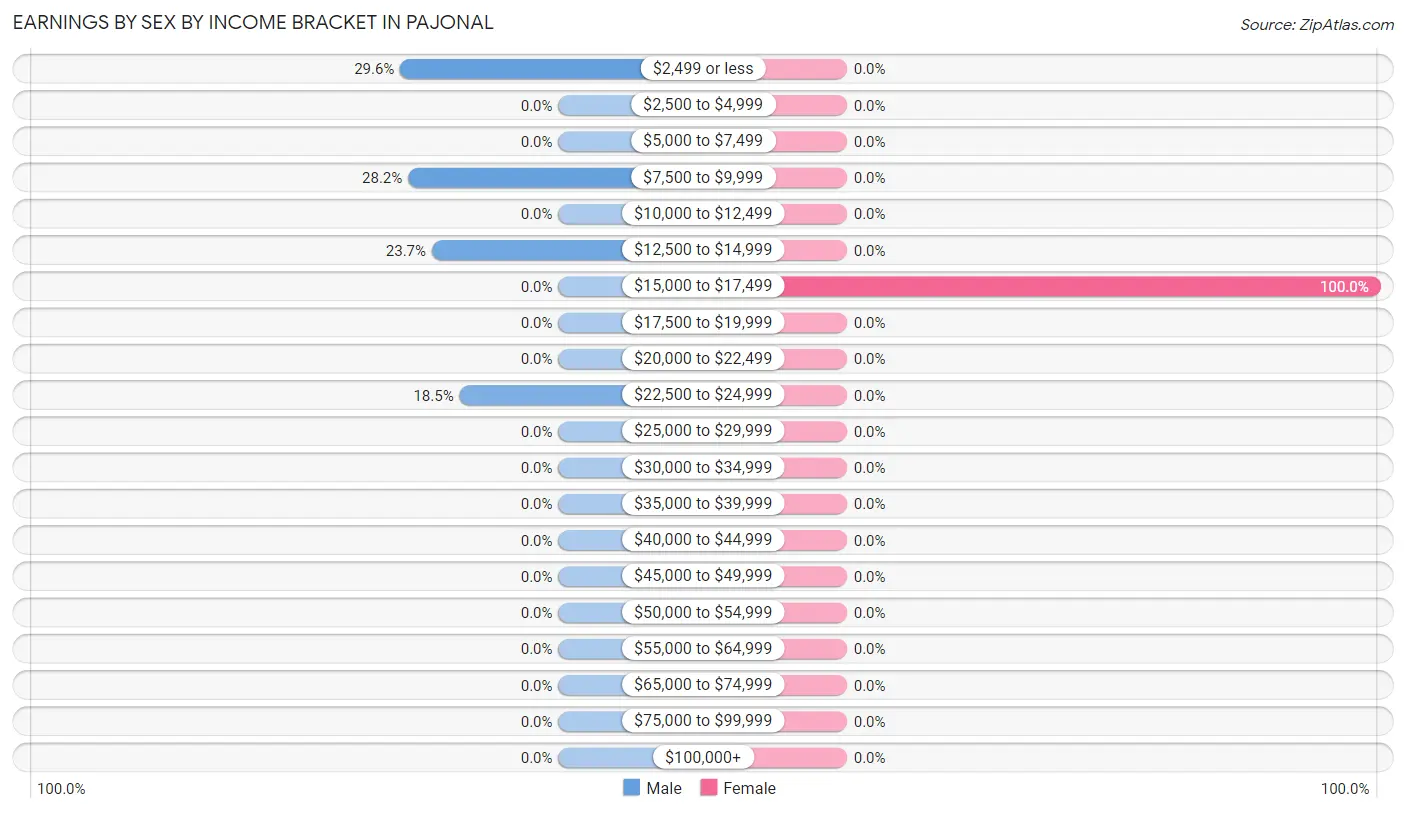
| Income | Male | Female |
| $2,499 or less | 40 (29.6%) | 0 (0.0%) |
| $2,500 to $4,999 | 0 (0.0%) | 0 (0.0%) |
| $5,000 to $7,499 | 0 (0.0%) | 0 (0.0%) |
| $7,500 to $9,999 | 38 (28.1%) | 0 (0.0%) |
| $10,000 to $12,499 | 0 (0.0%) | 0 (0.0%) |
| $12,500 to $14,999 | 32 (23.7%) | 0 (0.0%) |
| $15,000 to $17,499 | 0 (0.0%) | 40 (100.0%) |
| $17,500 to $19,999 | 0 (0.0%) | 0 (0.0%) |
| $20,000 to $22,499 | 0 (0.0%) | 0 (0.0%) |
| $22,500 to $24,999 | 25 (18.5%) | 0 (0.0%) |
| $25,000 to $29,999 | 0 (0.0%) | 0 (0.0%) |
| $30,000 to $34,999 | 0 (0.0%) | 0 (0.0%) |
| $35,000 to $39,999 | 0 (0.0%) | 0 (0.0%) |
| $40,000 to $44,999 | 0 (0.0%) | 0 (0.0%) |
| $45,000 to $49,999 | 0 (0.0%) | 0 (0.0%) |
| $50,000 to $54,999 | 0 (0.0%) | 0 (0.0%) |
| $55,000 to $64,999 | 0 (0.0%) | 0 (0.0%) |
| $65,000 to $74,999 | 0 (0.0%) | 0 (0.0%) |
| $75,000 to $99,999 | 0 (0.0%) | 0 (0.0%) |
| $100,000+ | 0 (0.0%) | 0 (0.0%) |
| Total | 135 (100.0%) | 40 (100.0%) |
Earnings by Sex by Educational Attainment in Pajonal
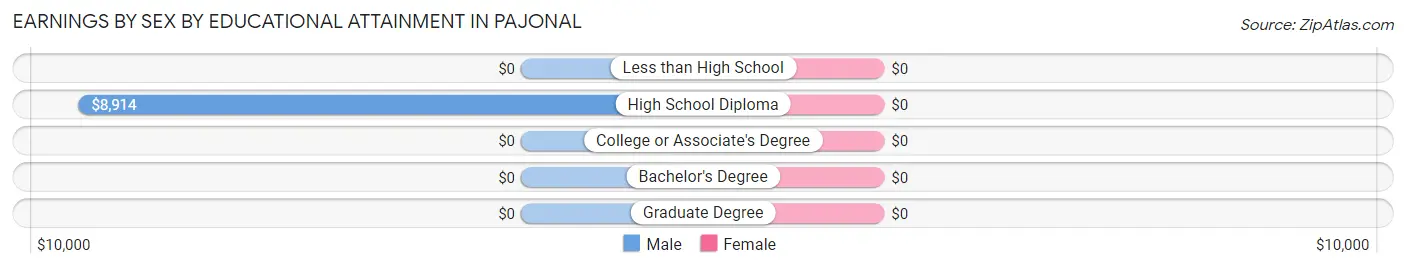
| Educational Attainment | Male Income | Female Income |
| Less than High School | - | - |
| High School Diploma | $8,914 | $0 |
| College or Associate's Degree | - | - |
| Bachelor's Degree | - | - |
| Graduate Degree | - | - |
| Total | $9,309 | $0 |
Family Income in Pajonal
Family Income Brackets in Pajonal
According to the Pajonal family income data, there are 76 families falling into the less than $10,000 income range, which is the most common income bracket and makes up 39.2% of all families.
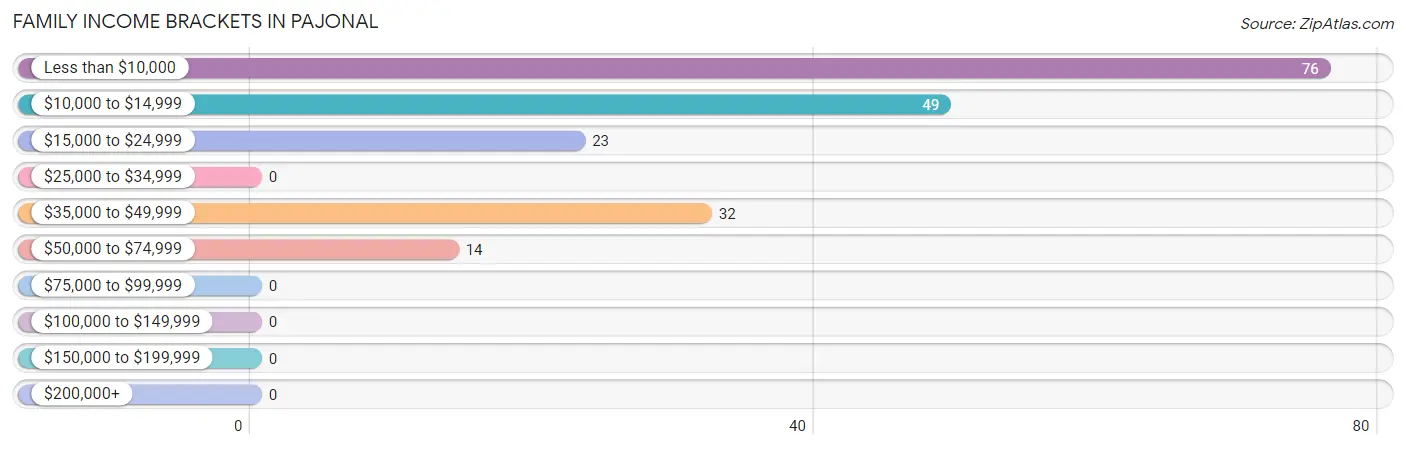
| Income Bracket | # Families | % Families |
| Less than $10,000 | 76 | 39.2% |
| $10,000 to $14,999 | 49 | 25.3% |
| $15,000 to $24,999 | 23 | 11.9% |
| $25,000 to $34,999 | 0 | 0.0% |
| $35,000 to $49,999 | 32 | 16.5% |
| $50,000 to $74,999 | 14 | 7.2% |
| $75,000 to $99,999 | 0 | 0.0% |
| $100,000 to $149,999 | 0 | 0.0% |
| $150,000 to $199,999 | 0 | 0.0% |
| $200,000+ | 0 | 0.0% |
Family Income by Famaliy Size in Pajonal
| Income Bracket | # Families | Median Income |
| 2-Person Families | 91 (46.9%) | $0 |
| 3-Person Families | 43 (22.2%) | $0 |
| 4-Person Families | 32 (16.5%) | $0 |
| 5-Person Families | 28 (14.4%) | $0 |
| 6-Person Families | 0 (0.0%) | $0 |
| 7+ Person Families | 0 (0.0%) | $0 |
| Total | 194 (100.0%) | $13,571 |
Family Income by Number of Earners in Pajonal
| Number of Earners | # Families | Median Income |
| No Earners | 99 (51.0%) | $0 |
| 1 Earner | 49 (25.3%) | $0 |
| 2 Earners | 46 (23.7%) | $0 |
| 3+ Earners | 0 (0.0%) | $0 |
| Total | 194 (100.0%) | $13,571 |
Household Income in Pajonal
Household Income Brackets in Pajonal
With 95 households falling in the category, the less than $10,000 income range is the most frequent in Pajonal, accounting for 44.6% of all households.
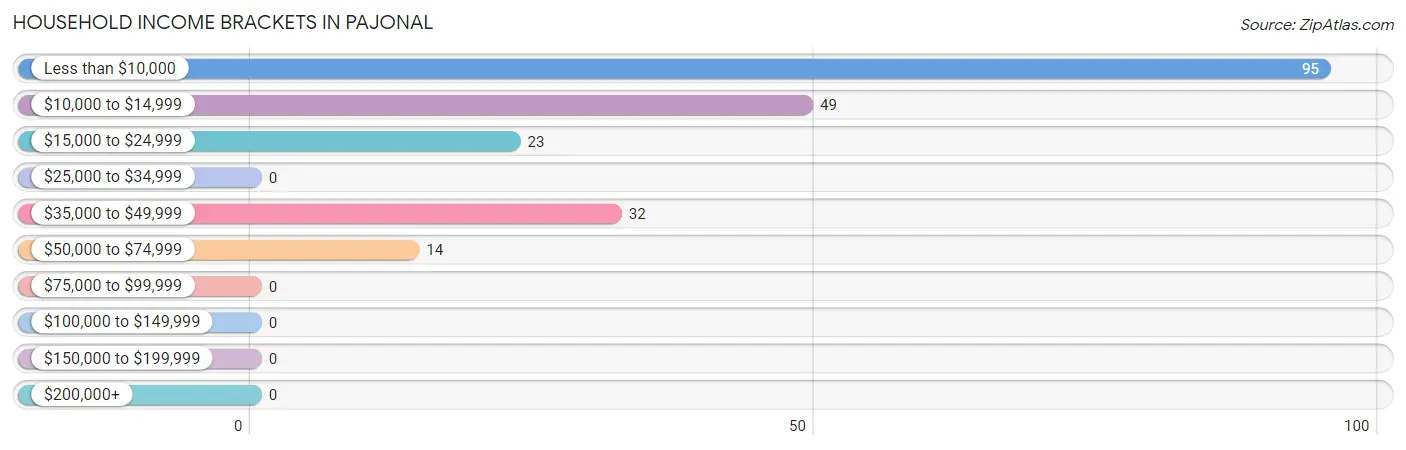
| Income Bracket | # Households | % Households |
| Less than $10,000 | 95 | 44.6% |
| $10,000 to $14,999 | 49 | 23.0% |
| $15,000 to $24,999 | 23 | 10.8% |
| $25,000 to $34,999 | 0 | 0.0% |
| $35,000 to $49,999 | 32 | 15.0% |
| $50,000 to $74,999 | 14 | 6.6% |
| $75,000 to $99,999 | 0 | 0.0% |
| $100,000 to $149,999 | 0 | 0.0% |
| $150,000 to $199,999 | 0 | 0.0% |
| $200,000+ | 0 | 0.0% |
Household Income by Householder Age in Pajonal
| Income Bracket | # Households | Median Income |
| 15 to 24 Years | 28 (13.2%) | $0 |
| 25 to 44 Years | 29 (13.6%) | $0 |
| 45 to 64 Years | 51 (23.9%) | $0 |
| 65+ Years | 105 (49.3%) | $0 |
| Total | 213 (100.0%) | $13,087 |
Poverty in Pajonal
Income Below Poverty by Sex and Age in Pajonal
With 67.5% poverty level for males and 80.8% for females among the residents of Pajonal, 18 to 24 year old males and under 5 year old females are the most vulnerable to poverty, with 28 males (100.0%) and 23 females (100.0%) in their respective age groups living below the poverty level.
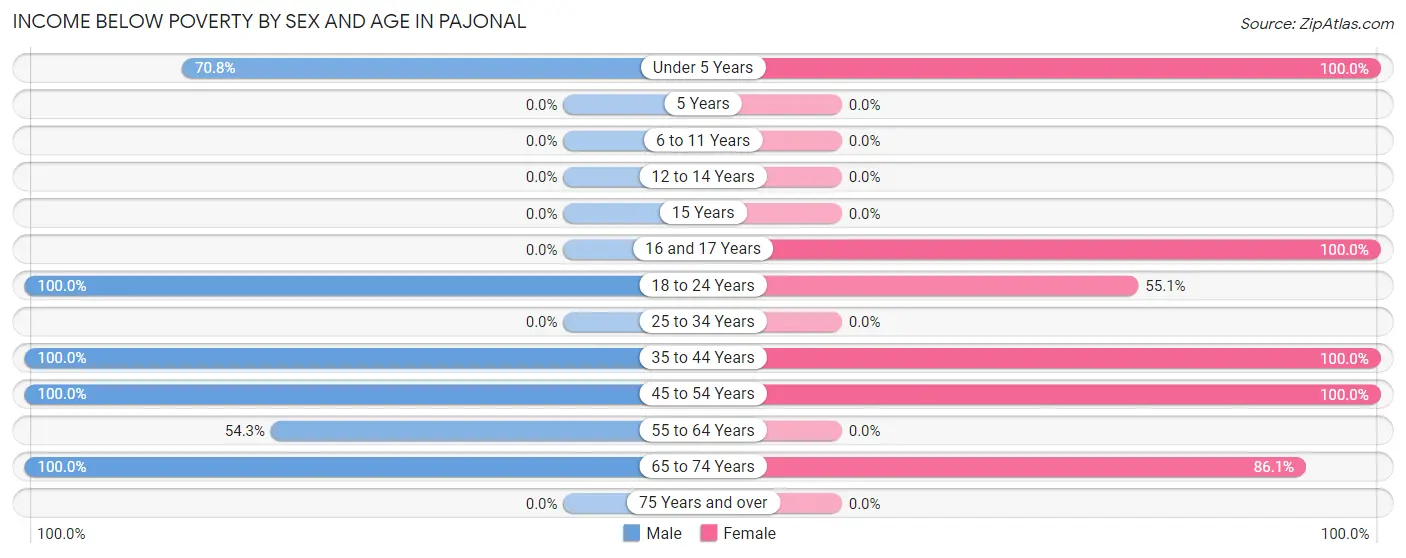
| Age Bracket | Male | Female |
| Under 5 Years | 46 (70.8%) | 23 (100.0%) |
| 5 Years | 0 (0.0%) | 0 (0.0%) |
| 6 to 11 Years | 0 (0.0%) | 0 (0.0%) |
| 12 to 14 Years | 0 (0.0%) | 0 (0.0%) |
| 15 Years | 0 (0.0%) | 0 (0.0%) |
| 16 and 17 Years | 0 (0.0%) | 21 (100.0%) |
| 18 to 24 Years | 28 (100.0%) | 49 (55.1%) |
| 25 to 34 Years | 0 (0.0%) | 0 (0.0%) |
| 35 to 44 Years | 32 (100.0%) | 29 (100.0%) |
| 45 to 54 Years | 39 (100.0%) | 19 (100.0%) |
| 55 to 64 Years | 38 (54.3%) | 0 (0.0%) |
| 65 to 74 Years | 58 (100.0%) | 87 (86.1%) |
| 75 Years and over | 0 (0.0%) | 0 (0.0%) |
| Total | 241 (67.5%) | 228 (80.8%) |
Income Above Poverty by Sex and Age in Pajonal
According to the poverty statistics in Pajonal, males aged 25 to 34 years and females aged 18 to 24 years are the age groups that are most secure financially, with 100.0% of males and 44.9% of females in these age groups living above the poverty line.
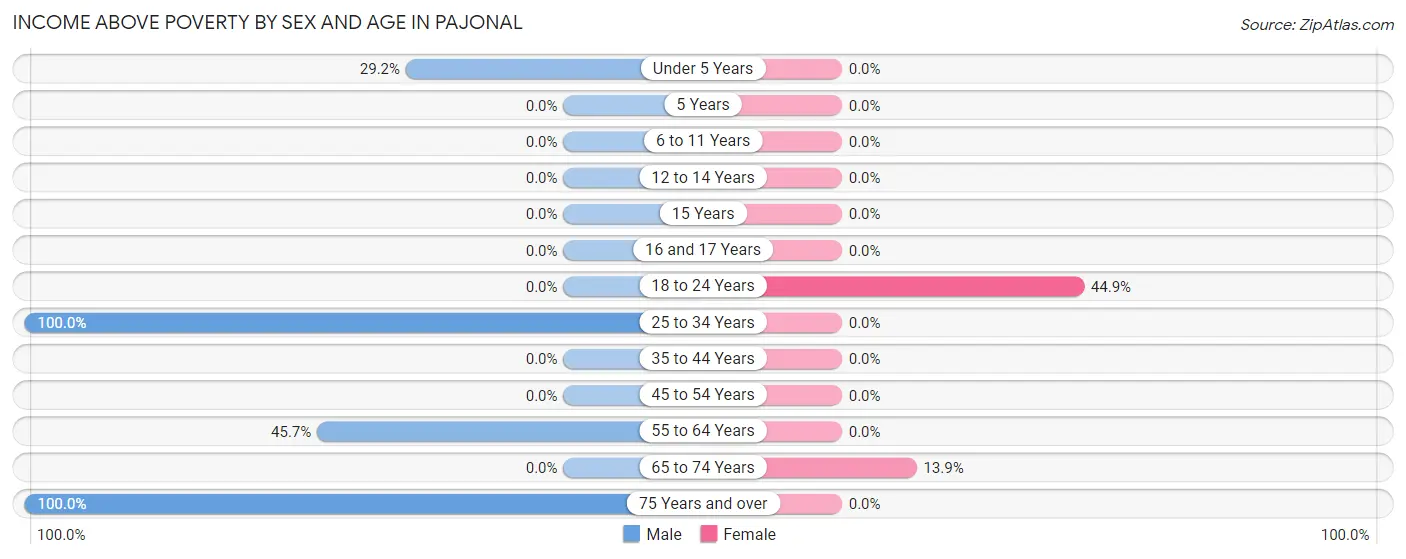
| Age Bracket | Male | Female |
| Under 5 Years | 19 (29.2%) | 0 (0.0%) |
| 5 Years | 0 (0.0%) | 0 (0.0%) |
| 6 to 11 Years | 0 (0.0%) | 0 (0.0%) |
| 12 to 14 Years | 0 (0.0%) | 0 (0.0%) |
| 15 Years | 0 (0.0%) | 0 (0.0%) |
| 16 and 17 Years | 0 (0.0%) | 0 (0.0%) |
| 18 to 24 Years | 0 (0.0%) | 40 (44.9%) |
| 25 to 34 Years | 52 (100.0%) | 0 (0.0%) |
| 35 to 44 Years | 0 (0.0%) | 0 (0.0%) |
| 45 to 54 Years | 0 (0.0%) | 0 (0.0%) |
| 55 to 64 Years | 32 (45.7%) | 0 (0.0%) |
| 65 to 74 Years | 0 (0.0%) | 14 (13.9%) |
| 75 Years and over | 13 (100.0%) | 0 (0.0%) |
| Total | 116 (32.5%) | 54 (19.2%) |
Income Below Poverty Among Married-Couple Families in Pajonal
The poverty statistics for married-couple families in Pajonal show that 87.4% or 97 of the total 111 families live below the poverty line. Families with 1 or 2 children have the highest poverty rate of 100.0%, comprising of 29 families. On the other hand, families with no children have the lowest poverty rate of 82.9%, which includes 68 families.
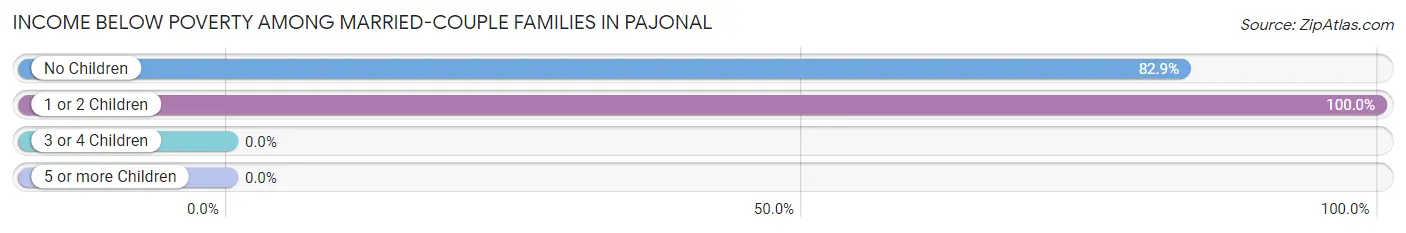
| Children | Above Poverty | Below Poverty |
| No Children | 14 (17.1%) | 68 (82.9%) |
| 1 or 2 Children | 0 (0.0%) | 29 (100.0%) |
| 3 or 4 Children | 0 (0.0%) | 0 (0.0%) |
| 5 or more Children | 0 (0.0%) | 0 (0.0%) |
| Total | 14 (12.6%) | 97 (87.4%) |
Income Below Poverty Among Single-Parent Households in Pajonal
According to the poverty data in Pajonal, 46.7% or 28 single-father households and 100.0% or 23 single-mother households are living below the poverty line. Among single-father households, those with 3 or 4 children have the highest poverty rate, with 28 households (100.0%) experiencing poverty. Likewise, among single-mother households, those with no children have the highest poverty rate, with 23 households (100.0%) falling below the poverty line.
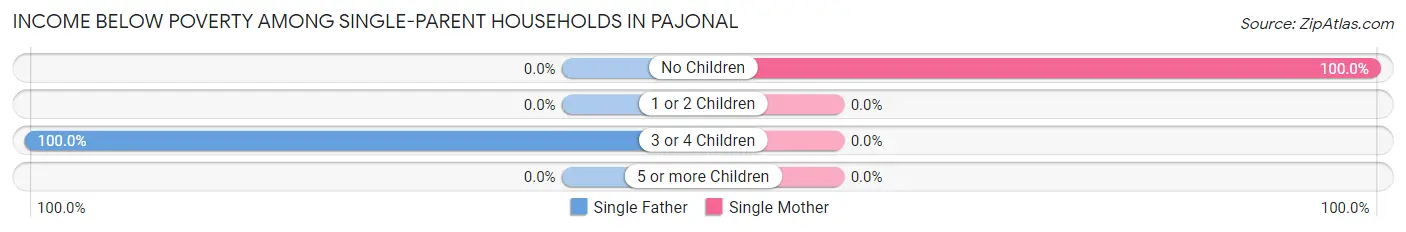
| Children | Single Father | Single Mother |
| No Children | 0 (0.0%) | 23 (100.0%) |
| 1 or 2 Children | 0 (0.0%) | 0 (0.0%) |
| 3 or 4 Children | 28 (100.0%) | 0 (0.0%) |
| 5 or more Children | 0 (0.0%) | 0 (0.0%) |
| Total | 28 (46.7%) | 23 (100.0%) |
Income Below Poverty Among Married-Couple vs Single-Parent Households in Pajonal
The poverty data for Pajonal shows that 97 of the married-couple family households (87.4%) and 51 of the single-parent households (61.5%) are living below the poverty level. Within the married-couple family households, those with 1 or 2 children have the highest poverty rate, with 29 households (100.0%) falling below the poverty line. Among the single-parent households, those with no children have the highest poverty rate, with 23 household (100.0%) living below poverty.
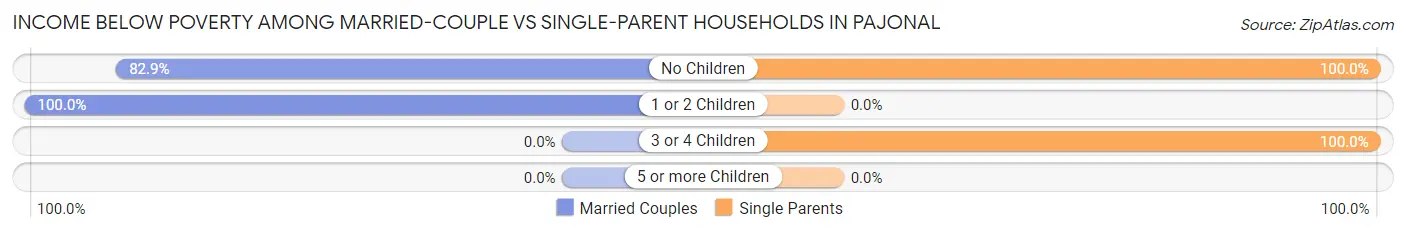
| Children | Married-Couple Families | Single-Parent Households |
| No Children | 68 (82.9%) | 23 (100.0%) |
| 1 or 2 Children | 29 (100.0%) | 0 (0.0%) |
| 3 or 4 Children | 0 (0.0%) | 28 (100.0%) |
| 5 or more Children | 0 (0.0%) | 0 (0.0%) |
| Total | 97 (87.4%) | 51 (61.5%) |
Race in Pajonal
The most populous races in Pajonal are Hispanic or Latino (639 | 100.0%), Some other Race (298 | 46.6%), and White / Caucasian (192 | 30.0%).
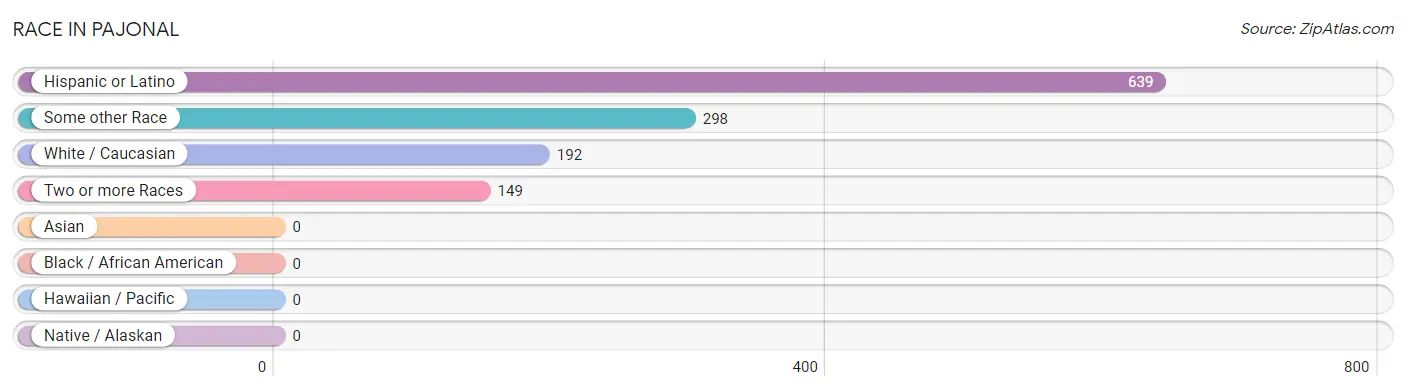
| Race | # Population | % Population |
| Asian | 0 | 0.0% |
| Black / African American | 0 | 0.0% |
| Hawaiian / Pacific | 0 | 0.0% |
| Hispanic or Latino | 639 | 100.0% |
| Native / Alaskan | 0 | 0.0% |
| White / Caucasian | 192 | 30.0% |
| Two or more Races | 149 | 23.3% |
| Some other Race | 298 | 46.6% |
| Total | 639 | 100.0% |
Ancestry in Pajonal
The most populous ancestries reported in Pajonal are Puerto Rican (639 | 100.0%), and American (13 | 2.0%), together accounting for 102.0% of all Pajonal residents.
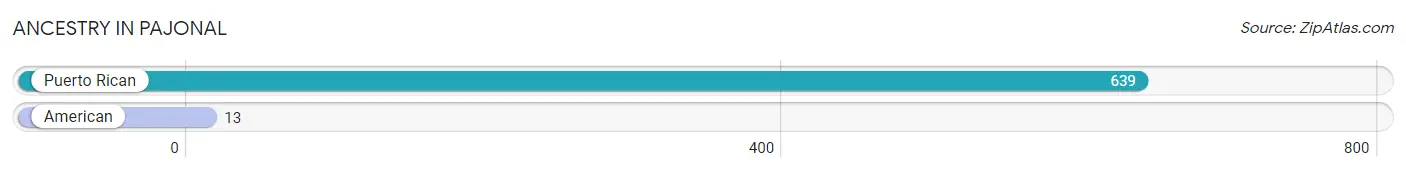
| Ancestry | # Population | % Population |
| American | 13 | 2.0% |
| Puerto Rican | 639 | 100.0% | View All 2 Rows |
Immigrants in Pajonal

| Immigration Origin | # Population | % Population | View All 0 Rows |
Sex and Age in Pajonal
Sex and Age in Pajonal
The most populous age groups in Pajonal are 60 to 64 Years (70 | 19.6%) for men and 20 to 24 Years (89 | 31.6%) for women.
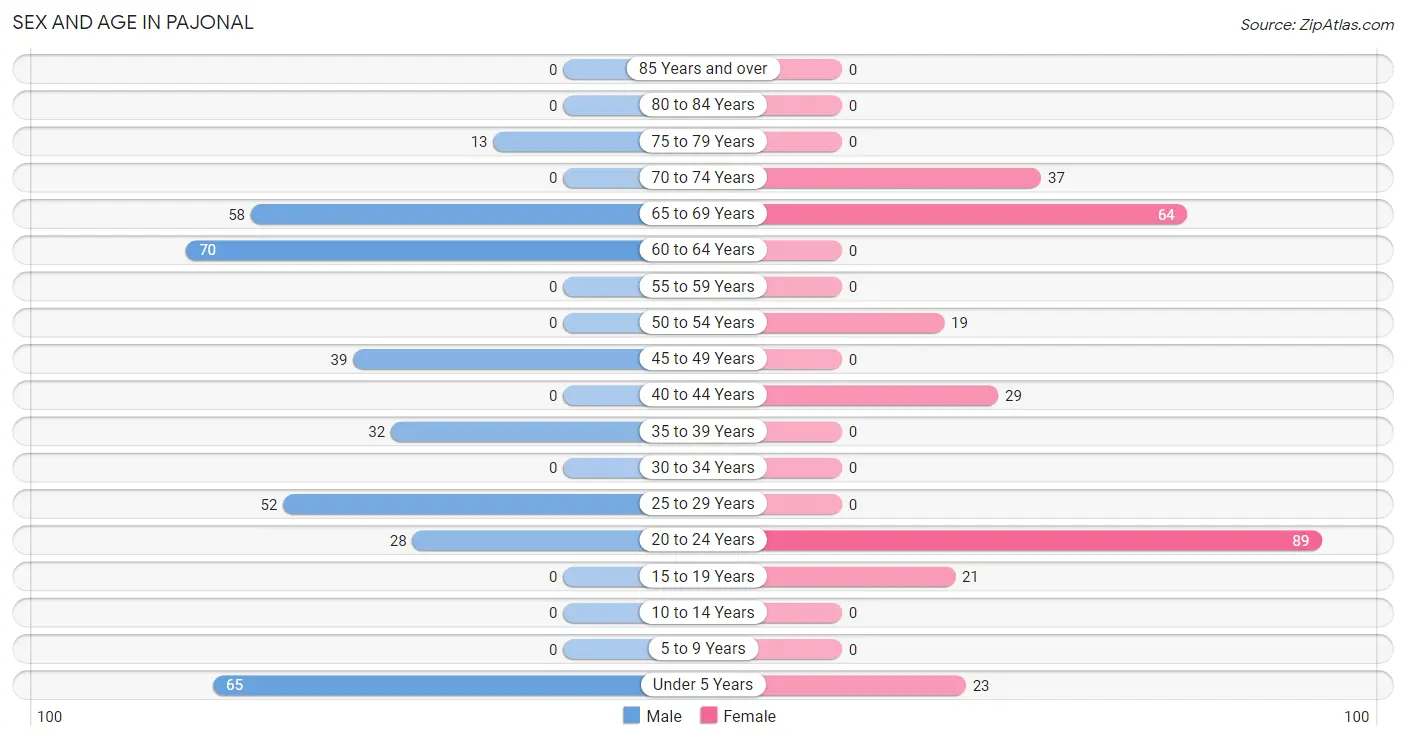
| Age Bracket | Male | Female |
| Under 5 Years | 65 (18.2%) | 23 (8.2%) |
| 5 to 9 Years | 0 (0.0%) | 0 (0.0%) |
| 10 to 14 Years | 0 (0.0%) | 0 (0.0%) |
| 15 to 19 Years | 0 (0.0%) | 21 (7.4%) |
| 20 to 24 Years | 28 (7.8%) | 89 (31.6%) |
| 25 to 29 Years | 52 (14.6%) | 0 (0.0%) |
| 30 to 34 Years | 0 (0.0%) | 0 (0.0%) |
| 35 to 39 Years | 32 (9.0%) | 0 (0.0%) |
| 40 to 44 Years | 0 (0.0%) | 29 (10.3%) |
| 45 to 49 Years | 39 (10.9%) | 0 (0.0%) |
| 50 to 54 Years | 0 (0.0%) | 19 (6.7%) |
| 55 to 59 Years | 0 (0.0%) | 0 (0.0%) |
| 60 to 64 Years | 70 (19.6%) | 0 (0.0%) |
| 65 to 69 Years | 58 (16.3%) | 64 (22.7%) |
| 70 to 74 Years | 0 (0.0%) | 37 (13.1%) |
| 75 to 79 Years | 13 (3.6%) | 0 (0.0%) |
| 80 to 84 Years | 0 (0.0%) | 0 (0.0%) |
| 85 Years and over | 0 (0.0%) | 0 (0.0%) |
| Total | 357 (100.0%) | 282 (100.0%) |
Families and Households in Pajonal
Median Family Size in Pajonal
The median family size in Pajonal is 3.20 persons per family, with single male/father families (60 | 30.9%) accounting for the largest median family size of 4.4 persons per family. On the other hand, married-couple families (111 | 57.2%) represent the smallest median family size with 2.65 persons per family.
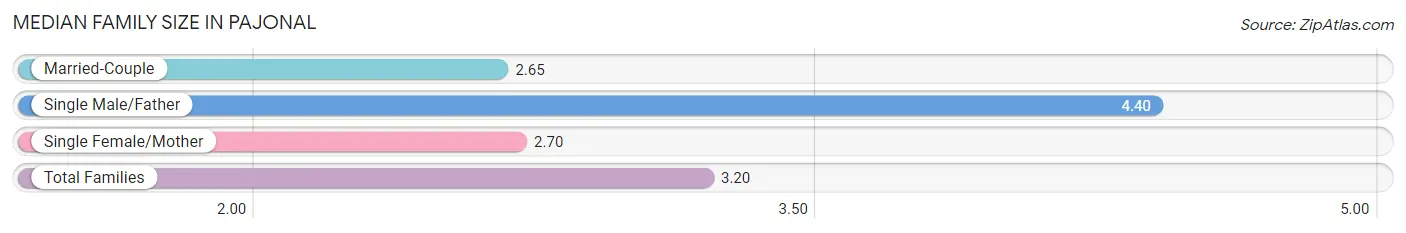
| Family Type | # Families | Family Size |
| Married-Couple | 111 (57.2%) | 2.65 |
| Single Male/Father | 60 (30.9%) | 4.40 |
| Single Female/Mother | 23 (11.9%) | 2.70 |
| Total Families | 194 (100.0%) | 3.20 |
Median Household Size in Pajonal
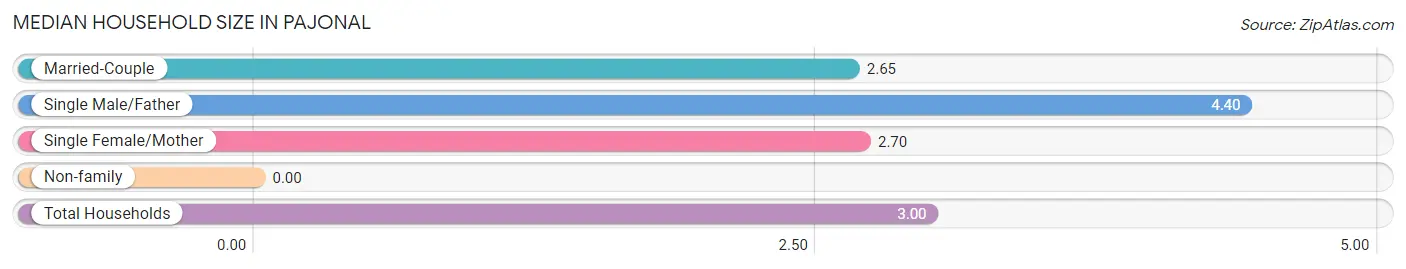
| Household Type | # Households | Household Size |
| Married-Couple | 111 (52.1%) | 2.65 |
| Single Male/Father | 60 (28.2%) | 4.40 |
| Single Female/Mother | 23 (10.8%) | 2.70 |
| Non-family | 19 (8.9%) | - |
| Total Households | 213 (100.0%) | 3.00 |
Household Size by Marriage Status in Pajonal
Out of a total of 213 households in Pajonal, 194 (91.1%) are family households, while 19 (8.9%) are nonfamily households. The most numerous type of family households are 2-person households, comprising 91, and the most common type of nonfamily households are 1-person households, comprising 19.
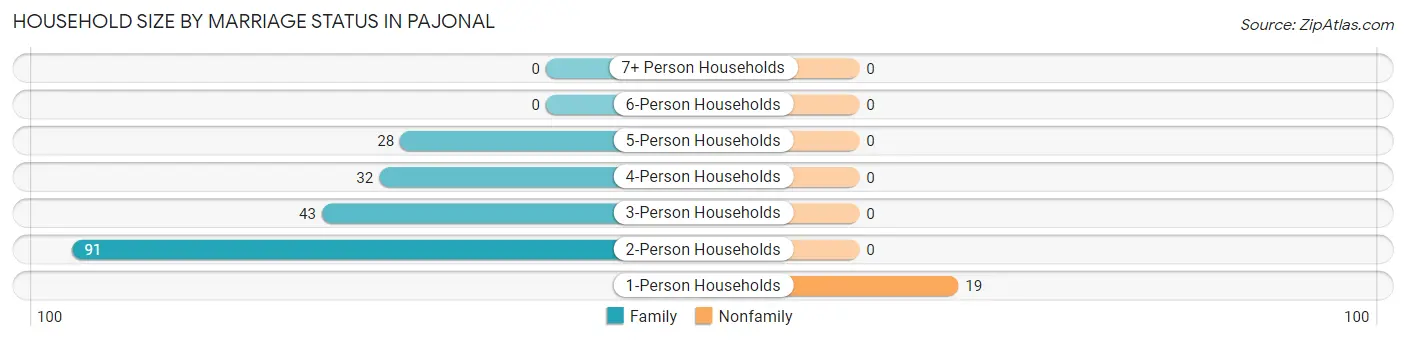
| Household Size | Family Households | Nonfamily Households |
| 1-Person Households | - | 19 (8.9%) |
| 2-Person Households | 91 (42.7%) | 0 (0.0%) |
| 3-Person Households | 43 (20.2%) | 0 (0.0%) |
| 4-Person Households | 32 (15.0%) | 0 (0.0%) |
| 5-Person Households | 28 (13.2%) | 0 (0.0%) |
| 6-Person Households | 0 (0.0%) | 0 (0.0%) |
| 7+ Person Households | 0 (0.0%) | 0 (0.0%) |
| Total | 194 (91.1%) | 19 (8.9%) |
Female Fertility in Pajonal
Fertility by Age in Pajonal
Average fertility rate in Pajonal is 288.0 births per 1,000 women. Women in the age bracket of 20 to 34 years have the highest fertility rate with 449.0 births per 1,000 women. Women in the age bracket of 20 to 34 years acount for 100.0% of all women with births.
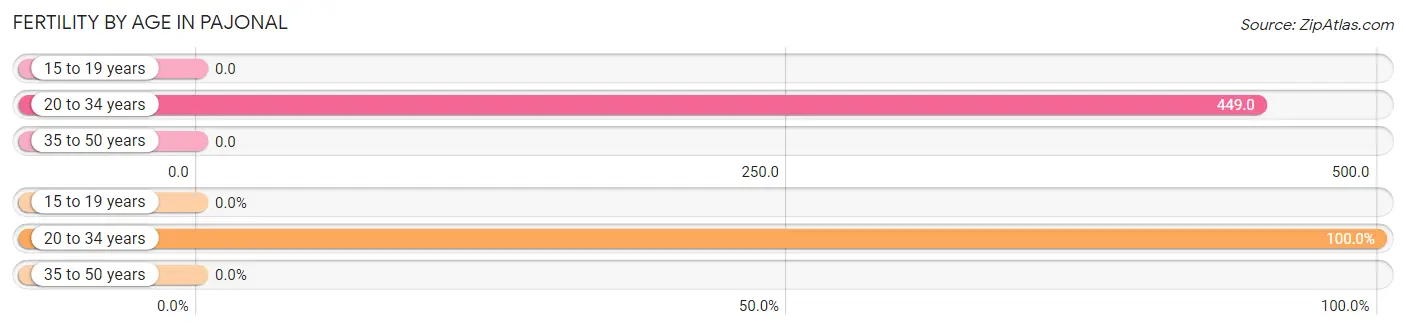
| Age Bracket | Women with Births | Births / 1,000 Women |
| 15 to 19 years | 0 (0.0%) | 0.0 |
| 20 to 34 years | 40 (100.0%) | 449.0 |
| 35 to 50 years | 0 (0.0%) | 0.0 |
| Total | 40 (100.0%) | 288.0 |
Fertility by Age by Marriage Status in Pajonal
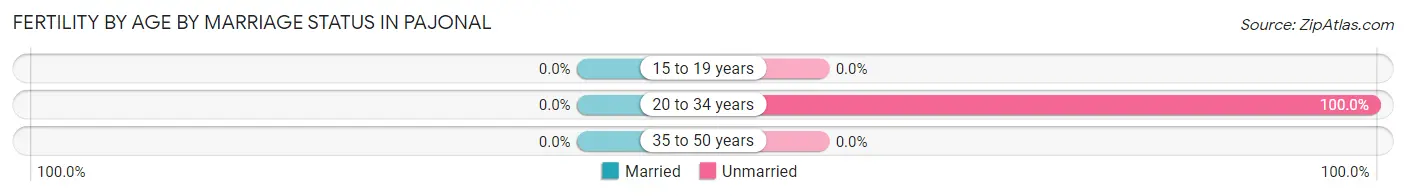
| Age Bracket | Married | Unmarried |
| 15 to 19 years | 0 (0.0%) | 0 (0.0%) |
| 20 to 34 years | 0 (0.0%) | 40 (100.0%) |
| 35 to 50 years | 0 (0.0%) | 0 (0.0%) |
| Total | 0 (0.0%) | 40 (100.0%) |
Fertility by Education in Pajonal
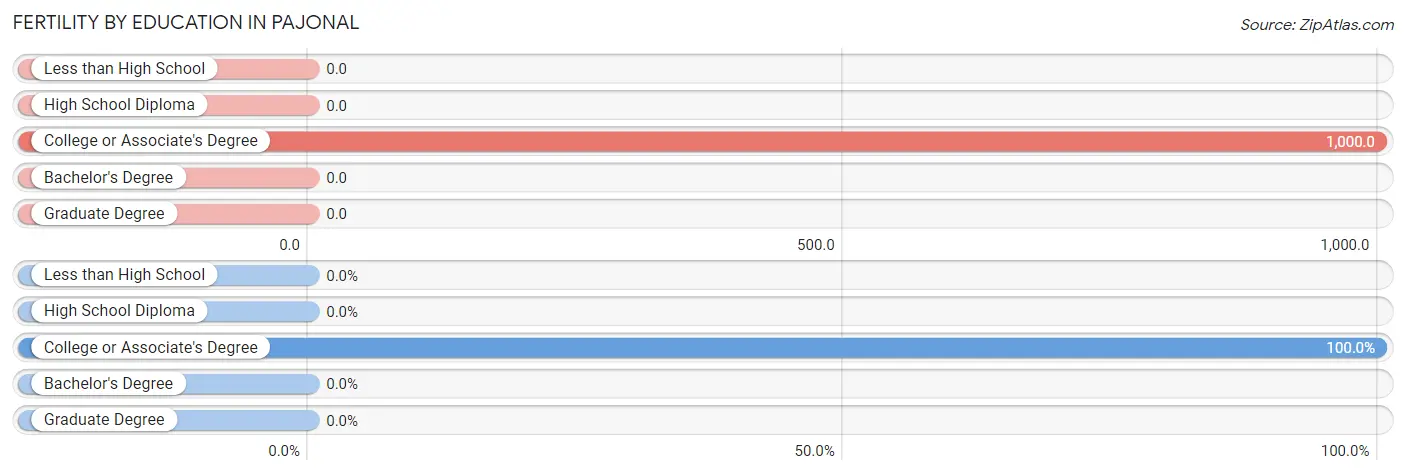
| Educational Attainment | Women with Births | Births / 1,000 Women |
| Less than High School | 0 (0.0%) | 0.0 |
| High School Diploma | 0 (0.0%) | 0.0 |
| College or Associate's Degree | 40 (100.0%) | 1,000.0 |
| Bachelor's Degree | 0 (0.0%) | 0.0 |
| Graduate Degree | 0 (0.0%) | 0.0 |
| Total | 40 (100.0%) | 288.0 |
Fertility by Education by Marriage Status in Pajonal
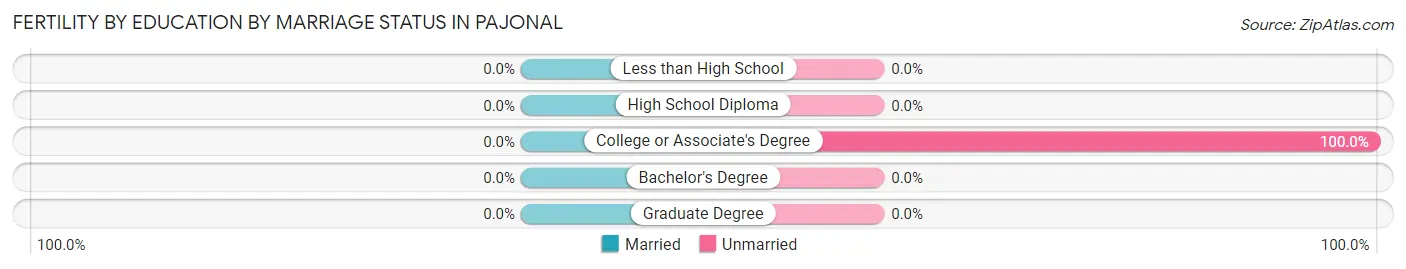
| Educational Attainment | Married | Unmarried |
| Less than High School | 0 (0.0%) | 0 (0.0%) |
| High School Diploma | 0 (0.0%) | 0 (0.0%) |
| College or Associate's Degree | 0 (0.0%) | 40 (100.0%) |
| Bachelor's Degree | 0 (0.0%) | 0 (0.0%) |
| Graduate Degree | 0 (0.0%) | 0 (0.0%) |
| Total | 0 (0.0%) | 40 (100.0%) |
Employment Characteristics in Pajonal
Employment by Class of Employer in Pajonal
Among the 143 employed individuals in Pajonal, private company employees (92 | 64.3%), and self-employed (not incorporated) (51 | 35.7%) make up the most common classes of employment.
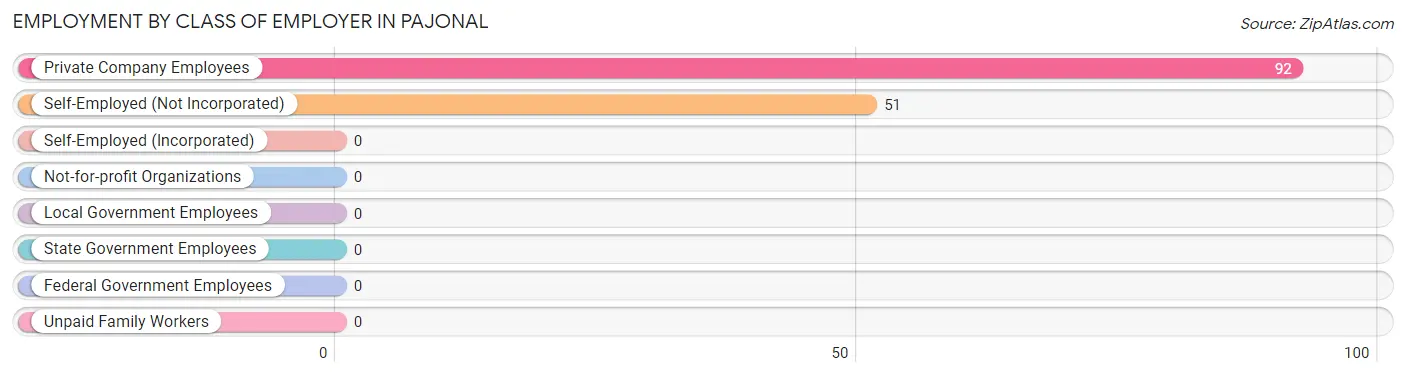
| Employer Class | # Employees | % Employees |
| Private Company Employees | 92 | 64.3% |
| Self-Employed (Incorporated) | 0 | 0.0% |
| Self-Employed (Not Incorporated) | 51 | 35.7% |
| Not-for-profit Organizations | 0 | 0.0% |
| Local Government Employees | 0 | 0.0% |
| State Government Employees | 0 | 0.0% |
| Federal Government Employees | 0 | 0.0% |
| Unpaid Family Workers | 0 | 0.0% |
| Total | 143 | 100.0% |
Employment Status by Age in Pajonal
According to the labor force statistics for Pajonal, out of the total population over 16 years of age (551), 49.5% or 273 individuals are in the labor force, with 47.6% or 130 of them unemployed. The age group with the highest labor force participation rate is 16 to 19 years, with 100.0% or 21 individuals in the labor force. Within the labor force, the 16 to 19 years age range has the highest percentage of unemployed individuals, with 100.0% or 21 of them being unemployed.
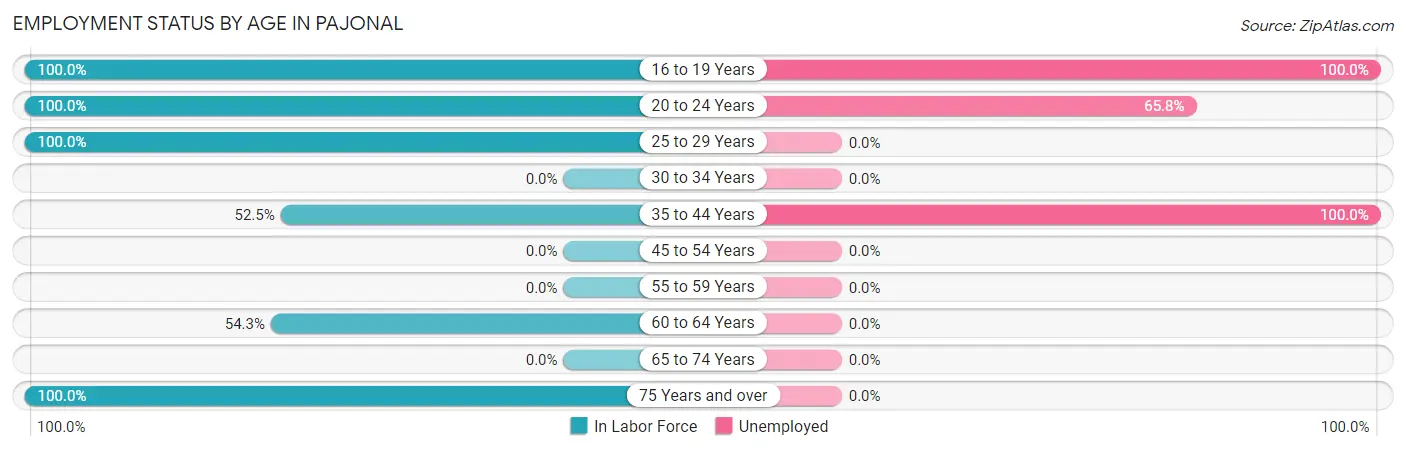
| Age Bracket | In Labor Force | Unemployed |
| 16 to 19 Years | 21 (100.0%) | 21 (100.0%) |
| 20 to 24 Years | 117 (100.0%) | 77 (65.8%) |
| 25 to 29 Years | 52 (100.0%) | 0 (0.0%) |
| 30 to 34 Years | 0 (0.0%) | 0 (0.0%) |
| 35 to 44 Years | 32 (52.5%) | 32 (100.0%) |
| 45 to 54 Years | 0 (0.0%) | 0 (0.0%) |
| 55 to 59 Years | 0 (0.0%) | 0 (0.0%) |
| 60 to 64 Years | 38 (54.3%) | 0 (0.0%) |
| 65 to 74 Years | 0 (0.0%) | 0 (0.0%) |
| 75 Years and over | 13 (100.0%) | 0 (0.0%) |
| Total | 273 (49.5%) | 130 (47.6%) |
Employment Status by Educational Attainment in Pajonal
According to labor force statistics for Pajonal, 50.6% of individuals (122) out of the total population between 25 and 64 years of age (241) are in the labor force, with 26.2% or 32 of them being unemployed. The group with the highest labor force participation rate are those with the educational attainment of bachelor's degree or higher, with 100.0% or 25 individuals in the labor force. Within the labor force, individuals with high school diploma education have the highest percentage of unemployment, with 33.0% or 32 of them being unemployed.
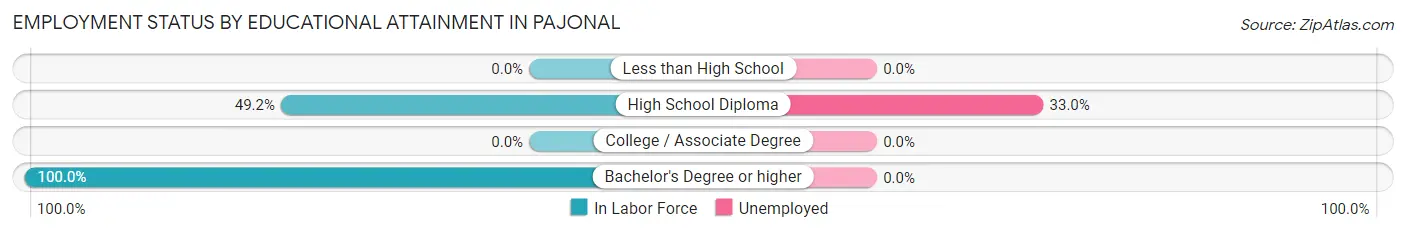
| Educational Attainment | In Labor Force | Unemployed |
| Less than High School | 0 (0.0%) | 0 (0.0%) |
| High School Diploma | 97 (49.2%) | 65 (33.0%) |
| College / Associate Degree | 0 (0.0%) | 0 (0.0%) |
| Bachelor's Degree or higher | 25 (100.0%) | 0 (0.0%) |
| Total | 122 (50.6%) | 63 (26.2%) |
Employment Occupations by Sex in Pajonal
Management, Business, Science and Arts Occupations
The most common Management, Business, Science and Arts occupations in Pajonal are , and Health Diagnosing & Treating (25 | 17.5%).
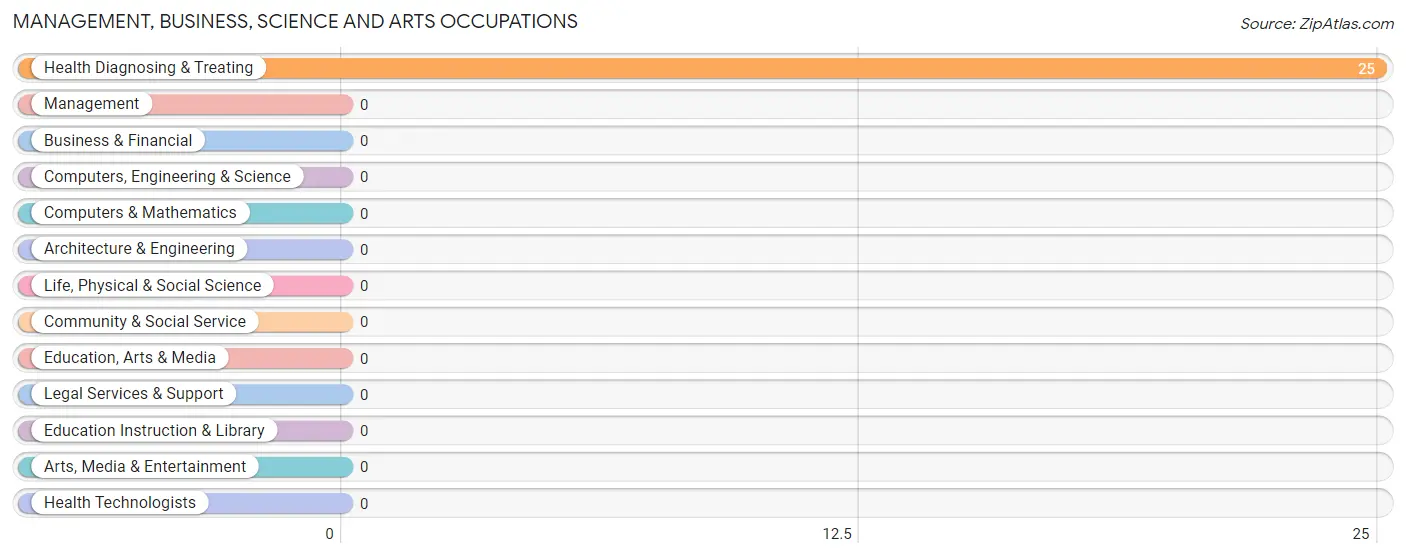
Management, Business, Science and Arts Occupations by Sex
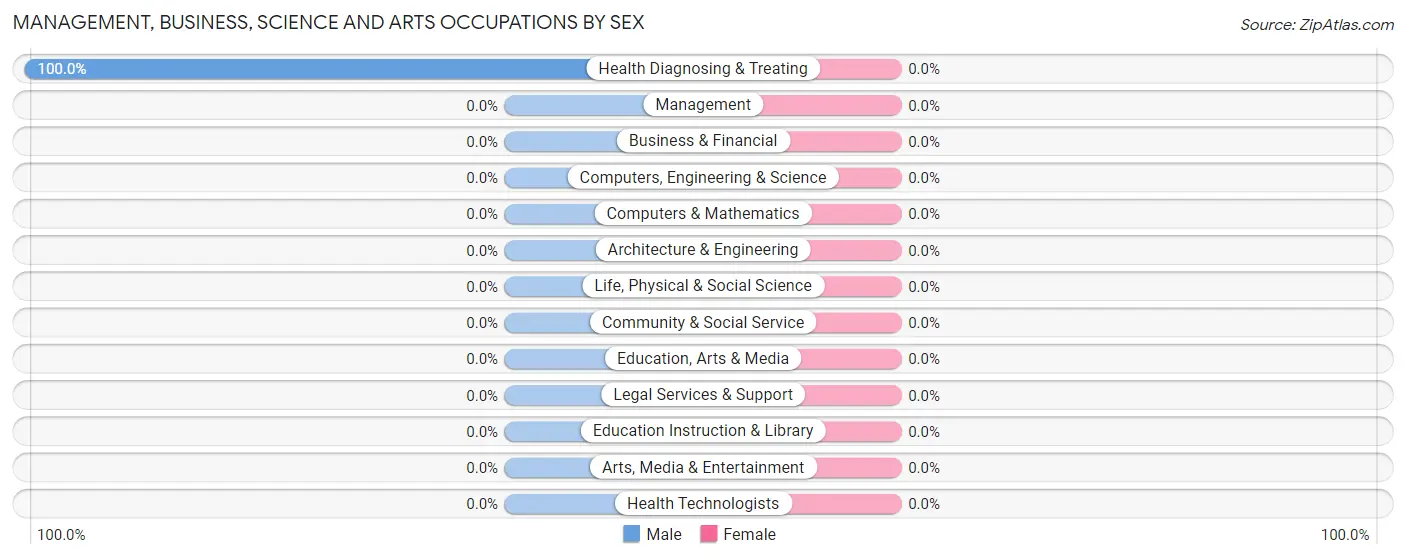
| Occupation | Male | Female |
| Management | 0 (0.0%) | 0 (0.0%) |
| Business & Financial | 0 (0.0%) | 0 (0.0%) |
| Computers, Engineering & Science | 0 (0.0%) | 0 (0.0%) |
| Computers & Mathematics | 0 (0.0%) | 0 (0.0%) |
| Architecture & Engineering | 0 (0.0%) | 0 (0.0%) |
| Life, Physical & Social Science | 0 (0.0%) | 0 (0.0%) |
| Community & Social Service | 0 (0.0%) | 0 (0.0%) |
| Education, Arts & Media | 0 (0.0%) | 0 (0.0%) |
| Legal Services & Support | 0 (0.0%) | 0 (0.0%) |
| Education Instruction & Library | 0 (0.0%) | 0 (0.0%) |
| Arts, Media & Entertainment | 0 (0.0%) | 0 (0.0%) |
| Health Diagnosing & Treating | 25 (100.0%) | 0 (0.0%) |
| Health Technologists | 0 (0.0%) | 0 (0.0%) |
| Total (Category) | 25 (100.0%) | 0 (0.0%) |
| Total (Overall) | 103 (72.0%) | 40 (28.0%) |
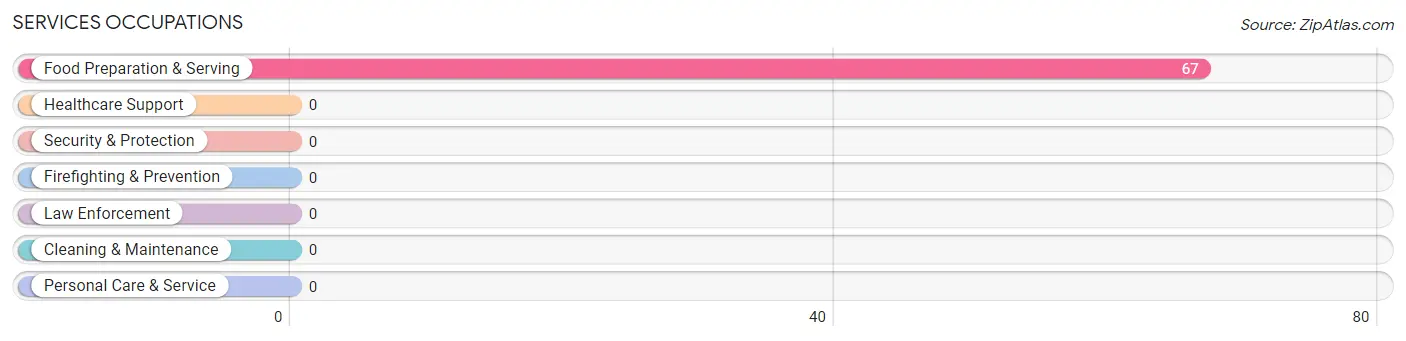
Services Occupations
The most common Services occupations in Pajonal are , and Food Preparation & Serving (67 | 46.9%).
Services Occupations by Sex
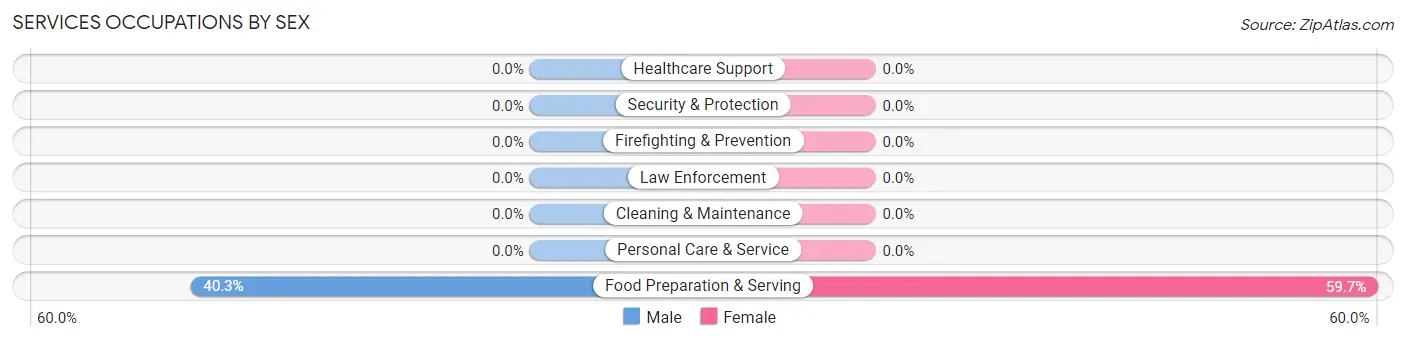
| Occupation | Male | Female |
| Healthcare Support | 0 (0.0%) | 0 (0.0%) |
| Security & Protection | 0 (0.0%) | 0 (0.0%) |
| Firefighting & Prevention | 0 (0.0%) | 0 (0.0%) |
| Law Enforcement | 0 (0.0%) | 0 (0.0%) |
| Food Preparation & Serving | 27 (40.3%) | 40 (59.7%) |
| Cleaning & Maintenance | 0 (0.0%) | 0 (0.0%) |
| Personal Care & Service | 0 (0.0%) | 0 (0.0%) |
| Total (Category) | 27 (40.3%) | 40 (59.7%) |
| Total (Overall) | 103 (72.0%) | 40 (28.0%) |
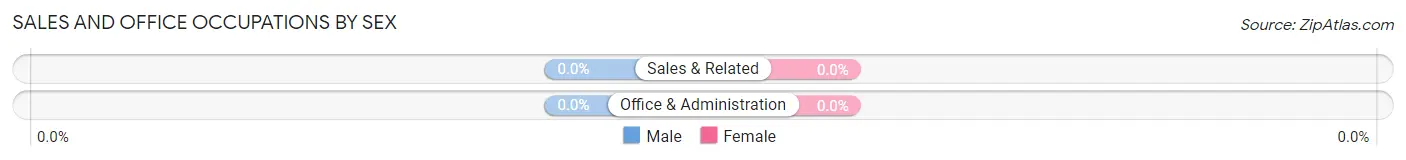
Sales and Office Occupations

Sales and Office Occupations by Sex
| Occupation | Male | Female |
| Sales & Related | 0 (0.0%) | 0 (0.0%) |
| Office & Administration | 0 (0.0%) | 0 (0.0%) |
| Total (Category) | 0 (0.0%) | 0 (0.0%) |
| Total (Overall) | 103 (72.0%) | 40 (28.0%) |
Natural Resources, Construction and Maintenance Occupations
The most common Natural Resources, Construction and Maintenance occupations in Pajonal are , and Construction & Extraction (38 | 26.6%).
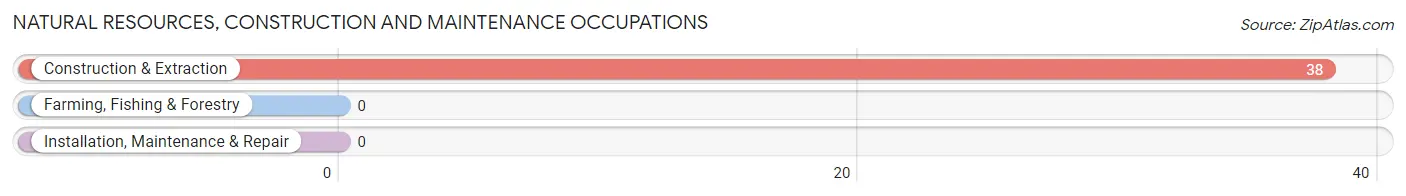
Natural Resources, Construction and Maintenance Occupations by Sex

| Occupation | Male | Female |
| Farming, Fishing & Forestry | 0 (0.0%) | 0 (0.0%) |
| Construction & Extraction | 38 (100.0%) | 0 (0.0%) |
| Installation, Maintenance & Repair | 0 (0.0%) | 0 (0.0%) |
| Total (Category) | 38 (100.0%) | 0 (0.0%) |
| Total (Overall) | 103 (72.0%) | 40 (28.0%) |
Production, Transportation and Moving Occupations
The most common Production, Transportation and Moving occupations in Pajonal are , and Transportation (13 | 9.1%).
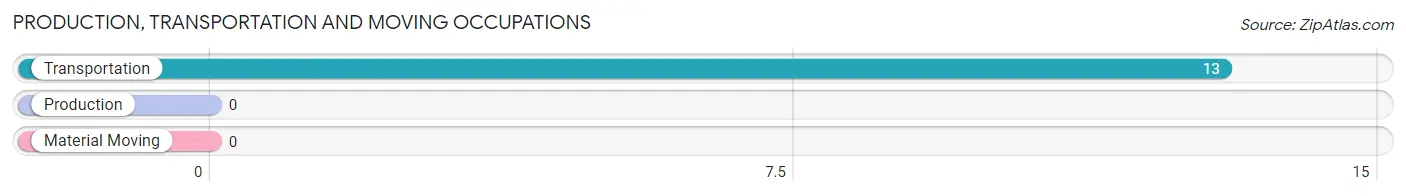
Production, Transportation and Moving Occupations by Sex
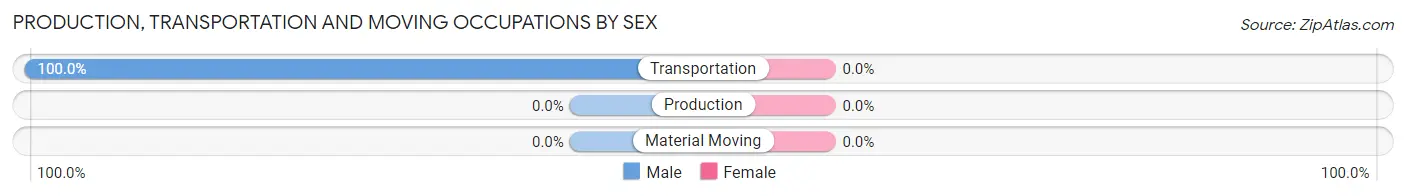
| Occupation | Male | Female |
| Production | 0 (0.0%) | 0 (0.0%) |
| Transportation | 13 (100.0%) | 0 (0.0%) |
| Material Moving | 0 (0.0%) | 0 (0.0%) |
| Total (Category) | 13 (100.0%) | 0 (0.0%) |
| Total (Overall) | 103 (72.0%) | 40 (28.0%) |
Employment Industries by Sex in Pajonal
Employment Industries in Pajonal
The major employment industries in Pajonal include Accommodation & Food Services (67 | 46.9%), Utilities (38 | 26.6%), Health Care & Social Assistance (25 | 17.5%), and Transportation & Warehousing (13 | 9.1%).
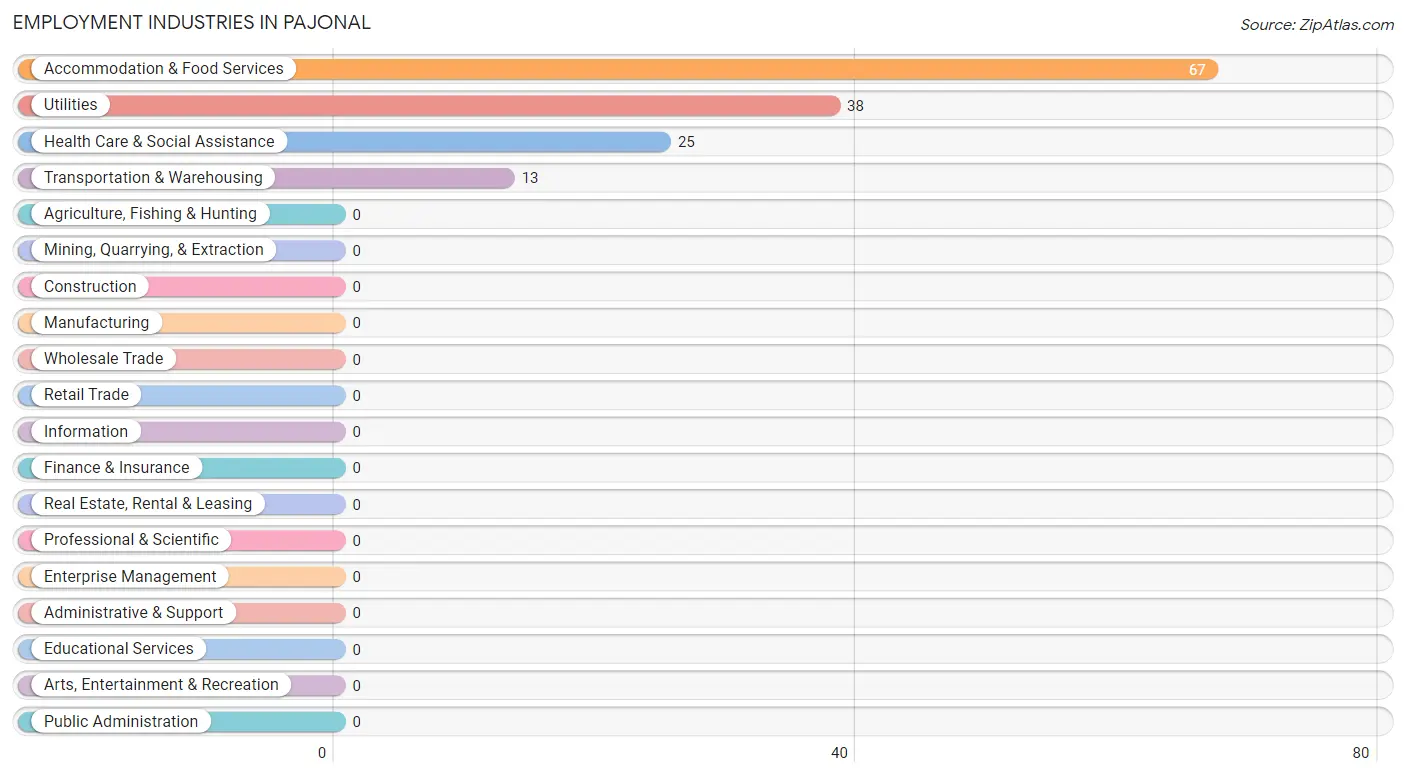
Employment Industries by Sex in Pajonal
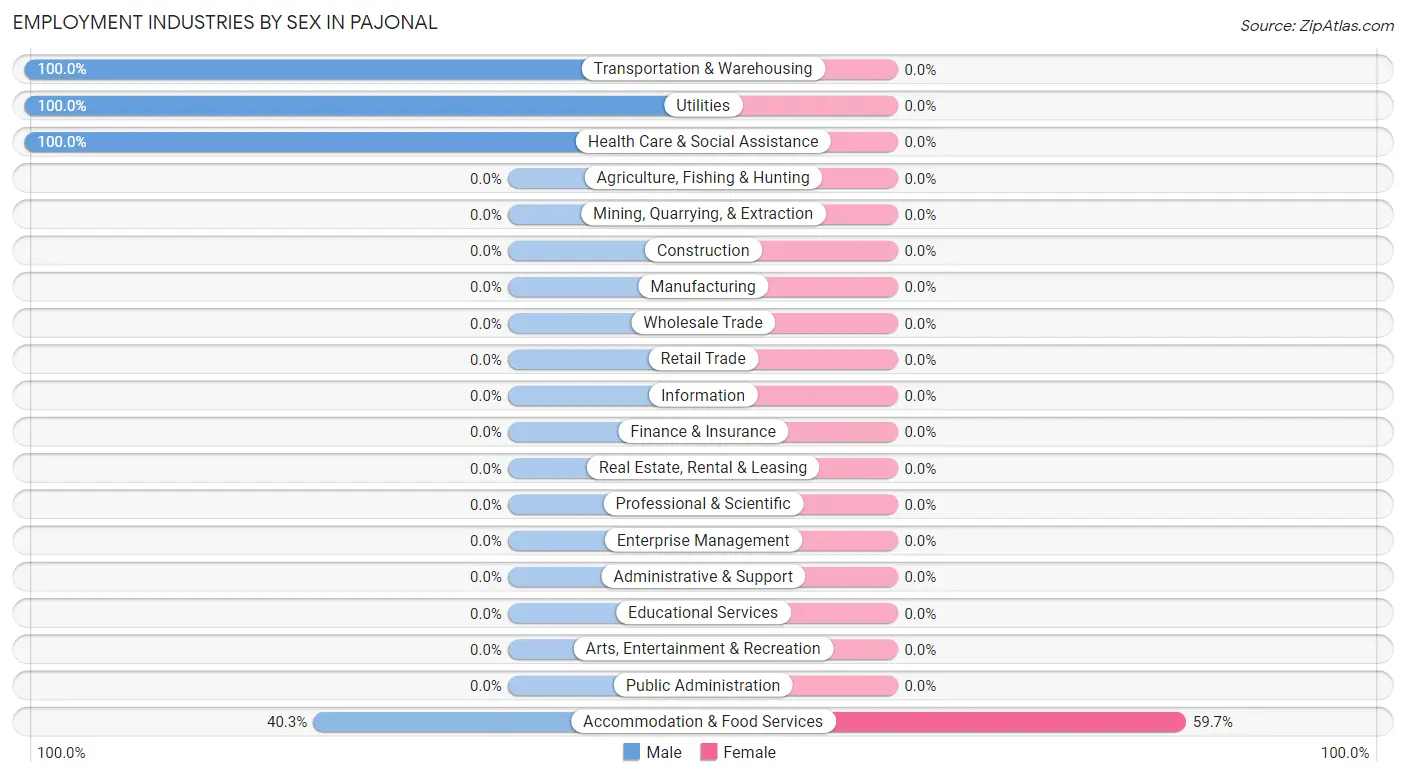
| Industry | Male | Female |
| Agriculture, Fishing & Hunting | 0 (0.0%) | 0 (0.0%) |
| Mining, Quarrying, & Extraction | 0 (0.0%) | 0 (0.0%) |
| Construction | 0 (0.0%) | 0 (0.0%) |
| Manufacturing | 0 (0.0%) | 0 (0.0%) |
| Wholesale Trade | 0 (0.0%) | 0 (0.0%) |
| Retail Trade | 0 (0.0%) | 0 (0.0%) |
| Transportation & Warehousing | 13 (100.0%) | 0 (0.0%) |
| Utilities | 38 (100.0%) | 0 (0.0%) |
| Information | 0 (0.0%) | 0 (0.0%) |
| Finance & Insurance | 0 (0.0%) | 0 (0.0%) |
| Real Estate, Rental & Leasing | 0 (0.0%) | 0 (0.0%) |
| Professional & Scientific | 0 (0.0%) | 0 (0.0%) |
| Enterprise Management | 0 (0.0%) | 0 (0.0%) |
| Administrative & Support | 0 (0.0%) | 0 (0.0%) |
| Educational Services | 0 (0.0%) | 0 (0.0%) |
| Health Care & Social Assistance | 25 (100.0%) | 0 (0.0%) |
| Arts, Entertainment & Recreation | 0 (0.0%) | 0 (0.0%) |
| Accommodation & Food Services | 27 (40.3%) | 40 (59.7%) |
| Public Administration | 0 (0.0%) | 0 (0.0%) |
| Total | 103 (72.0%) | 40 (28.0%) |
Education in Pajonal
School Enrollment in Pajonal
The most common levels of schooling among the 69 students in Pajonal are graduate / professional (25 | 36.2%), nursery / preschool (23 | 33.3%), and high school (21 | 30.4%).
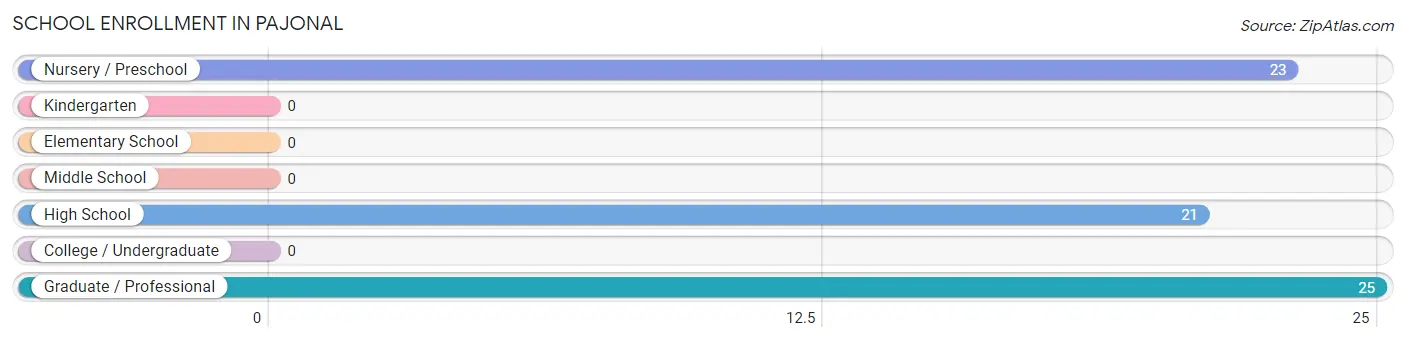
| School Level | # Students | % Students |
| Nursery / Preschool | 23 | 33.3% |
| Kindergarten | 0 | 0.0% |
| Elementary School | 0 | 0.0% |
| Middle School | 0 | 0.0% |
| High School | 21 | 30.4% |
| College / Undergraduate | 0 | 0.0% |
| Graduate / Professional | 25 | 36.2% |
| Total | 69 | 100.0% |
School Enrollment by Age by Funding Source in Pajonal
Out of a total of 69 students who are enrolled in schools in Pajonal, 25 (36.2%) attend a private institution, while the remaining 44 (63.8%) are enrolled in public schools. The age group of 25 to 34 year olds has the highest likelihood of being enrolled in private schools, with 25 (100.0% in the age bracket) enrolled. Conversely, the age group of 3 to 4 year olds has the lowest likelihood of being enrolled in a private school, with 23 (100.0% in the age bracket) attending a public institution.
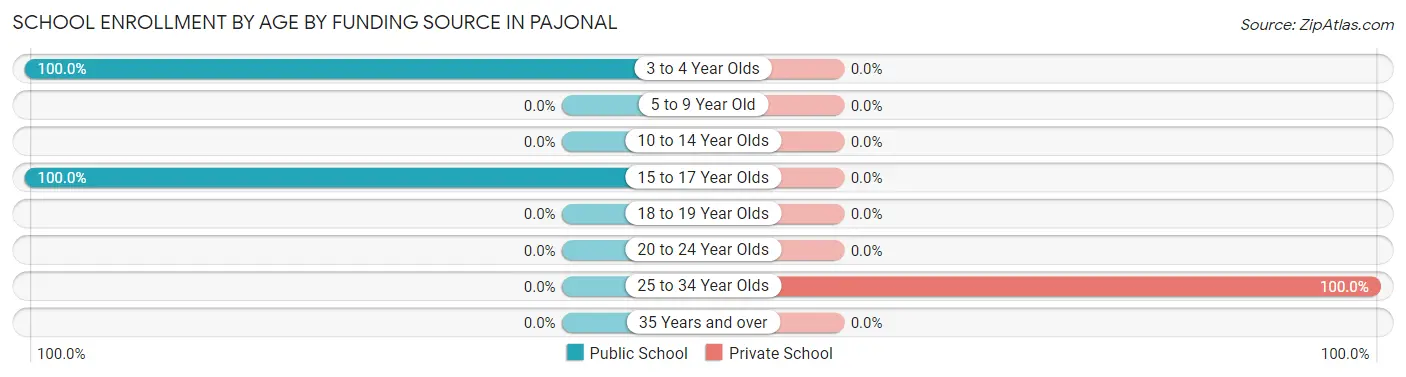
| Age Bracket | Public School | Private School |
| 3 to 4 Year Olds | 23 (100.0%) | 0 (0.0%) |
| 5 to 9 Year Old | 0 (0.0%) | 0 (0.0%) |
| 10 to 14 Year Olds | 0 (0.0%) | 0 (0.0%) |
| 15 to 17 Year Olds | 21 (100.0%) | 0 (0.0%) |
| 18 to 19 Year Olds | 0 (0.0%) | 0 (0.0%) |
| 20 to 24 Year Olds | 0 (0.0%) | 0 (0.0%) |
| 25 to 34 Year Olds | 0 (0.0%) | 25 (100.0%) |
| 35 Years and over | 0 (0.0%) | 0 (0.0%) |
| Total | 44 (63.8%) | 25 (36.2%) |
Educational Attainment by Field of Study in Pajonal
, and psychology (25 | 100.0%) are the most common fields of study among 25 individuals in Pajonal who have obtained a bachelor's degree or higher.
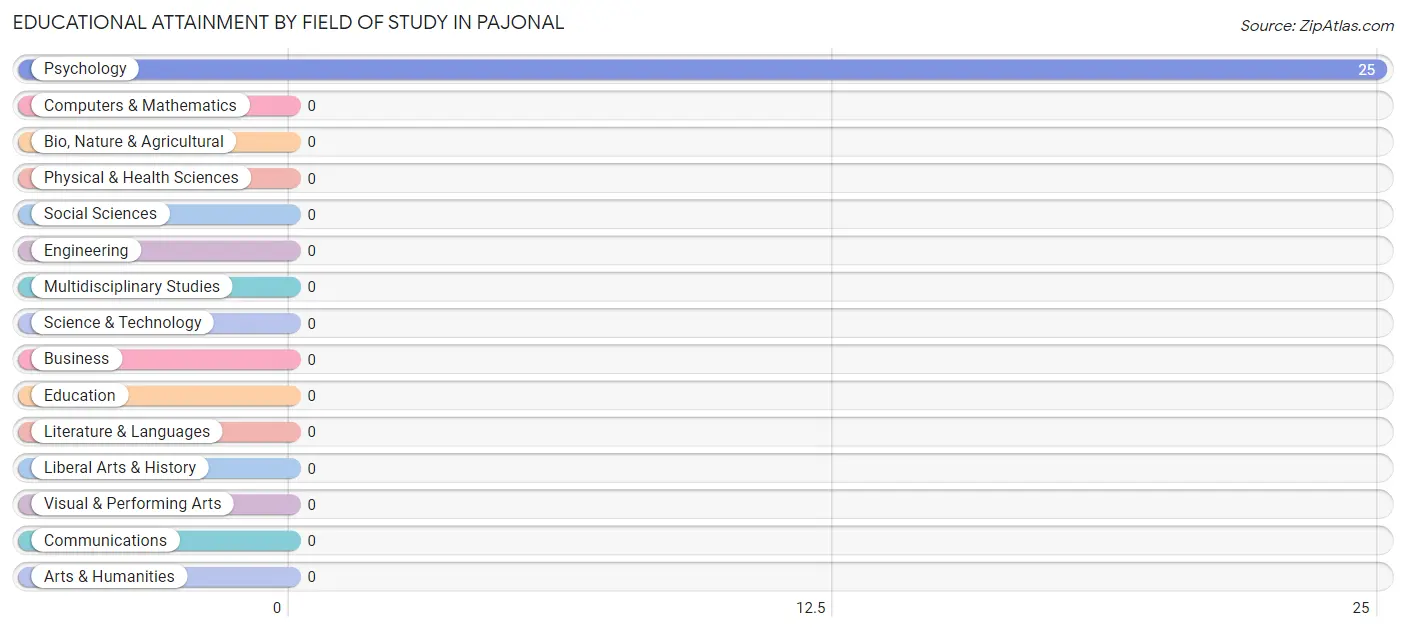
| Field of Study | # Graduates | % Graduates |
| Computers & Mathematics | 0 | 0.0% |
| Bio, Nature & Agricultural | 0 | 0.0% |
| Physical & Health Sciences | 0 | 0.0% |
| Psychology | 25 | 100.0% |
| Social Sciences | 0 | 0.0% |
| Engineering | 0 | 0.0% |
| Multidisciplinary Studies | 0 | 0.0% |
| Science & Technology | 0 | 0.0% |
| Business | 0 | 0.0% |
| Education | 0 | 0.0% |
| Literature & Languages | 0 | 0.0% |
| Liberal Arts & History | 0 | 0.0% |
| Visual & Performing Arts | 0 | 0.0% |
| Communications | 0 | 0.0% |
| Arts & Humanities | 0 | 0.0% |
| Total | 25 | 100.0% |
Transportation & Commute in Pajonal
Vehicle Availability by Sex in Pajonal
The most prevalent vehicle ownership categories in Pajonal are males with 3 vehicles (103, accounting for 100.0%) and females with 3 vehicles (40, making up 257.5%).
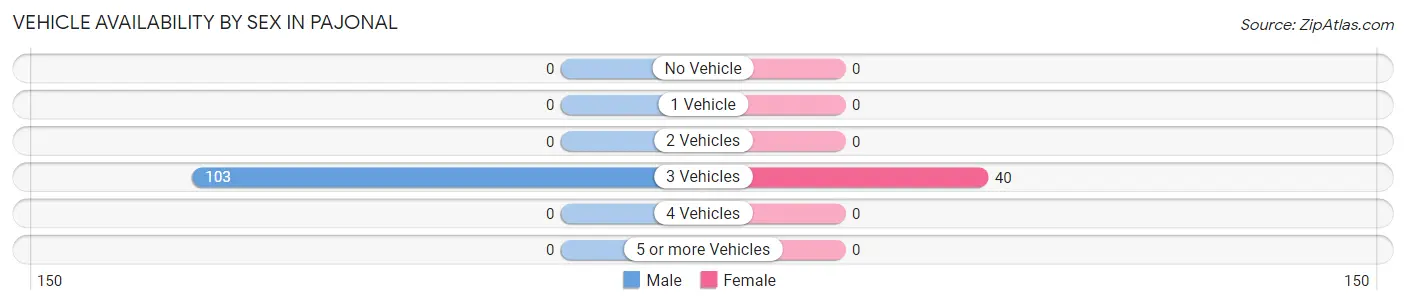
| Vehicles Available | Male | Female |
| No Vehicle | 0 (0.0%) | 0 (0.0%) |
| 1 Vehicle | 0 (0.0%) | 0 (0.0%) |
| 2 Vehicles | 0 (0.0%) | 0 (0.0%) |
| 3 Vehicles | 103 (100.0%) | 40 (100.0%) |
| 4 Vehicles | 0 (0.0%) | 0 (0.0%) |
| 5 or more Vehicles | 0 (0.0%) | 0 (0.0%) |
| Total | 103 (100.0%) | 40 (100.0%) |
Commute Time in Pajonal
The most frequently occuring commute durations in Pajonal are 20 to 24 minutes (40 commuters, 28.0%), 60 to 89 minutes (38 commuters, 26.6%), and 25 to 29 minutes (27 commuters, 18.9%).
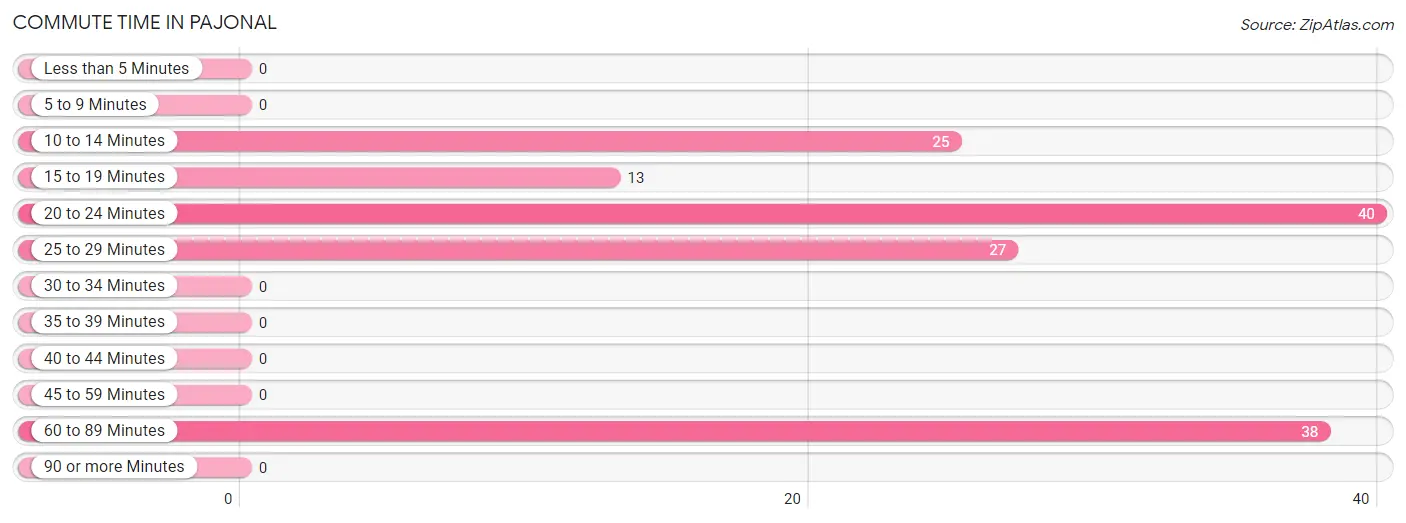
| Commute Time | # Commuters | % Commuters |
| Less than 5 Minutes | 0 | 0.0% |
| 5 to 9 Minutes | 0 | 0.0% |
| 10 to 14 Minutes | 25 | 17.5% |
| 15 to 19 Minutes | 13 | 9.1% |
| 20 to 24 Minutes | 40 | 28.0% |
| 25 to 29 Minutes | 27 | 18.9% |
| 30 to 34 Minutes | 0 | 0.0% |
| 35 to 39 Minutes | 0 | 0.0% |
| 40 to 44 Minutes | 0 | 0.0% |
| 45 to 59 Minutes | 0 | 0.0% |
| 60 to 89 Minutes | 38 | 26.6% |
| 90 or more Minutes | 0 | 0.0% |
Commute Time by Sex in Pajonal
The most common commute times in Pajonal are 60 to 89 minutes (38 commuters, 36.9%) for males and 20 to 24 minutes (40 commuters, 100.0%) for females.
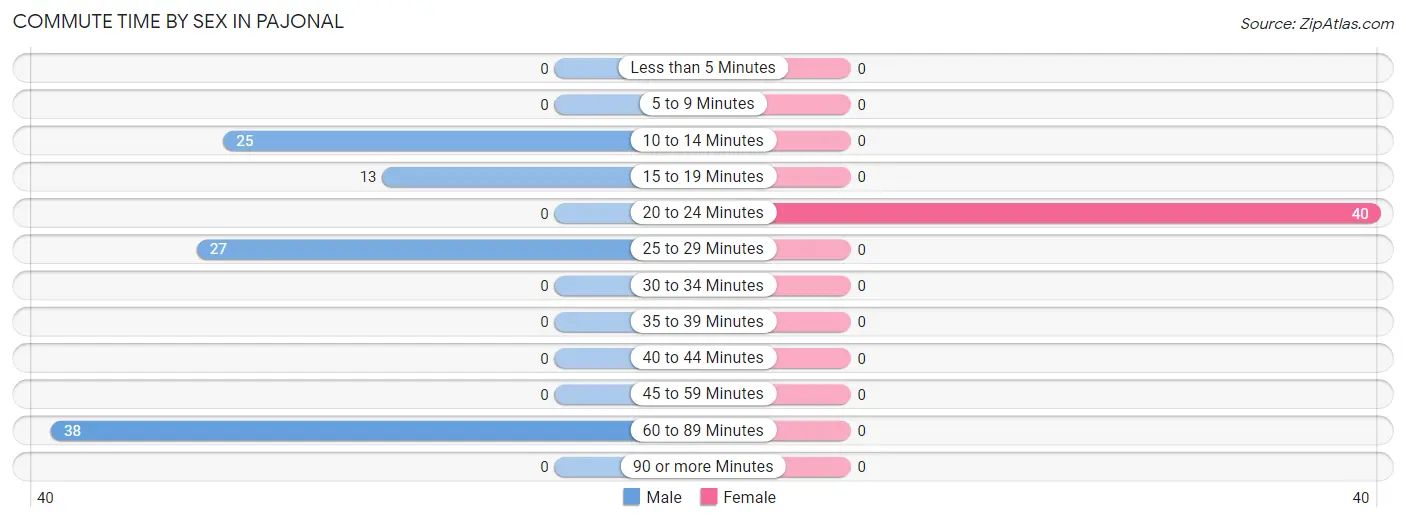
| Commute Time | Male | Female |
| Less than 5 Minutes | 0 (0.0%) | 0 (0.0%) |
| 5 to 9 Minutes | 0 (0.0%) | 0 (0.0%) |
| 10 to 14 Minutes | 25 (24.3%) | 0 (0.0%) |
| 15 to 19 Minutes | 13 (12.6%) | 0 (0.0%) |
| 20 to 24 Minutes | 0 (0.0%) | 40 (100.0%) |
| 25 to 29 Minutes | 27 (26.2%) | 0 (0.0%) |
| 30 to 34 Minutes | 0 (0.0%) | 0 (0.0%) |
| 35 to 39 Minutes | 0 (0.0%) | 0 (0.0%) |
| 40 to 44 Minutes | 0 (0.0%) | 0 (0.0%) |
| 45 to 59 Minutes | 0 (0.0%) | 0 (0.0%) |
| 60 to 89 Minutes | 38 (36.9%) | 0 (0.0%) |
| 90 or more Minutes | 0 (0.0%) | 0 (0.0%) |
Time of Departure to Work by Sex in Pajonal
The most frequent times of departure to work in Pajonal are 6:30 AM to 6:59 AM (63, 61.2%) for males and 4:00 PM to 11:59 PM (40, 100.0%) for females.
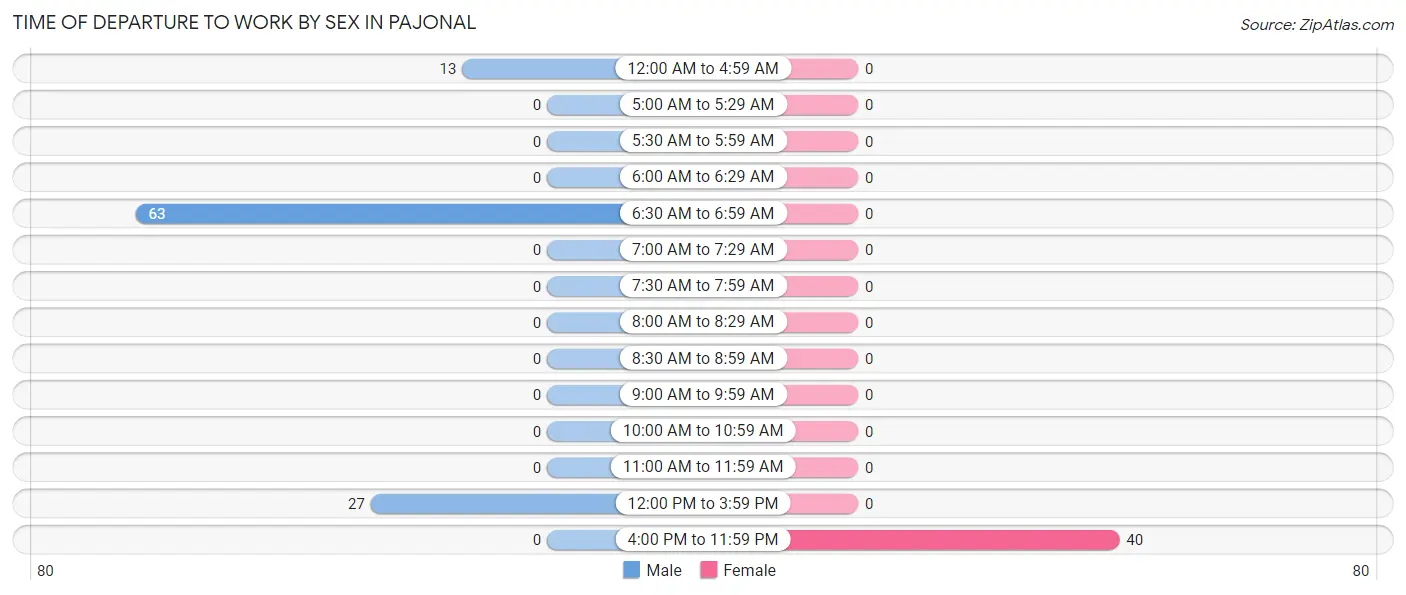
| Time of Departure | Male | Female |
| 12:00 AM to 4:59 AM | 13 (12.6%) | 0 (0.0%) |
| 5:00 AM to 5:29 AM | 0 (0.0%) | 0 (0.0%) |
| 5:30 AM to 5:59 AM | 0 (0.0%) | 0 (0.0%) |
| 6:00 AM to 6:29 AM | 0 (0.0%) | 0 (0.0%) |
| 6:30 AM to 6:59 AM | 63 (61.2%) | 0 (0.0%) |
| 7:00 AM to 7:29 AM | 0 (0.0%) | 0 (0.0%) |
| 7:30 AM to 7:59 AM | 0 (0.0%) | 0 (0.0%) |
| 8:00 AM to 8:29 AM | 0 (0.0%) | 0 (0.0%) |
| 8:30 AM to 8:59 AM | 0 (0.0%) | 0 (0.0%) |
| 9:00 AM to 9:59 AM | 0 (0.0%) | 0 (0.0%) |
| 10:00 AM to 10:59 AM | 0 (0.0%) | 0 (0.0%) |
| 11:00 AM to 11:59 AM | 0 (0.0%) | 0 (0.0%) |
| 12:00 PM to 3:59 PM | 27 (26.2%) | 0 (0.0%) |
| 4:00 PM to 11:59 PM | 0 (0.0%) | 40 (100.0%) |
| Total | 103 (100.0%) | 40 (100.0%) |
Housing Occupancy in Pajonal
Occupancy by Ownership in Pajonal
Of the total 213 dwellings in Pajonal, owner-occupied units account for 181 (85.0%), while renter-occupied units make up 32 (15.0%).
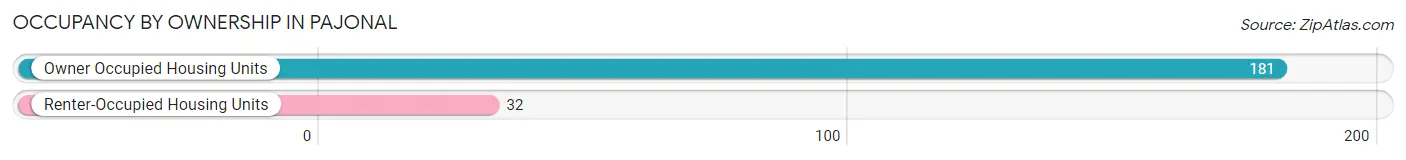
| Occupancy | # Housing Units | % Housing Units |
| Owner Occupied Housing Units | 181 | 85.0% |
| Renter-Occupied Housing Units | 32 | 15.0% |
| Total Occupied Housing Units | 213 | 100.0% |
Occupancy by Household Size in Pajonal
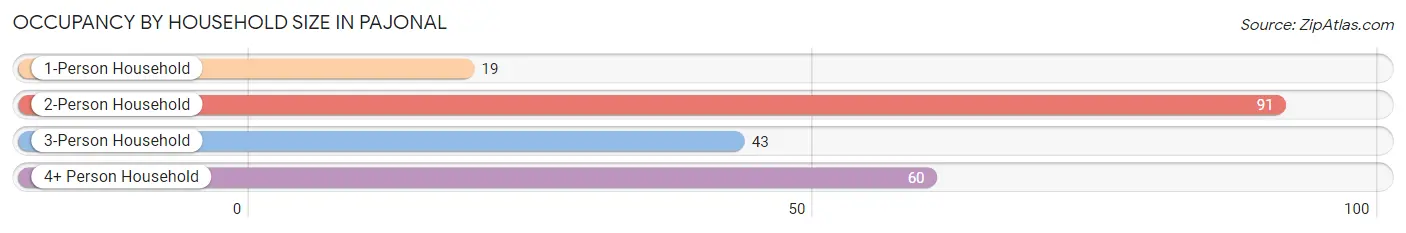
| Household Size | # Housing Units | % Housing Units |
| 1-Person Household | 19 | 8.9% |
| 2-Person Household | 91 | 42.7% |
| 3-Person Household | 43 | 20.2% |
| 4+ Person Household | 60 | 28.2% |
| Total Housing Units | 213 | 100.0% |
Occupancy by Ownership by Household Size in Pajonal
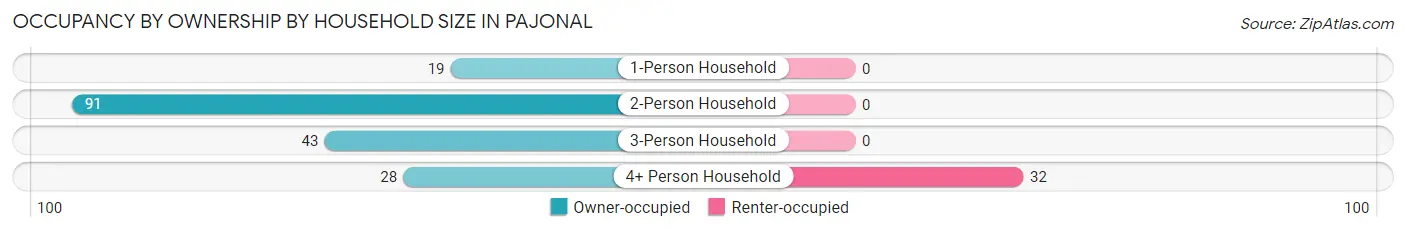
| Household Size | Owner-occupied | Renter-occupied |
| 1-Person Household | 19 (100.0%) | 0 (0.0%) |
| 2-Person Household | 91 (100.0%) | 0 (0.0%) |
| 3-Person Household | 43 (100.0%) | 0 (0.0%) |
| 4+ Person Household | 28 (46.7%) | 32 (53.3%) |
| Total Housing Units | 181 (85.0%) | 32 (15.0%) |
Occupancy by Educational Attainment in Pajonal
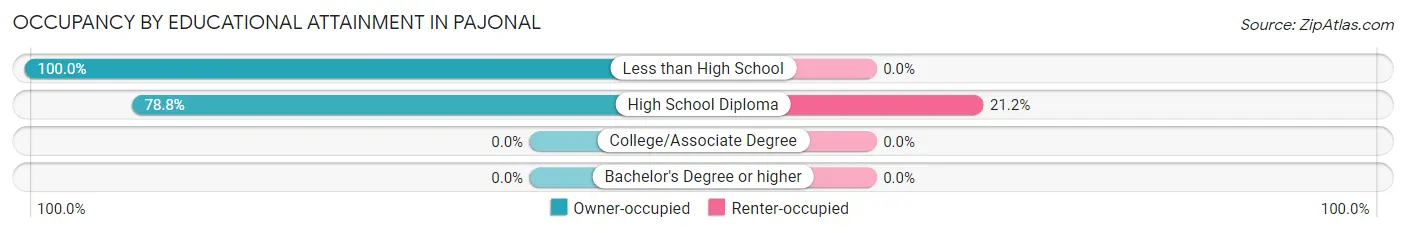
| Household Size | Owner-occupied | Renter-occupied |
| Less than High School | 62 (100.0%) | 0 (0.0%) |
| High School Diploma | 119 (78.8%) | 32 (21.2%) |
| College/Associate Degree | 0 (0.0%) | 0 (0.0%) |
| Bachelor's Degree or higher | 0 (0.0%) | 0 (0.0%) |
Occupancy by Age of Householder in Pajonal
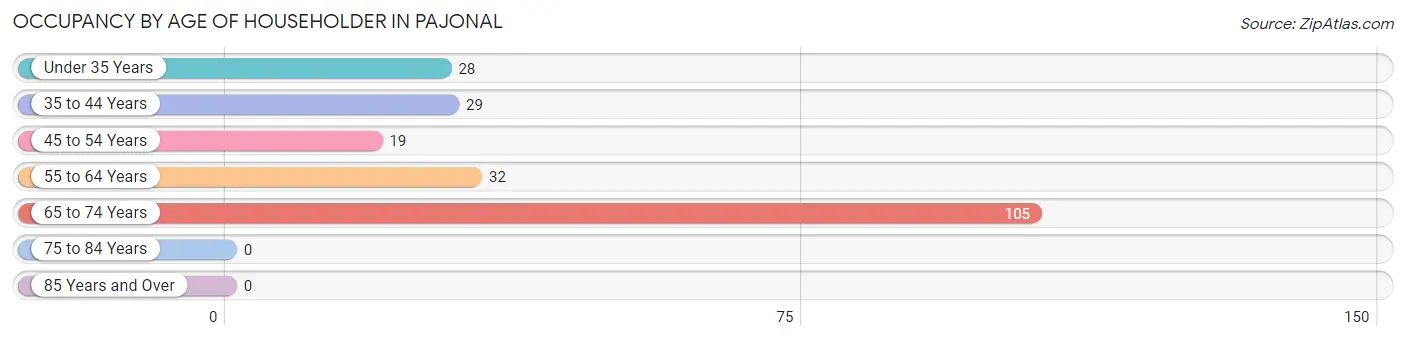
| Age Bracket | # Households | % Households |
| Under 35 Years | 28 | 13.2% |
| 35 to 44 Years | 29 | 13.6% |
| 45 to 54 Years | 19 | 8.9% |
| 55 to 64 Years | 32 | 15.0% |
| 65 to 74 Years | 105 | 49.3% |
| 75 to 84 Years | 0 | 0.0% |
| 85 Years and Over | 0 | 0.0% |
| Total | 213 | 100.0% |
Housing Finances in Pajonal
Median Income by Occupancy in Pajonal
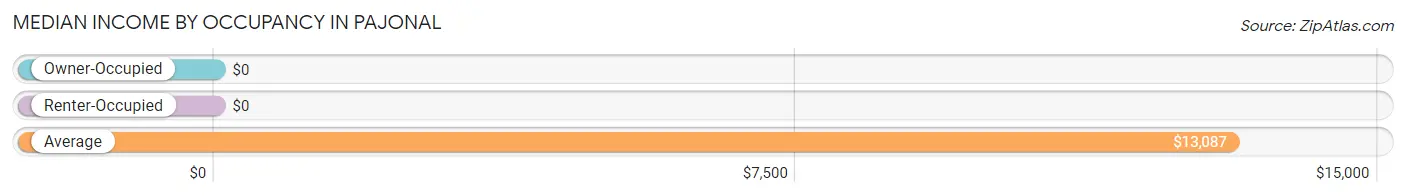
| Occupancy Type | # Households | Median Income |
| Owner-Occupied | 181 (85.0%) | $0 |
| Renter-Occupied | 32 (15.0%) | $0 |
| Average | 213 (100.0%) | $13,087 |
Occupancy by Householder Income Bracket in Pajonal

| Income Bracket | Owner-occupied | Renter-occupied |
| Less than $5,000 | 70 (38.7%) | 0 (0.0%) |
| $5,000 to $9,999 | 25 (13.8%) | 0 (0.0%) |
| $10,000 to $14,999 | 49 (27.1%) | 0 (0.0%) |
| $15,000 to $19,999 | 23 (12.7%) | 0 (0.0%) |
| $20,000 to $24,999 | 0 (0.0%) | 0 (0.0%) |
| $25,000 to $34,999 | 0 (0.0%) | 0 (0.0%) |
| $35,000 to $49,999 | 0 (0.0%) | 32 (100.0%) |
| $50,000 to $74,999 | 14 (7.7%) | 0 (0.0%) |
| $75,000 to $99,999 | 0 (0.0%) | 0 (0.0%) |
| $100,000 to $149,999 | 0 (0.0%) | 0 (0.0%) |
| $150,000 or more | 0 (0.0%) | 0 (0.0%) |
| Total | 181 (100.0%) | 32 (100.0%) |
Monthly Housing Cost Tiers in Pajonal
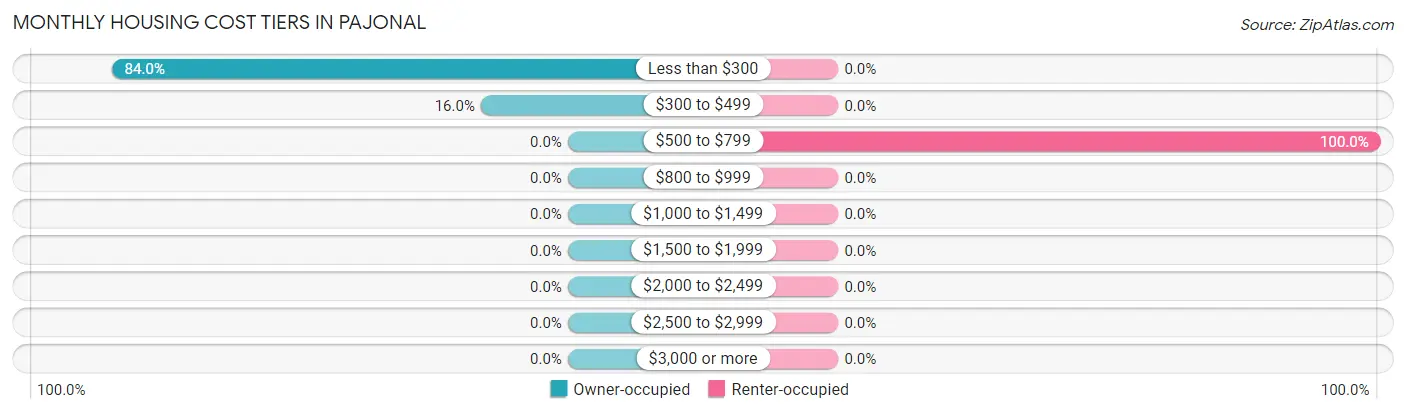
| Monthly Cost | Owner-occupied | Renter-occupied |
| Less than $300 | 152 (84.0%) | 0 (0.0%) |
| $300 to $499 | 29 (16.0%) | 0 (0.0%) |
| $500 to $799 | 0 (0.0%) | 32 (100.0%) |
| $800 to $999 | 0 (0.0%) | 0 (0.0%) |
| $1,000 to $1,499 | 0 (0.0%) | 0 (0.0%) |
| $1,500 to $1,999 | 0 (0.0%) | 0 (0.0%) |
| $2,000 to $2,499 | 0 (0.0%) | 0 (0.0%) |
| $2,500 to $2,999 | 0 (0.0%) | 0 (0.0%) |
| $3,000 or more | 0 (0.0%) | 0 (0.0%) |
| Total | 181 (100.0%) | 32 (100.0%) |
Physical Housing Characteristics in Pajonal
Housing Structures in Pajonal
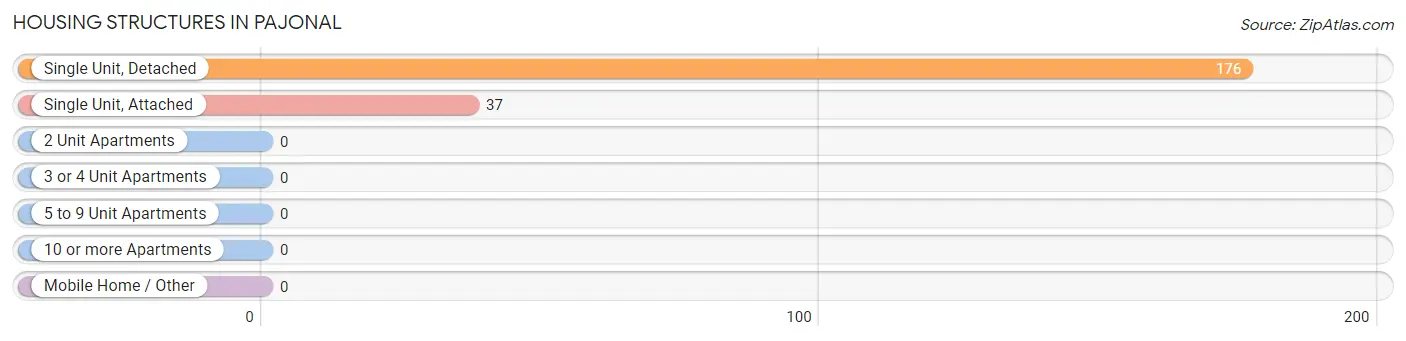
| Structure Type | # Housing Units | % Housing Units |
| Single Unit, Detached | 176 | 82.6% |
| Single Unit, Attached | 37 | 17.4% |
| 2 Unit Apartments | 0 | 0.0% |
| 3 or 4 Unit Apartments | 0 | 0.0% |
| 5 to 9 Unit Apartments | 0 | 0.0% |
| 10 or more Apartments | 0 | 0.0% |
| Mobile Home / Other | 0 | 0.0% |
| Total | 213 | 100.0% |
Housing Structures by Occupancy in Pajonal
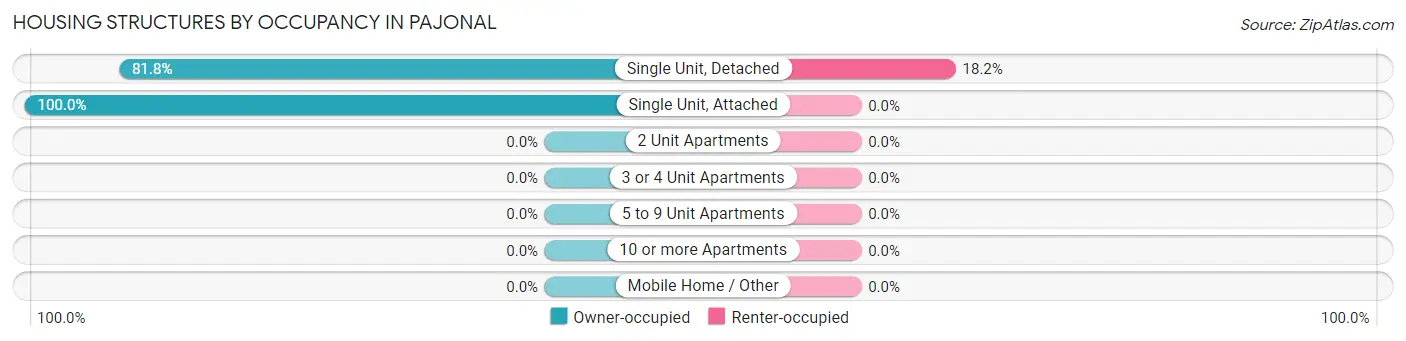
| Structure Type | Owner-occupied | Renter-occupied |
| Single Unit, Detached | 144 (81.8%) | 32 (18.2%) |
| Single Unit, Attached | 37 (100.0%) | 0 (0.0%) |
| 2 Unit Apartments | 0 (0.0%) | 0 (0.0%) |
| 3 or 4 Unit Apartments | 0 (0.0%) | 0 (0.0%) |
| 5 to 9 Unit Apartments | 0 (0.0%) | 0 (0.0%) |
| 10 or more Apartments | 0 (0.0%) | 0 (0.0%) |
| Mobile Home / Other | 0 (0.0%) | 0 (0.0%) |
| Total | 181 (85.0%) | 32 (15.0%) |
Housing Structures by Number of Rooms in Pajonal
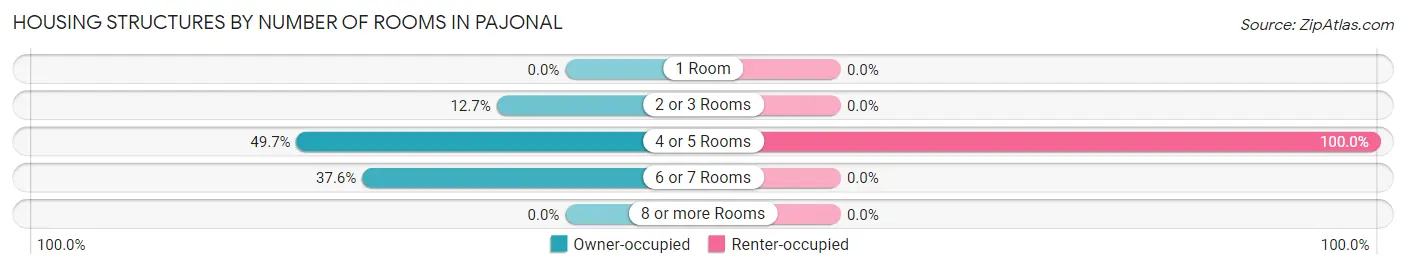
| Number of Rooms | Owner-occupied | Renter-occupied |
| 1 Room | 0 (0.0%) | 0 (0.0%) |
| 2 or 3 Rooms | 23 (12.7%) | 0 (0.0%) |
| 4 or 5 Rooms | 90 (49.7%) | 32 (100.0%) |
| 6 or 7 Rooms | 68 (37.6%) | 0 (0.0%) |
| 8 or more Rooms | 0 (0.0%) | 0 (0.0%) |
| Total | 181 (100.0%) | 32 (100.0%) |
Housing Structure by Heating Type in Pajonal
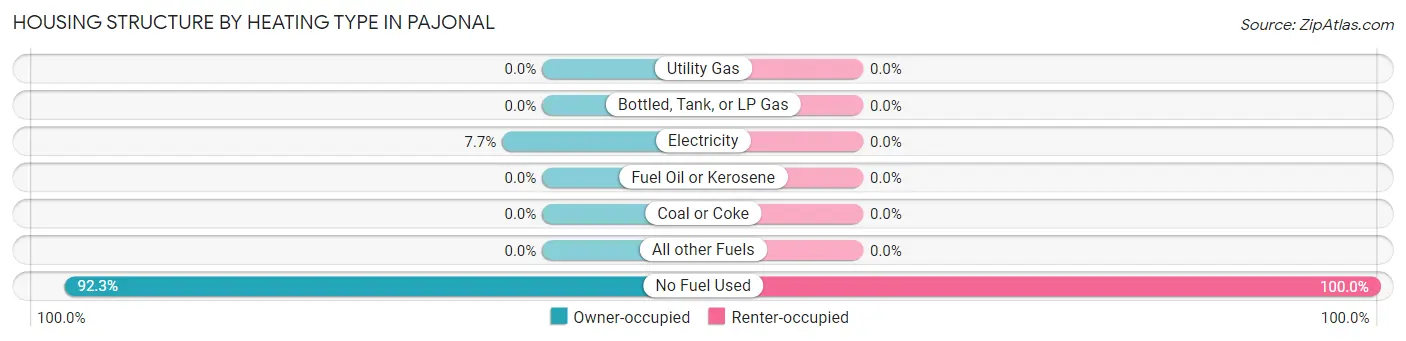
| Heating Type | Owner-occupied | Renter-occupied |
| Utility Gas | 0 (0.0%) | 0 (0.0%) |
| Bottled, Tank, or LP Gas | 0 (0.0%) | 0 (0.0%) |
| Electricity | 14 (7.7%) | 0 (0.0%) |
| Fuel Oil or Kerosene | 0 (0.0%) | 0 (0.0%) |
| Coal or Coke | 0 (0.0%) | 0 (0.0%) |
| All other Fuels | 0 (0.0%) | 0 (0.0%) |
| No Fuel Used | 167 (92.3%) | 32 (100.0%) |
| Total | 181 (100.0%) | 32 (100.0%) |
Household Vehicle Usage in Pajonal
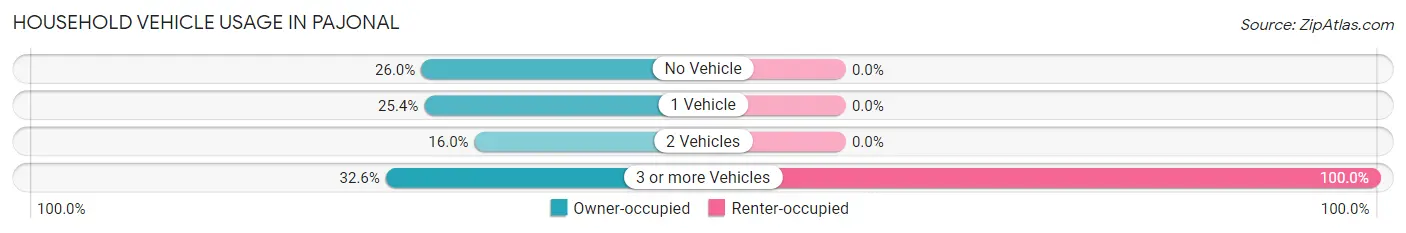
| Vehicles per Household | Owner-occupied | Renter-occupied |
| No Vehicle | 47 (26.0%) | 0 (0.0%) |
| 1 Vehicle | 46 (25.4%) | 0 (0.0%) |
| 2 Vehicles | 29 (16.0%) | 0 (0.0%) |
| 3 or more Vehicles | 59 (32.6%) | 32 (100.0%) |
| Total | 181 (100.0%) | 32 (100.0%) |
Real Estate & Mortgages in Pajonal
Real Estate and Mortgage Overview in Pajonal
| Characteristic | Without Mortgage | With Mortgage |
| Housing Units | 152 | 29 |
| Median Property Value | $83,600 | $0 |
| Median Household Income | - | - |
| Monthly Housing Costs | $128 | $0 |
| Real Estate Taxes | - | - |
Property Value by Mortgage Status in Pajonal
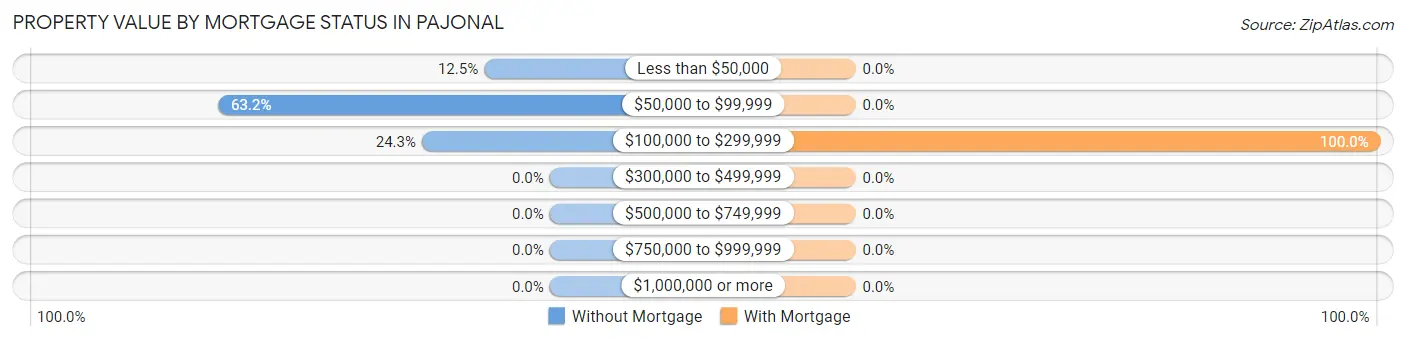
| Property Value | Without Mortgage | With Mortgage |
| Less than $50,000 | 19 (12.5%) | 0 (0.0%) |
| $50,000 to $99,999 | 96 (63.2%) | 0 (0.0%) |
| $100,000 to $299,999 | 37 (24.3%) | 29 (100.0%) |
| $300,000 to $499,999 | 0 (0.0%) | 0 (0.0%) |
| $500,000 to $749,999 | 0 (0.0%) | 0 (0.0%) |
| $750,000 to $999,999 | 0 (0.0%) | 0 (0.0%) |
| $1,000,000 or more | 0 (0.0%) | 0 (0.0%) |
| Total | 152 (100.0%) | 29 (100.0%) |
Household Income by Mortgage Status in Pajonal
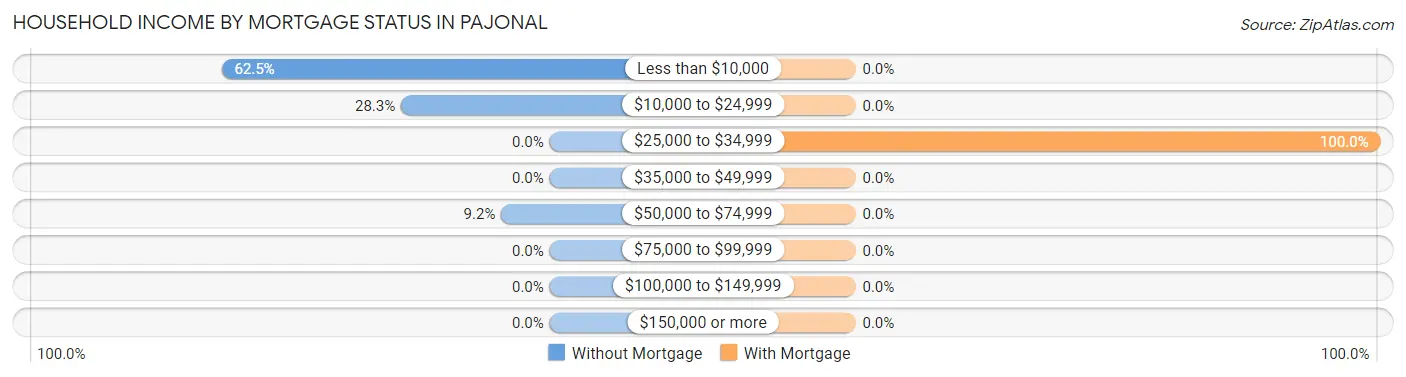
| Household Income | Without Mortgage | With Mortgage |
| Less than $10,000 | 95 (62.5%) | 0 (0.0%) |
| $10,000 to $24,999 | 43 (28.3%) | 0 (0.0%) |
| $25,000 to $34,999 | 0 (0.0%) | 29 (100.0%) |
| $35,000 to $49,999 | 0 (0.0%) | 0 (0.0%) |
| $50,000 to $74,999 | 14 (9.2%) | 0 (0.0%) |
| $75,000 to $99,999 | 0 (0.0%) | 0 (0.0%) |
| $100,000 to $149,999 | 0 (0.0%) | 0 (0.0%) |
| $150,000 or more | 0 (0.0%) | 0 (0.0%) |
| Total | 152 (100.0%) | 29 (100.0%) |
Property Value to Household Income Ratio in Pajonal
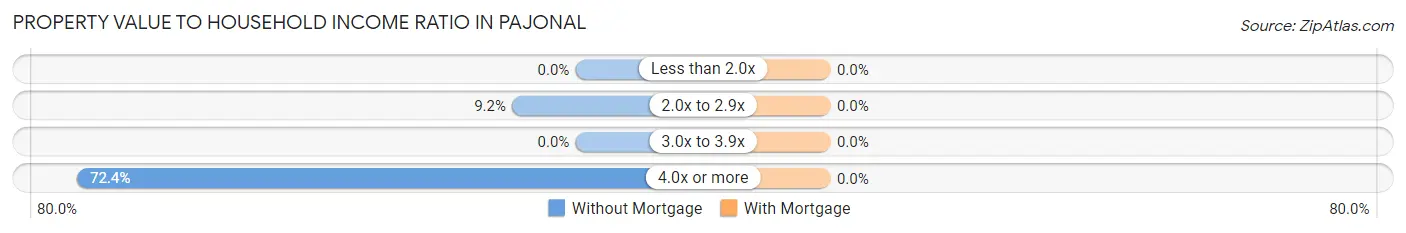
| Value-to-Income Ratio | Without Mortgage | With Mortgage |
| Less than 2.0x | 0 (0.0%) | 0 (0.0%) |
| 2.0x to 2.9x | 14 (9.2%) | 0 (0.0%) |
| 3.0x to 3.9x | 0 (0.0%) | 0 (0.0%) |
| 4.0x or more | 110 (72.4%) | 0 (0.0%) |
| Total | 152 (100.0%) | 29 (100.0%) |
Real Estate Taxes by Mortgage Status in Pajonal
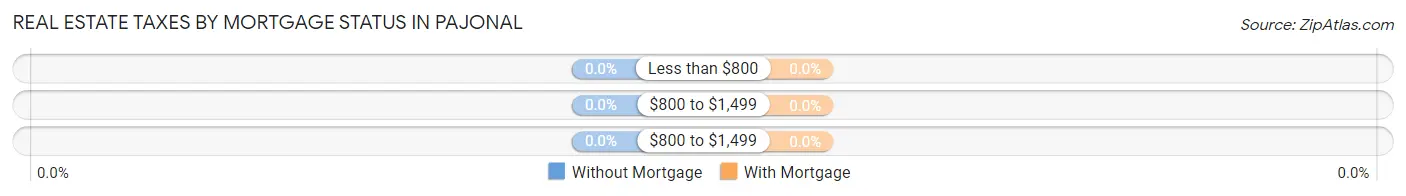
| Property Taxes | Without Mortgage | With Mortgage |
| Less than $800 | 0 (0.0%) | 0 (0.0%) |
| $800 to $1,499 | 0 (0.0%) | 0 (0.0%) |
| $800 to $1,499 | 0 (0.0%) | 0 (0.0%) |
| Total | 152 (100.0%) | 29 (100.0%) |
Health & Disability in Pajonal
Health Insurance Coverage by Age in Pajonal
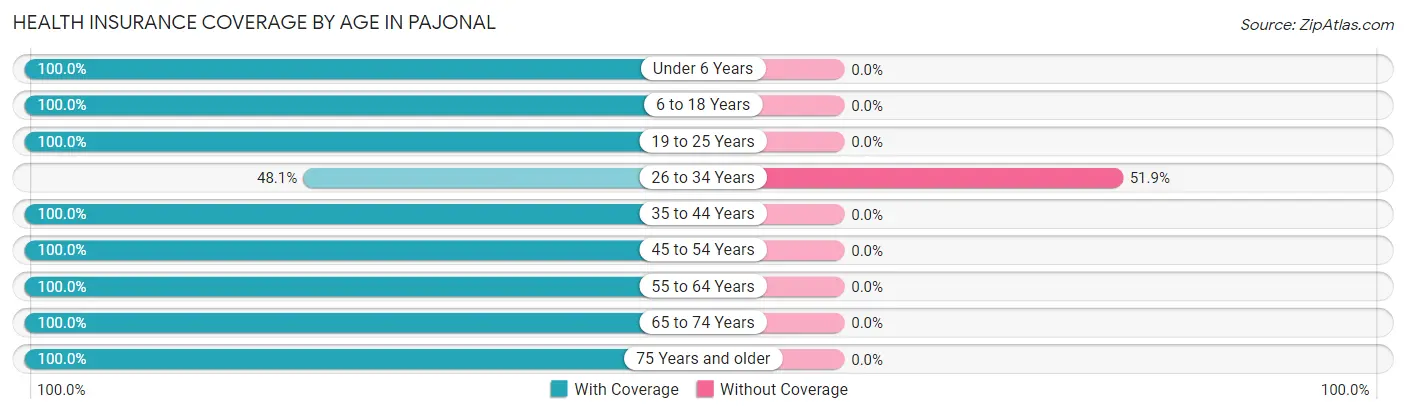
| Age Bracket | With Coverage | Without Coverage |
| Under 6 Years | 88 (100.0%) | 0 (0.0%) |
| 6 to 18 Years | 21 (100.0%) | 0 (0.0%) |
| 19 to 25 Years | 117 (100.0%) | 0 (0.0%) |
| 26 to 34 Years | 25 (48.1%) | 27 (51.9%) |
| 35 to 44 Years | 61 (100.0%) | 0 (0.0%) |
| 45 to 54 Years | 58 (100.0%) | 0 (0.0%) |
| 55 to 64 Years | 70 (100.0%) | 0 (0.0%) |
| 65 to 74 Years | 159 (100.0%) | 0 (0.0%) |
| 75 Years and older | 13 (100.0%) | 0 (0.0%) |
| Total | 612 (95.8%) | 27 (4.2%) |
Health Insurance Coverage by Citizenship Status in Pajonal
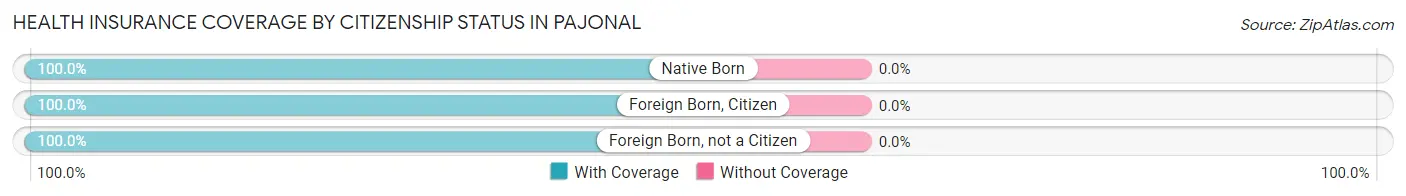
| Citizenship Status | With Coverage | Without Coverage |
| Native Born | 88 (100.0%) | 0 (0.0%) |
| Foreign Born, Citizen | 21 (100.0%) | 0 (0.0%) |
| Foreign Born, not a Citizen | 117 (100.0%) | 0 (0.0%) |
Health Insurance Coverage by Household Income in Pajonal
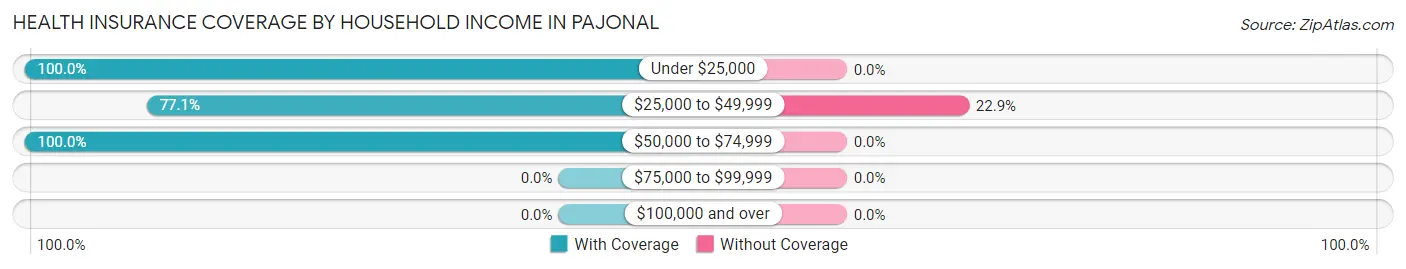
| Household Income | With Coverage | Without Coverage |
| Under $25,000 | 469 (100.0%) | 0 (0.0%) |
| $25,000 to $49,999 | 91 (77.1%) | 27 (22.9%) |
| $50,000 to $74,999 | 52 (100.0%) | 0 (0.0%) |
| $75,000 to $99,999 | 0 (0.0%) | 0 (0.0%) |
| $100,000 and over | 0 (0.0%) | 0 (0.0%) |
Public vs Private Health Insurance Coverage by Age in Pajonal
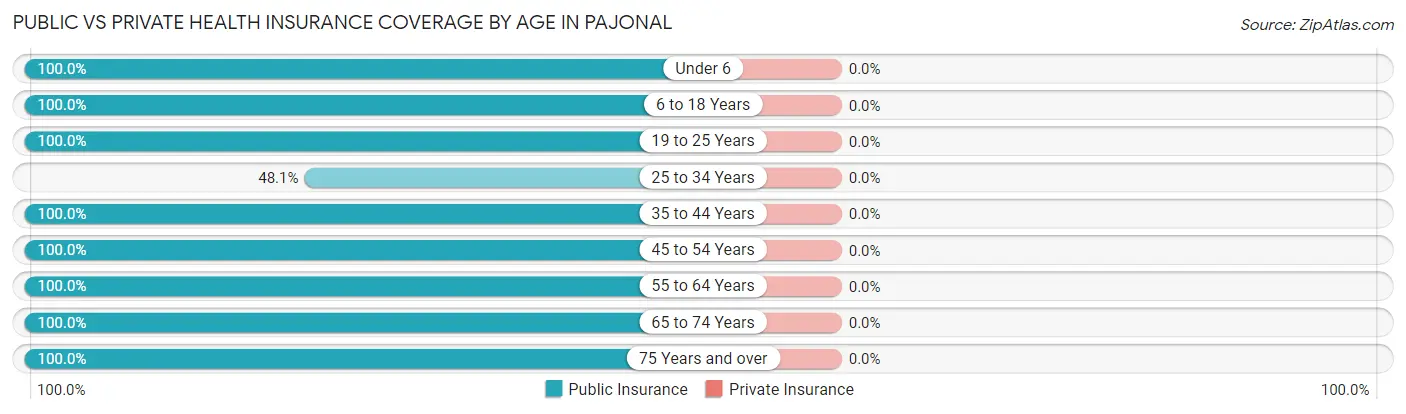
| Age Bracket | Public Insurance | Private Insurance |
| Under 6 | 88 (100.0%) | 0 (0.0%) |
| 6 to 18 Years | 21 (100.0%) | 0 (0.0%) |
| 19 to 25 Years | 117 (100.0%) | 0 (0.0%) |
| 25 to 34 Years | 25 (48.1%) | 0 (0.0%) |
| 35 to 44 Years | 61 (100.0%) | 0 (0.0%) |
| 45 to 54 Years | 58 (100.0%) | 0 (0.0%) |
| 55 to 64 Years | 70 (100.0%) | 0 (0.0%) |
| 65 to 74 Years | 159 (100.0%) | 0 (0.0%) |
| 75 Years and over | 13 (100.0%) | 0 (0.0%) |
| Total | 612 (95.8%) | 0 (0.0%) |
Disability Status by Sex by Age in Pajonal
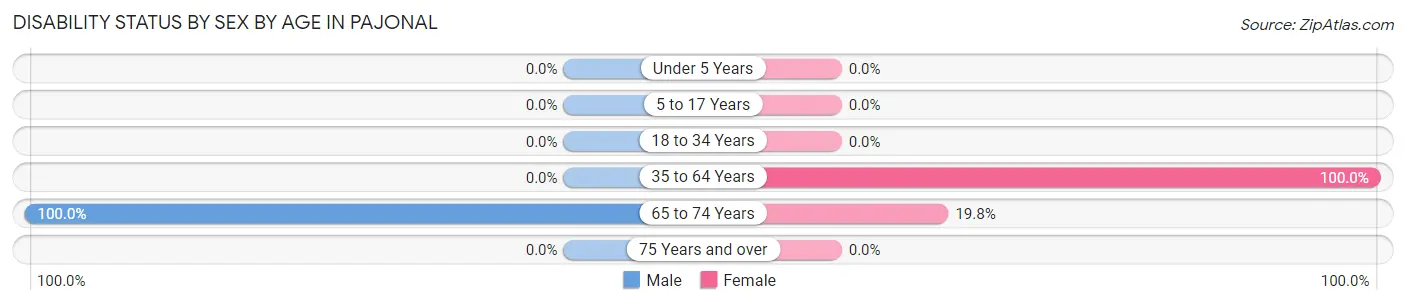
| Age Bracket | Male | Female |
| Under 5 Years | 0 (0.0%) | 0 (0.0%) |
| 5 to 17 Years | 0 (0.0%) | 0 (0.0%) |
| 18 to 34 Years | 0 (0.0%) | 0 (0.0%) |
| 35 to 64 Years | 0 (0.0%) | 48 (100.0%) |
| 65 to 74 Years | 58 (100.0%) | 20 (19.8%) |
| 75 Years and over | 0 (0.0%) | 0 (0.0%) |
Disability Class by Sex by Age in Pajonal
Disability Class: Hearing Difficulty
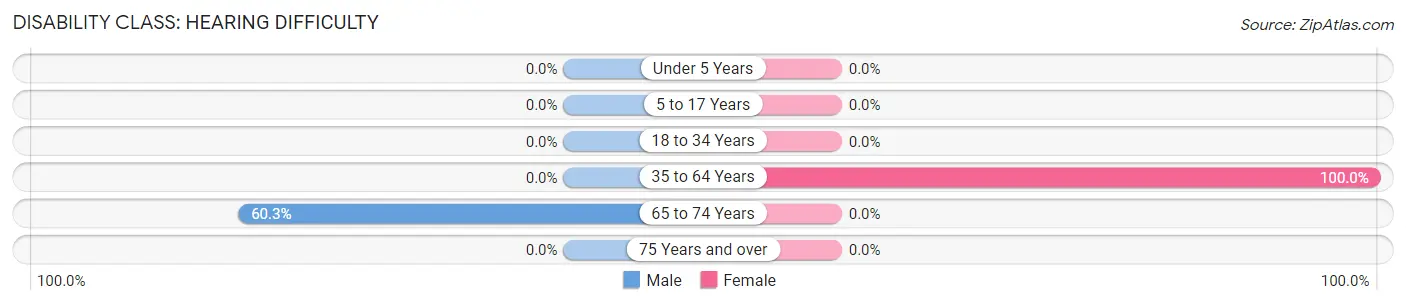
| Age Bracket | Male | Female |
| Under 5 Years | 0 (0.0%) | 0 (0.0%) |
| 5 to 17 Years | 0 (0.0%) | 0 (0.0%) |
| 18 to 34 Years | 0 (0.0%) | 0 (0.0%) |
| 35 to 64 Years | 0 (0.0%) | 48 (100.0%) |
| 65 to 74 Years | 35 (60.3%) | 0 (0.0%) |
| 75 Years and over | 0 (0.0%) | 0 (0.0%) |
Disability Class: Vision Difficulty
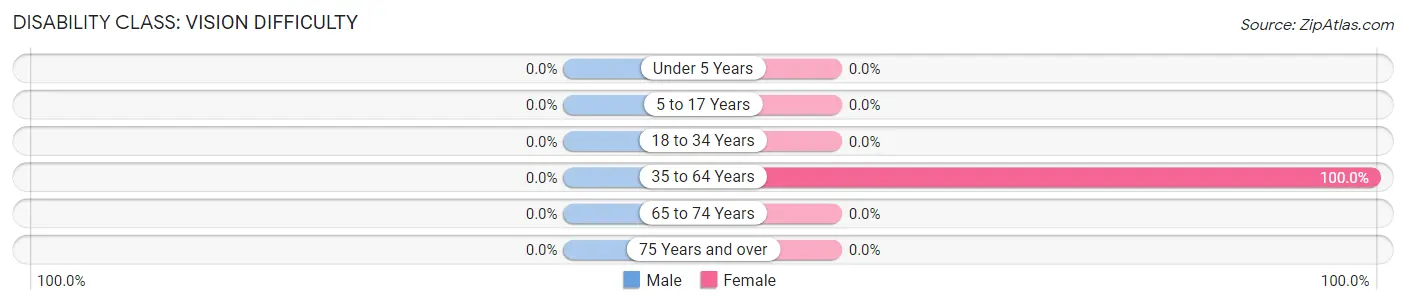
| Age Bracket | Male | Female |
| Under 5 Years | 0 (0.0%) | 0 (0.0%) |
| 5 to 17 Years | 0 (0.0%) | 0 (0.0%) |
| 18 to 34 Years | 0 (0.0%) | 0 (0.0%) |
| 35 to 64 Years | 0 (0.0%) | 48 (100.0%) |
| 65 to 74 Years | 0 (0.0%) | 0 (0.0%) |
| 75 Years and over | 0 (0.0%) | 0 (0.0%) |
Disability Class: Cognitive Difficulty
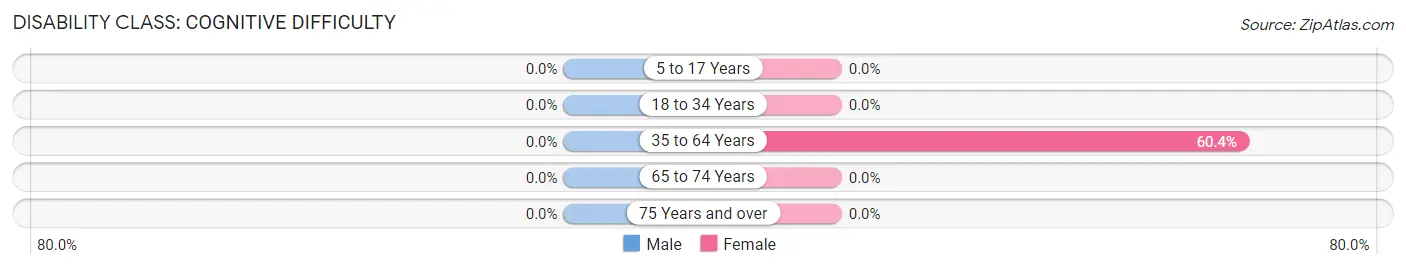
| Age Bracket | Male | Female |
| 5 to 17 Years | 0 (0.0%) | 0 (0.0%) |
| 18 to 34 Years | 0 (0.0%) | 0 (0.0%) |
| 35 to 64 Years | 0 (0.0%) | 29 (60.4%) |
| 65 to 74 Years | 0 (0.0%) | 0 (0.0%) |
| 75 Years and over | 0 (0.0%) | 0 (0.0%) |
Disability Class: Ambulatory Difficulty
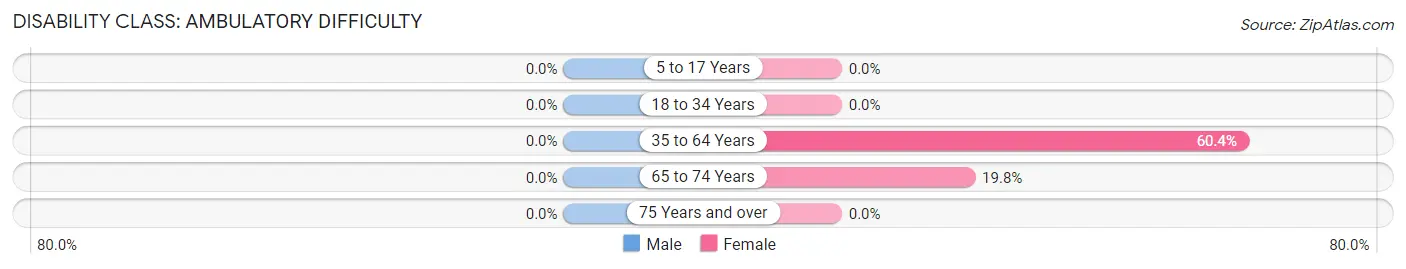
| Age Bracket | Male | Female |
| 5 to 17 Years | 0 (0.0%) | 0 (0.0%) |
| 18 to 34 Years | 0 (0.0%) | 0 (0.0%) |
| 35 to 64 Years | 0 (0.0%) | 29 (60.4%) |
| 65 to 74 Years | 0 (0.0%) | 20 (19.8%) |
| 75 Years and over | 0 (0.0%) | 0 (0.0%) |
Disability Class: Self-Care Difficulty
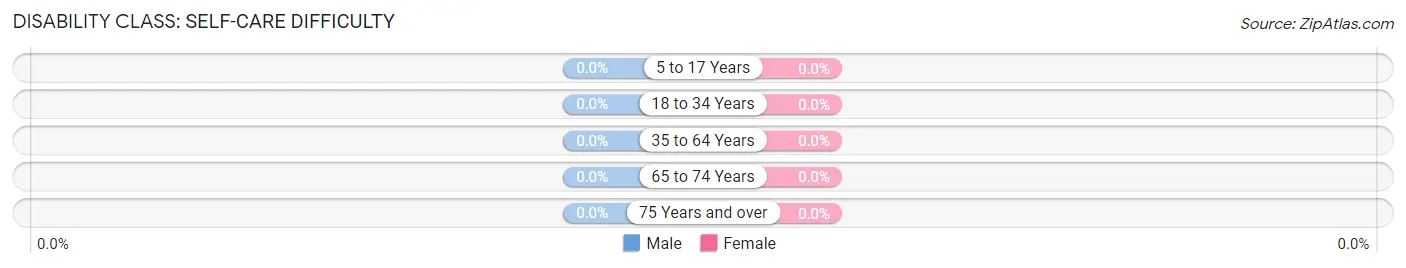
| Age Bracket | Male | Female |
| 5 to 17 Years | 0 (0.0%) | 0 (0.0%) |
| 18 to 34 Years | 0 (0.0%) | 0 (0.0%) |
| 35 to 64 Years | 0 (0.0%) | 0 (0.0%) |
| 65 to 74 Years | 0 (0.0%) | 0 (0.0%) |
| 75 Years and over | 0 (0.0%) | 0 (0.0%) |
Technology Access in Pajonal
Computing Device Access in Pajonal
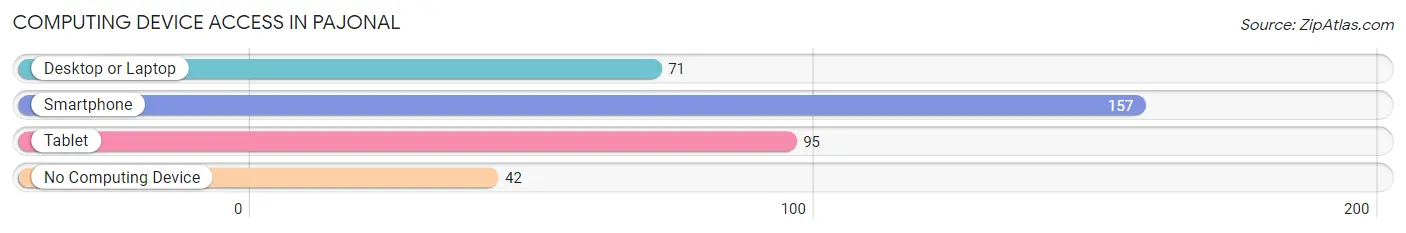
| Device Type | # Households | % Households |
| Desktop or Laptop | 71 | 33.3% |
| Smartphone | 157 | 73.7% |
| Tablet | 95 | 44.6% |
| No Computing Device | 42 | 19.7% |
| Total | 213 | 100.0% |
Internet Access in Pajonal
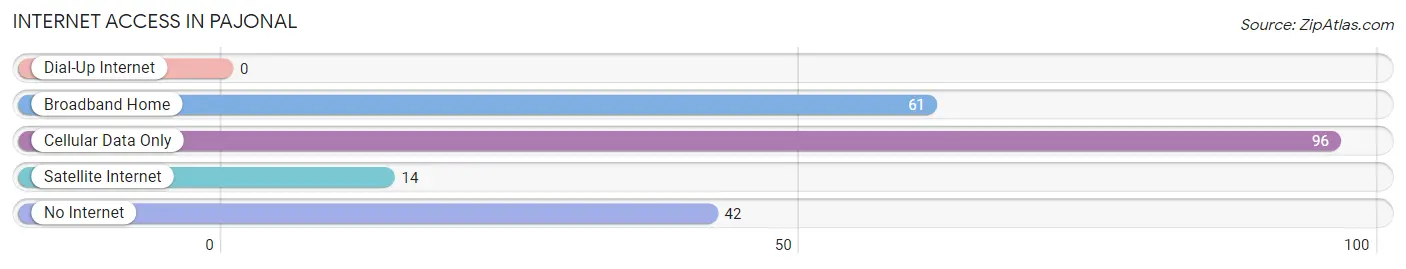
| Internet Type | # Households | % Households |
| Dial-Up Internet | 0 | 0.0% |
| Broadband Home | 61 | 28.6% |
| Cellular Data Only | 96 | 45.1% |
| Satellite Internet | 14 | 6.6% |
| No Internet | 42 | 19.7% |
| Total | 213 | 100.0% |
Pajonal Summary
Pajonal is a small municipality located in the northern region of the Dominican Republic. It is part of the province of Puerto Plata and is situated in the foothills of the Cordillera Septentrional mountain range. The municipality covers an area of approximately 11.5 square kilometers and is home to a population of approximately 4,000 people.
Geography
Pajonal is located in the northern region of the Dominican Republic, in the province of Puerto Plata. It is situated in the foothills of the Cordillera Septentrional mountain range, which runs along the northern coast of the country. The municipality covers an area of approximately 11.5 square kilometers and is bordered by the municipalities of Imbert, Montellano, and San Francisco de Macorís. The terrain of the area is mostly hilly, with some flat areas in the lower elevations. The climate is tropical, with temperatures ranging from hot and humid in the summer to mild and dry in the winter.
Economy
The economy of Pajonal is largely based on agriculture, with the main crops being coffee, sugarcane, and bananas. Other crops grown in the area include corn, beans, and rice. Livestock production is also an important part of the local economy, with cattle, pigs, and chickens being raised in the area. The municipality also has a small manufacturing sector, with some small-scale production of clothing and furniture.
Demographics
As of the 2010 census, the population of Pajonal was estimated to be 4,000 people. The majority of the population is of mixed race, with a small minority of African descent. The majority of the population is Roman Catholic, with a small minority of Protestants. The official language of the municipality is Spanish, although English is also spoken by some of the population.
The majority of the population is employed in the agricultural sector, with a small minority employed in the manufacturing sector. The average household income in the municipality is low, with most households living below the poverty line. The literacy rate in the municipality is also low, with only around 50% of the population being literate.
Conclusion
Pajonal is a small municipality located in the northern region of the Dominican Republic. It is situated in the foothills of the Cordillera Septentrional mountain range and covers an area of approximately 11.5 square kilometers. The population of the municipality is estimated to be 4,000 people, with the majority of the population being of mixed race. The economy of the municipality is largely based on agriculture, with the main crops being coffee, sugarcane, and bananas. The literacy rate in the municipality is low, with only around 50% of the population being literate.
Common Questions
What is Per Capita Income in Pajonal?
Per Capita income in Pajonal is $6,308.
What is the Median Family Income in Pajonal?
Median Family Income in Pajonal is $13,571.
What is the Median Household income in Pajonal?
Median Household Income in Pajonal is $13,087.
What is Inequality or Gini Index in Pajonal?
Inequality or Gini Index in Pajonal is 0.53.
What is the Total Population of Pajonal?
Total Population of Pajonal is 639.
What is the Total Male Population of Pajonal?
Total Male Population of Pajonal is 357.
What is the Total Female Population of Pajonal?
Total Female Population of Pajonal is 282.
What is the Ratio of Males per 100 Females in Pajonal?
There are 126.60 Males per 100 Females in Pajonal.
What is the Ratio of Females per 100 Males in Pajonal?
There are 78.99 Females per 100 Males in Pajonal.
What is the Median Population Age in Pajonal?
Median Population Age in Pajonal is 43.3 Years.
What is the Average Family Size in Pajonal
Average Family Size in Pajonal is 3.2 People.
What is the Average Household Size in Pajonal
Average Household Size in Pajonal is 3.0 People.
How Large is the Labor Force in Pajonal?
There are 273 People in the Labor Forcein in Pajonal.
What is the Percentage of People in the Labor Force in Pajonal?
49.5% of People are in the Labor Force in Pajonal.
What is the Unemployment Rate in Pajonal?
Unemployment Rate in Pajonal is 47.6%.