El Paraiso, PR Map & Demographics
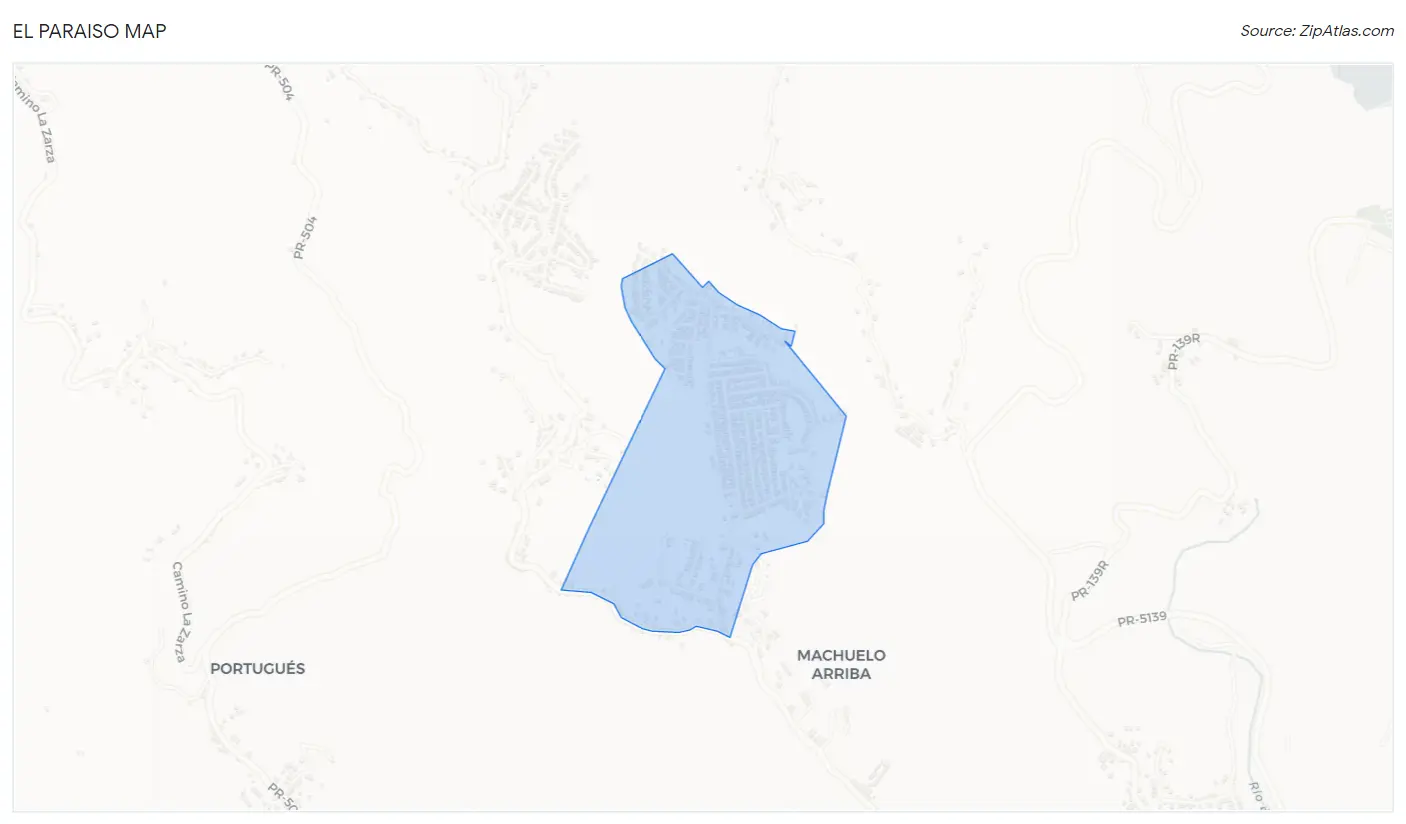
El Paraiso Map
El Paraiso Overview
$11,156
PER CAPITA INCOME
$22,356
AVG FAMILY INCOME
$22,212
AVG HOUSEHOLD INCOME
22.5%
WAGE / INCOME GAP [ % ]
77.5¢/ $1
WAGE / INCOME GAP [ $ ]
$14,083
FAMILY INCOME DEFICIT
0.44
INEQUALITY / GINI INDEX
1,115
TOTAL POPULATION
504
MALE POPULATION
611
FEMALE POPULATION
82.49
MALES / 100 FEMALES
121.23
FEMALES / 100 MALES
47.8
MEDIAN AGE
3.2
AVG FAMILY SIZE
2.4
AVG HOUSEHOLD SIZE
450
LABOR FORCE [ PEOPLE ]
51.6%
PERCENT IN LABOR FORCE
12.4%
UNEMPLOYMENT RATE
Income in El Paraiso
Income Overview in El Paraiso
Per Capita Income in El Paraiso is $11,156, while median incomes of families and households are $22,356 and $22,212 respectively.
| Characteristic | Number | Measure |
| Per Capita Income | 1,115 | $11,156 |
| Median Family Income | 275 | $22,356 |
| Mean Family Income | 275 | $27,784 |
| Median Household Income | 466 | $22,212 |
| Mean Household Income | 466 | $25,491 |
| Income Deficit | 275 | $14,083 |
| Wage / Income Gap (%) | 1,115 | 22.47% |
| Wage / Income Gap ($) | 1,115 | 77.53¢ per $1 |
| Gini / Inequality Index | 1,115 | 0.44 |
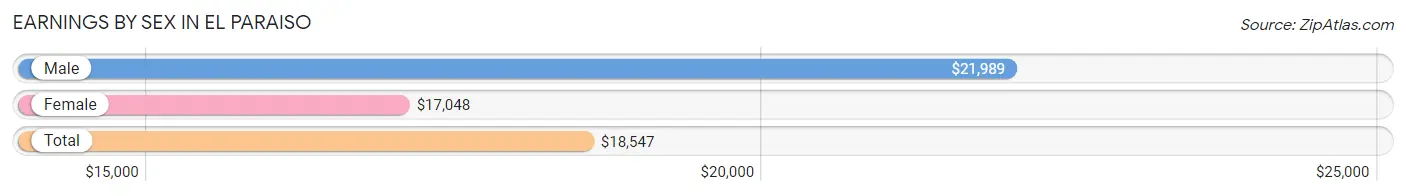
Earnings by Sex in El Paraiso
Average Earnings in El Paraiso are $18,547, $21,989 for men and $17,048 for women, a difference of 22.5%.
| Sex | Number | Average Earnings |
| Male | 179 (45.4%) | $21,989 |
| Female | 215 (54.6%) | $17,048 |
| Total | 394 (100.0%) | $18,547 |
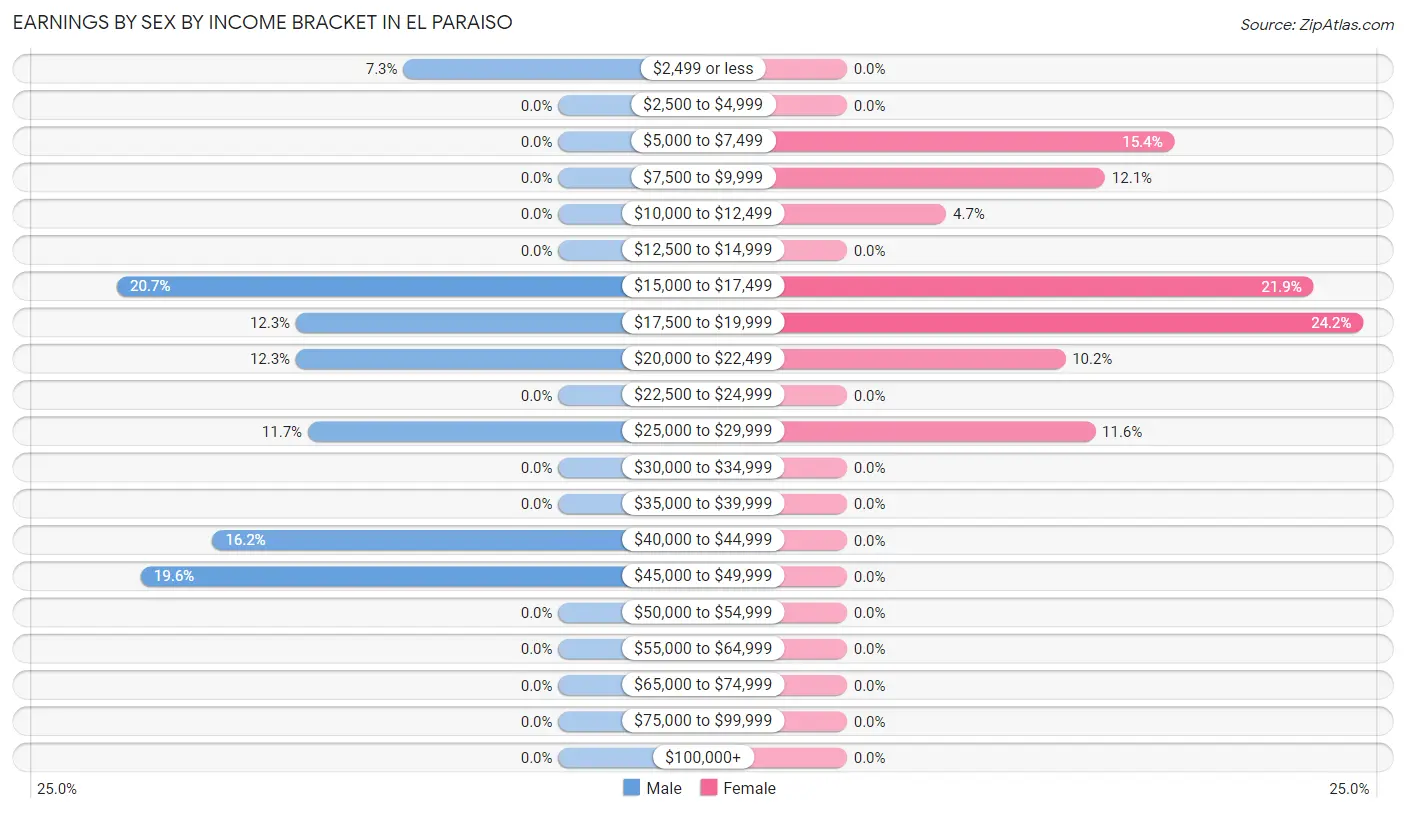
Earnings by Sex by Income Bracket in El Paraiso
The most common earnings brackets in El Paraiso are $15,000 to $17,499 for men (37 | 20.7%) and $17,500 to $19,999 for women (52 | 24.2%).
| Income | Male | Female |
| $2,499 or less | 13 (7.3%) | 0 (0.0%) |
| $2,500 to $4,999 | 0 (0.0%) | 0 (0.0%) |
| $5,000 to $7,499 | 0 (0.0%) | 33 (15.3%) |
| $7,500 to $9,999 | 0 (0.0%) | 26 (12.1%) |
| $10,000 to $12,499 | 0 (0.0%) | 10 (4.6%) |
| $12,500 to $14,999 | 0 (0.0%) | 0 (0.0%) |
| $15,000 to $17,499 | 37 (20.7%) | 47 (21.9%) |
| $17,500 to $19,999 | 22 (12.3%) | 52 (24.2%) |
| $20,000 to $22,499 | 22 (12.3%) | 22 (10.2%) |
| $22,500 to $24,999 | 0 (0.0%) | 0 (0.0%) |
| $25,000 to $29,999 | 21 (11.7%) | 25 (11.6%) |
| $30,000 to $34,999 | 0 (0.0%) | 0 (0.0%) |
| $35,000 to $39,999 | 0 (0.0%) | 0 (0.0%) |
| $40,000 to $44,999 | 29 (16.2%) | 0 (0.0%) |
| $45,000 to $49,999 | 35 (19.6%) | 0 (0.0%) |
| $50,000 to $54,999 | 0 (0.0%) | 0 (0.0%) |
| $55,000 to $64,999 | 0 (0.0%) | 0 (0.0%) |
| $65,000 to $74,999 | 0 (0.0%) | 0 (0.0%) |
| $75,000 to $99,999 | 0 (0.0%) | 0 (0.0%) |
| $100,000+ | 0 (0.0%) | 0 (0.0%) |
| Total | 179 (100.0%) | 215 (100.0%) |
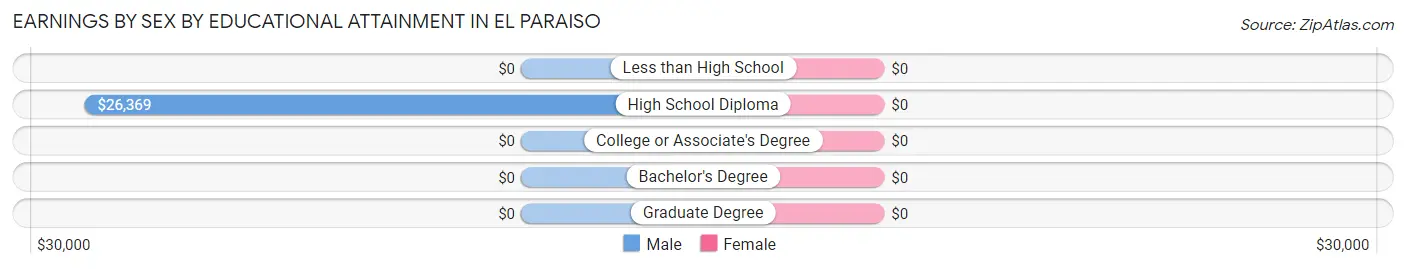
Earnings by Sex by Educational Attainment in El Paraiso
| Educational Attainment | Male Income | Female Income |
| Less than High School | - | - |
| High School Diploma | $26,369 | $0 |
| College or Associate's Degree | - | - |
| Bachelor's Degree | - | - |
| Graduate Degree | - | - |
| Total | $21,989 | $17,885 |
Family Income in El Paraiso
Family Income Brackets in El Paraiso
According to the El Paraiso family income data, there are 104 families falling into the less than $10,000 income range, which is the most common income bracket and makes up 37.8% of all families.
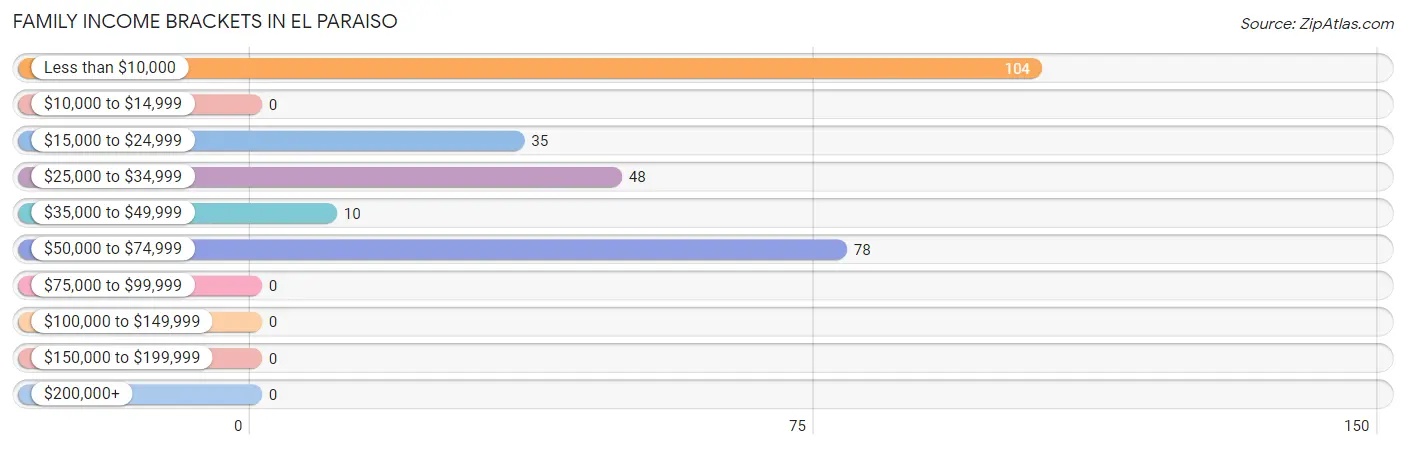
| Income Bracket | # Families | % Families |
| Less than $10,000 | 104 | 37.8% |
| $10,000 to $14,999 | 0 | 0.0% |
| $15,000 to $24,999 | 35 | 12.7% |
| $25,000 to $34,999 | 48 | 17.5% |
| $35,000 to $49,999 | 10 | 3.6% |
| $50,000 to $74,999 | 78 | 28.4% |
| $75,000 to $99,999 | 0 | 0.0% |
| $100,000 to $149,999 | 0 | 0.0% |
| $150,000 to $199,999 | 0 | 0.0% |
| $200,000+ | 0 | 0.0% |
Family Income by Famaliy Size in El Paraiso
| Income Bracket | # Families | Median Income |
| 2-Person Families | 132 (48.0%) | $0 |
| 3-Person Families | 66 (24.0%) | $0 |
| 4-Person Families | 51 (18.5%) | $0 |
| 5-Person Families | 0 (0.0%) | $0 |
| 6-Person Families | 26 (9.5%) | $0 |
| 7+ Person Families | 0 (0.0%) | $0 |
| Total | 275 (100.0%) | $22,356 |
Family Income by Number of Earners in El Paraiso
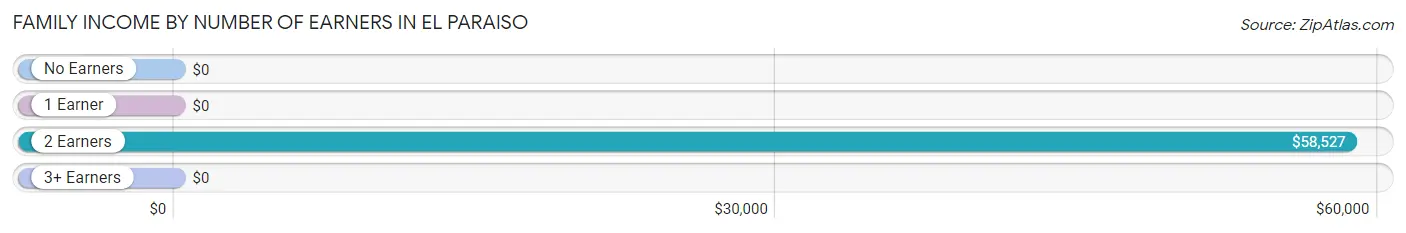
| Number of Earners | # Families | Median Income |
| No Earners | 102 (37.1%) | $0 |
| 1 Earner | 85 (30.9%) | $0 |
| 2 Earners | 66 (24.0%) | $58,527 |
| 3+ Earners | 22 (8.0%) | $0 |
| Total | 275 (100.0%) | $22,356 |
Household Income in El Paraiso
Household Income Brackets in El Paraiso
With 157 households falling in the category, the less than $10,000 income range is the most frequent in El Paraiso, accounting for 33.7% of all households.
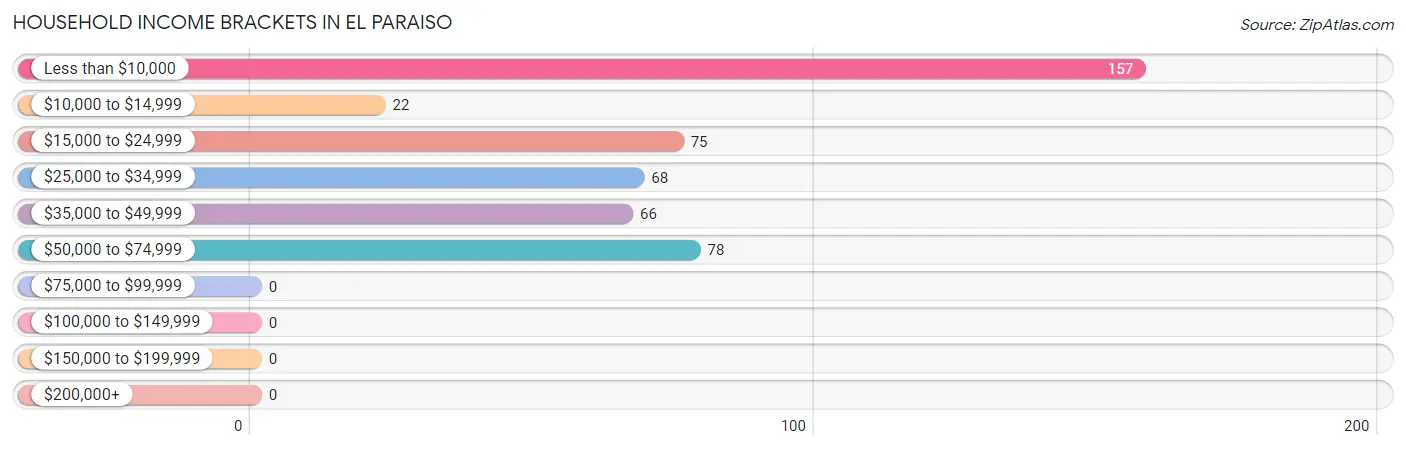
| Income Bracket | # Households | % Households |
| Less than $10,000 | 157 | 33.7% |
| $10,000 to $14,999 | 22 | 4.7% |
| $15,000 to $24,999 | 75 | 16.1% |
| $25,000 to $34,999 | 68 | 14.6% |
| $35,000 to $49,999 | 66 | 14.2% |
| $50,000 to $74,999 | 78 | 16.7% |
| $75,000 to $99,999 | 0 | 0.0% |
| $100,000 to $149,999 | 0 | 0.0% |
| $150,000 to $199,999 | 0 | 0.0% |
| $200,000+ | 0 | 0.0% |
Household Income by Householder Age in El Paraiso
The median household income in El Paraiso is $22,212, with the highest median household income of $29,097 found in the 45 to 64 years age bracket for the primary householder. A total of 213 households (45.7%) fall into this category.
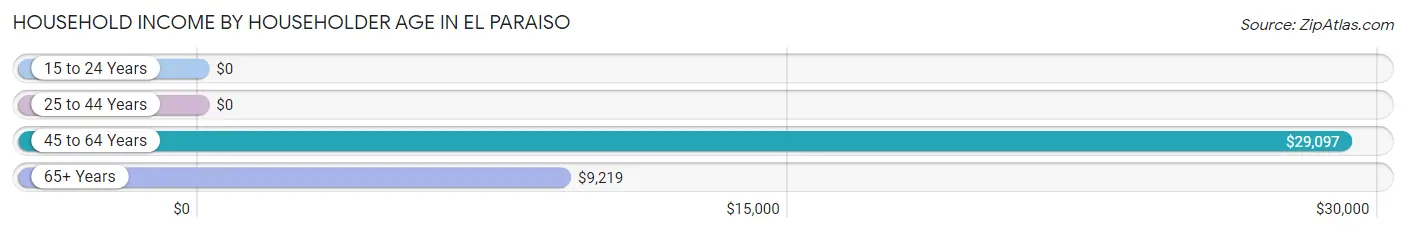
| Income Bracket | # Households | Median Income |
| 15 to 24 Years | 0 (0.0%) | $0 |
| 25 to 44 Years | 116 (24.9%) | $0 |
| 45 to 64 Years | 213 (45.7%) | $29,097 |
| 65+ Years | 137 (29.4%) | $9,219 |
| Total | 466 (100.0%) | $22,212 |
Poverty in El Paraiso
Income Below Poverty by Sex and Age in El Paraiso
With 46.2% poverty level for males and 47.8% for females among the residents of El Paraiso, 6 to 11 year old males and 15 year old females are the most vulnerable to poverty, with 75 males (100.0%) and 28 females (100.0%) in their respective age groups living below the poverty level.
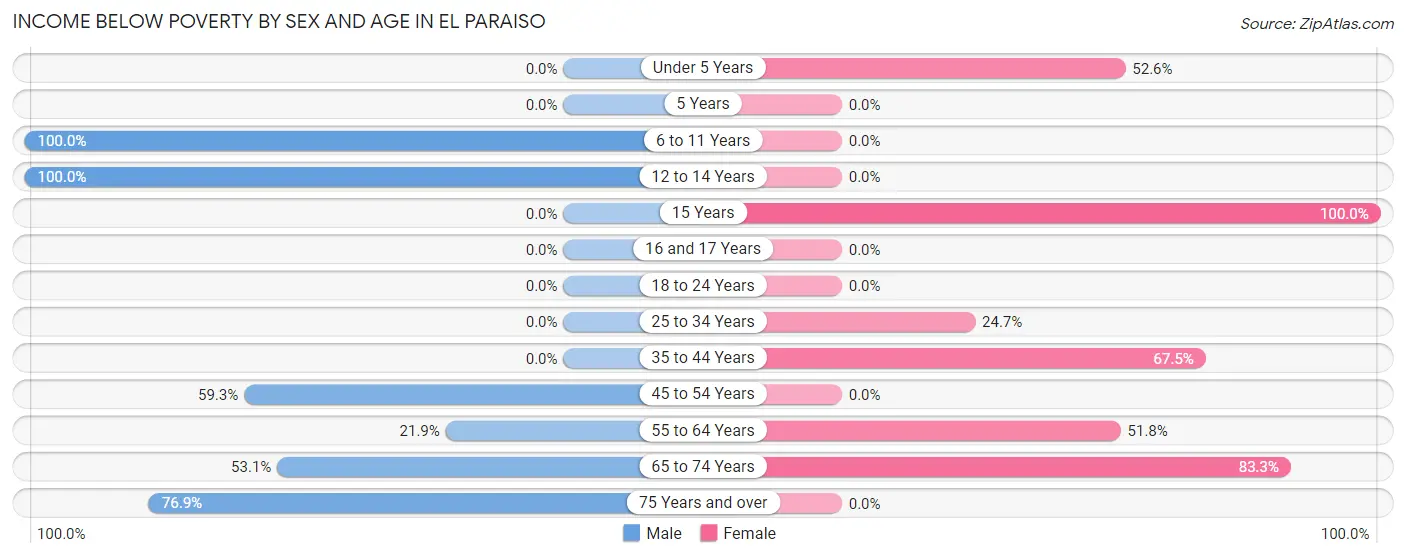
| Age Bracket | Male | Female |
| Under 5 Years | 0 (0.0%) | 60 (52.6%) |
| 5 Years | 0 (0.0%) | 0 (0.0%) |
| 6 to 11 Years | 75 (100.0%) | 0 (0.0%) |
| 12 to 14 Years | 26 (100.0%) | 0 (0.0%) |
| 15 Years | 0 (0.0%) | 28 (100.0%) |
| 16 and 17 Years | 0 (0.0%) | 0 (0.0%) |
| 18 to 24 Years | 0 (0.0%) | 0 (0.0%) |
| 25 to 34 Years | 0 (0.0%) | 24 (24.7%) |
| 35 to 44 Years | 0 (0.0%) | 52 (67.5%) |
| 45 to 54 Years | 32 (59.3%) | 0 (0.0%) |
| 55 to 64 Years | 33 (21.8%) | 74 (51.7%) |
| 65 to 74 Years | 34 (53.1%) | 50 (83.3%) |
| 75 Years and over | 30 (76.9%) | 0 (0.0%) |
| Total | 230 (46.2%) | 288 (47.8%) |
Income Above Poverty by Sex and Age in El Paraiso
According to the poverty statistics in El Paraiso, males aged 16 and 17 years and females aged 18 to 24 years are the age groups that are most secure financially, with 100.0% of males and 100.0% of females in these age groups living above the poverty line.
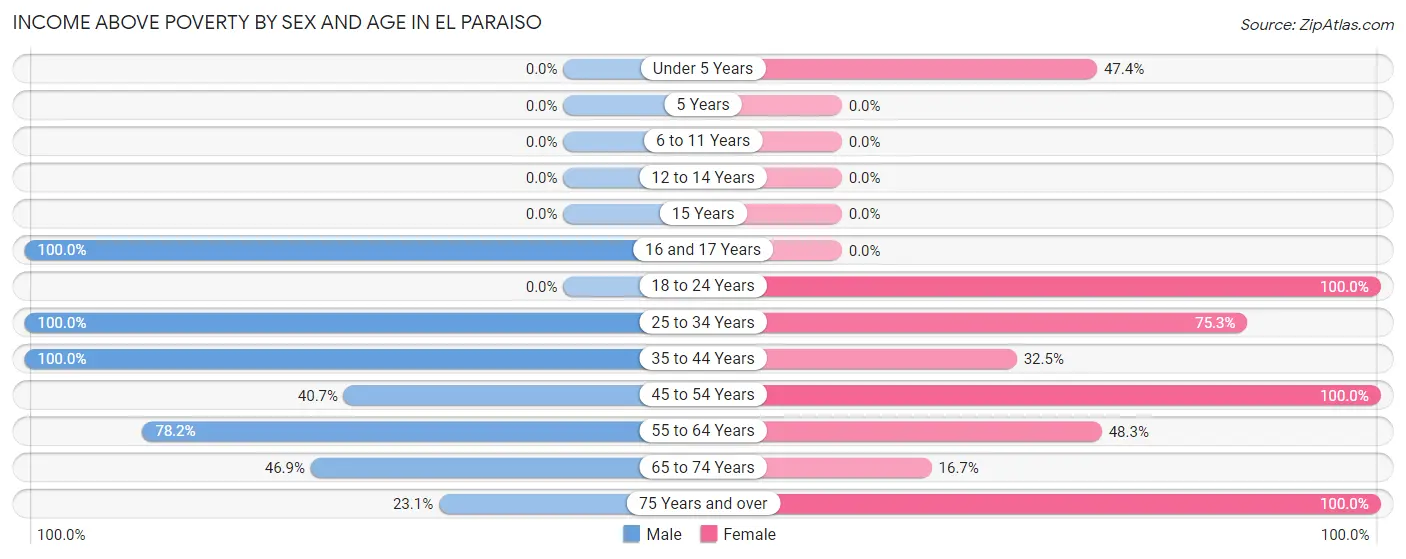
| Age Bracket | Male | Female |
| Under 5 Years | 0 (0.0%) | 54 (47.4%) |
| 5 Years | 0 (0.0%) | 0 (0.0%) |
| 6 to 11 Years | 0 (0.0%) | 0 (0.0%) |
| 12 to 14 Years | 0 (0.0%) | 0 (0.0%) |
| 15 Years | 0 (0.0%) | 0 (0.0%) |
| 16 and 17 Years | 25 (100.0%) | 0 (0.0%) |
| 18 to 24 Years | 0 (0.0%) | 33 (100.0%) |
| 25 to 34 Years | 29 (100.0%) | 73 (75.3%) |
| 35 to 44 Years | 35 (100.0%) | 25 (32.5%) |
| 45 to 54 Years | 22 (40.7%) | 27 (100.0%) |
| 55 to 64 Years | 118 (78.1%) | 69 (48.2%) |
| 65 to 74 Years | 30 (46.9%) | 10 (16.7%) |
| 75 Years and over | 9 (23.1%) | 23 (100.0%) |
| Total | 268 (53.8%) | 314 (52.2%) |
Income Below Poverty Among Married-Couple Families in El Paraiso
The poverty statistics for married-couple families in El Paraiso show that 28.2% or 57 of the total 202 families live below the poverty line. Families with no children have the highest poverty rate of 37.8%, comprising of 57 families. On the other hand, families with 1 or 2 children have the lowest poverty rate of 0.0%, which includes 0 families.
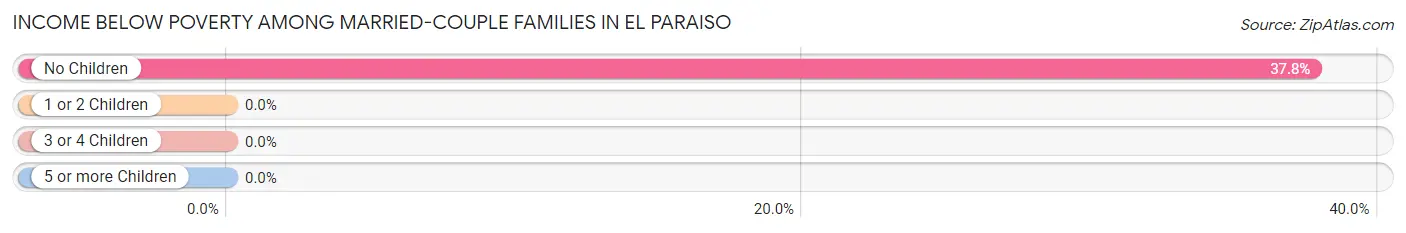
| Children | Above Poverty | Below Poverty |
| No Children | 94 (62.3%) | 57 (37.8%) |
| 1 or 2 Children | 51 (100.0%) | 0 (0.0%) |
| 3 or 4 Children | 0 (0.0%) | 0 (0.0%) |
| 5 or more Children | 0 (0.0%) | 0 (0.0%) |
| Total | 145 (71.8%) | 57 (28.2%) |
Income Below Poverty Among Single-Parent Households in El Paraiso
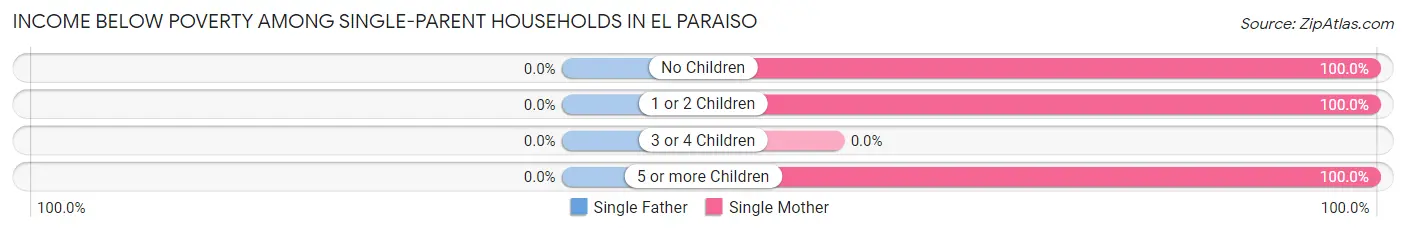
| Children | Single Father | Single Mother |
| No Children | 0 (0.0%) | 21 (100.0%) |
| 1 or 2 Children | 0 (0.0%) | 26 (100.0%) |
| 3 or 4 Children | 0 (0.0%) | 0 (0.0%) |
| 5 or more Children | 0 (0.0%) | 26 (100.0%) |
| Total | 0 (0.0%) | 73 (100.0%) |
Income Below Poverty Among Married-Couple vs Single-Parent Households in El Paraiso
The poverty data for El Paraiso shows that 57 of the married-couple family households (28.2%) and 73 of the single-parent households (100.0%) are living below the poverty level. Within the married-couple family households, those with no children have the highest poverty rate, with 57 households (37.8%) falling below the poverty line. Among the single-parent households, those with no children have the highest poverty rate, with 21 household (100.0%) living below poverty.
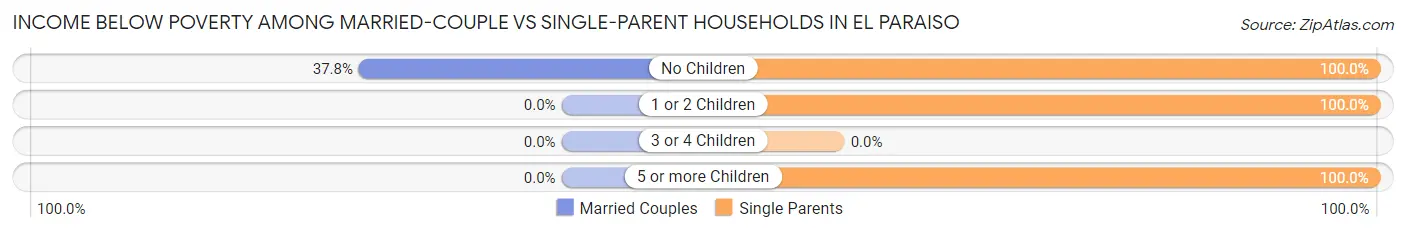
| Children | Married-Couple Families | Single-Parent Households |
| No Children | 57 (37.8%) | 21 (100.0%) |
| 1 or 2 Children | 0 (0.0%) | 26 (100.0%) |
| 3 or 4 Children | 0 (0.0%) | 0 (0.0%) |
| 5 or more Children | 0 (0.0%) | 26 (100.0%) |
| Total | 57 (28.2%) | 73 (100.0%) |
Race in El Paraiso
The most populous races in El Paraiso are Hispanic or Latino (1,115 | 100.0%), White / Caucasian (626 | 56.1%), and Two or more Races (441 | 39.6%).
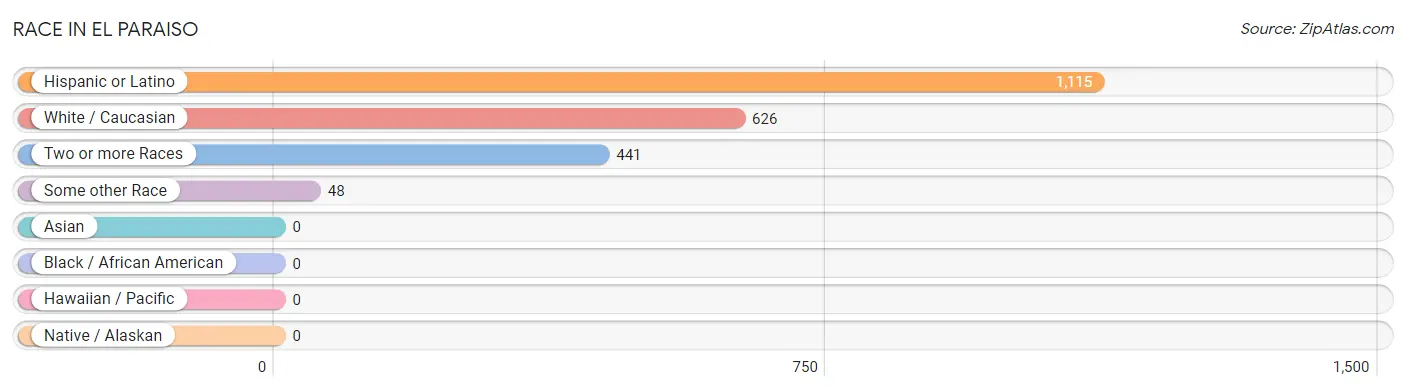
| Race | # Population | % Population |
| Asian | 0 | 0.0% |
| Black / African American | 0 | 0.0% |
| Hawaiian / Pacific | 0 | 0.0% |
| Hispanic or Latino | 1,115 | 100.0% |
| Native / Alaskan | 0 | 0.0% |
| White / Caucasian | 626 | 56.1% |
| Two or more Races | 441 | 39.6% |
| Some other Race | 48 | 4.3% |
| Total | 1,115 | 100.0% |
Ancestry in El Paraiso
The most populous ancestries reported in El Paraiso are Puerto Rican (1,115 | 100.0%), and Arab (60 | 5.4%), together accounting for 105.4% of all El Paraiso residents.
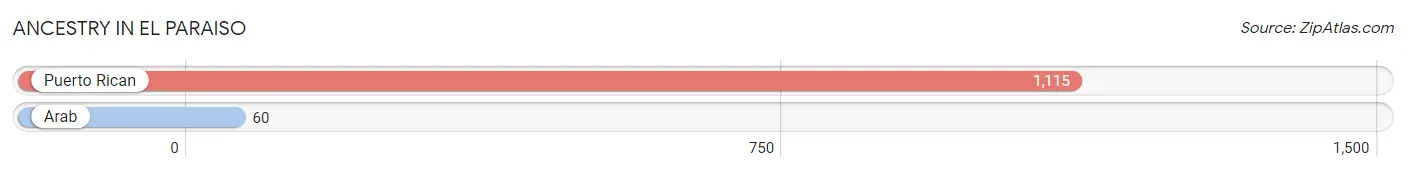
| Ancestry | # Population | % Population |
| Arab | 60 | 5.4% |
| Puerto Rican | 1,115 | 100.0% | View All 2 Rows |
Immigrants in El Paraiso

| Immigration Origin | # Population | % Population | View All 0 Rows |
Sex and Age in El Paraiso
Sex and Age in El Paraiso
The most populous age groups in El Paraiso are 60 to 64 Years (110 | 21.8%) for men and Under 5 Years (114 | 18.7%) for women.
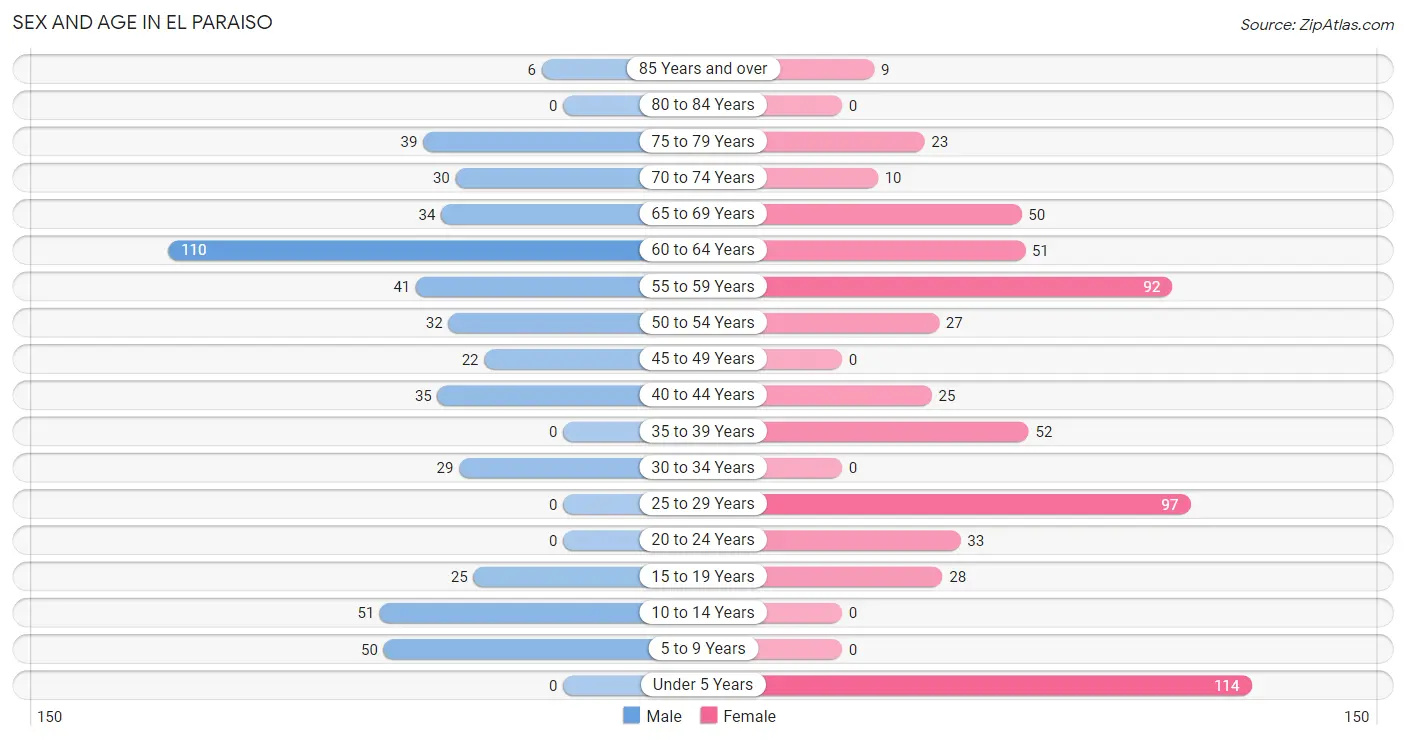
| Age Bracket | Male | Female |
| Under 5 Years | 0 (0.0%) | 114 (18.7%) |
| 5 to 9 Years | 50 (9.9%) | 0 (0.0%) |
| 10 to 14 Years | 51 (10.1%) | 0 (0.0%) |
| 15 to 19 Years | 25 (5.0%) | 28 (4.6%) |
| 20 to 24 Years | 0 (0.0%) | 33 (5.4%) |
| 25 to 29 Years | 0 (0.0%) | 97 (15.9%) |
| 30 to 34 Years | 29 (5.8%) | 0 (0.0%) |
| 35 to 39 Years | 0 (0.0%) | 52 (8.5%) |
| 40 to 44 Years | 35 (6.9%) | 25 (4.1%) |
| 45 to 49 Years | 22 (4.4%) | 0 (0.0%) |
| 50 to 54 Years | 32 (6.4%) | 27 (4.4%) |
| 55 to 59 Years | 41 (8.1%) | 92 (15.1%) |
| 60 to 64 Years | 110 (21.8%) | 51 (8.4%) |
| 65 to 69 Years | 34 (6.8%) | 50 (8.2%) |
| 70 to 74 Years | 30 (5.9%) | 10 (1.6%) |
| 75 to 79 Years | 39 (7.7%) | 23 (3.8%) |
| 80 to 84 Years | 0 (0.0%) | 0 (0.0%) |
| 85 Years and over | 6 (1.2%) | 9 (1.5%) |
| Total | 504 (100.0%) | 611 (100.0%) |
Families and Households in El Paraiso
Median Family Size in El Paraiso
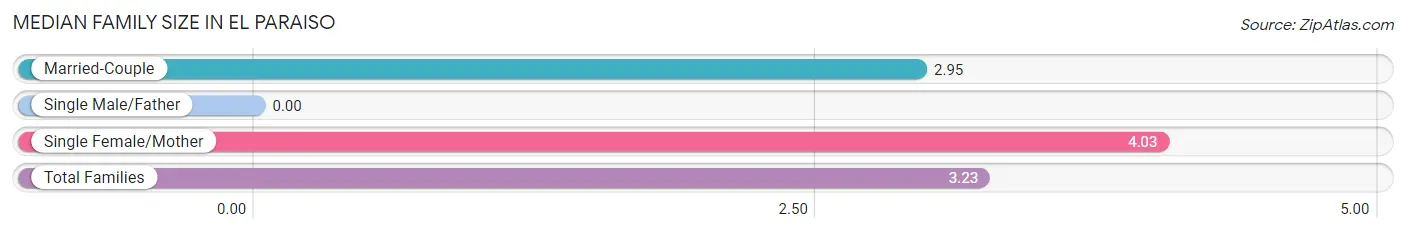
| Family Type | # Families | Family Size |
| Married-Couple | 202 (73.5%) | 2.95 |
| Single Male/Father | 0 (0.0%) | - |
| Single Female/Mother | 73 (26.6%) | 4.03 |
| Total Families | 275 (100.0%) | 3.23 |
Median Household Size in El Paraiso
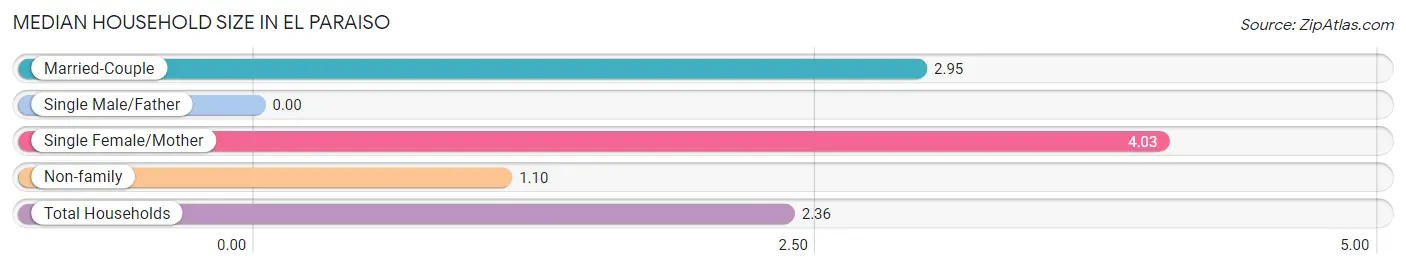
| Household Type | # Households | Household Size |
| Married-Couple | 202 (43.3%) | 2.95 |
| Single Male/Father | 0 (0.0%) | - |
| Single Female/Mother | 73 (15.7%) | 4.03 |
| Non-family | 191 (41.0%) | 1.10 |
| Total Households | 466 (100.0%) | 2.36 |
Household Size by Marriage Status in El Paraiso
Out of a total of 466 households in El Paraiso, 275 (59.0%) are family households, while 191 (41.0%) are nonfamily households. The most numerous type of family households are 2-person households, comprising 132, and the most common type of nonfamily households are 1-person households, comprising 170.
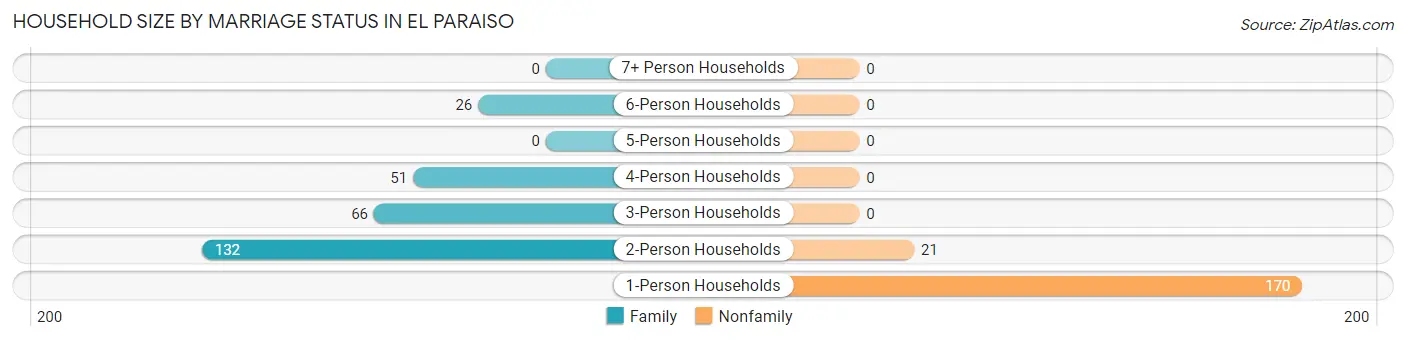
| Household Size | Family Households | Nonfamily Households |
| 1-Person Households | - | 170 (36.5%) |
| 2-Person Households | 132 (28.3%) | 21 (4.5%) |
| 3-Person Households | 66 (14.2%) | 0 (0.0%) |
| 4-Person Households | 51 (10.9%) | 0 (0.0%) |
| 5-Person Households | 0 (0.0%) | 0 (0.0%) |
| 6-Person Households | 26 (5.6%) | 0 (0.0%) |
| 7+ Person Households | 0 (0.0%) | 0 (0.0%) |
| Total | 275 (59.0%) | 191 (41.0%) |
Female Fertility in El Paraiso
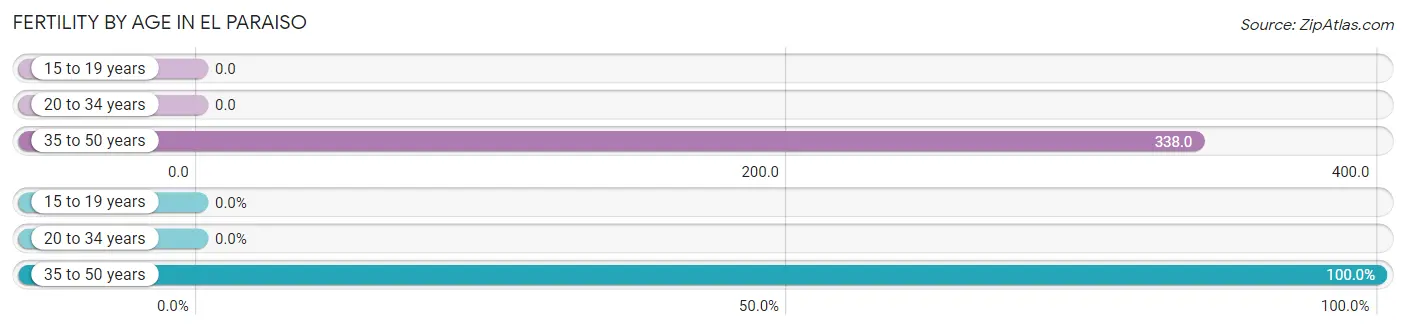
Fertility by Age in El Paraiso
Average fertility rate in El Paraiso is 111.0 births per 1,000 women. Women in the age bracket of 35 to 50 years have the highest fertility rate with 338.0 births per 1,000 women. Women in the age bracket of 35 to 50 years acount for 100.0% of all women with births.
| Age Bracket | Women with Births | Births / 1,000 Women |
| 15 to 19 years | 0 (0.0%) | 0.0 |
| 20 to 34 years | 0 (0.0%) | 0.0 |
| 35 to 50 years | 26 (100.0%) | 338.0 |
| Total | 26 (100.0%) | 111.0 |
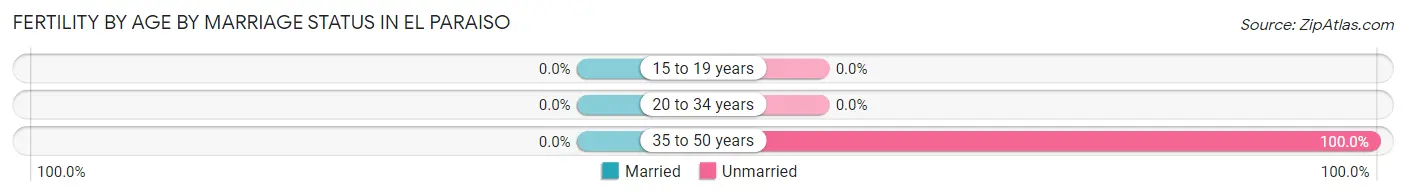
Fertility by Age by Marriage Status in El Paraiso
| Age Bracket | Married | Unmarried |
| 15 to 19 years | 0 (0.0%) | 0 (0.0%) |
| 20 to 34 years | 0 (0.0%) | 0 (0.0%) |
| 35 to 50 years | 0 (0.0%) | 26 (100.0%) |
| Total | 0 (0.0%) | 26 (100.0%) |
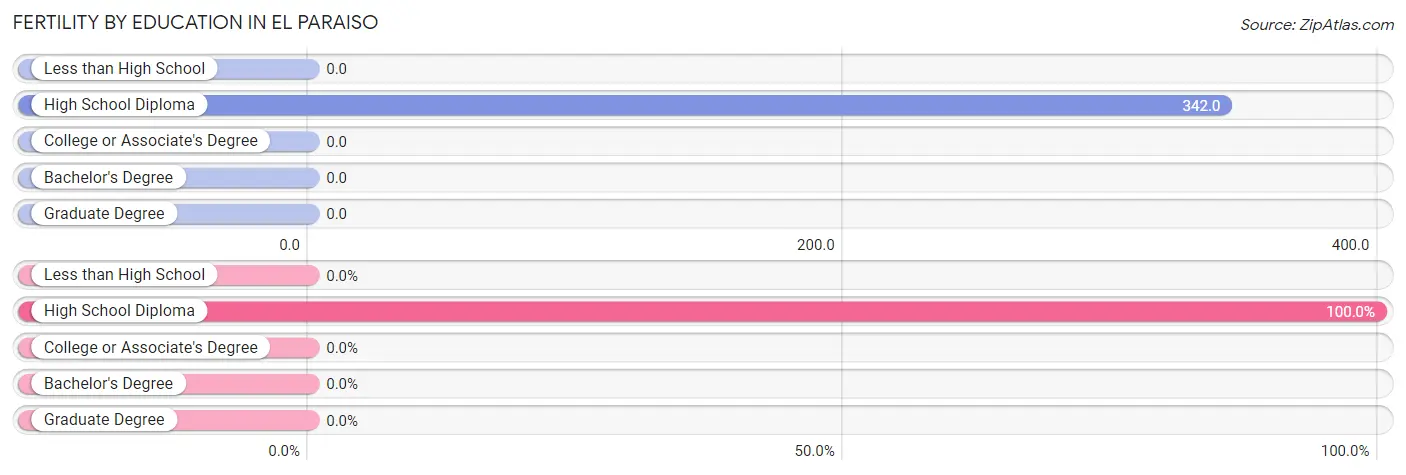
Fertility by Education in El Paraiso
| Educational Attainment | Women with Births | Births / 1,000 Women |
| Less than High School | 0 (0.0%) | 0.0 |
| High School Diploma | 26 (100.0%) | 342.0 |
| College or Associate's Degree | 0 (0.0%) | 0.0 |
| Bachelor's Degree | 0 (0.0%) | 0.0 |
| Graduate Degree | 0 (0.0%) | 0.0 |
| Total | 26 (100.0%) | 111.0 |
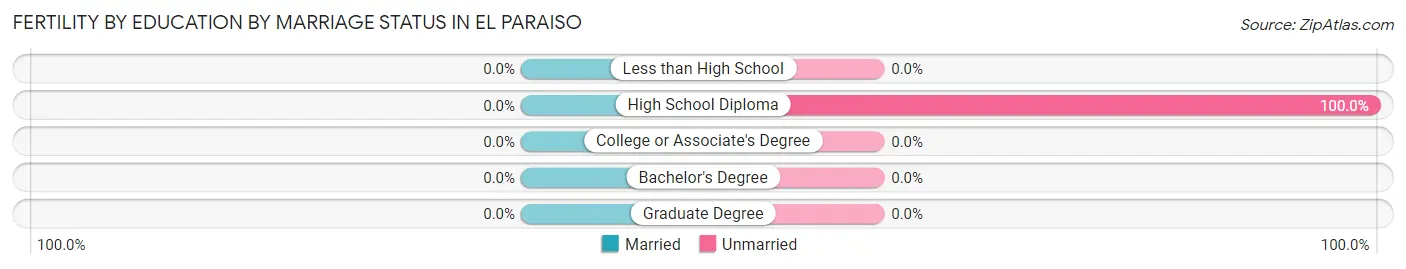
Fertility by Education by Marriage Status in El Paraiso
| Educational Attainment | Married | Unmarried |
| Less than High School | 0 (0.0%) | 0 (0.0%) |
| High School Diploma | 0 (0.0%) | 26 (100.0%) |
| College or Associate's Degree | 0 (0.0%) | 0 (0.0%) |
| Bachelor's Degree | 0 (0.0%) | 0 (0.0%) |
| Graduate Degree | 0 (0.0%) | 0 (0.0%) |
| Total | 0 (0.0%) | 26 (100.0%) |
Employment Characteristics in El Paraiso
Employment by Class of Employer in El Paraiso
Among the 359 employed individuals in El Paraiso, private company employees (234 | 65.2%), self-employed (not incorporated) (68 | 18.9%), and not-for-profit organizations (32 | 8.9%) make up the most common classes of employment.
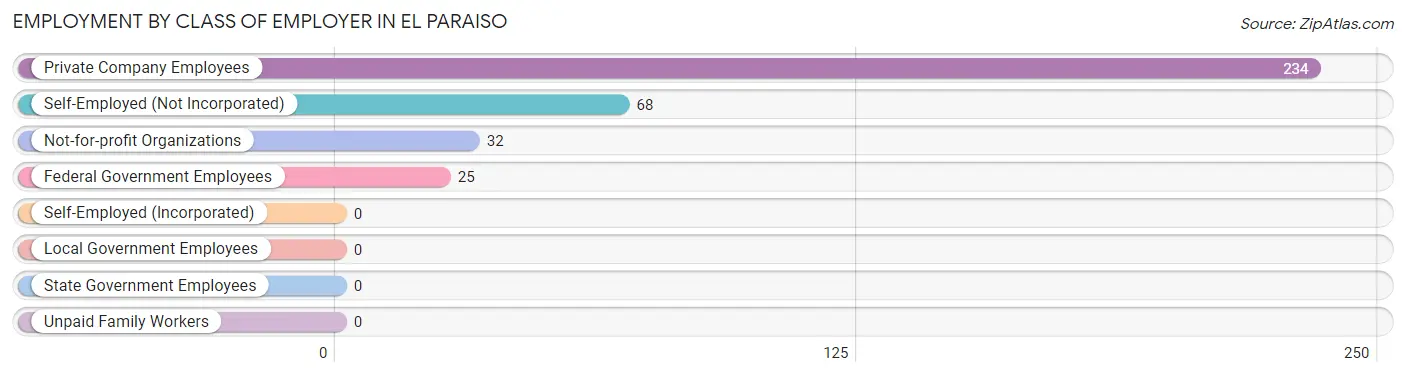
| Employer Class | # Employees | % Employees |
| Private Company Employees | 234 | 65.2% |
| Self-Employed (Incorporated) | 0 | 0.0% |
| Self-Employed (Not Incorporated) | 68 | 18.9% |
| Not-for-profit Organizations | 32 | 8.9% |
| Local Government Employees | 0 | 0.0% |
| State Government Employees | 0 | 0.0% |
| Federal Government Employees | 25 | 7.0% |
| Unpaid Family Workers | 0 | 0.0% |
| Total | 359 | 100.0% |
Employment Status by Age in El Paraiso
According to the labor force statistics for El Paraiso, out of the total population over 16 years of age (872), 51.6% or 450 individuals are in the labor force, with 12.4% or 56 of them unemployed. The age group with the highest labor force participation rate is 20 to 24 years, with 100.0% or 33 individuals in the labor force. Within the labor force, the 45 to 54 years age range has the highest percentage of unemployed individuals, with 50.0% or 32 of them being unemployed.
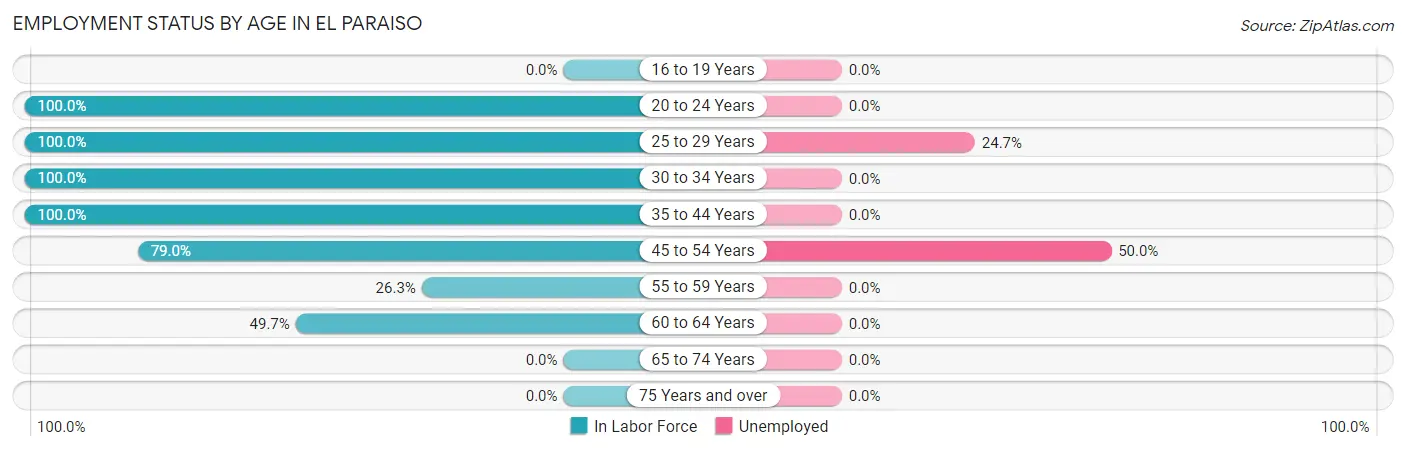
| Age Bracket | In Labor Force | Unemployed |
| 16 to 19 Years | 0 (0.0%) | 0 (0.0%) |
| 20 to 24 Years | 33 (100.0%) | 0 (0.0%) |
| 25 to 29 Years | 97 (100.0%) | 24 (24.7%) |
| 30 to 34 Years | 29 (100.0%) | 0 (0.0%) |
| 35 to 44 Years | 112 (100.0%) | 0 (0.0%) |
| 45 to 54 Years | 64 (79.0%) | 32 (50.0%) |
| 55 to 59 Years | 35 (26.3%) | 0 (0.0%) |
| 60 to 64 Years | 80 (49.7%) | 0 (0.0%) |
| 65 to 74 Years | 0 (0.0%) | 0 (0.0%) |
| 75 Years and over | 0 (0.0%) | 0 (0.0%) |
| Total | 450 (51.6%) | 56 (12.4%) |
Employment Status by Educational Attainment in El Paraiso
According to labor force statistics for El Paraiso, 68.0% of individuals (417) out of the total population between 25 and 64 years of age (613) are in the labor force, with 13.4% or 56 of them being unemployed. The group with the highest labor force participation rate are those with the educational attainment of less than high school, with 86.5% or 64 individuals in the labor force. Within the labor force, individuals with less than high school education have the highest percentage of unemployment, with 50.0% or 32 of them being unemployed.
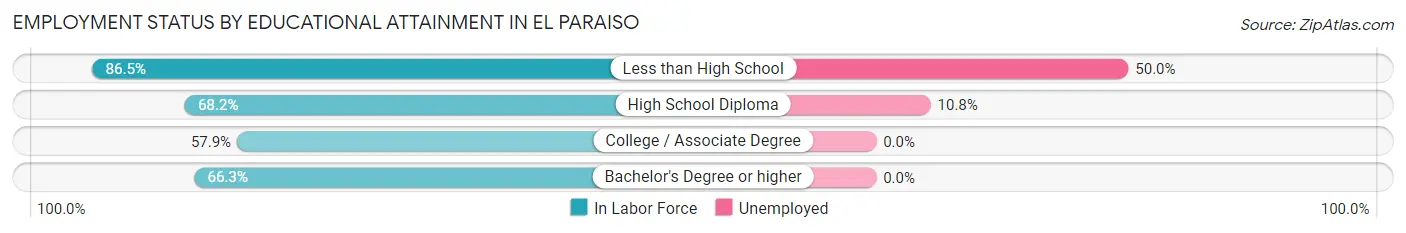
| Educational Attainment | In Labor Force | Unemployed |
| Less than High School | 64 (86.5%) | 37 (50.0%) |
| High School Diploma | 223 (68.2%) | 35 (10.8%) |
| College / Associate Degree | 73 (57.9%) | 0 (0.0%) |
| Bachelor's Degree or higher | 57 (66.3%) | 0 (0.0%) |
| Total | 417 (68.0%) | 82 (13.4%) |
Employment Occupations by Sex in El Paraiso
Management, Business, Science and Arts Occupations
The most common Management, Business, Science and Arts occupations in El Paraiso are Business & Financial (25 | 6.4%), and Management (22 | 5.6%).
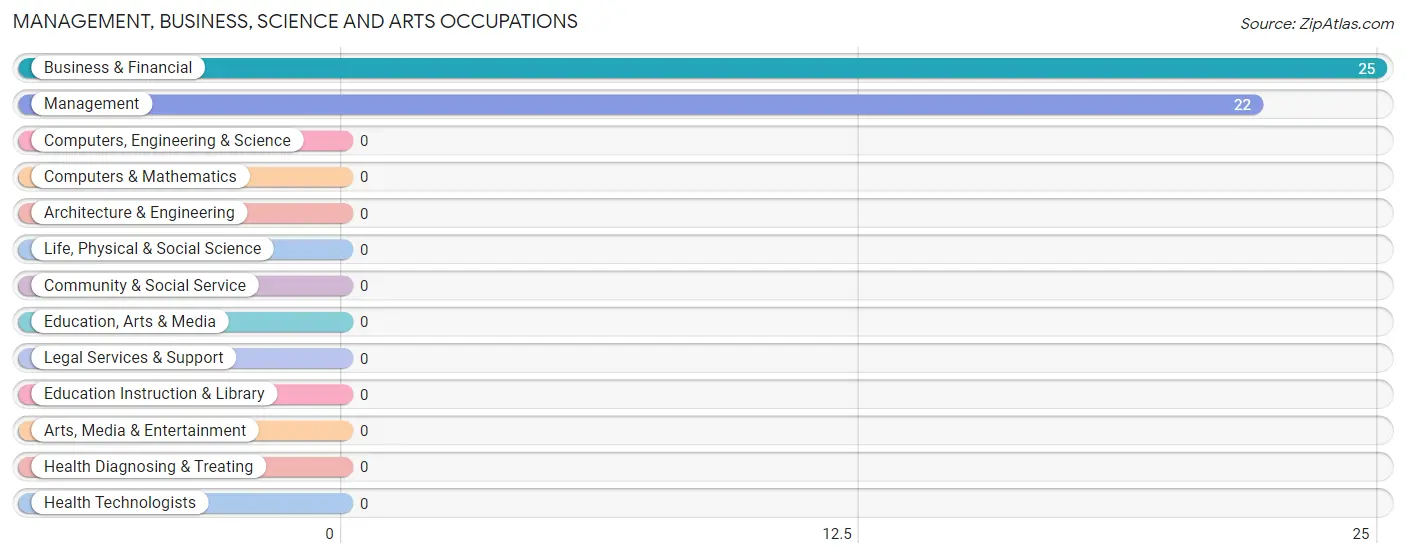
Management, Business, Science and Arts Occupations by Sex
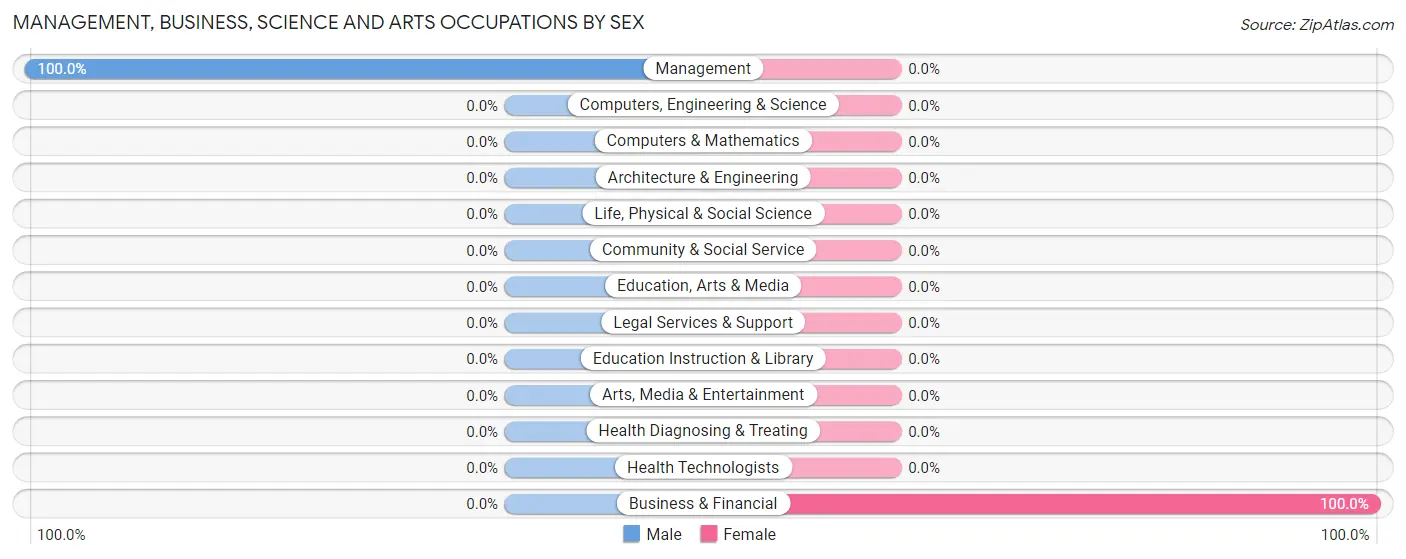
| Occupation | Male | Female |
| Management | 22 (100.0%) | 0 (0.0%) |
| Business & Financial | 0 (0.0%) | 25 (100.0%) |
| Computers, Engineering & Science | 0 (0.0%) | 0 (0.0%) |
| Computers & Mathematics | 0 (0.0%) | 0 (0.0%) |
| Architecture & Engineering | 0 (0.0%) | 0 (0.0%) |
| Life, Physical & Social Science | 0 (0.0%) | 0 (0.0%) |
| Community & Social Service | 0 (0.0%) | 0 (0.0%) |
| Education, Arts & Media | 0 (0.0%) | 0 (0.0%) |
| Legal Services & Support | 0 (0.0%) | 0 (0.0%) |
| Education Instruction & Library | 0 (0.0%) | 0 (0.0%) |
| Arts, Media & Entertainment | 0 (0.0%) | 0 (0.0%) |
| Health Diagnosing & Treating | 0 (0.0%) | 0 (0.0%) |
| Health Technologists | 0 (0.0%) | 0 (0.0%) |
| Total (Category) | 22 (46.8%) | 25 (53.2%) |
| Total (Overall) | 179 (45.4%) | 215 (54.6%) |
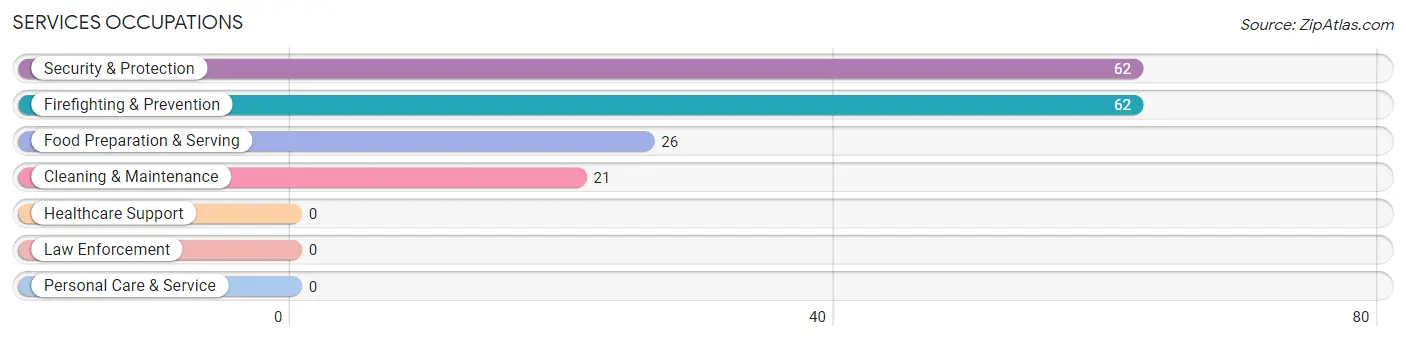
Services Occupations
The most common Services occupations in El Paraiso are Security & Protection (62 | 15.7%), Firefighting & Prevention (62 | 15.7%), Food Preparation & Serving (26 | 6.6%), and Cleaning & Maintenance (21 | 5.3%).
Services Occupations by Sex
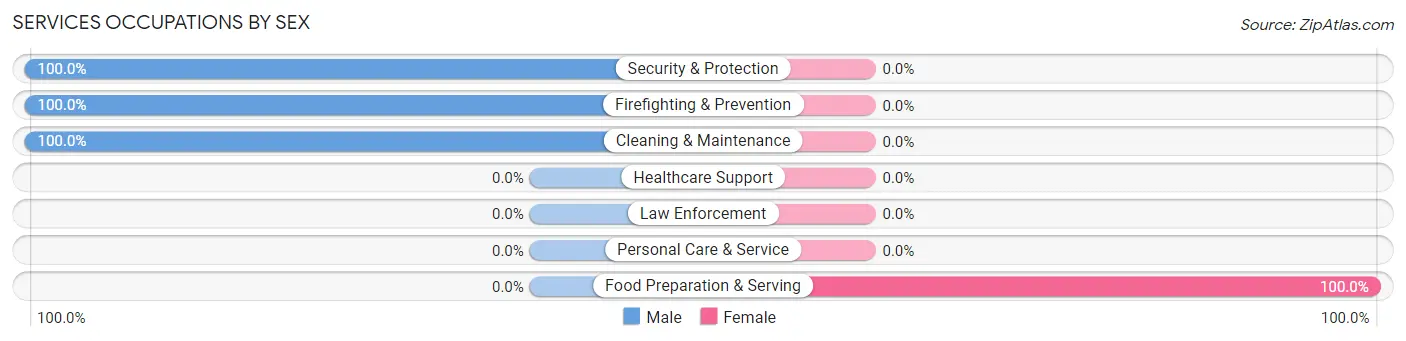
| Occupation | Male | Female |
| Healthcare Support | 0 (0.0%) | 0 (0.0%) |
| Security & Protection | 62 (100.0%) | 0 (0.0%) |
| Firefighting & Prevention | 62 (100.0%) | 0 (0.0%) |
| Law Enforcement | 0 (0.0%) | 0 (0.0%) |
| Food Preparation & Serving | 0 (0.0%) | 26 (100.0%) |
| Cleaning & Maintenance | 21 (100.0%) | 0 (0.0%) |
| Personal Care & Service | 0 (0.0%) | 0 (0.0%) |
| Total (Category) | 83 (76.1%) | 26 (23.8%) |
| Total (Overall) | 179 (45.4%) | 215 (54.6%) |
Sales and Office Occupations
The most common Sales and Office occupations in El Paraiso are Office & Administration (83 | 21.1%), and Sales & Related (59 | 15.0%).
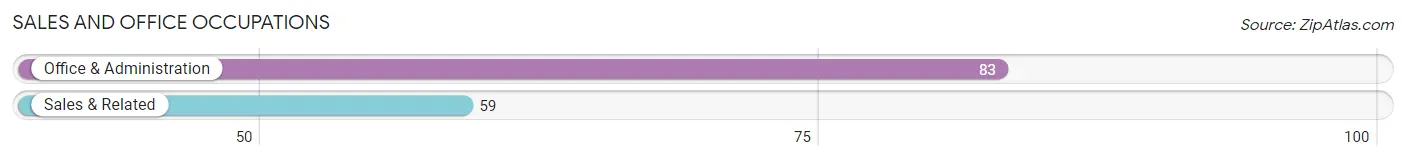
Sales and Office Occupations by Sex
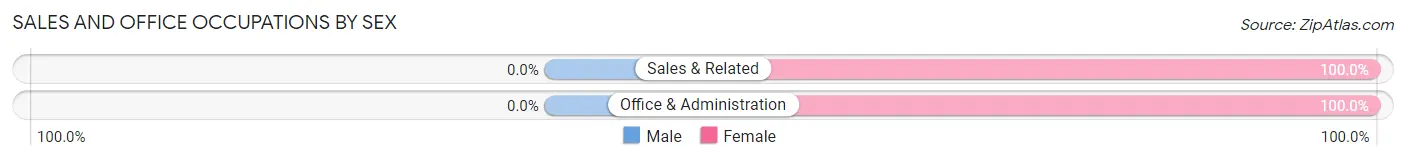
| Occupation | Male | Female |
| Sales & Related | 0 (0.0%) | 59 (100.0%) |
| Office & Administration | 0 (0.0%) | 83 (100.0%) |
| Total (Category) | 0 (0.0%) | 142 (100.0%) |
| Total (Overall) | 179 (45.4%) | 215 (54.6%) |
Natural Resources, Construction and Maintenance Occupations
The most common Natural Resources, Construction and Maintenance occupations in El Paraiso are , and Installation, Maintenance & Repair (42 | 10.7%).

Natural Resources, Construction and Maintenance Occupations by Sex
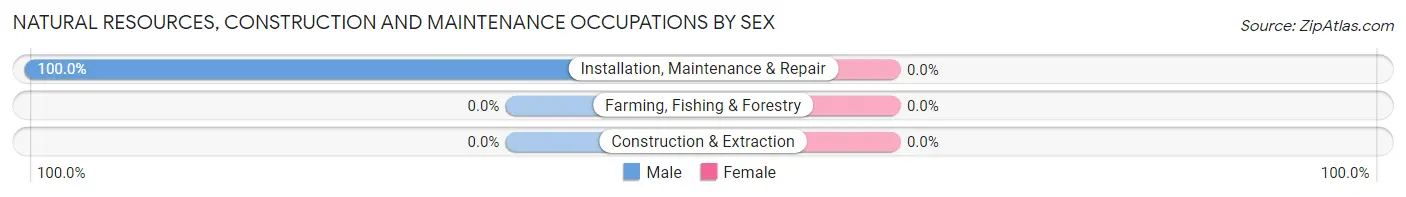
| Occupation | Male | Female |
| Farming, Fishing & Forestry | 0 (0.0%) | 0 (0.0%) |
| Construction & Extraction | 0 (0.0%) | 0 (0.0%) |
| Installation, Maintenance & Repair | 42 (100.0%) | 0 (0.0%) |
| Total (Category) | 42 (100.0%) | 0 (0.0%) |
| Total (Overall) | 179 (45.4%) | 215 (54.6%) |
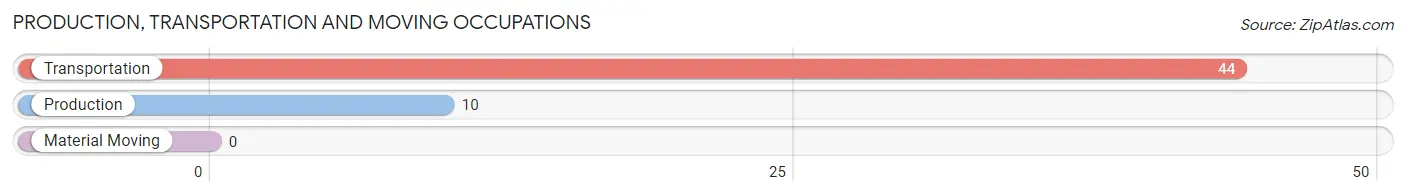
Production, Transportation and Moving Occupations
The most common Production, Transportation and Moving occupations in El Paraiso are Transportation (44 | 11.2%), and Production (10 | 2.5%).
Production, Transportation and Moving Occupations by Sex
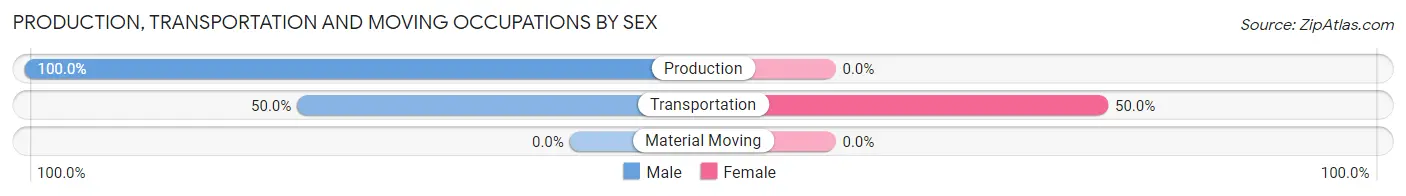
| Occupation | Male | Female |
| Production | 10 (100.0%) | 0 (0.0%) |
| Transportation | 22 (50.0%) | 22 (50.0%) |
| Material Moving | 0 (0.0%) | 0 (0.0%) |
| Total (Category) | 32 (59.3%) | 22 (40.7%) |
| Total (Overall) | 179 (45.4%) | 215 (54.6%) |
Employment Industries by Sex in El Paraiso
Employment Industries in El Paraiso
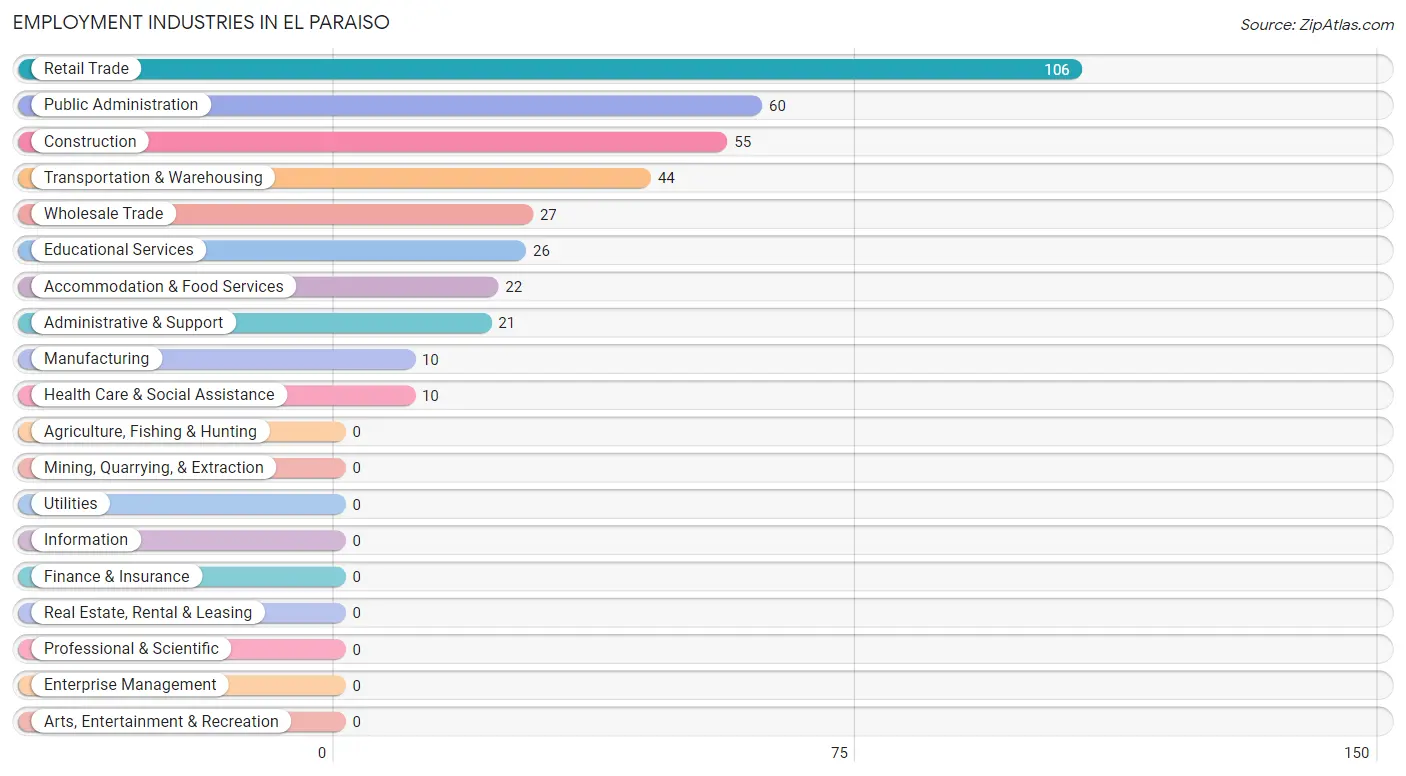
The major employment industries in El Paraiso include Retail Trade (106 | 26.9%), Public Administration (60 | 15.2%), Construction (55 | 14.0%), Transportation & Warehousing (44 | 11.2%), and Wholesale Trade (27 | 6.9%).
Employment Industries by Sex in El Paraiso
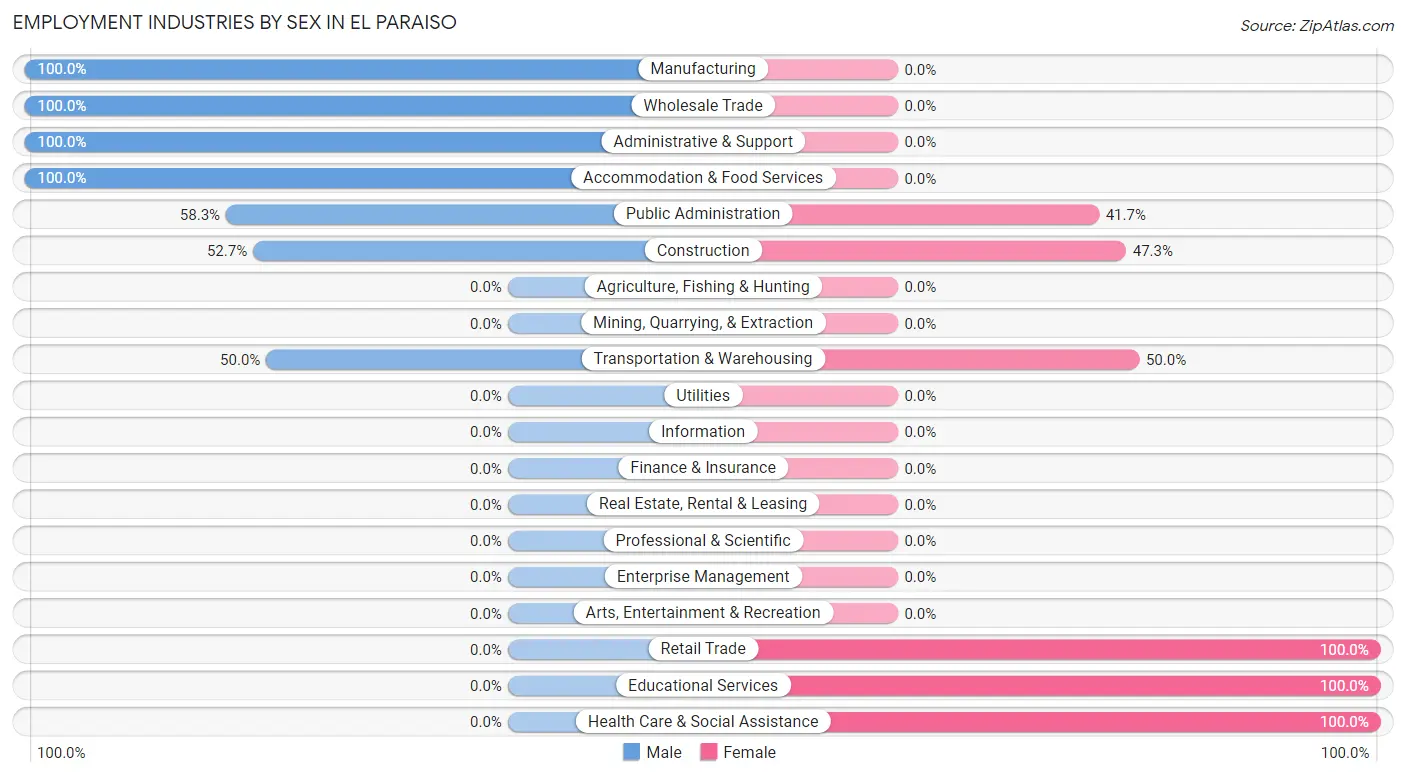
The El Paraiso industries that see more men than women are Manufacturing (100.0%), Wholesale Trade (100.0%), and Administrative & Support (100.0%), whereas the industries that tend to have a higher number of women are Retail Trade (100.0%), Educational Services (100.0%), and Health Care & Social Assistance (100.0%).
| Industry | Male | Female |
| Agriculture, Fishing & Hunting | 0 (0.0%) | 0 (0.0%) |
| Mining, Quarrying, & Extraction | 0 (0.0%) | 0 (0.0%) |
| Construction | 29 (52.7%) | 26 (47.3%) |
| Manufacturing | 10 (100.0%) | 0 (0.0%) |
| Wholesale Trade | 27 (100.0%) | 0 (0.0%) |
| Retail Trade | 0 (0.0%) | 106 (100.0%) |
| Transportation & Warehousing | 22 (50.0%) | 22 (50.0%) |
| Utilities | 0 (0.0%) | 0 (0.0%) |
| Information | 0 (0.0%) | 0 (0.0%) |
| Finance & Insurance | 0 (0.0%) | 0 (0.0%) |
| Real Estate, Rental & Leasing | 0 (0.0%) | 0 (0.0%) |
| Professional & Scientific | 0 (0.0%) | 0 (0.0%) |
| Enterprise Management | 0 (0.0%) | 0 (0.0%) |
| Administrative & Support | 21 (100.0%) | 0 (0.0%) |
| Educational Services | 0 (0.0%) | 26 (100.0%) |
| Health Care & Social Assistance | 0 (0.0%) | 10 (100.0%) |
| Arts, Entertainment & Recreation | 0 (0.0%) | 0 (0.0%) |
| Accommodation & Food Services | 22 (100.0%) | 0 (0.0%) |
| Public Administration | 35 (58.3%) | 25 (41.7%) |
| Total | 179 (45.4%) | 215 (54.6%) |
Education in El Paraiso
School Enrollment in El Paraiso
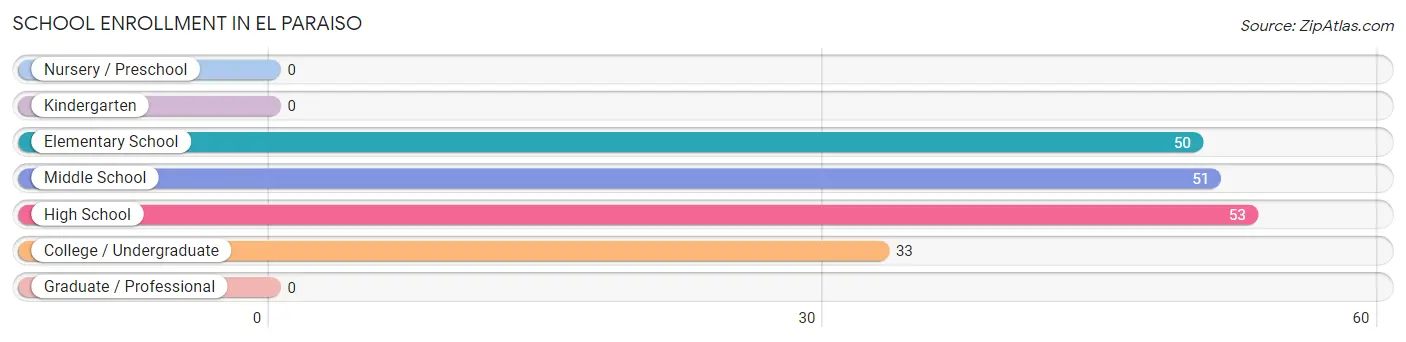
The most common levels of schooling among the 187 students in El Paraiso are high school (53 | 28.3%), middle school (51 | 27.3%), and elementary school (50 | 26.7%).
| School Level | # Students | % Students |
| Nursery / Preschool | 0 | 0.0% |
| Kindergarten | 0 | 0.0% |
| Elementary School | 50 | 26.7% |
| Middle School | 51 | 27.3% |
| High School | 53 | 28.3% |
| College / Undergraduate | 33 | 17.6% |
| Graduate / Professional | 0 | 0.0% |
| Total | 187 | 100.0% |
School Enrollment by Age by Funding Source in El Paraiso
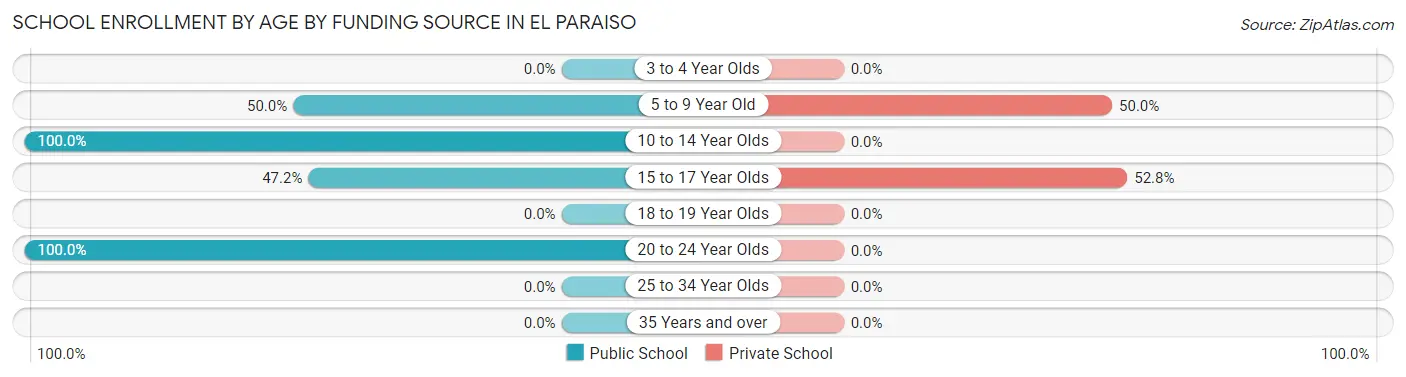
Out of a total of 187 students who are enrolled in schools in El Paraiso, 53 (28.3%) attend a private institution, while the remaining 134 (71.7%) are enrolled in public schools. The age group of 15 to 17 year olds has the highest likelihood of being enrolled in private schools, with 28 (52.8% in the age bracket) enrolled. Conversely, the age group of 10 to 14 year olds has the lowest likelihood of being enrolled in a private school, with 51 (100.0% in the age bracket) attending a public institution.
| Age Bracket | Public School | Private School |
| 3 to 4 Year Olds | 0 (0.0%) | 0 (0.0%) |
| 5 to 9 Year Old | 25 (50.0%) | 25 (50.0%) |
| 10 to 14 Year Olds | 51 (100.0%) | 0 (0.0%) |
| 15 to 17 Year Olds | 25 (47.2%) | 28 (52.8%) |
| 18 to 19 Year Olds | 0 (0.0%) | 0 (0.0%) |
| 20 to 24 Year Olds | 33 (100.0%) | 0 (0.0%) |
| 25 to 34 Year Olds | 0 (0.0%) | 0 (0.0%) |
| 35 Years and over | 0 (0.0%) | 0 (0.0%) |
| Total | 134 (71.7%) | 53 (28.3%) |
Educational Attainment by Field of Study in El Paraiso
Business (57 | 50.9%), psychology (29 | 25.9%), physical & health sciences (20 | 17.9%), and education (6 | 5.4%) are the most common fields of study among 112 individuals in El Paraiso who have obtained a bachelor's degree or higher.
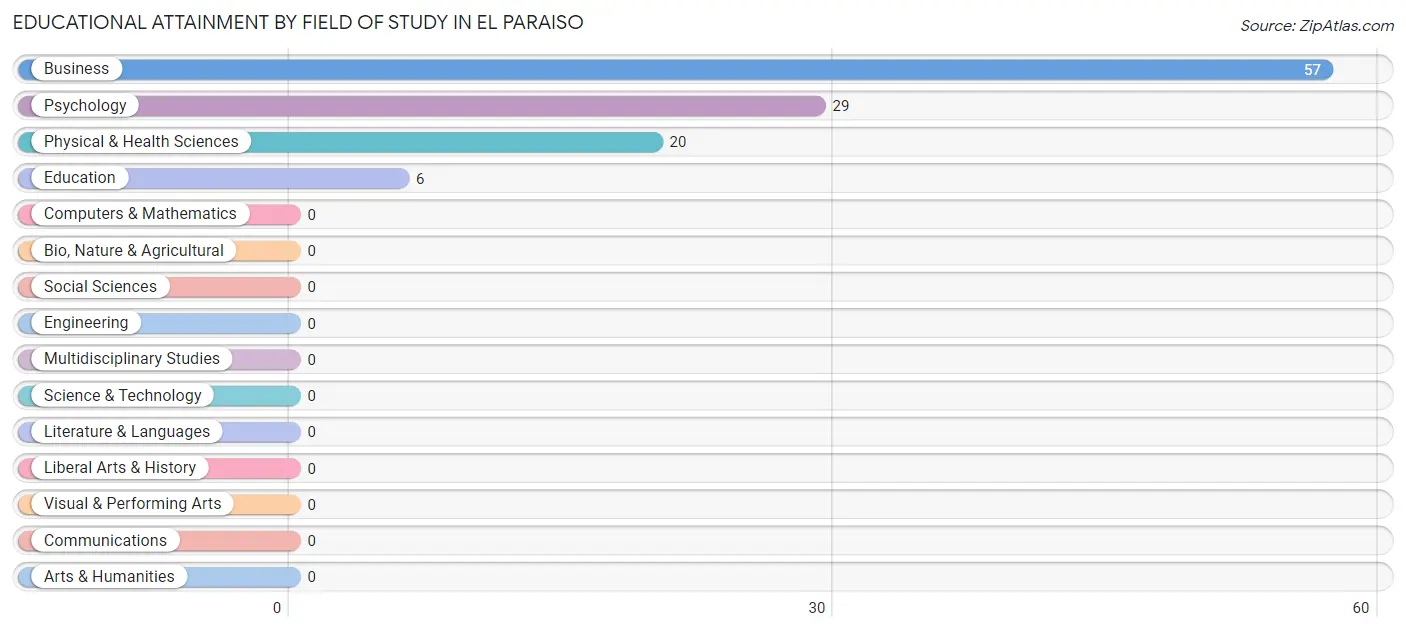
| Field of Study | # Graduates | % Graduates |
| Computers & Mathematics | 0 | 0.0% |
| Bio, Nature & Agricultural | 0 | 0.0% |
| Physical & Health Sciences | 20 | 17.9% |
| Psychology | 29 | 25.9% |
| Social Sciences | 0 | 0.0% |
| Engineering | 0 | 0.0% |
| Multidisciplinary Studies | 0 | 0.0% |
| Science & Technology | 0 | 0.0% |
| Business | 57 | 50.9% |
| Education | 6 | 5.4% |
| Literature & Languages | 0 | 0.0% |
| Liberal Arts & History | 0 | 0.0% |
| Visual & Performing Arts | 0 | 0.0% |
| Communications | 0 | 0.0% |
| Arts & Humanities | 0 | 0.0% |
| Total | 112 | 100.0% |
Transportation & Commute in El Paraiso
Vehicle Availability by Sex in El Paraiso
The most prevalent vehicle ownership categories in El Paraiso are males with 2 vehicles (58, accounting for 40.3%) and females with 2 vehicles (57, making up 27.0%).
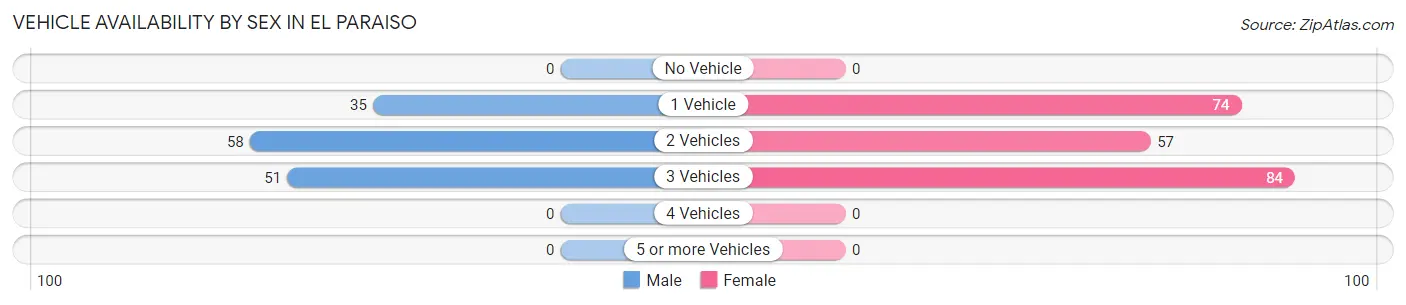
| Vehicles Available | Male | Female |
| No Vehicle | 0 (0.0%) | 0 (0.0%) |
| 1 Vehicle | 35 (24.3%) | 74 (34.4%) |
| 2 Vehicles | 58 (40.3%) | 57 (26.5%) |
| 3 Vehicles | 51 (35.4%) | 84 (39.1%) |
| 4 Vehicles | 0 (0.0%) | 0 (0.0%) |
| 5 or more Vehicles | 0 (0.0%) | 0 (0.0%) |
| Total | 144 (100.0%) | 215 (100.0%) |
Commute Time in El Paraiso
The most frequently occuring commute durations in El Paraiso are 20 to 24 minutes (134 commuters, 37.3%), 25 to 29 minutes (110 commuters, 30.6%), and 60 to 89 minutes (66 commuters, 18.4%).
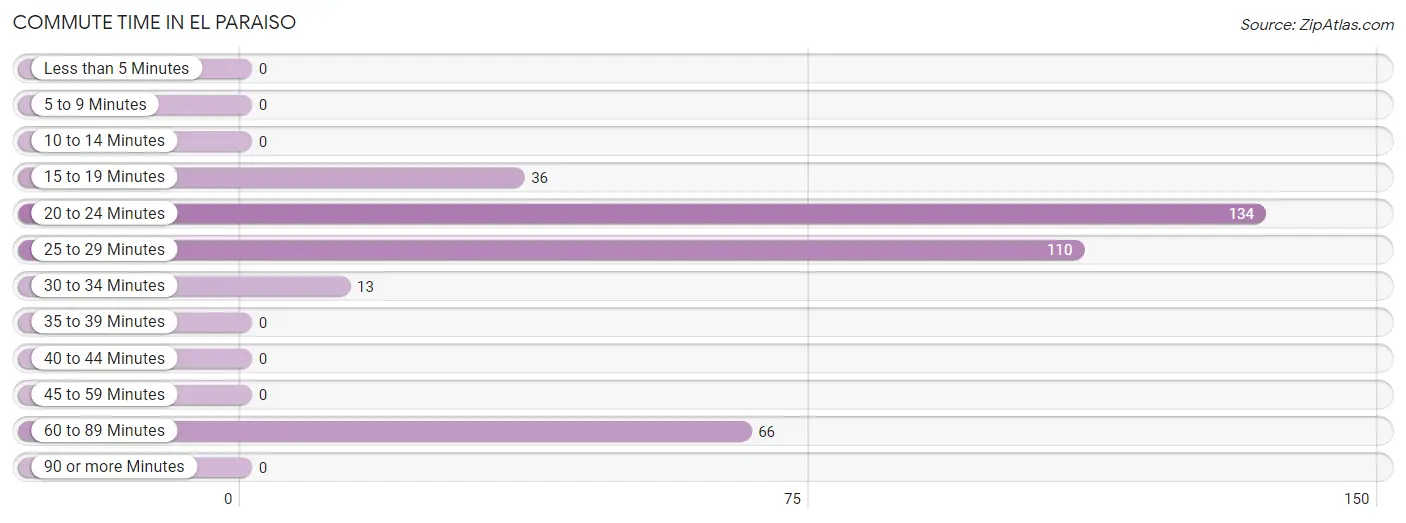
| Commute Time | # Commuters | % Commuters |
| Less than 5 Minutes | 0 | 0.0% |
| 5 to 9 Minutes | 0 | 0.0% |
| 10 to 14 Minutes | 0 | 0.0% |
| 15 to 19 Minutes | 36 | 10.0% |
| 20 to 24 Minutes | 134 | 37.3% |
| 25 to 29 Minutes | 110 | 30.6% |
| 30 to 34 Minutes | 13 | 3.6% |
| 35 to 39 Minutes | 0 | 0.0% |
| 40 to 44 Minutes | 0 | 0.0% |
| 45 to 59 Minutes | 0 | 0.0% |
| 60 to 89 Minutes | 66 | 18.4% |
| 90 or more Minutes | 0 | 0.0% |
Commute Time by Sex in El Paraiso
The most common commute times in El Paraiso are 20 to 24 minutes (50 commuters, 34.7%) for males and 20 to 24 minutes (84 commuters, 39.1%) for females.
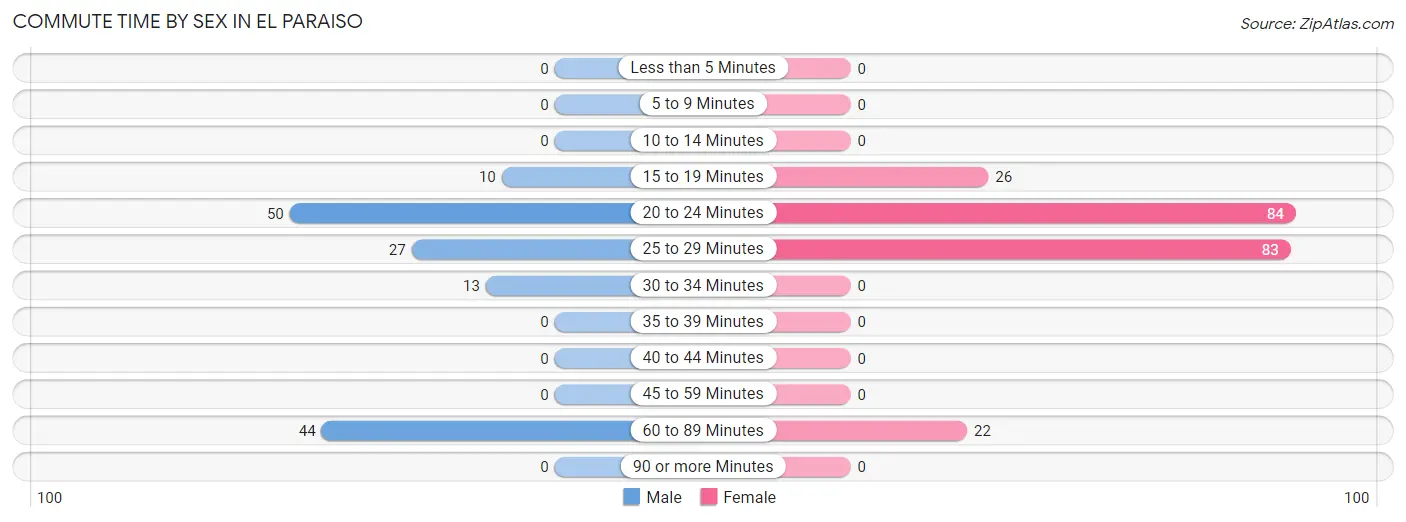
| Commute Time | Male | Female |
| Less than 5 Minutes | 0 (0.0%) | 0 (0.0%) |
| 5 to 9 Minutes | 0 (0.0%) | 0 (0.0%) |
| 10 to 14 Minutes | 0 (0.0%) | 0 (0.0%) |
| 15 to 19 Minutes | 10 (6.9%) | 26 (12.1%) |
| 20 to 24 Minutes | 50 (34.7%) | 84 (39.1%) |
| 25 to 29 Minutes | 27 (18.8%) | 83 (38.6%) |
| 30 to 34 Minutes | 13 (9.0%) | 0 (0.0%) |
| 35 to 39 Minutes | 0 (0.0%) | 0 (0.0%) |
| 40 to 44 Minutes | 0 (0.0%) | 0 (0.0%) |
| 45 to 59 Minutes | 0 (0.0%) | 0 (0.0%) |
| 60 to 89 Minutes | 44 (30.6%) | 22 (10.2%) |
| 90 or more Minutes | 0 (0.0%) | 0 (0.0%) |
Time of Departure to Work by Sex in El Paraiso
The most frequent times of departure to work in El Paraiso are 7:00 AM to 7:29 AM (71, 49.3%) for males and 4:00 PM to 11:59 PM (51, 23.7%) for females.
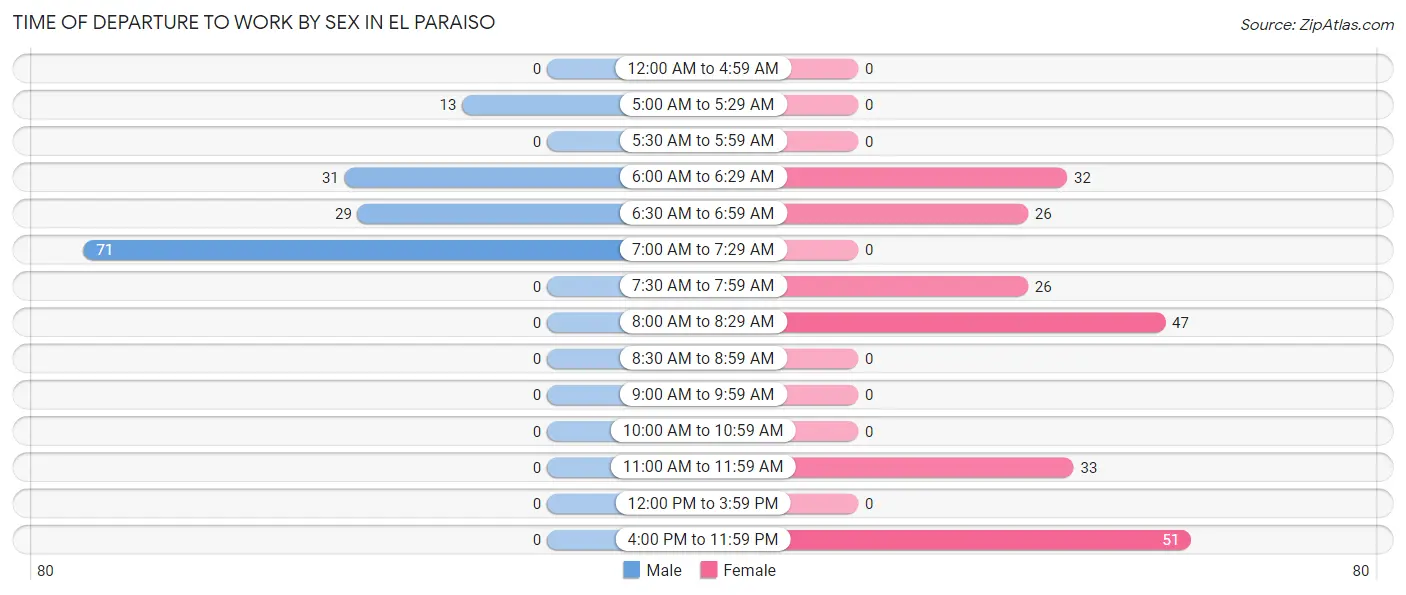
| Time of Departure | Male | Female |
| 12:00 AM to 4:59 AM | 0 (0.0%) | 0 (0.0%) |
| 5:00 AM to 5:29 AM | 13 (9.0%) | 0 (0.0%) |
| 5:30 AM to 5:59 AM | 0 (0.0%) | 0 (0.0%) |
| 6:00 AM to 6:29 AM | 31 (21.5%) | 32 (14.9%) |
| 6:30 AM to 6:59 AM | 29 (20.1%) | 26 (12.1%) |
| 7:00 AM to 7:29 AM | 71 (49.3%) | 0 (0.0%) |
| 7:30 AM to 7:59 AM | 0 (0.0%) | 26 (12.1%) |
| 8:00 AM to 8:29 AM | 0 (0.0%) | 47 (21.9%) |
| 8:30 AM to 8:59 AM | 0 (0.0%) | 0 (0.0%) |
| 9:00 AM to 9:59 AM | 0 (0.0%) | 0 (0.0%) |
| 10:00 AM to 10:59 AM | 0 (0.0%) | 0 (0.0%) |
| 11:00 AM to 11:59 AM | 0 (0.0%) | 33 (15.3%) |
| 12:00 PM to 3:59 PM | 0 (0.0%) | 0 (0.0%) |
| 4:00 PM to 11:59 PM | 0 (0.0%) | 51 (23.7%) |
| Total | 144 (100.0%) | 215 (100.0%) |
Housing Occupancy in El Paraiso
Occupancy by Ownership in El Paraiso
Of the total 466 dwellings in El Paraiso, owner-occupied units account for 366 (78.5%), while renter-occupied units make up 100 (21.5%).
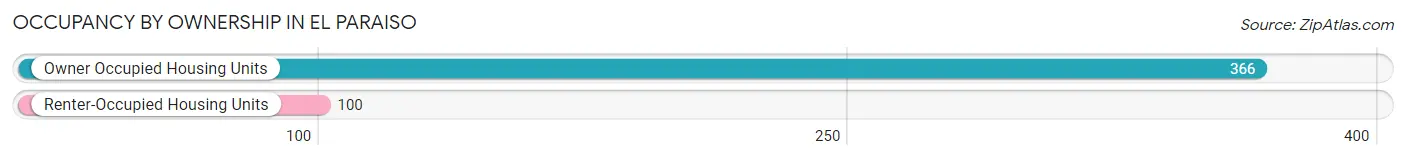
| Occupancy | # Housing Units | % Housing Units |
| Owner Occupied Housing Units | 366 | 78.5% |
| Renter-Occupied Housing Units | 100 | 21.5% |
| Total Occupied Housing Units | 466 | 100.0% |
Occupancy by Household Size in El Paraiso
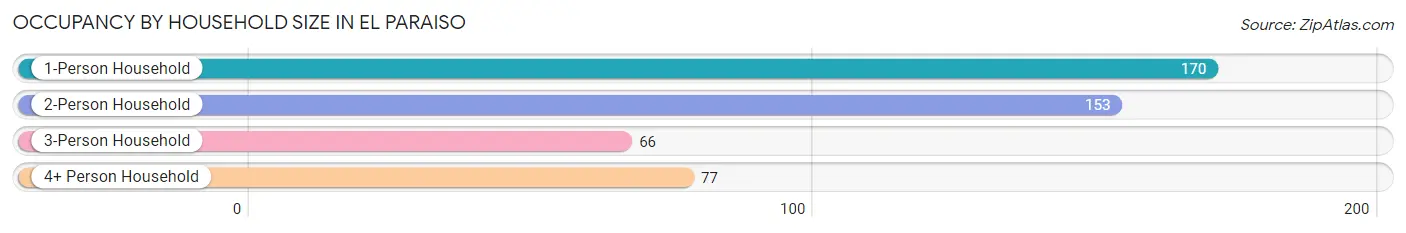
| Household Size | # Housing Units | % Housing Units |
| 1-Person Household | 170 | 36.5% |
| 2-Person Household | 153 | 32.8% |
| 3-Person Household | 66 | 14.2% |
| 4+ Person Household | 77 | 16.5% |
| Total Housing Units | 466 | 100.0% |
Occupancy by Ownership by Household Size in El Paraiso
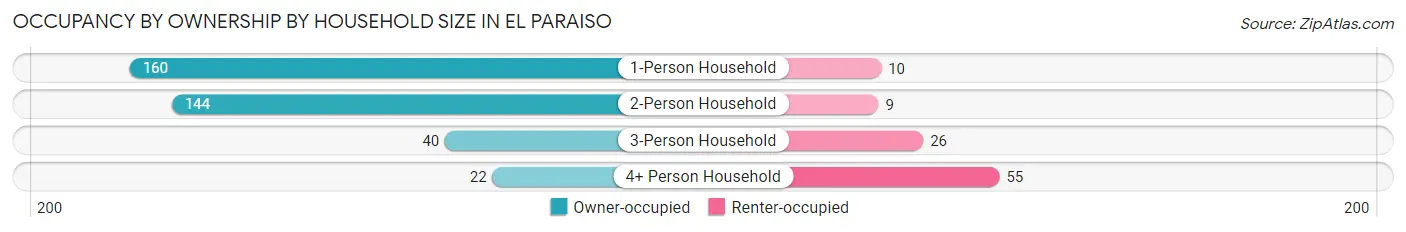
| Household Size | Owner-occupied | Renter-occupied |
| 1-Person Household | 160 (94.1%) | 10 (5.9%) |
| 2-Person Household | 144 (94.1%) | 9 (5.9%) |
| 3-Person Household | 40 (60.6%) | 26 (39.4%) |
| 4+ Person Household | 22 (28.6%) | 55 (71.4%) |
| Total Housing Units | 366 (78.5%) | 100 (21.5%) |
Occupancy by Educational Attainment in El Paraiso
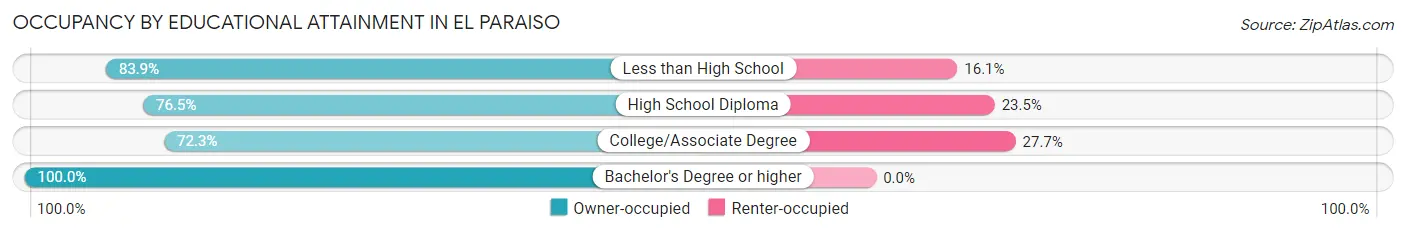
| Household Size | Owner-occupied | Renter-occupied |
| Less than High School | 99 (83.9%) | 19 (16.1%) |
| High School Diploma | 179 (76.5%) | 55 (23.5%) |
| College/Associate Degree | 68 (72.3%) | 26 (27.7%) |
| Bachelor's Degree or higher | 20 (100.0%) | 0 (0.0%) |
Occupancy by Age of Householder in El Paraiso
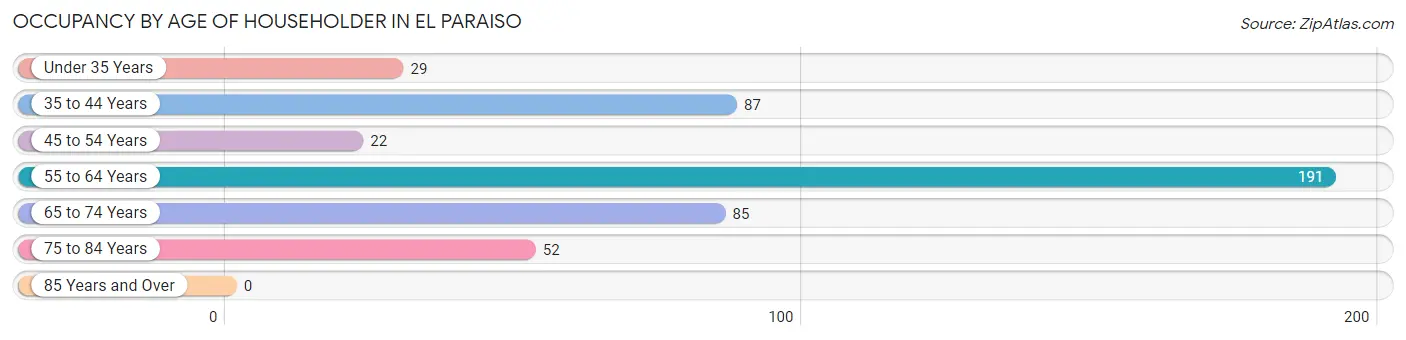
| Age Bracket | # Households | % Households |
| Under 35 Years | 29 | 6.2% |
| 35 to 44 Years | 87 | 18.7% |
| 45 to 54 Years | 22 | 4.7% |
| 55 to 64 Years | 191 | 41.0% |
| 65 to 74 Years | 85 | 18.2% |
| 75 to 84 Years | 52 | 11.2% |
| 85 Years and Over | 0 | 0.0% |
| Total | 466 | 100.0% |
Housing Finances in El Paraiso
Median Income by Occupancy in El Paraiso
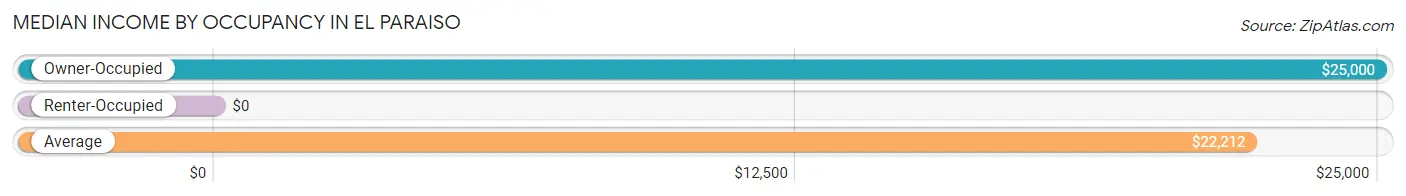
| Occupancy Type | # Households | Median Income |
| Owner-Occupied | 366 (78.5%) | $25,000 |
| Renter-Occupied | 100 (21.5%) | $0 |
| Average | 466 (100.0%) | $22,212 |
Occupancy by Householder Income Bracket in El Paraiso
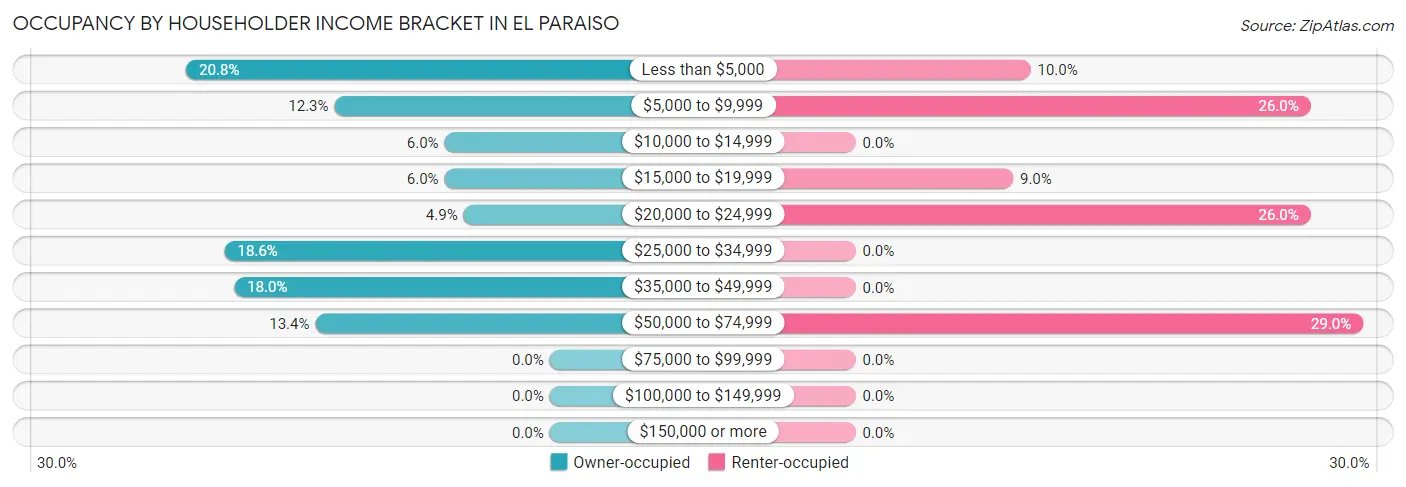
| Income Bracket | Owner-occupied | Renter-occupied |
| Less than $5,000 | 76 (20.8%) | 10 (10.0%) |
| $5,000 to $9,999 | 45 (12.3%) | 26 (26.0%) |
| $10,000 to $14,999 | 22 (6.0%) | 0 (0.0%) |
| $15,000 to $19,999 | 22 (6.0%) | 9 (9.0%) |
| $20,000 to $24,999 | 18 (4.9%) | 26 (26.0%) |
| $25,000 to $34,999 | 68 (18.6%) | 0 (0.0%) |
| $35,000 to $49,999 | 66 (18.0%) | 0 (0.0%) |
| $50,000 to $74,999 | 49 (13.4%) | 29 (29.0%) |
| $75,000 to $99,999 | 0 (0.0%) | 0 (0.0%) |
| $100,000 to $149,999 | 0 (0.0%) | 0 (0.0%) |
| $150,000 or more | 0 (0.0%) | 0 (0.0%) |
| Total | 366 (100.0%) | 100 (100.0%) |
Monthly Housing Cost Tiers in El Paraiso
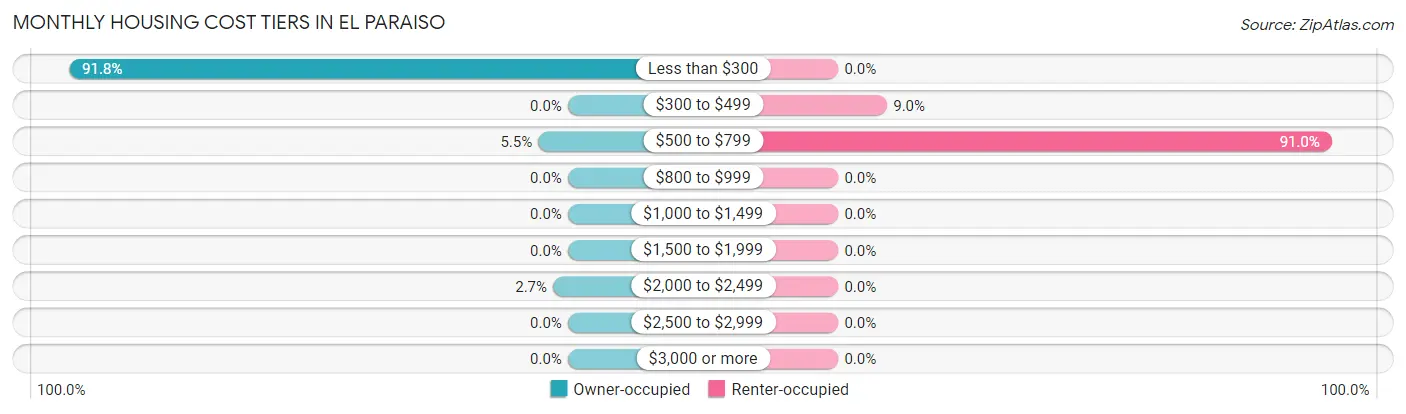
| Monthly Cost | Owner-occupied | Renter-occupied |
| Less than $300 | 336 (91.8%) | 0 (0.0%) |
| $300 to $499 | 0 (0.0%) | 9 (9.0%) |
| $500 to $799 | 20 (5.5%) | 91 (91.0%) |
| $800 to $999 | 0 (0.0%) | 0 (0.0%) |
| $1,000 to $1,499 | 0 (0.0%) | 0 (0.0%) |
| $1,500 to $1,999 | 0 (0.0%) | 0 (0.0%) |
| $2,000 to $2,499 | 10 (2.7%) | 0 (0.0%) |
| $2,500 to $2,999 | 0 (0.0%) | 0 (0.0%) |
| $3,000 or more | 0 (0.0%) | 0 (0.0%) |
| Total | 366 (100.0%) | 100 (100.0%) |
Physical Housing Characteristics in El Paraiso
Housing Structures in El Paraiso
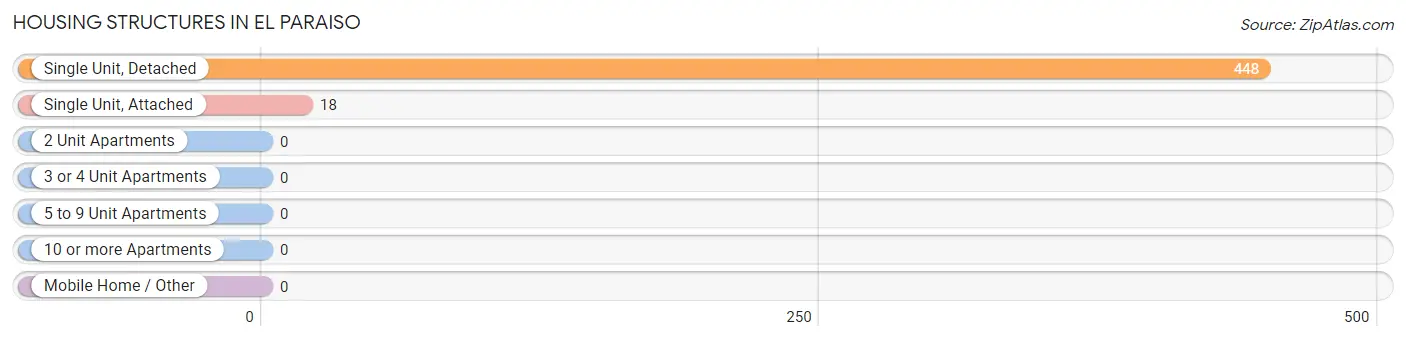
| Structure Type | # Housing Units | % Housing Units |
| Single Unit, Detached | 448 | 96.1% |
| Single Unit, Attached | 18 | 3.9% |
| 2 Unit Apartments | 0 | 0.0% |
| 3 or 4 Unit Apartments | 0 | 0.0% |
| 5 to 9 Unit Apartments | 0 | 0.0% |
| 10 or more Apartments | 0 | 0.0% |
| Mobile Home / Other | 0 | 0.0% |
| Total | 466 | 100.0% |
Housing Structures by Occupancy in El Paraiso
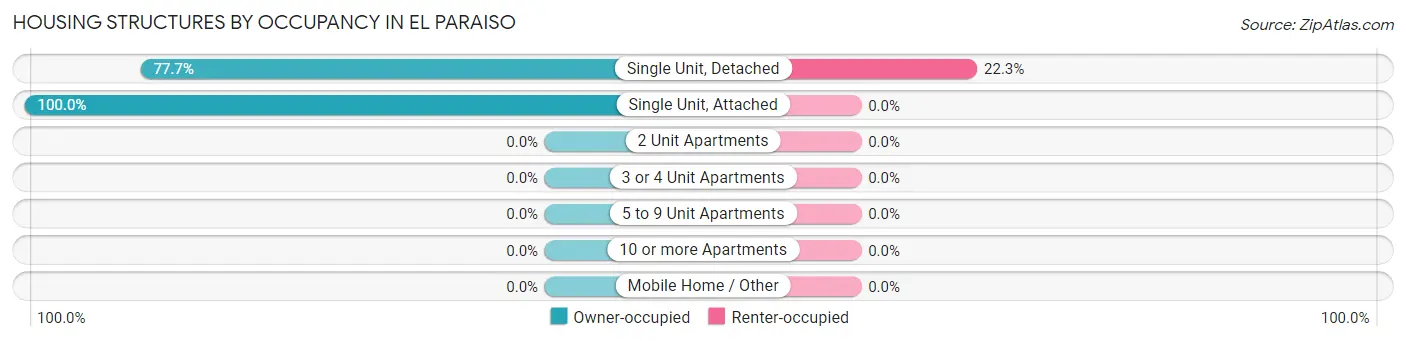
| Structure Type | Owner-occupied | Renter-occupied |
| Single Unit, Detached | 348 (77.7%) | 100 (22.3%) |
| Single Unit, Attached | 18 (100.0%) | 0 (0.0%) |
| 2 Unit Apartments | 0 (0.0%) | 0 (0.0%) |
| 3 or 4 Unit Apartments | 0 (0.0%) | 0 (0.0%) |
| 5 to 9 Unit Apartments | 0 (0.0%) | 0 (0.0%) |
| 10 or more Apartments | 0 (0.0%) | 0 (0.0%) |
| Mobile Home / Other | 0 (0.0%) | 0 (0.0%) |
| Total | 366 (78.5%) | 100 (21.5%) |
Housing Structures by Number of Rooms in El Paraiso
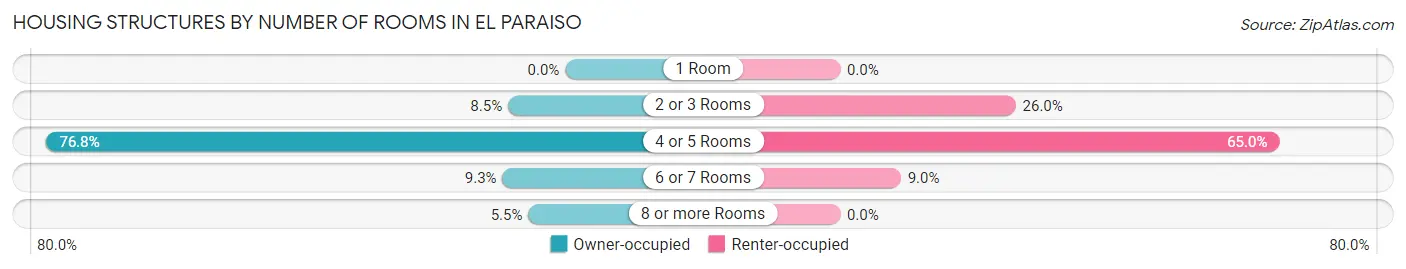
| Number of Rooms | Owner-occupied | Renter-occupied |
| 1 Room | 0 (0.0%) | 0 (0.0%) |
| 2 or 3 Rooms | 31 (8.5%) | 26 (26.0%) |
| 4 or 5 Rooms | 281 (76.8%) | 65 (65.0%) |
| 6 or 7 Rooms | 34 (9.3%) | 9 (9.0%) |
| 8 or more Rooms | 20 (5.5%) | 0 (0.0%) |
| Total | 366 (100.0%) | 100 (100.0%) |
Housing Structure by Heating Type in El Paraiso
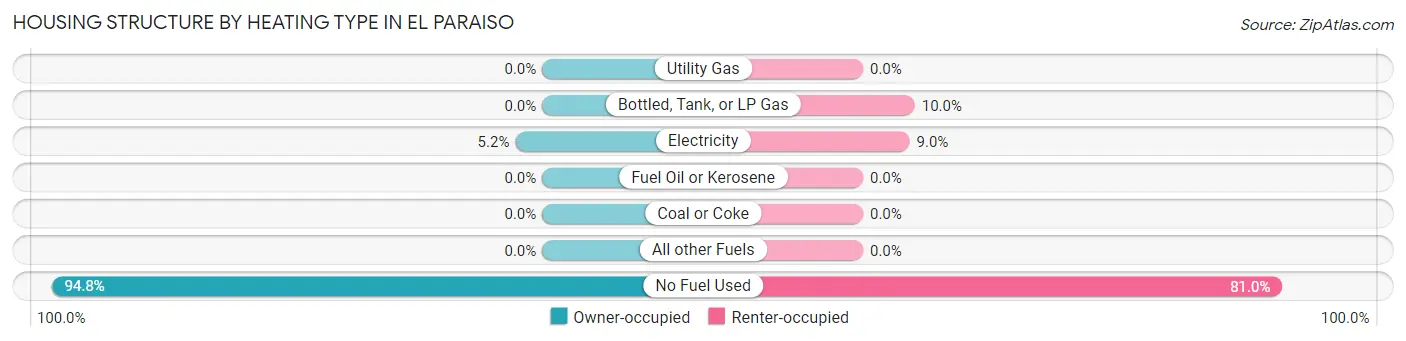
| Heating Type | Owner-occupied | Renter-occupied |
| Utility Gas | 0 (0.0%) | 0 (0.0%) |
| Bottled, Tank, or LP Gas | 0 (0.0%) | 10 (10.0%) |
| Electricity | 19 (5.2%) | 9 (9.0%) |
| Fuel Oil or Kerosene | 0 (0.0%) | 0 (0.0%) |
| Coal or Coke | 0 (0.0%) | 0 (0.0%) |
| All other Fuels | 0 (0.0%) | 0 (0.0%) |
| No Fuel Used | 347 (94.8%) | 81 (81.0%) |
| Total | 366 (100.0%) | 100 (100.0%) |
Household Vehicle Usage in El Paraiso
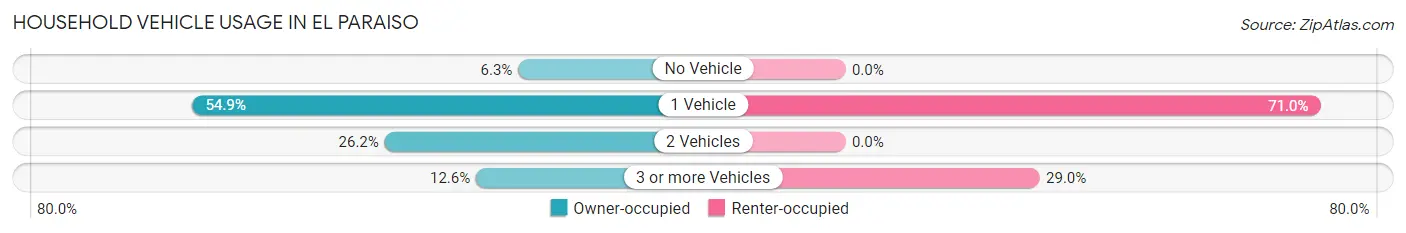
| Vehicles per Household | Owner-occupied | Renter-occupied |
| No Vehicle | 23 (6.3%) | 0 (0.0%) |
| 1 Vehicle | 201 (54.9%) | 71 (71.0%) |
| 2 Vehicles | 96 (26.2%) | 0 (0.0%) |
| 3 or more Vehicles | 46 (12.6%) | 29 (29.0%) |
| Total | 366 (100.0%) | 100 (100.0%) |
Real Estate & Mortgages in El Paraiso
Real Estate and Mortgage Overview in El Paraiso
| Characteristic | Without Mortgage | With Mortgage |
| Housing Units | 336 | 30 |
| Median Property Value | $91,800 | $0 |
| Median Household Income | $24,306 | $0 |
| Monthly Housing Costs | $180 | $0 |
| Real Estate Taxes | - | - |
Property Value by Mortgage Status in El Paraiso
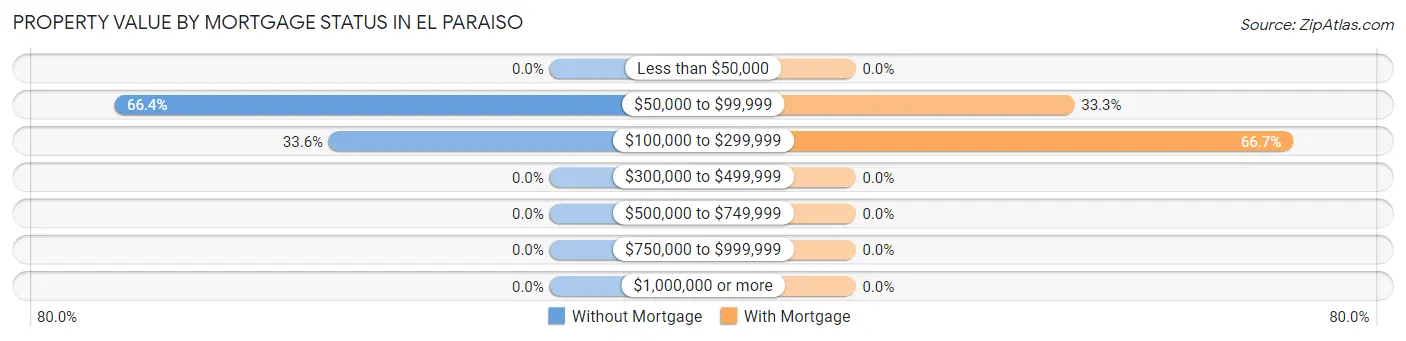
| Property Value | Without Mortgage | With Mortgage |
| Less than $50,000 | 0 (0.0%) | 0 (0.0%) |
| $50,000 to $99,999 | 223 (66.4%) | 10 (33.3%) |
| $100,000 to $299,999 | 113 (33.6%) | 20 (66.7%) |
| $300,000 to $499,999 | 0 (0.0%) | 0 (0.0%) |
| $500,000 to $749,999 | 0 (0.0%) | 0 (0.0%) |
| $750,000 to $999,999 | 0 (0.0%) | 0 (0.0%) |
| $1,000,000 or more | 0 (0.0%) | 0 (0.0%) |
| Total | 336 (100.0%) | 30 (100.0%) |
Household Income by Mortgage Status in El Paraiso
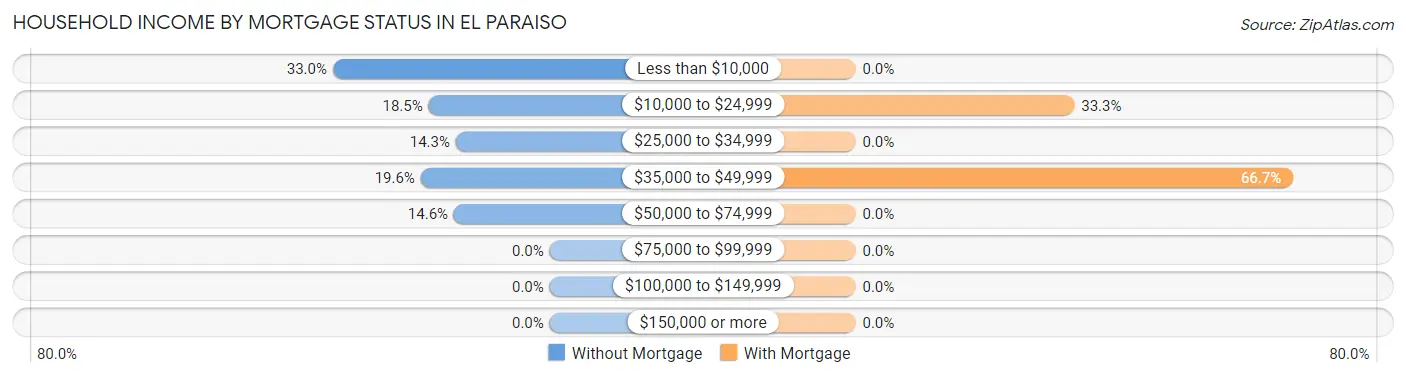
| Household Income | Without Mortgage | With Mortgage |
| Less than $10,000 | 111 (33.0%) | 0 (0.0%) |
| $10,000 to $24,999 | 62 (18.4%) | 10 (33.3%) |
| $25,000 to $34,999 | 48 (14.3%) | 0 (0.0%) |
| $35,000 to $49,999 | 66 (19.6%) | 20 (66.7%) |
| $50,000 to $74,999 | 49 (14.6%) | 0 (0.0%) |
| $75,000 to $99,999 | 0 (0.0%) | 0 (0.0%) |
| $100,000 to $149,999 | 0 (0.0%) | 0 (0.0%) |
| $150,000 or more | 0 (0.0%) | 0 (0.0%) |
| Total | 336 (100.0%) | 30 (100.0%) |
Property Value to Household Income Ratio in El Paraiso
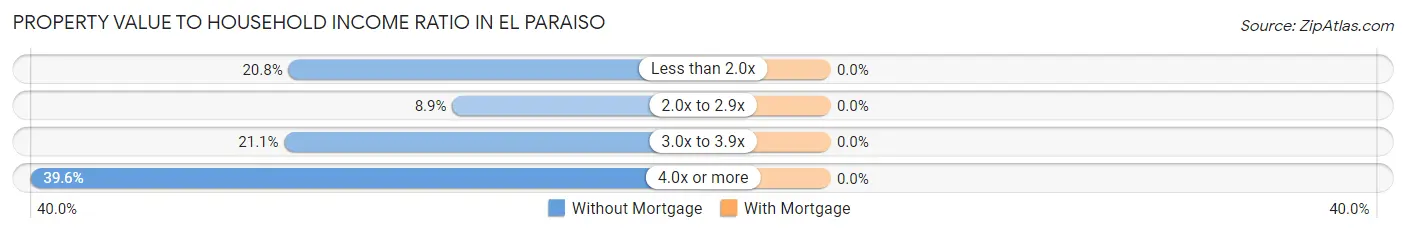
| Value-to-Income Ratio | Without Mortgage | With Mortgage |
| Less than 2.0x | 70 (20.8%) | 0 (0.0%) |
| 2.0x to 2.9x | 30 (8.9%) | 0 (0.0%) |
| 3.0x to 3.9x | 71 (21.1%) | 0 (0.0%) |
| 4.0x or more | 133 (39.6%) | 0 (0.0%) |
| Total | 336 (100.0%) | 30 (100.0%) |
Real Estate Taxes by Mortgage Status in El Paraiso
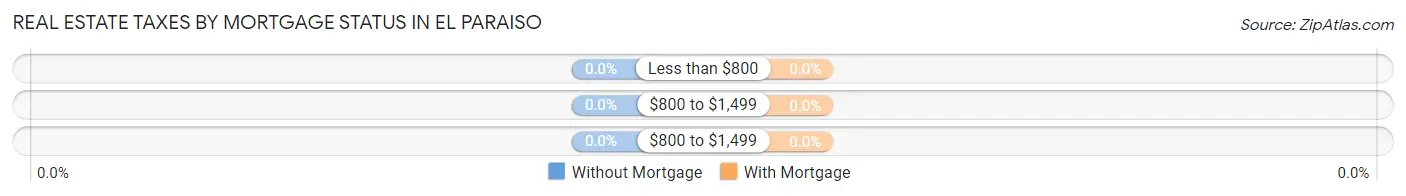
| Property Taxes | Without Mortgage | With Mortgage |
| Less than $800 | 0 (0.0%) | 0 (0.0%) |
| $800 to $1,499 | 0 (0.0%) | 0 (0.0%) |
| $800 to $1,499 | 0 (0.0%) | 0 (0.0%) |
| Total | 336 (100.0%) | 30 (100.0%) |
Health & Disability in El Paraiso
Health Insurance Coverage by Age in El Paraiso
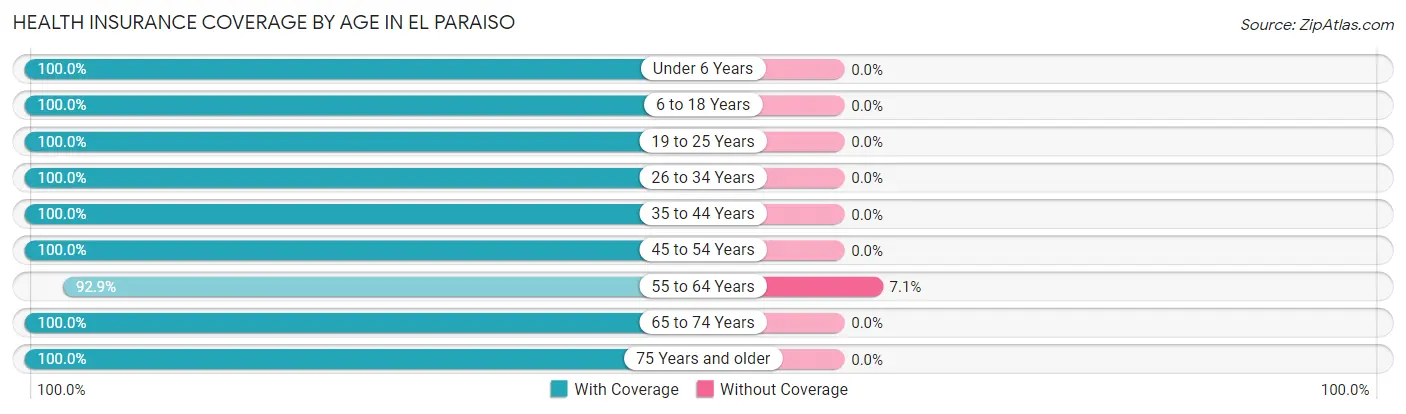
| Age Bracket | With Coverage | Without Coverage |
| Under 6 Years | 114 (100.0%) | 0 (0.0%) |
| 6 to 18 Years | 154 (100.0%) | 0 (0.0%) |
| 19 to 25 Years | 33 (100.0%) | 0 (0.0%) |
| 26 to 34 Years | 126 (100.0%) | 0 (0.0%) |
| 35 to 44 Years | 112 (100.0%) | 0 (0.0%) |
| 45 to 54 Years | 81 (100.0%) | 0 (0.0%) |
| 55 to 64 Years | 273 (92.9%) | 21 (7.1%) |
| 65 to 74 Years | 124 (100.0%) | 0 (0.0%) |
| 75 Years and older | 62 (100.0%) | 0 (0.0%) |
| Total | 1,079 (98.1%) | 21 (1.9%) |
Health Insurance Coverage by Citizenship Status in El Paraiso
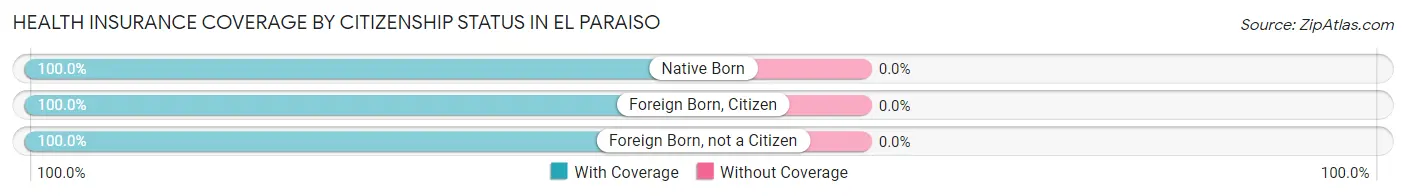
| Citizenship Status | With Coverage | Without Coverage |
| Native Born | 114 (100.0%) | 0 (0.0%) |
| Foreign Born, Citizen | 154 (100.0%) | 0 (0.0%) |
| Foreign Born, not a Citizen | 33 (100.0%) | 0 (0.0%) |
Health Insurance Coverage by Household Income in El Paraiso
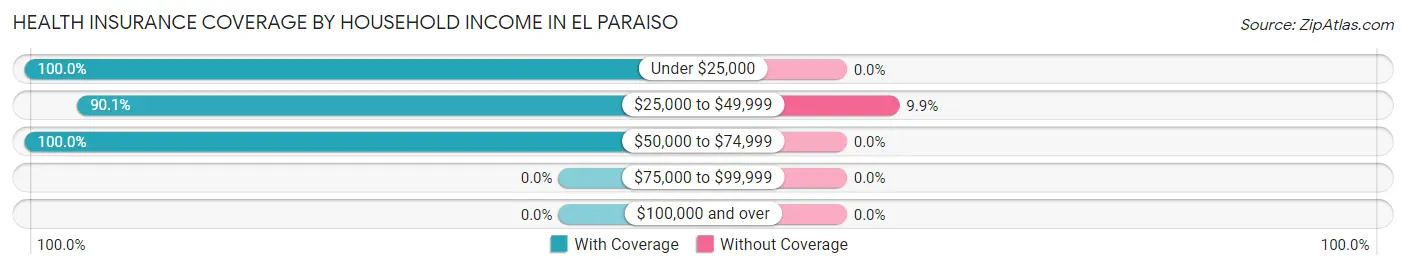
| Household Income | With Coverage | Without Coverage |
| Under $25,000 | 570 (100.0%) | 0 (0.0%) |
| $25,000 to $49,999 | 192 (90.1%) | 21 (9.9%) |
| $50,000 to $74,999 | 317 (100.0%) | 0 (0.0%) |
| $75,000 to $99,999 | 0 (0.0%) | 0 (0.0%) |
| $100,000 and over | 0 (0.0%) | 0 (0.0%) |
Public vs Private Health Insurance Coverage by Age in El Paraiso
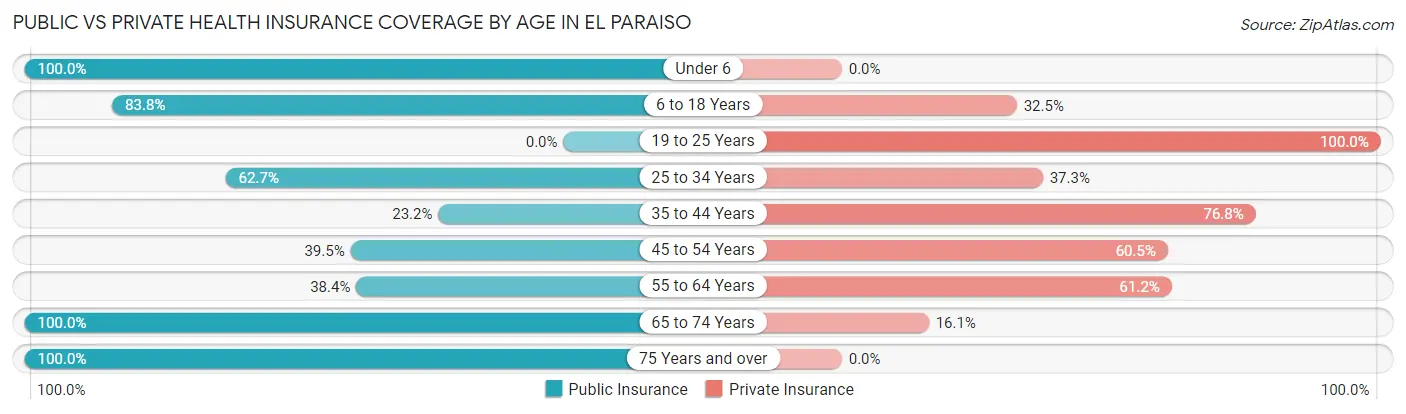
| Age Bracket | Public Insurance | Private Insurance |
| Under 6 | 114 (100.0%) | 0 (0.0%) |
| 6 to 18 Years | 129 (83.8%) | 50 (32.5%) |
| 19 to 25 Years | 0 (0.0%) | 33 (100.0%) |
| 25 to 34 Years | 79 (62.7%) | 47 (37.3%) |
| 35 to 44 Years | 26 (23.2%) | 86 (76.8%) |
| 45 to 54 Years | 32 (39.5%) | 49 (60.5%) |
| 55 to 64 Years | 113 (38.4%) | 180 (61.2%) |
| 65 to 74 Years | 124 (100.0%) | 20 (16.1%) |
| 75 Years and over | 62 (100.0%) | 0 (0.0%) |
| Total | 679 (61.7%) | 465 (42.3%) |
Disability Status by Sex by Age in El Paraiso
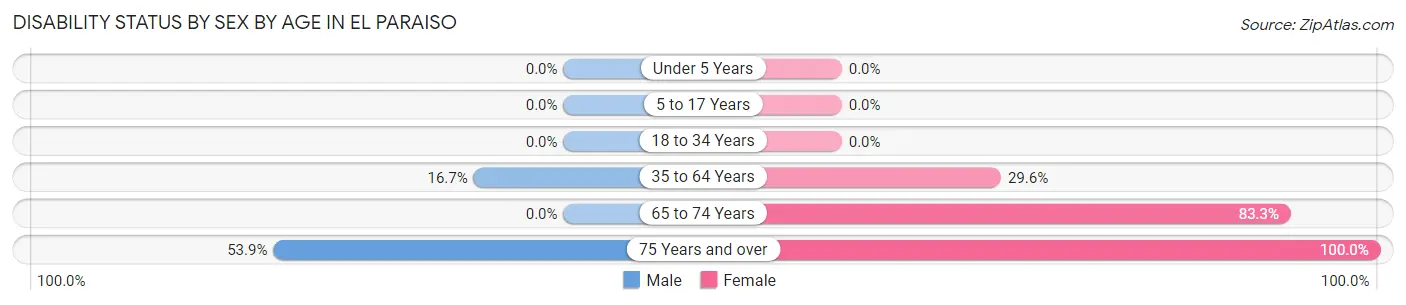
| Age Bracket | Male | Female |
| Under 5 Years | 0 (0.0%) | 0 (0.0%) |
| 5 to 17 Years | 0 (0.0%) | 0 (0.0%) |
| 18 to 34 Years | 0 (0.0%) | 0 (0.0%) |
| 35 to 64 Years | 40 (16.7%) | 73 (29.5%) |
| 65 to 74 Years | 0 (0.0%) | 50 (83.3%) |
| 75 Years and over | 21 (53.8%) | 23 (100.0%) |
Disability Class by Sex by Age in El Paraiso
Disability Class: Hearing Difficulty
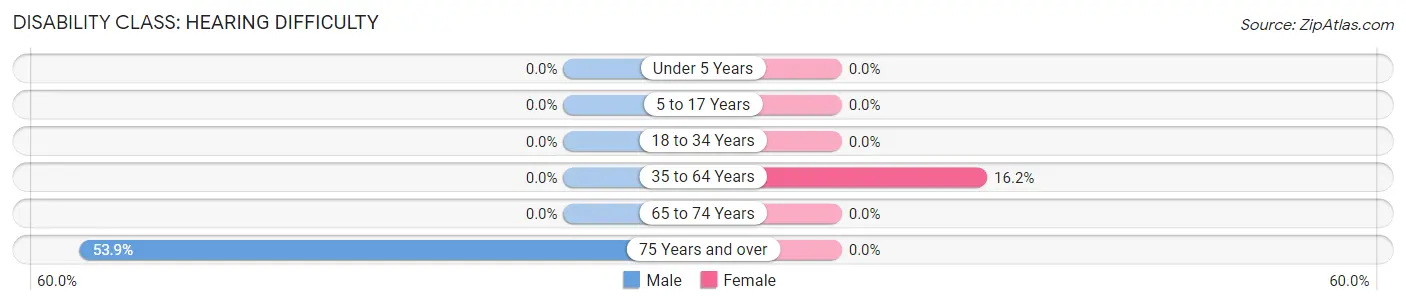
| Age Bracket | Male | Female |
| Under 5 Years | 0 (0.0%) | 0 (0.0%) |
| 5 to 17 Years | 0 (0.0%) | 0 (0.0%) |
| 18 to 34 Years | 0 (0.0%) | 0 (0.0%) |
| 35 to 64 Years | 0 (0.0%) | 40 (16.2%) |
| 65 to 74 Years | 0 (0.0%) | 0 (0.0%) |
| 75 Years and over | 21 (53.8%) | 0 (0.0%) |
Disability Class: Vision Difficulty
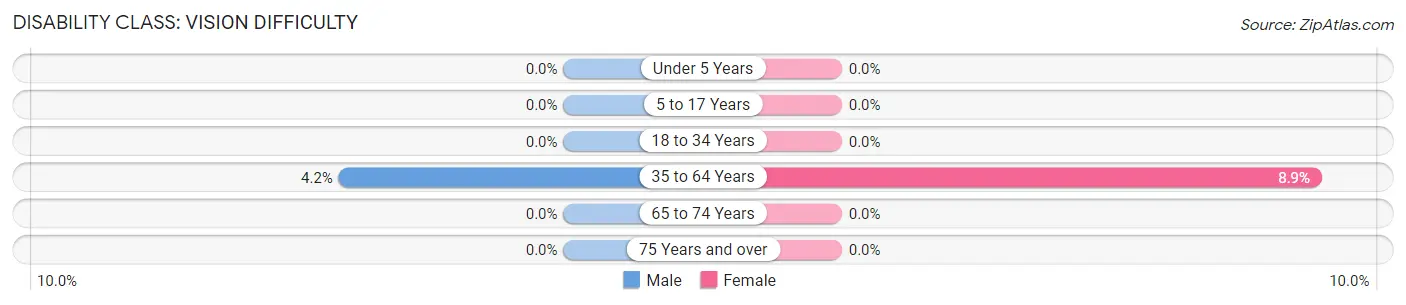
| Age Bracket | Male | Female |
| Under 5 Years | 0 (0.0%) | 0 (0.0%) |
| 5 to 17 Years | 0 (0.0%) | 0 (0.0%) |
| 18 to 34 Years | 0 (0.0%) | 0 (0.0%) |
| 35 to 64 Years | 10 (4.2%) | 22 (8.9%) |
| 65 to 74 Years | 0 (0.0%) | 0 (0.0%) |
| 75 Years and over | 0 (0.0%) | 0 (0.0%) |
Disability Class: Cognitive Difficulty
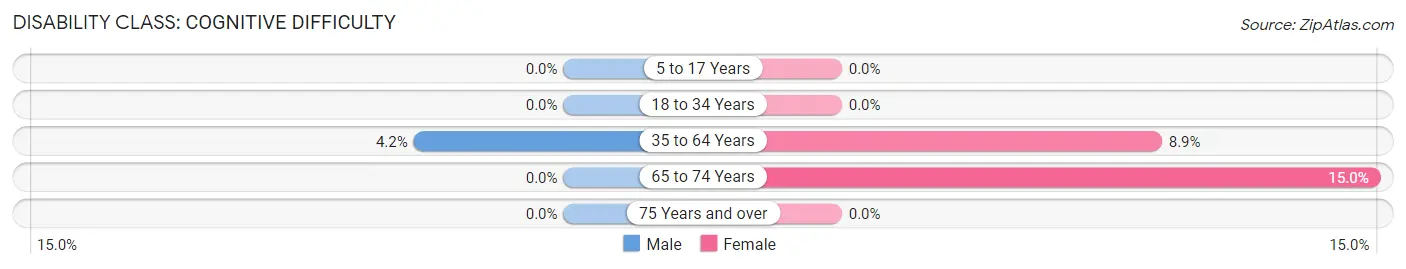
| Age Bracket | Male | Female |
| 5 to 17 Years | 0 (0.0%) | 0 (0.0%) |
| 18 to 34 Years | 0 (0.0%) | 0 (0.0%) |
| 35 to 64 Years | 10 (4.2%) | 22 (8.9%) |
| 65 to 74 Years | 0 (0.0%) | 9 (15.0%) |
| 75 Years and over | 0 (0.0%) | 0 (0.0%) |
Disability Class: Ambulatory Difficulty
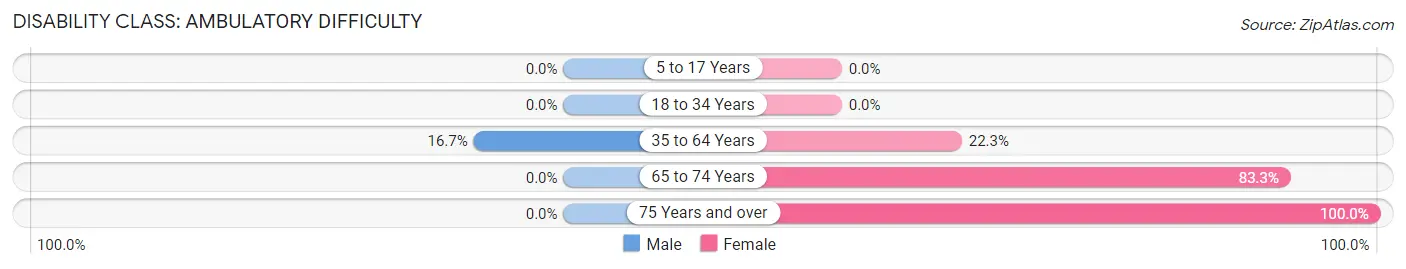
| Age Bracket | Male | Female |
| 5 to 17 Years | 0 (0.0%) | 0 (0.0%) |
| 18 to 34 Years | 0 (0.0%) | 0 (0.0%) |
| 35 to 64 Years | 40 (16.7%) | 55 (22.3%) |
| 65 to 74 Years | 0 (0.0%) | 50 (83.3%) |
| 75 Years and over | 0 (0.0%) | 23 (100.0%) |
Disability Class: Self-Care Difficulty
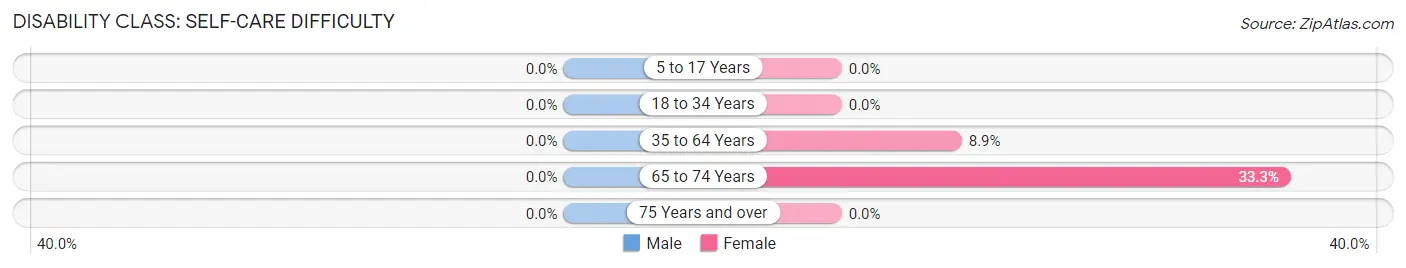
| Age Bracket | Male | Female |
| 5 to 17 Years | 0 (0.0%) | 0 (0.0%) |
| 18 to 34 Years | 0 (0.0%) | 0 (0.0%) |
| 35 to 64 Years | 0 (0.0%) | 22 (8.9%) |
| 65 to 74 Years | 0 (0.0%) | 20 (33.3%) |
| 75 Years and over | 0 (0.0%) | 0 (0.0%) |
Technology Access in El Paraiso
Computing Device Access in El Paraiso
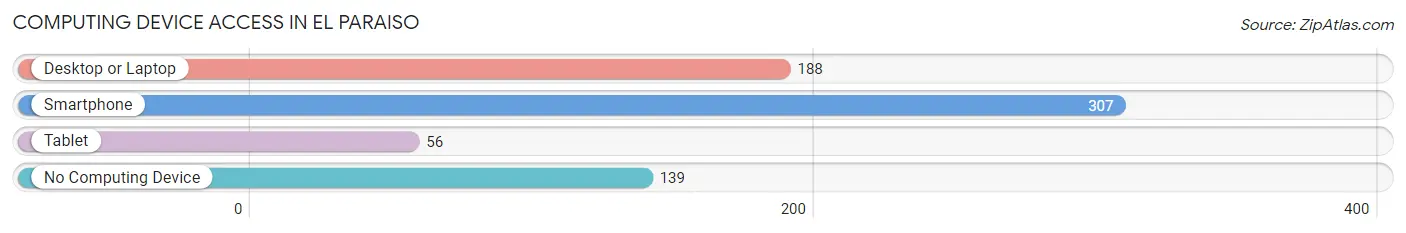
| Device Type | # Households | % Households |
| Desktop or Laptop | 188 | 40.3% |
| Smartphone | 307 | 65.9% |
| Tablet | 56 | 12.0% |
| No Computing Device | 139 | 29.8% |
| Total | 466 | 100.0% |
Internet Access in El Paraiso
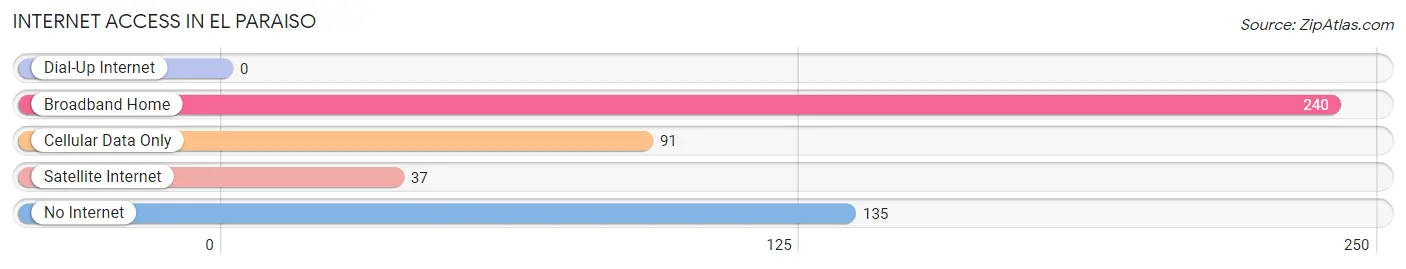
| Internet Type | # Households | % Households |
| Dial-Up Internet | 0 | 0.0% |
| Broadband Home | 240 | 51.5% |
| Cellular Data Only | 91 | 19.5% |
| Satellite Internet | 37 | 7.9% |
| No Internet | 135 | 29.0% |
| Total | 466 | 100.0% |
El Paraiso Summary
Paraíso is a municipality located in the northeast of Puerto Rico, in the region known as the Eastern Region. It is bordered by the municipalities of Río Grande, Naguabo, Humacao, and Las Piedras. The municipality of Paraíso is spread over 8 wards and Paraíso Pueblo (the downtown area and the administrative center of the municipality).
History
The area of Paraíso was originally inhabited by the Taíno Indians. The first Spanish settlers arrived in the area in the early 16th century. The area was originally known as “Paraíso de los Indios” (Paradise of the Indians). The name was later changed to “Paraíso de los Españoles” (Paradise of the Spaniards).
In 1815, the area was officially declared a municipality and was given the name “Paraíso”. The municipality was originally part of the municipality of Humacao, but was later separated and declared an independent municipality.
Geography
Paraíso is located in the northeast of Puerto Rico, in the region known as the Eastern Region. It is bordered by the municipalities of Río Grande, Naguabo, Humacao, and Las Piedras. The municipality of Paraíso is spread over 8 wards and Paraíso Pueblo (the downtown area and the administrative center of the municipality).
The municipality has a total area of 39.9 square miles (103.2 km2). The terrain is mostly flat with some hills. The highest point in the municipality is Cerro de la Cruz, which has an elevation of 1,067 feet (325 m).
The climate in Paraíso is tropical, with an average temperature of 79°F (26°C). The average annual rainfall is 64 inches (1,620 mm).
Economy
The economy of Paraíso is mainly based on agriculture and tourism. The main agricultural products are sugarcane, coffee, and bananas. The municipality is also home to several industrial parks, which are home to a variety of manufacturing and service companies.
Tourism is an important part of the economy of Paraíso. The municipality is home to several beaches, including Playa de Paraíso, Playa de los Cocos, and Playa de los Pescadores. The municipality also has several historical sites, such as the ruins of the old sugar mill, the old fort, and the old church.
Demographics
As of the 2010 census, the population of Paraíso was 24,845. The population is mostly of mixed European and African descent. The majority of the population (90.3%) is of Hispanic or Latino origin. The median household income is $17,845. The unemployment rate is 11.2%.
The majority of the population (90.3%) is Roman Catholic. Other religious denominations include Protestantism (4.2%), Jehovah’s Witnesses (1.2%), and other religions (4.3%).
Education
The municipality of Paraíso is served by the Puerto Rico Department of Education. There are several public schools in the municipality, including elementary schools, middle schools, and high schools. There are also several private schools in the municipality.
Conclusion
Paraíso is a municipality located in the northeast of Puerto Rico, in the region known as the Eastern Region. It is bordered by the municipalities of Río Grande, Naguabo, Humacao, and Las Piedras. The municipality of Paraíso is spread over 8 wards and Paraíso Pueblo (the downtown area and the administrative center of the municipality). The economy of Paraíso is mainly based on agriculture and tourism. The population of Paraíso is mostly of mixed European and African descent. The majority of the population (90.3%) is of Hispanic or Latino origin. The municipality is served by the Puerto Rico Department of Education. Paraíso is a municipality with a rich history, geography, economy, and demographics.
Common Questions
What is Per Capita Income in El Paraiso?
Per Capita income in El Paraiso is $11,156.
What is the Median Family Income in El Paraiso?
Median Family Income in El Paraiso is $22,356.
What is the Median Household income in El Paraiso?
Median Household Income in El Paraiso is $22,212.
What is Income or Wage Gap in El Paraiso?
Income or Wage Gap in El Paraiso is 22.5%.
Women in El Paraiso earn 77.5 cents for every dollar earned by a man.
What is Family Income Deficit in El Paraiso?
Family Income Deficit in El Paraiso is $14,083.
Families that are below poverty line in El Paraiso earn $14,083 less on average than the poverty threshold level.
What is Inequality or Gini Index in El Paraiso?
Inequality or Gini Index in El Paraiso is 0.44.
What is the Total Population of El Paraiso?
Total Population of El Paraiso is 1,115.
What is the Total Male Population of El Paraiso?
Total Male Population of El Paraiso is 504.
What is the Total Female Population of El Paraiso?
Total Female Population of El Paraiso is 611.
What is the Ratio of Males per 100 Females in El Paraiso?
There are 82.49 Males per 100 Females in El Paraiso.
What is the Ratio of Females per 100 Males in El Paraiso?
There are 121.23 Females per 100 Males in El Paraiso.
What is the Median Population Age in El Paraiso?
Median Population Age in El Paraiso is 47.8 Years.
What is the Average Family Size in El Paraiso
Average Family Size in El Paraiso is 3.2 People.
What is the Average Household Size in El Paraiso
Average Household Size in El Paraiso is 2.4 People.
How Large is the Labor Force in El Paraiso?
There are 450 People in the Labor Forcein in El Paraiso.
What is the Percentage of People in the Labor Force in El Paraiso?
51.6% of People are in the Labor Force in El Paraiso.
What is the Unemployment Rate in El Paraiso?
Unemployment Rate in El Paraiso is 12.4%.